Embed Size (px)
Citation preview
INTERNATIONAL ASSOCIATION OF DREDGING COMPANIES
International Journal on Public Works, Ports & Waterways Developments
Number 76 - September 1999

Terra et Aqua – Number 76 – September 1999
Terra et Aqua is published quarterly by the IADC, The International Association of Dredging Companies.The journal is available on request to individuals or organisations with a professional interest in thedevelopment of ports and waterways, and in particular, the associated dredging work.The name Terra et Aqua is a registered trademark.
EditorMarsha R. Cohen
Editorial Advisory CommitteeH.A.J. Fiers, ChairmanH. van Diepen H. De Vlieger R.W. FlinkerbuschK. de Groot R. Vidal Martin P.G. RolandP.J.A. Hamburger F.A. Minderhoud H. Cami
IADC Board of DirectorsR. van Gelder, President O. Nakagome, Vice President C. van Meerbeeck, TreasurerP.G. Roland M. Montevecchi G. VandewalleD. Eicke J.J. Koeman
Please address inquiries to the editor.Articles in Terra et Aqua do not necessarily reflect the opinion of the IADC Board or of individual members.
© 1999 IADC, The NetherlandsAll rights reserved. Electronic storage, reprinting or abstracting of the contents is allowed for non-commercial purposes with permission of the publisher.
ISSN 0376-6411
Typesetting and printing by Opmeer Drukkerij bv, The Hague, The Netherlands.
Front cover:Aerial view of the site of a pilot dredging project where potentially harmful sediment from the NorthernIndustrial Channel of Marghera Harbour in Venice, Italy is being mechanically treated (see page 22).
IADCP.J.A. Hamburger, Secretary GeneralDuinweg 212585 JV The Hague, The NetherlandsTel. 31 (70) 352 3334, Fax 31 (70) 351 2654E-mail: [email protected]://www.iadc-dredging.com
International Association of Dredging Companies
2 Editorial
3 Reclamations and the Interpretation of Marine Geology in Hong Kong: A Comprehensive Approach
J.W.C. James
Site investigation techniques developed during recent reclamations have created a detailed stratigraphy of Hong Kong which can improve accuracy in planning, design and construction.
12 Adding Dynamics to the Camp Model for the Calculation of Overflow Losses
Sergio Ooijens
An IADC “Most Promising Student” Award has been presented to a graduate of TU Delft for his thesis which describes the dynamics of hopper loading both in simulationand as compared with actual measurements onboard a TSHD.
22 Mechanical Treatment of Dredged Material. The Malcontenta Plant in theLagoon of Venice
Maurizio Gentilomo
In an extensive pilot study, contaminated sediment dredged from an industrial channelin Venice has been mechanically treated by dehydration at a purpose-built plant near the harbour.
30 Seminars/Conferences/Events
Autumn 1999 has a full schedule of conferences: Take special note of Expo MaritimaMercosur and the IADC Dredging Seminar in Buenos Aires in November.
Terra et Aqua – Number 76 – September 1999
CO N T E N T S
Terra et Aqua – Number 76 – September 1999
2
EDITORIAL
Undoubtedly you have already discovered the bonus publication tucked intoTerra et Aqua this month: Dredging: The Facts is a brief but clear summationdescribing the important role that dredging plays in our social and economic well-being. The co-publishers (IADC, WODA, PIANC and IAPH) are hoping toreach as wide an audience as possible. Indeed it is aimed at an audience that maybe only superficially acquainted with dredging – its purpose is to educate. If you asa reader find it useful, please let us know. And if you need additional copies, theyare available from the IADC at a nominal charge.
In the realm of education, the IADC, in its efforts to encourage young peopleto pursue careers in dredging-related professions, has once again presented its“Most Promising Student” Award to a recent graduate of TU Delft. His article,which examines overflow losses via both a simulation model and onboardmeasurements, begins on page 12. The prize has a monetary reward as well aspublication in Terra, and so professors worldwide you are encouraged to send inyour nominations!
In another activity reflecting IADC’s commitment to education, a reminderthat the International Seminar on Dredging and Reclamation will be givenNovember 8-12 in Buenos Aires, Argentina, running consecutively with ExpoMarítima Mercosur. IADC will have a booth at at this important South Americanexhibition and is also planning to participate in a short dredging conference givenat the Expo on Saturday, November 13.
This has been an active decade for the dredging industry – new ships, newprojects, new technologies. The treatment of contaminated dredged materialdescribed at the Malcontenta plant, Venice (page 22) as well as the strategraphicinformation gathered in Hong Kong (opposite page) are examples of the kind ofadvances dredging has achieved.
Marsha R. CohenEditor

ponent of Hong Kong’s economic growth since thebeginning of the century (Martin et al., 1997). Howeverin the last ten years the scale of reclamation has in-creased dramatically with the initiation in 1989 of theHong Kong Airport Core Programme (Lam, 1998) whichincluded the construction of the 1248 ha airport plat-form at Chek Lap Kok and reclamations at West Kowloon, Central and elsewhere in Hong Kong. By 1996 the total area reclaimed in Hong Kong wasabout 6000 ha and comprised around 5% of its landarea. Reclamations are set to continue in the futurewith planned developments such as major containerports near Lantau Island.
Abstract
Although reclamation of land from the sea has alwaysbeen an aspect of Hong Kong’s development, in thelast decade the scale of reclamation has increaseddramatically fueled by the initiation in 1989 of the Hong Kong Airport Core Programme. This included the construction of the 1248 ha airport platform at Chek Lap Kok and reclamations at West Kowloon,Central and elsewhere in Hong Kong.
These recent reclamations have stimulated a variety ofsite investigation techniques and methods. The exten-sive surveys undertaken for locating fill resources hasbenefitted the interpretation of the marine geology ofHong Kong by providing a widespread grid of reflectionseismic lines with associated boreholes and CPTs. This has enabled the stratigraphy to be based on aregional scale appraisal and allowed the geologicalinterpretations of relatively small reclamations to be set in the context of the surrounding geology. This is an important parameter for functions such as drainage pathways or sea wall design and constructionwhose effects impinge beyond the boundaries of areclamation.
This paper is published with the permission of theDirector of the British Geological Survey. the Director ofCivil Engineering, Hong Kong SAR Government and theAirport Authority Hong Kong. Mr Niall Spencer of BGSCartography produced the colour figures.
INTRODUCTION
Physically Hong Kong is characterised by hilly andmountainous terrain; flat land has always been at apremium, especially near the coast where the majorcentres of population have grown. The reclamation ofland from the sea has therefore been an integral com-
Reclamations and the Interpretation of Marine Geology in Hong Kong: A Comprehensive Approach
3
J.W.C. James
Reclamations and the Interpretation of MarineGeology in Hong Kong: A Comprehensive Approach
Ceri James graduated in 1970 fromSwansea University. He spent twoyears with the Ethiopian GeologicalSurvey before joining the BritishGeological Survey in 1973. Since 1984he has worked in the marine andcoastal groups at BGS with particularinterests in superficial deposits, bed-forms and seismic interpretation. He was the marine geologist with theHong Kong Geological Survey from1989 to 1991 and a consultant to theAirport Authority Hong Kong. He hasrecently co-authored a report on theeffective development of marineaggregate in South East Asia for theUK Department for InternationalDevelopment.
Ceri James
The enormous scale of these recent reclamations interms of infrastructure design and construction hasstimulated a variety of site investigation techniques andmethods which have been imaginatively deployed. The wealth of new site investigation data available, notonly from localised reclamation sites, but also from theextensive surveys undertaken for locating fill resourceshas benefitted the interpretation of the marine geologyof Hong Kong by providing a widespread grid of reflec-tion seismic lines with associated boreholes and CPTs.This has enabled the stratigraphy to be based on aregional scale appraisal and allowed the geologicalinterpretations of relatively small reclamations to be set in the context of the surrounding geology. This is a very important parameter for functions such as drainage pathways or sea wall design and constructionwhose effects impinge beyond the boundaries of areclamation.
RECLAMATION DESIGN AND CONSTRUCTION
The need to design and assess the behaviour ofreclamation platforms both during and after construc-tion has long been acknowledged in Hong Kong.
To model this behaviour geotechnically requires acomprehensive analysis and understanding of thegeology at reclamation sites. A framework based ongeological interpretation of the site investigation data,which should be as extensive as possible, has to bedeveloped for each reclamation, built up of the variousformations and units of sediment and rock whichunderlie the platform.
Terra et Aqua – Number 76 – September 1999
4
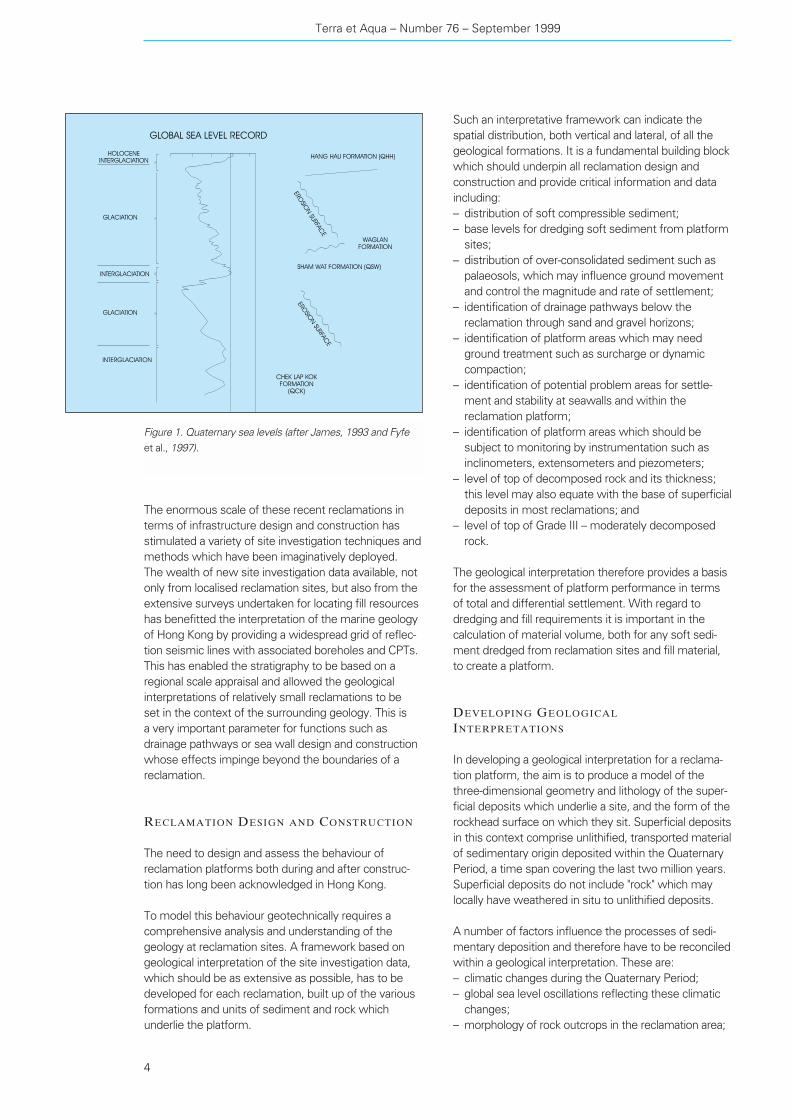
Figure 1. Quaternary sea levels (after James, 1993 and Fyfe et al., 1997).
Such an interpretative framework can indicate thespatial distribution, both vertical and lateral, of all thegeological formations. It is a fundamental building blockwhich should underpin all reclamation design andconstruction and provide critical information and dataincluding:– distribution of soft compressible sediment;– base levels for dredging soft sediment from platform
sites;– distribution of over-consolidated sediment such as
palaeosols, which may influence ground movementand control the magnitude and rate of settlement;
– identification of drainage pathways below thereclamation through sand and gravel horizons;
– identification of platform areas which may needground treatment such as surcharge or dynamiccompaction;
– identification of potential problem areas for settle-ment and stability at seawalls and within thereclamation platform;
– identification of platform areas which should besubject to monitoring by instrumentation such asinclinometers, extensometers and piezometers;
– level of top of decomposed rock and its thickness;this level may also equate with the base of superficialdeposits in most reclamations; and
– level of top of Grade III – moderately decomposedrock.
The geological interpretation therefore provides a basisfor the assessment of platform performance in termsof total and differential settlement. With regard todredging and fill requirements it is important in thecalculation of material volume, both for any soft sedi-ment dredged from reclamation sites and fill material,to create a platform.
DEVELOPING GEOLOGICAL
INTERPRETATIONS
In developing a geological interpretation for a reclama-tion platform, the aim is to produce a model of thethree-dimensional geometry and lithology of the super-ficial deposits which underlie a site, and the form of therockhead surface on which they sit. Superficial depositsin this context comprise unlithified, transported materialof sedimentary origin deposited within the QuaternaryPeriod, a time span covering the last two million years.Superficial deposits do not include "rock" which maylocally have weathered in situ to unlithified deposits.
A number of factors influence the processes of sedi-mentary deposition and therefore have to be reconciledwithin a geological interpretation. These are:– climatic changes during the Quaternary Period;– global sea level oscillations reflecting these climatic
changes;– morphology of rock outcrops in the reclamation area;

– alluvial, estuarine and marine erosion and deposition;and
– hydrodynamic conditions.
On a regional and global scale the most importantfactor determining the disposition of the superficialdeposits is Quaternary climate change. During theQuaternary, the climate fluctuated between glacial andinterglacial cycles. Major oscillations in sea level wereassociated with these climatic changes. Figure 1shows the climatic state and global sea level curve forthe Late Quaternary.
In Hong Kong these changes in sea level and climatehad a profound influence on the geological develop-ment of nearshore coastal areas in which reclamationsare constructed. During glacial periods, all areas ofHong Kong which are presently beneath the seabecame emergent. Exhumed landscapes were formedin superficial deposits, crossed by rivers and streamseroding and depositing sediment. Vegetation coveredthe landscape, underlain by extensive soil profiledevelopment. With subsequent rises in sea level during interglacial periods, landscapes became in-undated and modified by the sea. However, soilprofiles may remain as palaeosols beneath youngersuperficial deposits. With rising sea levels upstandingparts of old land surfaces formed of unconsolidatedmaterial could be eroded by wave action, cutting thesurface on which subsequent estuarine and marinesediments were deposited.
The sequence of events which mark the depositionaland erosional history of the superficial deposits of Hong Kong would therefore appear to be complex and
Reclamations and the Interpretation of Marine Geology in Hong Kong: A Comprehensive Approach
5
difficult to interpret. However, with a comprehensivesite investigation programme and knowledge of thehistory of sedimentation during the Quaternary in Hong Kong derived from a regional perspective, aninterpretation can be constructed to produce a geo-logical framework for reclamation design and con-struction.
METHODS OF INVESTIGATION AND DATA
An important element in the quality of a geologicalinterpretation for any reclamation is the quality andextent of site investigation undertaken.
Survey gridThe first imperative is a survey grid of high resolutionreflection seismic records, generally at a maximumspacing of 50 to 100 m. The grid should be rectangularwith one axis aligned along a principal feature of thereclamation such as a sea wall or runway. Additionalseismic lines should be run along the alignment of anymajor structures including those which deviate fromthe grid plan. Figure 2 includes the tracks of seismicsurveys undertaken in the Penny’s Bay area of LantauIsland and the proposed site of Container Terminals 10 and 11 (James, 1994). It illustrates the differencebetween a modern survey, undertaken in 1994, with arectangular grid at 50 m spacing and an older, 1981survey within Penny’s Bay itself, which has an irregular,spaghetti-like plan with no clearly defined individuallines and are therefore more difficult to interpret.
Reflection seismic surveys of Hong Kong reclamationsprincipally employ a boomer acoustic source (Ridley
Figure 2. Seismic surveys at Penny’s Bay (James, 1994).

finance available. For example, the marine geologicalinterpretation for the new airport at Chek Lap Kok(James et al. 1994), which covered an area of about938 ha, utilised 236 boreholes and 404 deep CPTs.
The vast majority of these were sited for engineeringand construction criteria rather than geological and onlya minority are located exactly on seismic lines.
Calibration of the geophysical dataThe final part of any investigation is the calibration ofthe geophysical data from seismic and CPT sources.The physical and lithological results from boreholelogging and any specialist input from palaeontologists,petrologists, geotechnical engineers and other special-ists is used to produce a comprehensive geologicalinterpretation with delineated formations and unitsdescribed in detail and illustrated with isopach and base level maps, and cross sections along the majorstructures such as sea walls and runways.
MARINE GEOLOGY AND STRATIGRAPHY
The offshore superficial deposits of Hong Kong map-ped by the Hong Kong Geological Survey have pre-viously been subdivided into two formations, the Hang Hau Formation and the Chek Lap Kok Formation,based on lithological and palaeontological evidencefrom boreholes and on interpretations of seismiccharacter (Strange and Shaw, 1986; Langford et al.,1989). The subdivision has a chronological element,
Thomas et al., 1988). Depth of penetration beneath thesea surface is normally about 100 m, an adequatedepth to reach the base of superficial deposits at mostcoastal reclamation sites. The boomer normally givesexcellent resolution within superficial deposits allowingdetailed interpretations to be undertaken. Because ofthe nature of the predominant solid rocks in HongKong, mainly granites and volcanics in various states ofdecomposition, acoustic impedance contrasts are verylow and this leads to poor penetration and resolutionwithin these solid rocks, in marked contrast to thenormally well resolved superficial deposits.
Boreholes and CPTsA thorough interpretation will produce seismic recordsannotated with picked reflectors (Figure 3) delineatingthe formations and units which have been interpreted.In an ideal site investigation the seismic interpretationshould precede any borehole or CPT (cone penetrom-eter test) survey undertaken to produce lithological andgeotechnical data. To calibrate and confirm the seismicinterpretation, boreholes and CPTs should be sited togive the optimum amount of data for all formations.They should always be located directly on seismiclines, preferably at the crossover of two lines, allowingthe borehole or CPT data to be traced in four directionsaway from the location.
The number of boreholes and CPTs undertaken for asite investigation will depend on the area covered bythe reclamation, the complexity of the geology and thestructures to be built on the reclamation, as well as the
Terra et Aqua – Number 76 – September 1999
6
Figure 3. Interpreted seismic record and CPT trace (James et al., 1994).
reflectors and sequences which can be traced exten-sively on a regional scale. Where seismic lines aregreater than 500 m apart it is difficult to produce con-tinuity and interpret distinctive sequences and unitswithin the Chek Lap Kok Formation. However, at somereclamation sites, such as the new airport, where theseismic grid is at a spacing of 100 m or less, character-istic seismic reflectors and sequences can be deducedfrom the interpretation of seismic records which allowsthe Chek Lap Kok Formation to be subdivided into units(Figure 4).
RECLAMATION GEOLOGY
The regional stratigraphy outlined above has been usedas the basis for the detailed interpretation of the geolo-gy of two reclamation sites in Hong Kong. Firstly, at thesite of the Hong Kong International Airport at Chek LapKok (James et al., 1994) and secondly, in the area ofPenny’s Bay and the proposed sites of ContainerTerminal 10 and 11 (James, 1994).
Hong Kong International AirportThe James et al. (1994) interpretation at Chek Lap Kokwas commissioned by the Airport Authority in July1993. The purpose of the study was primarily the samecriteria as those outlined above in the reclamationdesign and construction section with an emphasis onproviding the Airport Authority with a geological fra-mework as a backbone to the design, construction andmonitoring of the platform. Although the interpretationwas not used in the original design exercise fordredging at the reclamation, it was intended to be usedby the Airport Authority to clarify dredge levels andhighlight particular areas which might require modifica-tions to the proposed dredging operations (Plant et al.,1998).
The soft mud of the Hang Hau Formation (marine mud)is highly compressible and traditional practice up to thelate 1980s in Hong Kong had been to reclaim over thesoft marine mud (Martin et al., 1997) with groundtreatment, usually by vertical drains, to accelerateconsolidation of the mud. This "drained" alternative wasconsidered in the design options at Chek Lap Kok butthe disadvantages included the relatively large amount
with the Hang Hau Formation being younger than theChek Lap Kok Formation.
A two-fold subdivision of the offshore superficial depos-its has long been recognised in geological and geo-technical investigations in Hong Kong, with the terms“alluvium” and “marine deposits” given to sedimentswhich could nominally be ascribed to the Chek Lap Kokand Hang Hau formations respectively.
From the interpretation of seismic records across thewhole offshore area of Hong Kong a more complexseries of units than a simple twofold subdivision hasemerged. Two new formations, the Waglan Formationand the Sham Wat Formation have been recognised(Fyfe et al. 1997) which sit between the Chek Lap KokFormation and the Hang Hau Formation (Table I).
Waglan FormationThe Waglan Formation is confined to the south-easternwaters of Hong Kong and therefore is likely to be of noconsequence in coastal reclamations.
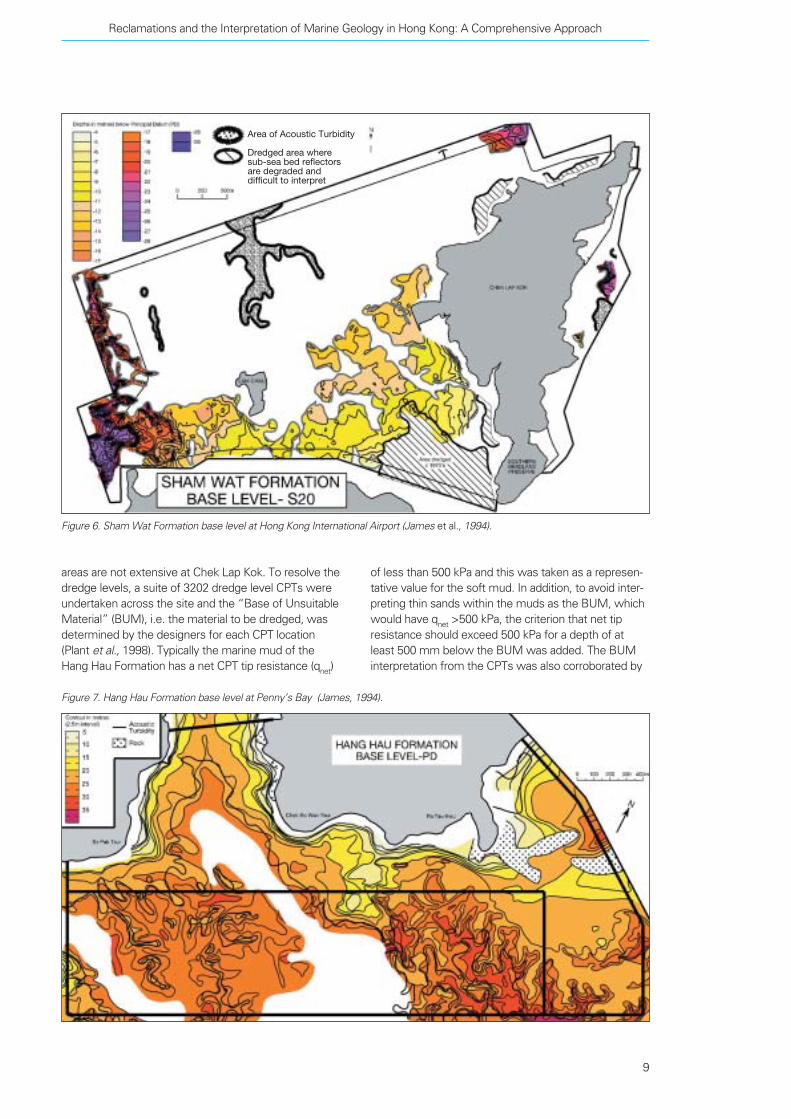
Hang Hau FormationThe Hang Hau Formation (QHH) consists of relativelyhomogenous very soft to soft, greenish grey silty clay.Undrained shear strengths range from <3 kPa to 20 kPa and SPT N values are generally zero. Moisturecontent is high, around 100%. It is the most widelydeveloped of the superficial deposits in Hong Kong andgenerally forms a blanket of sediment over all theunderlying superficial deposits and rock and has a well-developed unconformity at its base. In many coastalareas the base of the formation is deeply channelledwith sediment up to 29 m thick (Figure 7). The deline-ation of these soft sediment channels is important tothe design of a reclamation. The form of this basalsurface would be crucial as a base level for dredging indredged reclamations and also in estimating settlementrates and areas of ground treatment for drainedreclamations. A tight grid of seismic lines enables thethickness and geometry of the soft mud to be delin-eated for a reliable reclamation design.
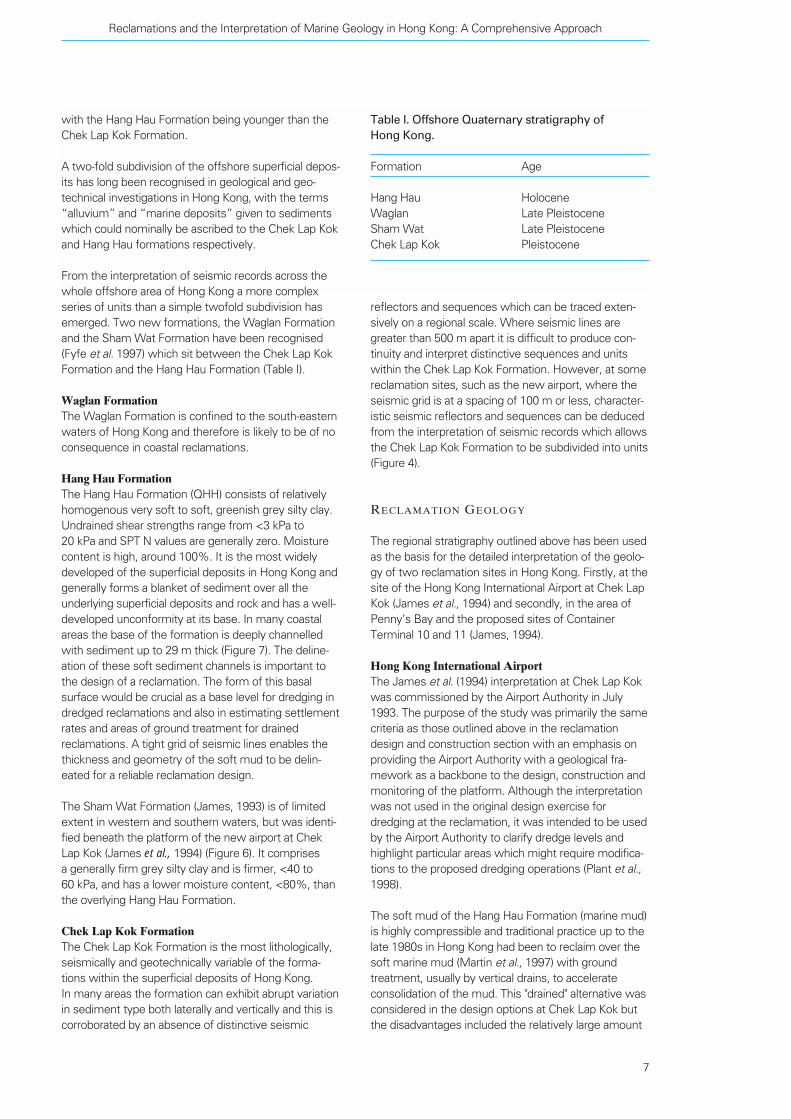
The Sham Wat Formation (James, 1993) is of limitedextent in western and southern waters, but was identi-fied beneath the platform of the new airport at ChekLap Kok (James et al., 1994) (Figure 6). It comprises a generally firm grey silty clay and is firmer, <40 to 60 kPa, and has a lower moisture content, <80%, thanthe overlying Hang Hau Formation.
Chek Lap Kok FormationThe Chek Lap Kok Formation is the most lithologically,seismically and geotechnically variable of the forma-tions within the superficial deposits of Hong Kong. In many areas the formation can exhibit abrupt variationin sediment type both laterally and vertically and this iscorroborated by an absence of distinctive seismic
Reclamations and the Interpretation of Marine Geology in Hong Kong: A Comprehensive Approach
7
Table I. Offshore Quaternary stratigraphy of Hong Kong.
Formation Age
Hang Hau HoloceneWaglan Late PleistoceneSham Wat Late PleistoceneChek Lap Kok Pleistocene

of settlement and the fact that it would have occurredtoo slowly, plus the assumption of a degree of uncer-tainty about the length and rate of consolidation and thepracticality of surcharging. Although the “dredged”option meant a larger volume of reclamation fill wasrequired compared to the “drained” option to replacethe dredged soft mud, it was chosen because of theshort time available for construction before the airportwas to open (Plant et al., 1998).
The Hang Hau Formation forms a blanket of sedimentbeneath the sea bed over most of the airport site. It covers all the underlying older superficial depositsand its base is a well developed erosion surface orunconformity. Although much of the basal surface isalmost planar there is a small network of channelswhich vary in amplitude from less than 3 m to about 10m. A few of these channels (Figure 5) are also markedby acoustic turbidity on seismic records formed by thepresence of gas within the mud. Elsewhere on seismicrecords the base of the formation is marked by a dis-tinctive, well-developed, high amplitude, continuousreflector (Figure 3).
The base of the Hang Hau Formation is generally wellseen and distinguishable as a good basal reflector onseismic records and over much of the reclamation thisshould equate with the dredge level. An area whereseismics cannot be used to determine the base of theHang Hau Formation is where the reflectors are ob-scured on seismic records by acoustic turbidity; these
Terra et Aqua – Number 76 – September 1999
8
Figure 4. Stratigraphy at Hong Kong International Airport (James et al., 1994).
Figure 5. Hang Hau Formation base level at Hong KongInternational Airport (James et al., 1994).
Area of Acoustic Turbidity
Dredged area wheresub-sea bed reflectorsare degraded anddifficult to interpret
of less than 500 kPa and this was taken as a represen-tative value for the soft mud. In addition, to avoid inter-preting thin sands within the muds as the BUM, whichwould have qnet >500 kPa, the criterion that net tipresistance should exceed 500 kPa for a depth of atleast 500 mm below the BUM was added. The BUMinterpretation from the CPTs was also corroborated by
areas are not extensive at Chek Lap Kok. To resolve thedredge levels, a suite of 3202 dredge level CPTs wereundertaken across the site and the “Base of UnsuitableMaterial” (BUM), i.e. the material to be dredged, wasdetermined by the designers for each CPT location(Plant et al., 1998). Typically the marine mud of theHang Hau Formation has a net CPT tip resistance (qnet)
Reclamations and the Interpretation of Marine Geology in Hong Kong: A Comprehensive Approach
9
Figure 7. Hang Hau Formation base level at Penny’s Bay (James, 1994).
Figure 6. Sham Wat Formation base level at Hong Kong International Airport (James et al., 1994).
Area of Acoustic Turbidity
Dredged area wheresub-sea bed reflectorsare degraded anddifficult to interpret

reference to the seismic records and any disparitieswere resolved within the design process.
During offshore regional mapping by the Hong KongGeological Survey around Lantau Island a distinctivesequence was recognised on seismic records beneaththe Hang Hau Formation. Borehole and CPT evidenceconfirmed the sequence had distinctive physical as wellas geophysical characteristics and it was formallyrecognised as the Sham Wat Formation (James, 1993)
To the unfamiliar it is easy in borehole cores to mis-interpret the Sham Wat Formation as the Hang HauFormation. They are both predominantly grey silty clay,although the Sham Wat Formation is generally firmer,<40 to 60 kPa, and has a lower moisture content,<80%, than the overlying Hang Hau Formation. However, the Sham Wat Formation does have adistinctive character on seismic records with a strongreflector at its base and contains continuous, sub-parallel, undulating reflectors which drape over channelinterfluves and down into channel deeps.
West of the airport site at Chek Lap Kok, the ShamWat Formation infills a major channel system whichencroaches beneath the platform from the south-west(Figure 6). Its base in the deepest channel is at –29 mPD with a thickness of sediment up to 18 m, andits tributaries branch north-west along the westernmargin of the platform.
In this area of the platform the Sham Wat Formationalso has a characteristic CPT signal compared to theoverlying Hang Hau Formation. At the interfacebetween the two formations there is generally anincrease of 200 to 300 kPA in the value of net tipresistance (qnet) at the top of the Sham Wat Formation.Typical values for qnet are 500 to 800 kPa increasinggradually with depth to 1000 kPa at the base of theformation. The higher values of tip resistance, porepressure and skin friction for the Sham Wat Formationcompared to the overlying Hang Hau Formation indi-cates a greater degree of consolidation has occurredwithin the sediments of the Sham Wat Formation. Across most of this area there is a good correlationbetween the CPT response for the Sham WatFormation and its interpreted sequence on the seismicrecords.
The recognition and delineation of the form and extentof the Sham Wat Formation was an important factor inaiding the design and construction of the western areaof the platform beyond Lam Chau. The sea wall at the western end of the southern run-way overlies a Sham Wat Formation infilled channeland the initial design dredge levels for the sea wall inthis area were the deepest for the site at –29 mPD andentailed dredging the Hang Hau Formation and theSham Wat Formation. Calculations were undertaken to
evaluate a higher dredge level within the Sham WatFormation and although settlement would be higher, achange to a base level of –22 mPD was consideredacceptable and adopted as the deepest dredging limit(Plant et al., 1998).
In total almost 69 Mm3 was dredged from the platformarea, predominantly soft mud of the Hang Hau Forma-tion and some soft to firm mud of the Sham Wat For-mation and minor sediment from the Chek Lap KokFormation. The average thickness of the dredged mudwas 7.5 m with the thickest sequence dredged, at 21 m, within the major gas filled channel of the HangHau Formation which ran across the northern runwayand northern sea walls (Figure 5) (Plant et al., 1998).
The extensive seismic, borehole and CPT data setenabled an extensive appraisal to be undertaken of theChek Lap Kok Formation and produced a comprehen-sive stratigraphy for the formation, and in greater detailthan had previously been produced in Hong Kongreclamations. The Chek Lap Kok Formation has beensubdivided into three units (James et al., 1994), num-bered QCK Unit 3, QCK Unit 2, QCK Unit 1 (Figure 4).Two of the units (QCK Unit 1 and QCK Unit 2) havebeen further divided. The subdivision has been basedon lithological and seismic criteria, such as continuity ofreflectors marking erosional events, and units withdistinctive seismic signatures. The formation includesfirm to stiff palaeosols, channel sands, and soft to firmestuarine clays. It is this formation that provides theplatform on which the reclamation fill has been placed.
The mapping of the various units within the formationwas a significant contribution to the design and con-struction of the reclamation as it proceeded andcontinues to be relevant to the monitoring of platformperformance.
Penny’s Bay and the site of Container Terminals 10and 11Penny’s Bay lies at the south-eastern end of LantauIsland at the opposite end of the island to the site ofthe airport at Chek Lap Kok. The geological inter-pretation (James, 1994) was undertaken during thedesign stage of the reclamation prior to any plannedconstruction.
The interpretation is based on a 50 m grid of modernboomer seismic reflection lines over the site of thecontainer terminals and older records of poorer qualityin Penny's Bay. The site investigation also included 109 boreholes, 41 vibrocores and 22 CPTs. The stra-tigraphy at the site is primarily a two-fold succession of soft mud of the Hang Hau Formation overlying acomplex mixture of firm to stiff silty clay with somesand and silt which forms the Chek Lap Kok Formation. The Sham Wat Formation was not recognised at thesite.
Terra et Aqua – Number 76 – September 1999
10
Volume 1 – Report, 45 pp; Volume 2 – Cross Sections; Volume
3, 4, 5 and 6 – Maps.
James, J.W.C., Evans, C.D.R., Crosby, A. and Humphreys, B. 1994.“An interpretation of the marine geology for the replacement
airport at Chek Lap Kok, Hong Kong”. British Geological
Survey Technical Report WB/93/34. Volume 1 – Report, 64 pp;
Volume 2 – Maps; Volume 3 – Cross Sections.
Lam, B.C.L. 1998.“Management and procurement of the Hong Kong Airport
Core Programme”. Proceedings of the Institution of Civil
Engineers, Civil Engineering, Hong Kong International Airport,
Part 1; airport, Vol. 126, 5-14.
Langford, R.L., Lai, K.W., Arthurton, R.S. and Shaw. R. 1989.“Geology of the Western New Territories”. Hong Kong
Geological Survey Memoir No. 3. Geotechnical Control Office.
Martin, R.P., Whiteside, P.G.D., Shaw, R. and James, J.W.C.1996. “Offshore geological investigations for port and airport
development in Hong Kong”. Proceedings 30th International
Geological Congress, Beijing, China.Vol. 23, 65-80.
(VSP International Publishers, Zeist, Netherlands)
Plant, G.W., Covil, C.S. and Hughes, R.A. 1998. Site Preparation for the New Hong Kong International Airport.
Thomas Telford, London, UK.
Ridley Thomas, W.N., Lai, M.W.C. and Nieuwenhuijs, G.K. 1998.“Marine geophysical methods”. In Marine Sand and Gravel
Resources of Hong Kong. Whiteside, P.G.D. and
Wragge-Morley, N. (Editors). Hong Kong: Geological Society
of Hong Kong. pp 109-119.
Strange, P J, and Shaw, R. 1986.“Geology of Hong Kong Island and Kowloon”. Hong Kong
Geological Survey Memoir No.2. 1986. Geotechnical Control
Office.
In terms of reclamation design the form of the softmud of the Hang Hau Formation is important in termsof settlement considerations. It is constrained in exten-sive channel systems (Figure 7) with two majorchannels in the west infilled with up to 29 m of softmud and a narrower dendritic set in the east infilled to amaximum thickness of 27 m.
The two major channels and the area in Penny’s Baycontain a large accumulation of gas within the sedi-ment which forms areas of acoustic turbidity on theseismic records. These obliterate seismic reflectorswhich trace features such as the base of the Hang HauFormation. In these areas of acoustic turbidity theinterpretation has to rely on point source informationsuch as boreholes and CPTs and any surfaces such asthe base of the soft mud has to be extrapolatedbetween them. The upper ten metres of the Hang HauFormation is generally not obliterated by acousticturbidity and the form of the reflectors can be used to map out channels within the zone with acousticturbidity and therefore provide a basis for planning aCPT survey programme to delineate the base of thesoft mud.
Conclusions
The comprehensive approach to the interpretation ofthe marine geology of any reclamation site is based onexcellent site investigation provided by a tight grid ofseismic reflection profiles calibrated with borehole andCPT surveys. These should be analysed with a knowl-edge of the regional geology to provide a context forthe reclamation and a detailed stratigraphy. The geo-logical framework and information obtained from suchan approach is crucial in enabling the planning, designand construction to proceed on schedule and tobudget, without any unforeseen ground conditionsdelaying progress.
References
Fyfe, J.A., Selby, I.C., Shaw, R., James, J.W.C. and Evans,C.D.R. 1997. “Quaternary sea-level change on the continental shelf of
Hong Kong”. Journal of the Geological Society, Vol. 154,
pp 1031-1038. London, UK.
James, J.W.C. 1993. “The offshore geology of the area around Lantau Island,
Hong Kong”. British Geological Survey Technical Report
WB/93/13R.
James, J.W.C. 1994. “An interpretation of the marine geology of Penny's Bay and
the site of Container Terminals 10 and 11, Hong Kong”.
British Geological Survey Technical Report WB/94/35R.
Reclamations and the Interpretation of Marine Geology in Hong Kong: A Comprehensive Approach
11
Abstract
The sedimentation of fine sands in the hopper of atrailing suction hopper dredger (TSHD) forms an essen-tial part of the dredging process.Until now, in modelsthe sedimentation process mainly has been describedas being (quasi-)static. However in order to understandthe process and to be able to optimise the dredgingtime with controllable parameters, dynamics should beanalysed and described.
The Camp model was improved by Vlasblom andMiedema1, which provided a tool to describe overflowlosses as a function of the incoming flow, grain sizes,concentration and the geometry of the volume ofmixture in the hopper. However, it was still a steady-state model. When analysing the dynamics in thesettlement process, a quasi-static approach cannotexplain all the changes in the overflow losses. In thisarticle dynamics relations are introduced based upon asimple mass and volume balance and than implemen-ted in the Camp model by manipulating the input, butwithout changing the steady-state model.
The described dynamic relations were implemented ina simulation and compared with onboard measure-ments from the TSHD Amsterdam. This resulted in aremarkable improvement in the correlation betweenthe onboard measurements and the simulation.
This article was written with the cooperation of Prof W.J. Vlasblom, Chair of Dredging Technology atDelft University of Technology, and Engineers RonaldA. van der Hout and Maurits den Broeder, both ofBallast Nedam Dredging, The Netherlands.
Introduction
When dredging fine sands with a TSHD the overflowlosses form an essential part of the process. A gooddescription of the sedimentation process is needed,not only to improve calculations of the dredging time,
but also for a better understanding of the process itself.In the past years, a few models have been developedto estimate and predict these losses. Some of theseare more mathematical models (i.e. De Groot), othersmore basic (i.e. Camp).
At the WODCON XIV, Vlasblom and Miedema1
presented an improved version of the Camp model,that takes into account the influences of most of theimportant parameters and neglects all local processes.This model is easy to understand and does not needsensitive calculations. Disadvantages are that themodel assumes a steady-state situation in whichparameters like concentration, flow, and the volume ofthe mixture in the hopper are assumed to be constant.However, during test performed by the TU Delft andfrom experience onboard, it became clear that theparameters change during loading and that dynamicsplay an important role in the sedimentation process.These dynamic changes not only concern the increasein the height of the bed of sand, but also changes in theflow and concentration in the hopper during loading.
The goal of this article it is not to give an exact calcu-lation method predicting the overflow losses, but todescribe the dynamics on the basis of the Campmodel. It seems that when adding even simpledynamics to this steady-state model, a lot of changes in the overflow losses can be accounted for and thecorrelation between model and measurementbecomes remarkably higher.
First the influences on the overflow losses in generalwill be described. Also a short description of the Campmodel will be given. Then to understand the introduc-tion of dynamics to this model, a qualitative descriptionof the changes in the parameters during dredging willbe given, followed by a more mathematical analysis ofthe influence of the parameters to quantify thechanges. Finally, some examples will be shown inwhich a simulation based on the derived relations forthe dynamics and the Camp model, are compared withonboard measurements.
Terra et Aqua – Number 76 – September 1999
12
Sergio C. Ooijens
Adding Dynamics to the CampModel for the Calculation of Overflow Losses

Where as ß is a number greater than 1 depending onthe Reynolds number of the grain.
Secondly, the mixture in the hopper is not calm, so theinfluence of the turbulence in the hopper should betaken into account. This turbulence is mainly caused bythe velocity of the mixture, which can be described asa function of the flow (Q) and the free volume (H, L, B)and which depends on an internal flow.
OVERFLOW LOSSES
The efficiency of the hopper is defined by the fractionof the incoming sand that settles in the hopper (bzg).However, the primary consideration is the fraction thatdoes not settle and flows overboard: the overflowlosses (ov). In literature, these losses are defined by the ratio between outgoing concentration and incomingconcentration (assuming incoming and outgoing floware equal), or more correctly, the outgoing andincoming production.
Pbruto – Pnetto Cvout • Qoutov = = Eq. 1
Pbruto Cvin • Qin
Equation 1 could give the impression that there is adirect relation between incoming and outgoing produc-tion. However, as will be described later on, the influen-ce of a change in incoming flow and concentration onthe total production cannot be described momentarily,but has to be evaluated over a certain period of time.
Variables of influenceThe most important parameters in the hopper sedimen-tation process can be found when analysing the set-tling velocity (time to settle) and the horizontal velocity(time to reach the overflow).
The settling velocity is mainly determined by the size ofthe grains (d), as shown in equation 2, describing thesettling velocity in calm and clear water. However thesand will never consist of one grain size. So, the settle-ment velocity of every fraction of the grain size distribu-tion (d50, cu) has to be taken into account.
4 • g • (�s – �w) • d • �v = Eq. 2
3 • �w • Cd
The settlement is also influenced by a few otherparameters.
First of all, the water contains a concentration (Cv) ofsand particles, which induces the effect of hinderedsettlement. When grains settle to the bottom, water ispushed out. This causes a current in the other direction(upwards) and reduces the settling velocity. With anincreasing concentration not only more water isreplaced, but at the same time it will be harder for thereplaced water to flow in the opposite direction,causing an even lower settlement velocity. Thecorrected velocity was defined by Richardson and Zaki1as:
vc = (1 – Cv)’� • v Eq. 3
Adding Dynamics to the Camp Model for the Calculation of Overflow Losses
13
Sergio Ooijens (right) receiving the IADC Student Award from Mr Hans van Diepe on behalf of the IADC.
The IADC “Most PromisingStudent” AwardTo stimulate technical universities worldwide toincrease their interest in the dredging industry ingeneral and to improve the quality of their studentsin dredging-related technologies in particular, theIADC has instituted an awards programme for the most interesting final theses on dredging-relatedsubjects. Each award carries with it a prize ofUS$500, a certificate of recognition, and the possi-bility of publication in Terra et Aqua.
This year a student award was granted to Sergio C. Ooijens at the recommendation of Prof WillemVlasblom of the Delft University of Technology, The Netherlands. The award was officially presentedby Mr Hans van Diepen (Royal Boskalis) on behalf ofthe IADC at a special ceremony. Mr Ooijensgraduated as a mechanical engineer in January1999, and did his thesis at Ballast Nedam Dredgingon the loading of a hopper dredger. His paper ispublished here with their permission.
in this model. Although these processes are essentialfor a good understanding, they are still difficult todescribe.
Besides this, the model assumes a steady state (thismeans the history of the process does not influence itscurrent state) in which the concentration in the hopper,the average flow and the height of the volume ofmixture are constant, which in real-time dredging isnever the case.
DYNAMICS
Now that the main parameters of influence are known,one can analyse their change in time. Before intro-ducing these dynamics into this model one shouldconsider the development of the process in time, forexample by dividing the process in different loadingstages.
Stages of loading1. Beginning of the dredgingWhen a TSHD starts dredging, the hopper is loadedwith some residue and some water. Until the overflow(maximum volume) is reached there will be no out-going flow and thus the overflow losses are equal tozero. More important is the low average velocity in thehopper creates a relatively good condition for the grainsto settle. Consequently, the average concentration inthe hopper will be relatively low when the overflow isreached.
2. CVS (Constant Volume System)When the overflow is reached one will try to continueloading with a maximum volume (CVS). This will meanthat there is a constant total volume. After some time,the incoming flow is equal to the average flow in thehopper and thus the outgoing flow.
Owing to the settlement, the volume of the bed ofsettled sand in the hopper will increase and thus thevolume of mixture will decrease. With an equal volumebut an increasing average density, the displacement ofthe ship will increase.
3. CTS (Constant Tonnage System)Finally, when the maximum draught has been reached,the dredger will try to load with a maximum load in thehopper. Reducing the total volume can compensatethe increase in weight owing to the loading of therelatively heavier sand. This displacement is constantwhen the volume is reduced with:
dV �in= 1 – • Qin Eq. 5
dt ( �out )
Terra et Aqua – Number 76 – September 1999
14
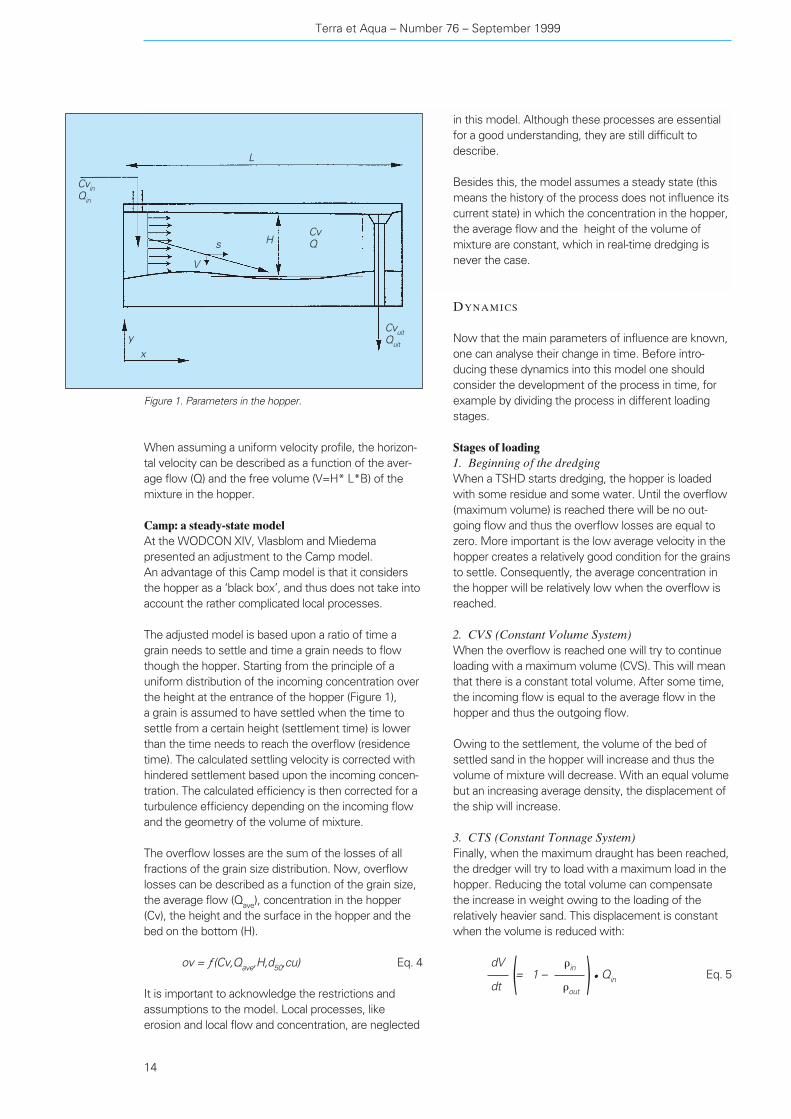
Figure 1. Parameters in the hopper.
When assuming a uniform velocity profile, the horizon-tal velocity can be described as a function of the aver-age flow (Q) and the free volume (V=H* L*B) of themixture in the hopper.
Camp: a steady-state modelAt the WODCON XIV, Vlasblom and Miedemapresented an adjustment to the Camp model. An advantage of this Camp model is that it considersthe hopper as a ‘black box’, and thus does not take intoaccount the rather complicated local processes.
The adjusted model is based upon a ratio of time agrain needs to settle and time a grain needs to flowthough the hopper. Starting from the principle of auniform distribution of the incoming concentration overthe height at the entrance of the hopper (Figure 1), a grain is assumed to have settled when the time tosettle from a certain height (settlement time) is lowerthan the time needs to reach the overflow (residencetime). The calculated settling velocity is corrected withhindered settlement based upon the incoming concen-tration. The calculated efficiency is then corrected for aturbulence efficiency depending on the incoming flowand the geometry of the volume of mixture.
The overflow losses are the sum of the losses of allfractions of the grain size distribution. Now, overflowlosses can be described as a function of the grain size,the average flow (Qave), concentration in the hopper(Cv), the height and the surface in the hopper and thebed on the bottom (H).
ov = ƒ(Cv,Qave,H,d50,cu) Eq. 4
It is important to acknowledge the restrictions andassumptions to the model. Local processes, likeerosion and local flow and concentration, are neglected
CvinQin
CvuitQuit
CvQ
V
s
L
H
yx

In this article process dynamics are defined as thechanges that are caused by the nature of the process.
The main examples of these changes are:1. Change in the height (H) of the mixtureThe most logical change is the increase of the bed ofsand owing to sedimentation and thus a decrease ofthe free volume of the mixture and the height of thisvolume (H). This volume will also decrease whenloading with the Constant Tonnage System because ofa decreasing total volume.
2. Change in the local and average velocity when theoverflow is reached (Q)When filling the hopper, the velocity will decrease overthe length of the hopper (from the start until theoverflow). The outgoing flow is induced by the heightof water above the overflow, so a build-up of waterabove the overflow is needed for an outgoing flow.Thus when the overflow is reached, the volume andthe outgoing flow will slowly increase until the outgoingand incoming flow are equal.
3. Change in the local and average concentration whenthe overflow is reached (Cv)As described before the expectation is that the averageconcentration in the hopper is relatively low when theoverflow is reached because of good settlementconditions.
4. Change in flow (Q) when changing from CVS toCTSWhen changing to CTS the overflow will be loweredand the average flow will increase. For the change fromCVS to CTS a build up of water will be needed too.
Input dynamics are the dynamics in the process as aresult of a change in the input:1. Changing the incoming flow (Q)Adjusting the incoming flow will not effect the averageflow in the hopper immediately; a build up in the heightof the water at the overflow is needed to increase theoutgoing flow. This build-up means increase in the totalvolume to increase the average flow.
When the overflow efficiency is known, one cancalculate the outgoing flow when loading with CTS as afunction of the incoming (measured) parameters:
�s – �wQout = Qin • 1 + Cvin • bzg • Eq. 6( �w )
The dredging will continue until the minimum volumeor an optimal loading point has been reached.
Development of the overflow lossesRelated to these different methods of loading are thechanges in the overflow losses (Figure 2), which can bedistinguished in four stages (when loading with aconstant flow and concentration).
I. Before the overflow has been reached there is nooutgoing flow. Consequently there are no overflowlosses. In this phase there is a decreasing horizontalvelocity in the hopper, which means a good sedimen-tation of the grains, so the average concentration ofmixture in the hopper (Cv) will be relatively low(compared tot he incoming concentration) when theoverflow is reached.
II. When the overflow is reached a flow out of thehopper starts at the overflow and the velocity in thehopper will increase. The increasing average velocitywill cause a decreasing settling efficiency. Owing bothto this decrease and to the relatively higher incomingconcentration, the average concentration in the hopperwill slowly increase causing a decreasing settlingvelocity and thus an increase in the overflow losses.
III. After these changes in the average flow andconcentration in the hopper a quasi-static phaseemerges in which (when the incoming flow andconcentration and the total volume stay constant) onlythe volume of mixture and thus the height to settle andthe horizontal velocity will slowly increase. Since theoverflow losses (in this model) are quite insensitive tothis parameter up until the time the scouring velocity isreached, the overflow losses are quite constant in thisphase.
IV. When the free volume in the hopper decreases thehorizontal velocity in the hopper will increase andscouring will dominate the settling process and theoverflow losses will increase excessively.
Process and input dynamicsIt is clear that the changes in the loading conditionshave their influence on the overflow losses. Whendescribing these changes one has to distinguish twotypes of dynamics: – process dynamics, and – input dynamics.
Adding Dynamics to the Camp Model for the Calculation of Overflow Losses
15
Figure 2. Phase in the overflow losses.

2. Change in the incoming concentration (Cv)When the incoming concentration, as delivered by thedraghead, is changed this will not directly influence theaverage concentration in the hopper.
3. Change in the grain diameter/grain distribution (d50, cu). During the dredging process the soil conditions andthus also the incoming grain size can change locally. It is quite hard to measure this grain size distributionon-line.
MATHEMATICAL ANALYSIS
Until now, the description of the dynamics has beenqualitative. When quantifying the sedimentationprocess by considering the hopper as one system it isuseful to make an input-output relation, based upon asimple mass balance (Eq. 7) and volume balance (Eq. 8):
dM (t)= Qin (t) • �in (t) – Qout (t) • �out (t) Eq. 7
dt
dV (t)= Qin (t) – Qout (t) Eq. 8
dt
The outgoing flow and concentration are a function ofthe hopper process. The incoming flow and concentra-tion can be measured and are known.
Dynamics of the flowA great deal of the dynamics seem to concern thechanging average flow (Q) and concentration (Cv) in thehopper. The flow as an input to the Camp model is theaverage flow in the hopper, which changes in timeinfluenced by the change in volume and change inincoming flow.
The flow in the hopper depends on local influences, butone can assume the main changes occur in the lengthof the hopper (x). Equation 9 shows that the impact ofa change in the incoming flow takes place after a build-up in the local height and volume. This causes adifference between local flow and incoming flow.
When all local processes are neglected, the averageflow can be described as an average of the incomingand outgoing flow (Eq. 10). By making this assumptiona part of the dynamics will be lost, but the problem willbe enormously clarified.
dVQave = Qin + 0.5 • Eq. 10
dt
The outgoing flow depends on the height of the waterat the overflow and is thus related to the total volume.An increase in the incoming flow (Qin) has to cause anincrease in the total volume (V) before causing anincrease in the outgoing flow (Qin). Analogous, whendecreasing the volume by lowering the overflow, theflow will increase and eventually the volume willdecrease.
Terra et Aqua – Number 76 – September 1999
16
dh (x)Qx = Qin + B • dx Eq. 9∫ ( dt )
x
o
List of symbols
� coefficient for the hindered settlement [-]� cinematic viscosity [m2 s-1]�corr density corrected as input for
simulation [kg m-3]�m density of mixture in the hopper [kg m-3]�w density of water [kg m-3]�s density of solids (sand) [kg m-3]�in density of incoming mixture [kg m-3]�out density of outgoing mixture [kg m-3]�bed density of the settled bed [kg m-3]� shape factor [-]� residence time [-]t time [s]�t sample period / steptime [s]bzg settlement efficiency [-]cu grain size uniformity [-]d grain size [mm]d50 median of the grain size distribution [mm]n sample number [-]ov overflow losses [-]s average horizontal velocity in the
hopper [m s-1]u horizontal velocity at the overflow [m s-1]v settlement velocity [m s-1]vc corrected settlement velocity [m s-1]w settlement velocity of a particle [m s-1]B width of the hopper [m]Cv model concentration in the hopper [-]Cvin incoming concentration [-]Cvout outgoing concentration [-]H height of the bed of sand in the hopper [m]L length of the hopper [m]Q flow [m3 s-1]Qx flow at position x in the hopper [m3 s-1]Qin incoming flow [m3 s-1]Qout outgoing flow [m3 s-1]Qave average flow [m3 s-1]TDS Tonnes Dry Solids [tons = 1000 kg]V total volume [m3]Vm volume of mixture in the hopper [m3]Vbed volume of bed of sand in the hopper [m3]V mix volume to flow through in the
simulation [m3]

in the hopper. Only the density of the bed (�bed) can beassumed constant, the density of the mixture (�m )changes in time and influences the settlement process.
dM (t)= Qin (t) • �
in (t) – Qout (t) • �out (t) =
dt
� (Vbed (t) • �bed ) � (Vm (t) • �m (t))+
Eq. 12�t �t
This partial differential equation has too many variablesto be solved properly, without making assumptionsabout the increase in the bed volume and the overflowlosses.
When introducing dynamics into the Camp model, notthe exact concentration in the hopper but a dynamicsubstitute as input for the steady-state model has to bedescribed. This means, we will not be looking for anactual average concentration but for a model concen-tration.
Assuming the outgoing flow at the overflow can bedescribed as a clear overflow weir, one can describe a dynamic relation between the average flow in thehopper and the incoming flow based upon a simplevolume balance.
Dynamics of the concentrationSo the dynamics in the flow cannot be described asbeing quasi-static. In practice however the variance inthe overflow losses owing to the fluctuations in theconcentration seems to be more important. In theanalyses several concentrations are distinguished:– Incoming concentration (Cvin(t)): the concentration
delivered by the draghead.– Outgoing concentration (Cvout(t)): the concentration
at the overflow, which is a function of the hopperprocess.
– Local concentration Cv (x,y,t): the local concentra-tions in the hopper. These will locally affect thesettlement by the ‘hindered settlement’ effect.
The Camp model is not a function of the local concen-trations, but of the incoming concentration in a steadystate situation. Nevertheless, every change of concen-tration in the hopper, when not in a steady statesituation, will have to be compensated in the input tothe Camp-model. To describe the total effect of thelocal concentrations a model-concentration (Cv(t)) isintroduced. This concentration is a fictive one basedupon the incoming concentration and is used todescribe the influence in the process.
There are two ways to make a simple model of thedynamics of the concentration as a parameter for thesettling model and describe the change in concentra-tion when the overflow is reached and when the in-coming concentration changes: – plug flow or – ideal mixing.
For the first option, one can assume the incomingmixture goes through the hopper as a fluid through apipeline (a plug flow, Figure 3). Starting point is that nomixing takes place. This would mean that the modelconcentration is an average of the incoming concen-tration over a certain period of time (�). When assuminga constant flow and mixture volume this is the timeneeded to fill this volume.
L Vm� = = Eq. 11
s Q
Second, one can assume uniform mixing (Figure 4)takes place (again neglecting any local processes andconcentrations).
The total volume has to be divided into the volume ofthe sand bed (Vbed) and the volume of the mixture (Vm)
Adding Dynamics to the Camp Model for the Calculation of Overflow Losses
17
Figure 3. Plug flow.
Figure 4. Uniform Mixing.

For the purpose of illustration and to get a better idea ofthe order of magnitude of the dynamics involved, onecan neglect the change in the volume of the hopperand the volume of the bed, which simplifies theequation enormously and shows a basic description foruniform mixture (first order differential equation with atime constant equal to �).
� (Vm • Cv (t))Cvin (t) • Qin (t) – Cvout (t) • Qin (t) =
�tEq. 13
Cvout1 = Cv*ov (overflow loss),Cvout2 = Cv*(1-ov) (sedimentation),Cvout = Cvout1 + Cvout2
The fictive value for the concentration (Cv) in the hop-per can be used as an input to the Camp model.
When calculating the fictive model concentration (Cv)based upon the idea of uniform mixing in a simulation,the change in volume of the mixture cannot beneglected and has to be estimated. Because of thischange, the mixing process will accelerate.
With this description both input and process dynamicsfor the density can be described:1. After reaching the overflow the flow in the hopperwill change and thus the sedimentation and the density(“start value problem”). 2. When changing the incoming concentration (“step response”) (Figure 5).
Terra et Aqua – Number 76 – September 1999
18
Figure 5. Step-response of a plugflow and a uniform mixing.
Figure 6. Data for the calculations were logged on the TSDH Amsterdam.
= Change in input concentration
= Change in hopper concentration (plugflow)
= Change in hopper concentration (uniform mixing)
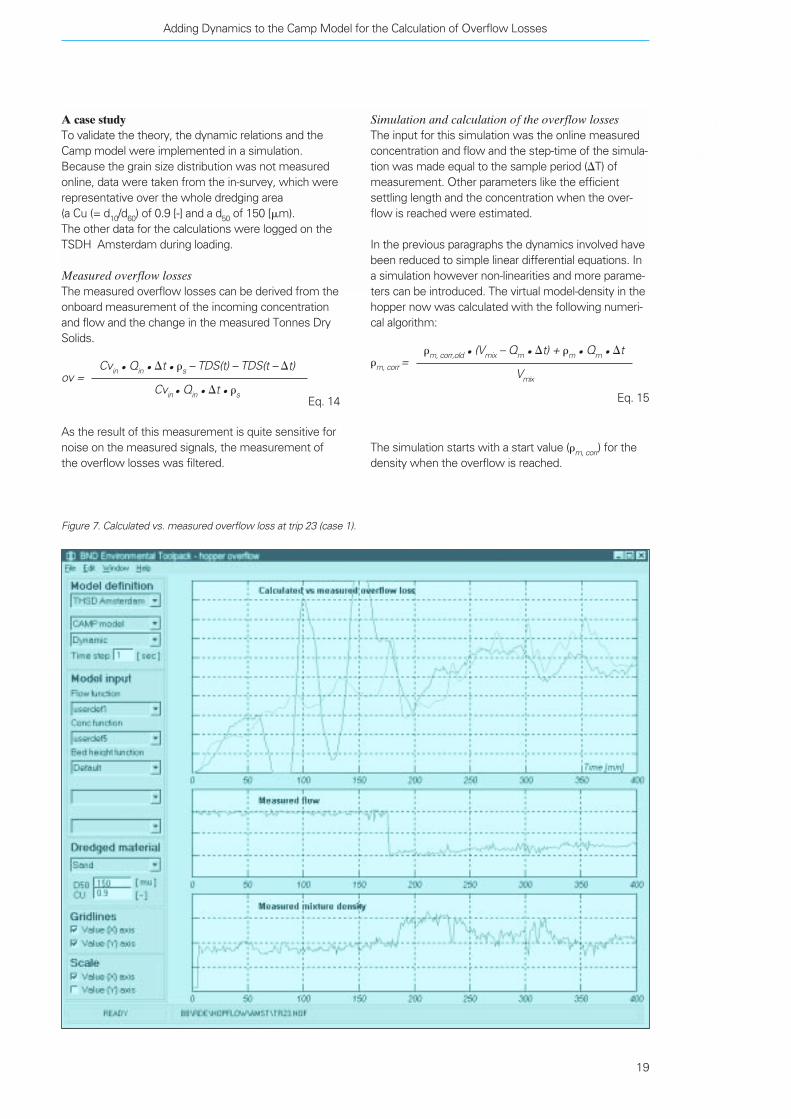
Simulation and calculation of the overflow lossesThe input for this simulation was the online measuredconcentration and flow and the step-time of the simula-tion was made equal to the sample period (�T) ofmeasurement. Other parameters like the efficientsettling length and the concentration when the over-flow is reached were estimated.
In the previous paragraphs the dynamics involved havebeen reduced to simple linear differential equations. Ina simulation however non-linearities and more parame-ters can be introduced. The virtual model-density in thehopper now was calculated with the following numeri-cal algorithm:
�m, corr,old • (Vmix – Qm • �t) + �m • Qm • �t�m, corr =
Vmix
Eq. 15
The simulation starts with a start value (�m, corr) for thedensity when the overflow is reached.
A case studyTo validate the theory, the dynamic relations and theCamp model were implemented in a simulation.Because the grain size distribution was not measuredonline, data were taken from the in-survey, which wererepresentative over the whole dredging area (a Cu (= d10/d60) of 0.9 [-] and a d50 of 150 [�m). The other data for the calculations were logged on theTSDH Amsterdam during loading.
Measured overflow losses The measured overflow losses can be derived from theonboard measurement of the incoming concentrationand flow and the change in the measured Tonnes DrySolids.
Cvin • Qin • �t • �s – TDS(t) – TDS(t – �t)ov =
Cvin • Qin • �t • �sEq. 14
As the result of this measurement is quite sensitive fornoise on the measured signals, the measurement ofthe overflow losses was filtered.
Adding Dynamics to the Camp Model for the Calculation of Overflow Losses
19
Environment
Figure 7. Calculated vs. measured overflow loss at trip 23 (case 1).
The result of the static model is based on the fictivemodel concentration. The measured overflow losseshowever are described on the basis of the incomingconcentration (Eq.1 ). Therefore to be able to comparesimulation with measurements calculated overflowlosses become:
Cv • ovstaticov = Eq. 16
Cvin
ComparisonIn three situations the simulation was compared withthe practice. All situations occurred with the samedredger and same type of sand. The figures show theoverflow losses from the point the overflow has beenreached onwards.
Case 1 (Figure 7): In the first situation the hopper startsloading with a high flow. After a certain period (at timestep 180) the flow was reduced causing an increase inthe concentration.Between time step 70 and 170 a great error in the TDSsignal occurred, but one still can distinguish the slowincrease in the overflow losses when the overflow is
reached. When the flow was reduced at time step 180,the losses were reduced, but because of an increase indensity the losses increased after a certain period.
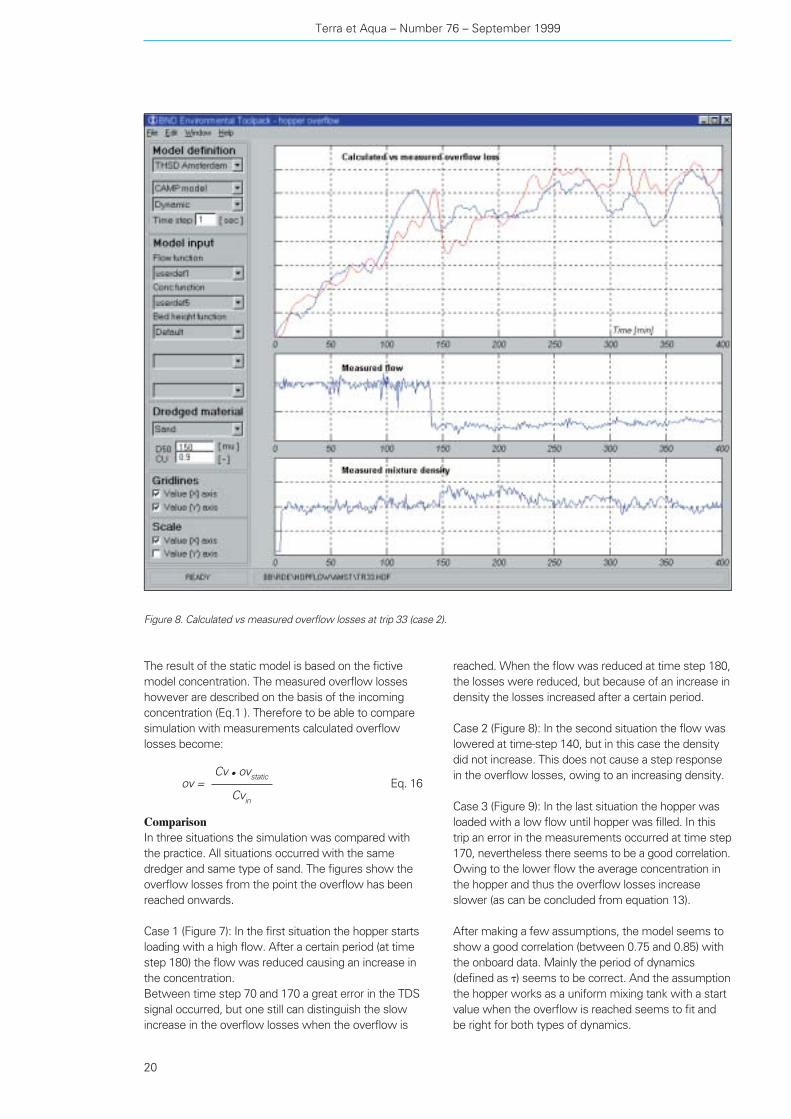
Case 2 (Figure 8): In the second situation the flow waslowered at time-step 140, but in this case the densitydid not increase. This does not cause a step responsein the overflow losses, owing to an increasing density.
Case 3 (Figure 9): In the last situation the hopper wasloaded with a low flow until hopper was filled. In thistrip an error in the measurements occurred at time step170, nevertheless there seems to be a good correlation.Owing to the lower flow the average concentration inthe hopper and thus the overflow losses increaseslower (as can be concluded from equation 13).
After making a few assumptions, the model seems toshow a good correlation (between 0.75 and 0.85) withthe onboard data. Mainly the period of dynamics(defined as �) seems to be correct. And the assumptionthe hopper works as a uniform mixing tank with a startvalue when the overflow is reached seems to fit andbe right for both types of dynamics.
Terra et Aqua – Number 76 – September 1999
20
Figure 8. Calculated vs measured overflow losses at trip 33 (case 2).

seems to be inevitable, the next steps have to be:– a more detailed description of the dynamics;– a description of local dynamics;– making the Camp model itself dynamic.
References
1. Vlasblom, W.J. and Miedema, S.A.
“A theory for determining sedimentation and overflow losses”.
Dredging Benefits: Proceedings of the Fourteenth World
Dredging Congress, 1995: Vol. 1.
2. Ooijens S.C.
Modelleren van het sleepkop- en beunproces op sleephopper-
zuigers. Zeist: Ballast Nedam Dredging, 1999.
Adding Dynamics to the Camp Model for the Calculation of Overflow Losses
21
Conclusions and Discussion
The aim of this article was to analyse and acknowledgethe influence of dynamics in the hopper-loading pro-cess as part of the ongoing development in hoppersettlement research. The dynamics of the concentra-tion are a good reason for the changes in the overflowlosses. Also changes in the flow play a part but seemto be of a higher frequency and a lower influence.
All local processes, like the local concentrations, wereneglected and the hopper was modelled as a ‘blackbox’, which gave the possibility to implement thedynamics of the Camp model, using a virtual concentra-tion as an input to the model. Despite this simplificationthe results gave a high correlation between model andmeasurement.
These dynamics are not only important for under-standing the process and the influence of a change in aparameter during loading, but could be decisive whensimulating and optimising the loading process.
As introducing dynamics in the settlement research
Figure 9. Calculated vs measured overflow at trip 34 (case 3).
Abstract
A number of situations in the lagoon of Venice (Italy)require dredging to be carried out in the channels of thelagoon and harbour. But dredging leads to the problemof disposal. A pilot intervention to tackle this problem isone of the measures included in the General Plan ofInterventions (1991), drawn up by the Venice WaterAuthority and its Concessionaire (Consorzio VeneziaNuova, Venice), which are the responsible authoritiesfor improving the lagoon environment.
This intervention consists of dredging a basin located inthe Northern Industrial Channel of Marghera Harbour,in which sediment, potentially harmful to the environ-ment, has accumulated over time. This sediment isthen subject to mechanical treatment to separate thecontaminated and uncontaminated particles. The treat-ment is carried out at a plant in Malcontenta wheredredged material is thickened (dehydrated). This pur-pose-built plant will remain at the disposal of any publicbody operating in the lagoon, carrying out further inter-ventions, including dredging.
At the same time, the function of the basin with regardto harbour activity is being restored by deepening thechannel. These interventions are aimed at counter-acting the present trend towards erosion in the lagoon.
Introduction
It is widely known that there are a number of situationsin the lagoon of Venice (Italy) that require dredging tobe carried out in the channels of the lagoon andharbour. These operations can be set within the con-text of interventions for the protection of the lagoon,with different and complementary goals: – to favour the exchange of water volumes;– to reduce pollution in the channels and harbour
basins; and – to restore the depths required for navigation.
Dredging leads to the problem of the disposal of anysediment recovered. For reasons related to the protec-tion of the environment, specific regulations prohibitdisposal of sediment at sea, which, until recently, tookplace. The problem of disposal was tackled by theVenice Water Authority, which is responsible for thewaters of the lagoon, and by its concessionaireConsorzio Venezia Nuova, by looking into possibledestinations for dredged sediment, depending upon itscharacteristics (Figure 1).
When appropriate, this material is used profitably withinthe lagoon, i.e. to construct lagoon elements similar tothose typical of the lagoon itself (salt marshes, mudflats) or to restore the original configuration of islandswithin the lagoon, in accordance with the objectivesand methods defined in the programme for themorphological recovery of the lagoon itself. Theseinterventions are aimed at counteracting the presenttrend towards erosion in the lagoon.
INTERNATIONAL CONVENTIONS
There are a number of international conventions ratifiedby many countries, including Italy, aimed at preventingthe use of the sea as a disposal area for dredged mate-rial, harmful or otherwise. At the same time, theseconventions particularly encourage the useful re-employment of sediment, recommending thatdredging be limited to the quantities that are strictlynecessary. The first Convention, the London Conven-tion (LC-72), initially called the London DumpingConvention, 1972, and the Oslo and Paris Convention(OSPAR), 1992 revision, are based on the followingprinciples of “precaution“ (defined in the Rio Declara-tion on Environment and Development, 1992):
Terra et Aqua – Number 76 – September 1999
22
Maurizio Gentilomo
Mechanical Treatment of Dredged Material. The Malcontenta Plant in the Lagoon of Venice
Envi
ronm
ent

Which kinds of sediment are critical As mentioned earlier, although sediment is silt (silt isunderstood to be sediment in which the maximumdiameter of the smaller granules is 60 thousandths of amicron), it contains a fraction of sand which neverproves to be contaminated after separation from newlydredged sediment. This is usually described assediment as it is. It is the silt fraction (which is often thepredominant fraction) that may be contaminated.
Mechanical Treatment of Dredged Material. The Malcontenta Plant in the Lagoon of Venice
23
– “those responsible for polluting must pay” and– “sustainable use“.
Many “regional” Agreements were later added,including the Directive of the European Community,which follow these guidelines.
In 1996 a new Protocol was drawn up, as an Annex tothe LC-72, reversing the approach to the problem:Instead of banning the disposal of material at sea, thisProtocol included a list of substances that may bedisposed of at sea, including, at the top of the list,dredged material when “damage to the environment isminimal”.
If, however, sediment is contaminated the situationbecomes more complicated. In that case, there is acomplex question to be resolved: how and where toplace the dredged material permanently. This questionimplies solutions that are expensive and difficult tocarry out from an operational point of view. In fact thissediment, after undergoing appropriate treatment,must be transported to special deposits on land(disposal sites). It is important to point out that the“treatment” of contaminated sediment could introducea multiplication factor (as high as 100) to dredgingcosts.
MECHANICAL TREATMENT
How the characteristics of sediment are changed"Mechanical treatment" is a typical method for treatingsediment by separating any contaminated portionwhich in effect constitutes "waste", or by conditioningthe material as a whole.
In the first case, the treatment acts upon the granularsizes of the material, since polluting agents are linkedto the finer fragments, whereas sand fragments aresubstantially “clean”. Possible treatment consists of: – the use of hydro-cyclones to separate the sand by
centrifuge (this procedure is particularly advanta-geous if there is a high percentage of sand, whichcan then be re-employed ; furthermore, the separa-tion of the sand reduces the volume of material senton to the next phase of treatment);
– flotation, which consists of insufflating air into thesediment-water mixture: the insufflated air-bubblesbind with the micro-bubbles present amongst thefine fragments of sediment, which float to thesurface and can then be skimmed and separatedfrom the larger fragments.
In the second case, the water content of the sedimentis reduced. Obviously the contaminating substances, ifany, are not treated. This is achieved by various means,the more common of which "squeeze" the sediment infilter presses.
Maurizio Gentilomo is a Civil Engineer.Starting in 1969 he worked on behalfof Impregilo (Milan, Italy) and itsassociates as a site engineer and projectmanager. In 1987 he was appointedDeputy General Manager. From 1992-98, he was Deputy General Manager atConsorzio Venezia Nuova (CVN), theauthority which generally safeguardsthe Venice lagoon against flooding. He is presently owner of Technologos(Monza, Italy), a consulting companyproviding technical advice to CVN.
Maurizio Gentilomo
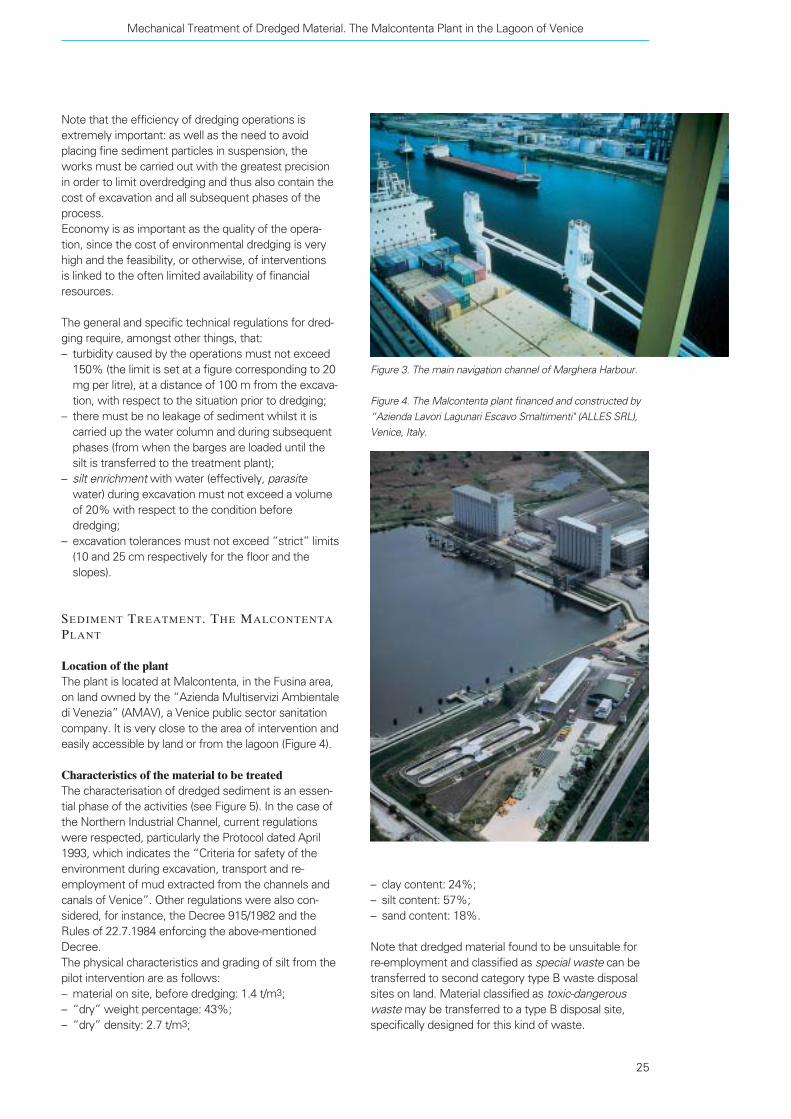
Figure 1. The area near Venice, the Northern IndustrialChannel of Marghera Harbour, where dredging took place, andwhere the sediment treatment plant is located.
NorthernIndustrialBassin
SedimentTreatmentPlant
Venice

Furthermore, when sediment is settled on the seabed,and even more, after dredging, it may present a veryhigh water content, and for this reason can only behandled taking special precautions:– the use of hermetically sealed mechanical buckets
(known as “ecological buckets”) or of special suctionheads;
– hydraulic transfer (the transfer of granular materialmixed with water) through pipes under pressure ortransfer by barges; and
– deposit within watertight basins.
All this implies the use of machinery and equipmentfitted with devices (operational: hardware, software;servomechanisms) aimed at preventing the leakage offiner sediment particles and the dispersion of anycontaminating substances during operations, as well asreducing the turbidity of the water in which suchoperations are carried out. To this end, purpose-built“screens or membranes” (mobile floating separatingelement) are positioned around the excavatingequipment – floating machinery or equipment for theexcavation of soil from the bed of a body of water –when in use.
Continual and systematic monitoring, during and afterdredging, are essential phases of the operations, usingmotorboats, for instance, equipped with the samecomputerised systems used to position dredges. Alldata is memorised automatically so that it can be elabo-rated and used reliably.
THE INTERVENTION IN THE NORTHERN
INDUSTRIAL CHANNEL OF MARGHERA
HARBOUR
Aim of the intervention and methods of executionSince this report concerns the mechanical treatment of
dredged material, it examines, in particular, a first pilotdredging operation in the lagoon of Venice (Figure 2),which involved this kind of sediment treatment (1997).The treatment is carried out at a plant where dredgedmaterial is thickened (dehydrated). This purpose-builtplant will remain at the disposal of any public bodyoperating in the lagoon, carrying out further inter-ventions, including dredging.
Note that in the past maintenance work at MargheraHarbour has been insufficient and therefore approxi-mately 5 million cubic metres of sediment have accu-mulated over time. At present, it has been calculatedthat 300,000 cubic metres per year need to be dredgedfor ordinary maintenance; a consistent part of thesediment will require treatment.
This pilot intervention is one of the measures includedin the General Plan of Interventions (1991), drawn upby the Venice Water Authority and its Concessionaire(Consorzio Venezia Nuova, Venice), aimed at improvingthe lagoon environment. This intervention consists ofdredging a basin located in the Northern IndustrialChannel of Marghera Harbour (Figure 3), in whichsediment, potentially harmful to the environment, hasaccumulated over time. At the same time, the functionof the basin with regard to harbour activity is restoredby deepening the channel. From an operational view-point, the works will bring the channel bed to a depthof –8 m after the removal of a layer of sedimentapproximately 2 m thick (around 90,000 m3, measuredat the site).
It was mentioned earlier that the dredging operations inthe Northern Industrial Channel have the characteristicsof a pilot intervention. In fact, this work is intended notonly to carry out an intervention aimed at improving thequality of the lagoon system, but also:– to ascertain which setbacks (if any) might occur
during the process (excavation, transport, treatment,transfer of sediment to the final destination); and
– to draw up safety criteria for dredging operations inthe other areas of the lagoon, including the harbourchannels (in other words, compatible with thepertinent national and local regulations and with theparticular requirements of the lagoon environment).
Since the safety of the environment during sedimentdredging operations cannot be limited only to the phaseof mechanical treatment, but must regard the entirecycle of operations, special precautions must be takenduring the excavation of sediment (using efficient andecological techniques to remove the material) and itssubsequent transfer (for example, mud – that is,sediment – must be discharged into the barges with nospray; an abundant margin must be left between theopen surface of the mud load and the upper rim of thebarge tanks), deposit, treatment and delivery to thedisposal site.
Terra et Aqua – Number 76 – September 1999
24
Figure 2. Aerial view of the site of the pilot dredging works in the Northern Industrial Channel of Marghera Harbour.
– clay content: 24%;– silt content: 57%;– sand content: 18%.
Note that dredged material found to be unsuitable forre-employment and classified as special waste can betransferred to second category type B waste disposalsites on land. Material classified as toxic-dangerouswaste may be transferred to a type B disposal site,specifically designed for this kind of waste.
Note that the efficiency of dredging operations isextremely important: as well as the need to avoidplacing fine sediment particles in suspension, theworks must be carried out with the greatest precisionin order to limit overdredging and thus also contain thecost of excavation and all subsequent phases of theprocess.Economy is as important as the quality of the opera-tion, since the cost of environmental dredging is veryhigh and the feasibility, or otherwise, of interventionsis linked to the often limited availability of financialresources.
The general and specific technical regulations for dred-ging require, amongst other things, that:– turbidity caused by the operations must not exceed
150% (the limit is set at a figure corresponding to 20mg per litre), at a distance of 100 m from the excava-tion, with respect to the situation prior to dredging;
– there must be no leakage of sediment whilst it iscarried up the water column and during subsequentphases (from when the barges are loaded until thesilt is transferred to the treatment plant);
– silt enrichment with water (effectively, parasitewater) during excavation must not exceed a volumeof 20% with respect to the condition beforedredging;
– excavation tolerances must not exceed “strict” limits(10 and 25 cm respectively for the floor and theslopes).
SEDIMENT TREATMENT. THE MALCONTENTA
PLANT
Location of the plantThe plant is located at Malcontenta, in the Fusina area,on land owned by the “Azienda Multiservizi Ambientaledi Venezia” (AMAV), a Venice public sector sanitationcompany. It is very close to the area of intervention andeasily accessible by land or from the lagoon (Figure 4).
Characteristics of the material to be treatedThe characterisation of dredged sediment is an essen-tial phase of the activities (see Figure 5). In the case ofthe Northern Industrial Channel, current regulationswere respected, particularly the Protocol dated April1993, which indicates the “Criteria for safety of theenvironment during excavation, transport and re-employment of mud extracted from the channels andcanals of Venice”. Other regulations were also con-sidered, for instance, the Decree 915/1982 and theRules of 22.7.1984 enforcing the above-mentionedDecree.The physical characteristics and grading of silt from thepilot intervention are as follows:– material on site, before dredging: 1.4 t/m3;– “dry” weight percentage: 43%;– “dry” density: 2.7 t/m3;
Mechanical Treatment of Dredged Material. The Malcontenta Plant in the Lagoon of Venice
25
Figure 3. The main navigation channel of Marghera Harbour.
Figure 4. The Malcontenta plant financed and constructed by“Azienda Lavori Lagunari Escavo Smaltimenti" (ALLES SRL),Venice, Italy.
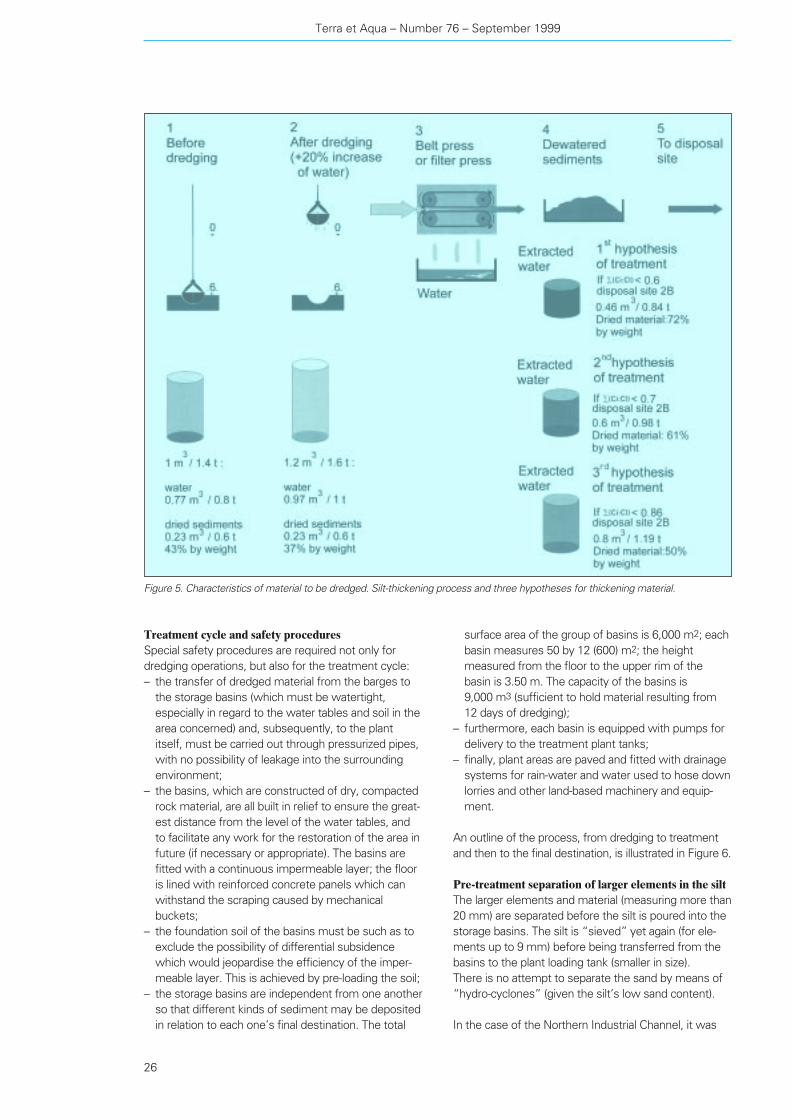
surface area of the group of basins is 6,000 m2; eachbasin measures 50 by 12 (600) m2; the heightmeasured from the floor to the upper rim of thebasin is 3.50 m. The capacity of the basins is 9,000 m3 (sufficient to hold material resulting from 12 days of dredging);
– furthermore, each basin is equipped with pumps fordelivery to the treatment plant tanks;
– finally, plant areas are paved and fitted with drainagesystems for rain-water and water used to hose downlorries and other land-based machinery and equip-ment.
An outline of the process, from dredging to treatmentand then to the final destination, is illustrated in Figure 6.
Pre-treatment separation of larger elements in the siltThe larger elements and material (measuring more than20 mm) are separated before the silt is poured into thestorage basins. The silt is “sieved” yet again (for ele-ments up to 9 mm) before being transferred from thebasins to the plant loading tank (smaller in size). There is no attempt to separate the sand by means of“hydro-cyclones” (given the silt’s low sand content).
In the case of the Northern Industrial Channel, it was
Terra et Aqua – Number 76 – September 1999
26
Treatment cycle and safety procedures Special safety procedures are required not only fordredging operations, but also for the treatment cycle:– the transfer of dredged material from the barges to
the storage basins (which must be watertight,especially in regard to the water tables and soil in thearea concerned) and, subsequently, to the plantitself, must be carried out through pressurized pipes,with no possibility of leakage into the surroundingenvironment;
– the basins, which are constructed of dry, compactedrock material, are all built in relief to ensure the great-est distance from the level of the water tables, andto facilitate any work for the restoration of the area infuture (if necessary or appropriate). The basins arefitted with a continuous impermeable layer; the flooris lined with reinforced concrete panels which canwithstand the scraping caused by mechanicalbuckets;
– the foundation soil of the basins must be such as toexclude the possibility of differential subsidencewhich would jeopardise the efficiency of the imper-meable layer. This is achieved by pre-loading the soil;
– the storage basins are independent from one anotherso that different kinds of sediment may be depositedin relation to each one’s final destination. The total
Figure 5. Characteristics of material to be dredged. Silt-thickening process and three hypotheses for thickening material.
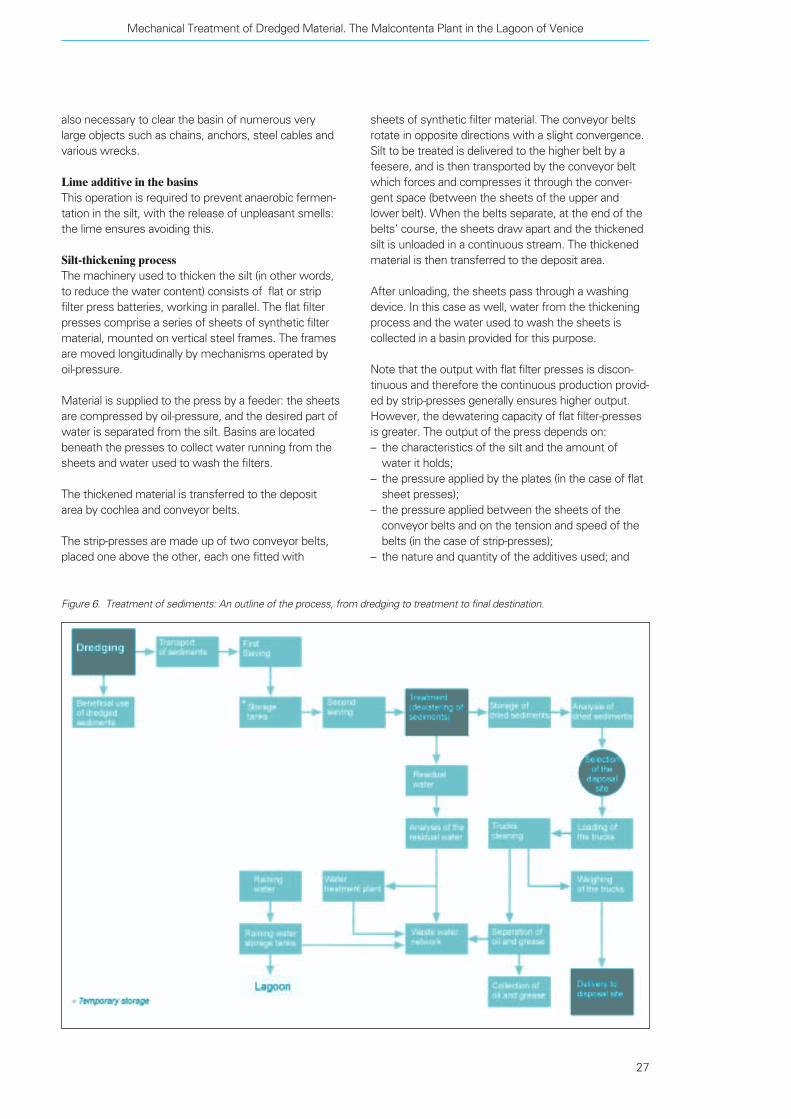
sheets of synthetic filter material. The conveyor beltsrotate in opposite directions with a slight convergence.Silt to be treated is delivered to the higher belt by afeesere, and is then transported by the conveyor beltwhich forces and compresses it through the conver-gent space (between the sheets of the upper andlower belt). When the belts separate, at the end of thebelts’ course, the sheets draw apart and the thickenedsilt is unloaded in a continuous stream. The thickenedmaterial is then transferred to the deposit area.
After unloading, the sheets pass through a washingdevice. In this case as well, water from the thickeningprocess and the water used to wash the sheets iscollected in a basin provided for this purpose.
Note that the output with flat filter presses is discon-tinuous and therefore the continuous production provid-ed by strip-presses generally ensures higher output.However, the dewatering capacity of flat filter-pressesis greater. The output of the press depends on:– the characteristics of the silt and the amount of
water it holds;– the pressure applied by the plates (in the case of flat
sheet presses);– the pressure applied between the sheets of the
conveyor belts and on the tension and speed of thebelts (in the case of strip-presses);
– the nature and quantity of the additives used; and
also necessary to clear the basin of numerous verylarge objects such as chains, anchors, steel cables andvarious wrecks.
Lime additive in the basinsThis operation is required to prevent anaerobic fermen-tation in the silt, with the release of unpleasant smells:the lime ensures avoiding this.
Silt-thickening processThe machinery used to thicken the silt (in other words,to reduce the water content) consists of flat or stripfilter press batteries, working in parallel. The flat filterpresses comprise a series of sheets of synthetic filtermaterial, mounted on vertical steel frames. The framesare moved longitudinally by mechanisms operated byoil-pressure.
Material is supplied to the press by a feeder: the sheetsare compressed by oil-pressure, and the desired part ofwater is separated from the silt. Basins are locatedbeneath the presses to collect water running from thesheets and water used to wash the filters.
The thickened material is transferred to the depositarea by cochlea and conveyor belts.
The strip-presses are made up of two conveyor belts,placed one above the other, each one fitted with
Mechanical Treatment of Dredged Material. The Malcontenta Plant in the Lagoon of Venice
27
Figure 6. Treatment of sediments: An outline of the process, from dredging to treatment to final destination.

– the efficiency of flocculation (the process by whichthe solid material held in water is aggregated by theaction of chemical and biological agents. The granu-les formed by this process may then be separatedfrom the water).
One automatic strip-press and two automatic flatsheet-press have been installed at the Malcontentaplant. The treatment capacity is 500 m3 per day ofdredged material as it is (which corresponds to 600 m3
delivered by the barges, considering a “parasite” water“enrichment” of 20%) for an output of 300 m3 ofdewatered material, working 24 hours a day, five daysa week.
The plant’s capacity is therefore equal to the dailyoutput of the dredger. Four 150 m3 barges per dayensure the supply of silt, and each barge is expected totake one hour to unload.
After mechanical treatment, the silt must present a“dry” weight of no less than 50% that of the materialprior to excavation. Poli-electrolytic additives (in quanti-ties of less than 1%) acting as flocculants are added tothe silt, by a suitable meter-feeder, before it enters thepresses.
The plant includes, amongst other items: – pumps and systems for transporting the dewatered
silt to the deposit;– air compressors (for maintenance of the presses);
and– a general control panel.
After passing through the presses, the material iscollected in tanks and deposited in a protected area ofthe plant large enough to store the results of 2 or 3days of production. This limits any discontinuity in thedischarge of material to external disposal areas (there isa pause over the weekend) and allows the quality ofthe material to be ascertained with a view to its finaldestination. In relation to these requirements, thedeposit has a capacity of 1,500 m3.
The controls and analyses are carried out on the dewa-tered material with a frequency established beforehand(every 500 tonnes of thickened material, after a day of“maturation”) according to IRSA-CNR regulations(Istituto di Ricerca Sulle Acque-Consiglio Nazionaledelle Ricerche – Institute for Research on Water-National Research Council).
Every day, five days a week, 700 tonnes of material aretransferred to the deposit. Lorries used to transport thematerial are weighed and hosed down before leavingthe plant. Water running from the presses is channelledto a storage tank from which it is then discharged intothe sewage system, if possible, or channelled to apurpose-built purification plant. This plant is still a part of
the silt treatment cycle even if it is located at a distancefrom the treatment plant, and in this case the water isstill discharged into the sewage system after purifica-tion.
It is interesting to point out that although it mightappear advantageous to dehydrate the material asmuch as possible, this is not the case. A high level ofdehydration could intensify the concentration of anycontaminating substances, and as a result the treatedmaterial could fall into one of the more dangerouscategories (the most harmful of which can be con-sidered as toxic and dangerous waste): the cost oftransferring dangerous toxic waste to disposal siteswould be much higher and would not be compensatedby the reduced weight of the material. On the otherhand, if the sediment was toxic and dangerous prior todredging, it would be advantageous to intensifydehydration as much as possible.
Figure 5 illustrates three hypotheses for thickeningmaterial with respect to the as it is condition, as well asthe relative indices of admissibility to type B categorywaste sites. As mentioned previously, the materialfrom the North Industrial Channel is to be concentratedby an average of 60%. With this solution the thickenedoutput is 300 m3 per day, corresponding to around 500 tonnes; 300 m3 of water are sent for purificationand channelled into the sewage system.
Auxiliary systems and networks at the plantBesides the items mentioned above, the servicebuildings also represent an essential component of theplant; the sheds and covered areas; the remote sys-tems that govern the process; equipment for analysesand control; the maintenance workshop; the electricalsystems; the water networks, including those fordrinking water, industrial and waste waters; com-pressed air delivery systems; the equipment forweighing lorries; illumination; fencing; gateway, andsuch.
Operation of the plant Activities for the plant’s operation, beginning withmonitoring, must respect the principles and regulationrequirements aimed at protecting the health of workersunder the guidance of the site manager and the safetyofficer.It should be pointed out once again that during treat-ment of the silt and the transfer of thickened silt fromthe plant, there must be no leakage of silt or water tothe surrounding environment.
Transfer of treated silt to disposal sitesAfter treatment, the silt is sent to land disposal sites ofthe appropriate category. Note that, considering allpossible solutions and not those limited to cases in thelagoon of Venice, the envisaged destinations are thefollowing:
Terra et Aqua – Number 76 – September 1999
28

particularly in Europe, albeit on a smaller scale for thetime being, with which the treatment of sediment, at areasonable cost, represents a crucial stage in an overallprocess that goes much further than the mere dehydra-tion of silt.
In fact, it has become clear that in addition to the objec-tives of maintaining harbour activities and fulfillingenvironmental goals, the preferable objective – if andinsofar as is compatible with the quality of the sedi-ment – is the useful employment of dredged sedimentfor the reconstruction of the lagoon morphology, whilstkeeping the cost to a minimum by reducing (by dehy-dration) the volumes of material to be transported tospecial disposal sites on land.
References
Burt, TN and Fletcher, CA. “Dredged Material Disposal in the Sea”. University of Gdansk,
Poland. September 1996. Republished in Terra et Aqua, nr 66,
March 1997.
Italian Rules and Legislation. Decree 915/1982; Deliberation of
22.7.1984 (Implementation Committee of Decree 915/1982);
Decree 22/1997; Acts 319/1976 and 360/1991; Protocol 18.4.1993
(concerning the safety of the environment, transport and
employment of mud dredged from the canals and channels of
Venice).
London Convention (LC 1972) and Protocol to the London
Convention (Dredged Material Assessment Framework). 1996.
Oslo and Paris Convention (OSPAR). 1992. (A fusion of the
Oslo Convention for the Prevention of Marine Pollution by
Dumping from Ships and Aircrafts, 1972 and Paris Convention
for the Prevention of Marine Pollution from Land-based Sour-
ces, 1974).
PIANC-International Navigation Association.“Manutenzione e trattamento dei materiali di dragaggio
contaminati”. Volume 1, Suppl. al Bollettino n. 93.
Brussels, Belgium.1997.
Second category type B disposal sites for specialwaste: these may receive thickened silt containingorganic syntesis substances (the concentration of eachof these substances must not exceed the limit by1/100th). Each metal in the material as it is must not bepresent in a concentration higher than the upper limitand the sum ratios (�Ci:Cl, where Ci = actual concen-tration and Cl = upper limit of concentration) must belower than 1. After transfer tests, in accordance withthe IRSA-CNR regulations, the presence of heavymetals must be 10 times lower than the values given inthe table (Italian Rules, Act 319/1976); the sum ratiosmust be lower than 30.
Second category type B disposal sites for toxic anddangerous waste: these may receive thickened siltcontaining organic synthesis substances within thelimits set out in the previous case; metals in the mate-rial as it is in concentrations above the upper limit, evenwith sum ratios greater than 1; the limits of the pre-vious case apply for eluates (interstitial waters thatmight be released together with concentrations ofcontaminated substances).
Second category type C disposal sites: these mayreceive concentrated silt containing organic synthesissubstances within the limits described in the previouscases; metals in the material as it is and eluateswithout limits.
Tipper lorries with watertight bodies, covered withsuitable tarpaulins, must be used to transport silt fromthe plant to the disposal site.
Conclusions
The Malcontenta plant demonstrates that the problemsposed by the need to improve the quality of theenvironment in the lagoon of Venice have been tackleddecisively. Steps have been taken in the right directionby the Venice Water Authority and the ConcessionaireConsorzio Venezia Nuova, in full agreement with otheradministrations which include the Veneto RegionalAuthority, the Ministry of Public Works-MaritimeWorks, the Ministry of the Environment, the localAuthorities of Venice and Chioggia, the VeniceProvincial Authority, the Port Authority and the localHealth Authority.
From an operational viewpoint, the business initiativeundertaken by AMAV of Venice, Società “Impregilo”(Milano) and “Mantovani” (Padova) was decisive: thesecompanies created “Azienda Lavori Lagunari EscavoSmaltimenti" (ALLES SRL), Venice, which assumed thetask of financing and constructing the Malcontentaplant.
Their path followed the experience of existing plants,
Mechanical Treatment of Dredged Material. The Malcontenta Plant in the Lagoon of Venice
29

Offshore Europe 99Aberdeen, Scotland
September 7-10 1999
Offshore Europe 99, an Oil and Gas Exhibition andConference, will examine the offshore industry on thebrink of the 21st century. This biennial event attractsindustry professionals from the countries involved inexploration and production, including the UK, Norway,The Netherlands and Denmark on the NorthwestEuropean Continental Shelf, France and Italy in theMediterranean, and Spain in the Atlantic. The enor-mous technological expertise represented by these andsurrounding countries will be demonstrated at thisconference.
For further information contact:Offshore Europe PartnershipOcean House, 50 Kingston RoadNew Malden, Surrey KT3 3LZ, UKtel. +44 181 949 9222, fax +44 181 949 8186/8193email: [email protected]://www.offshore-europe.co.uk
Val Johnston-JonesSociety of Petroleum EngineersEmpire House, 4th Floor, 175 PiccadillyLondon W1V 9DB, UKtel. +44 171 408 4466, fax +44 171 408 2299email: [email protected]
12th International Harbour CongressTechnological Institute,
Antwerp, BelgiumSeptember 12-16 1999
The Royal Flemish Society of Engineers, Section onHarbour Techniques, is organising a 4-day congress tobe held together with the 9th International HarbourExhibition. The topics will include: Port planning; portinfrastructure design; port construction; and portaccess in offshore, coastal and non-coastal harbours.There will also be a workshop on “Information Data
Network - Vessel Traffic System”. The congress will befollowed by the 4th International CATS Congress fromSeptember 15-17, 1999 on the Characterisation andTreatment of Sediments.
For further information contact:12th International Harbour Congress, Att: Ms Rita Peysc/o Technologisch Instituut vzwDesguinlei 214, B-2018 Antwerp, Belgiumtel. +32 3 216 0996/ fax +32 3 216 0689email: [email protected]://www.ti.kviv.be/conf/have.hmt
CATS 4Technological Institute,
Antwerp, BelgiumSeptember 15-17 1999
The Fourth Congress on Characteristation andTreatment of Sediments (CATS 4) is organised by theTechnological Institute of the Royal Flemish Society ofEngineers, Sections on Environmental Technology andHarbour Techniques. The congress will be preceded bythe 12th International Harbour Congress (September12-16).
Topics will include: Sediment and dredged materialcharacterisation; source control and sediment manage-ment; dredging technology, focussing on contaminatedsediments; sustainable relocation and beneficial use;treatment and disposal technologies; environmentalrisk and environmental merits analysis; impact asses-sment, management and control; and strategies forsustainable management.
For further information contact:CATS 4, Att: Ms Rita Peysc/o Technologisch Instituut vzwDesguinlei 214, B-2018 Antwerp, Belgiumtel. +32 3 216 0996/ fax +32 3 216 0689email: [email protected]://www.ti.kviv.be/conf/cats.hmt
Terra et Aqua – Number 76 – September 1999
30
Seminars/Conferences/Events
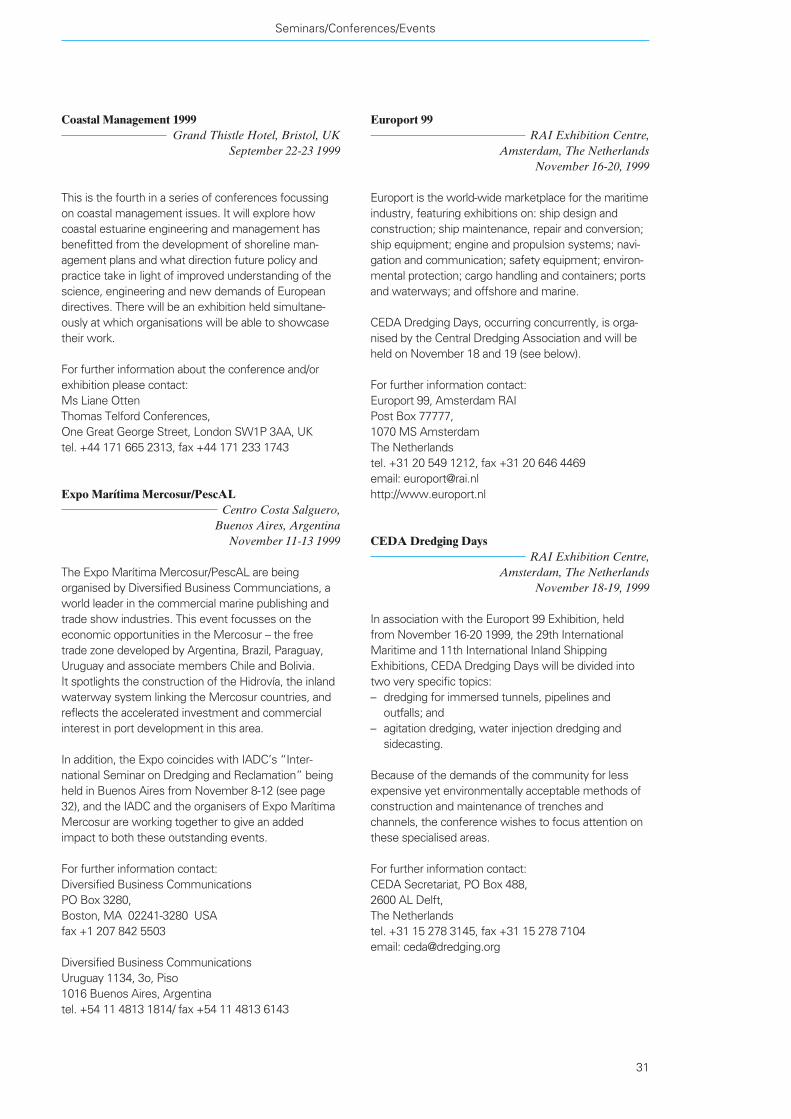
Seminars/Conferences/Events
31
Europort 99RAI Exhibition Centre,
Amsterdam, The NetherlandsNovember 16-20, 1999
Europort is the world-wide marketplace for the maritimeindustry, featuring exhibitions on: ship design andconstruction; ship maintenance, repair and conversion;ship equipment; engine and propulsion systems; navi-gation and communication; safety equipment; environ-mental protection; cargo handling and containers; portsand waterways; and offshore and marine.
CEDA Dredging Days, occurring concurrently, is orga-nised by the Central Dredging Association and will beheld on November 18 and 19 (see below).
For further information contact:Europort 99, Amsterdam RAIPost Box 77777, 1070 MS AmsterdamThe Netherlandstel. +31 20 549 1212, fax +31 20 646 4469email: [email protected]://www.europort.nl
CEDA Dredging DaysRAI Exhibition Centre,
Amsterdam, The NetherlandsNovember 18-19, 1999
In association with the Europort 99 Exhibition, heldfrom November 16-20 1999, the 29th InternationalMaritime and 11th International Inland ShippingExhibitions, CEDA Dredging Days will be divided intotwo very specific topics:– dredging for immersed tunnels, pipelines and
outfalls; and– agitation dredging, water injection dredging and
sidecasting.
Because of the demands of the community for lessexpensive yet environmentally acceptable methods ofconstruction and maintenance of trenches andchannels, the conference wishes to focus attention onthese specialised areas.
For further information contact:CEDA Secretariat, PO Box 488, 2600 AL Delft, The Netherlandstel. +31 15 278 3145, fax +31 15 278 7104email: [email protected]
Coastal Management 1999Grand Thistle Hotel, Bristol, UK
September 22-23 1999
This is the fourth in a series of conferences focussingon coastal management issues. It will explore howcoastal estuarine engineering and management hasbenefitted from the development of shoreline man-agement plans and what direction future policy andpractice take in light of improved understanding of thescience, engineering and new demands of Europeandirectives. There will be an exhibition held simultane-ously at which organisations will be able to showcasetheir work.
For further information about the conference and/orexhibition please contact:Ms Liane OttenThomas Telford Conferences, One Great George Street, London SW1P 3AA, UKtel. +44 171 665 2313, fax +44 171 233 1743
Expo Marítima Mercosur/PescALCentro Costa Salguero,
Buenos Aires, ArgentinaNovember 11-13 1999
The Expo Marítima Mercosur/PescAL are beingorganised by Diversified Business Communciations, aworld leader in the commercial marine publishing andtrade show industries. This event focusses on theeconomic opportunities in the Mercosur – the freetrade zone developed by Argentina, Brazil, Paraguay,Uruguay and associate members Chile and Bolivia. It spotlights the construction of the Hidrovía, the inlandwaterway system linking the Mercosur countries, andreflects the accelerated investment and commercialinterest in port development in this area.
In addition, the Expo coincides with IADC’s “Inter-national Seminar on Dredging and Reclamation” beingheld in Buenos Aires from November 8-12 (see page32), and the IADC and the organisers of Expo MarítimaMercosur are working together to give an addedimpact to both these outstanding events.
For further information contact:Diversified Business CommunicationsPO Box 3280, Boston, MA 02241-3280 USAfax +1 207 842 5503
Diversified Business CommunicationsUruguay 1134, 3o, Piso1016 Buenos Aires, Argentinatel. +54 11 4813 1814/ fax +54 11 4813 6143

Terra et Aqua – Number 76 – September 1999
32
Day 1: Why Dredging?The Need for Dredging/Project Phasing
Day 2: What is Dredging?Dredging Equipment/Survey Systems (includes a Site Visit)
Day 3: How Dredging?Dredging Projects
Day 4: Preparation of DredgingContract
Day 5: Cost/Pricing and Contracts
Representatives of port authorities, companies, and individuals interested in attending are requested to complete the preliminary registration form below as soon as possible and prior to October 1, 1999, and return to:IADC Secretariat, Duinweg 21,2585 JV The Hague, The Netherlandstel. +31 70 352 3334, fax +31 70 351 2654e-mail: [email protected]
Place: Buenos Aires, ArgentinaDate: November 8-12, 1999
In cooperation with the Universidad Nacional de LaPlata and Estudio de Ingenieria Hidraulica S.A., theInternational Association of Dredging Companies isagain pleased to organise in Buenos Aires an intensive,one week seminar on dredging and reclamation. This seminar has been successfully presented formany years both in Delft, The Netherlands with theInternational Institute for Hydraulic Engineering, and inSingapore with the National University of Singapore andthe Applied Research Corporation.The costs are US$ 3250, which include six nightsaccommodation at the conference hotel, breakfast andlunch daily, one special participants dinner, and a generalinsurance for the week.
The seminar includes workshops and a site visit to adredging project. Highlights of the programme are:
International Seminar onDredging and Reclamation
(please print)
Name ..........................................................................................................................................................................
Title ..........................................................................................................................................................................
Company ..........................................................................................................................................................................
Address ..........................................................................................................................................................................
..........................................................................................................................................................................
Tel. ................................................................................... Fax ...............................................................................
E-mail ..........................................................................................................................................................................
Please send this form and your deposit by cheque or credit card for US$ 500 in order to guarantee your place atthe seminar. Upon receipt of this form and your deposit your place in the seminar is confirmed. We will then sendyou further detailed information, final registration forms, and an invoice for the correct amount.
Without your deposit we cannot guarantee your place and accommodations at the seminar.
�� A Cheque is enclosed.
�� Please charge my credit card:
�� American Express �� Eurocard/Master Card �� Diners Club
Account no.:
Expiry date:
Signature .............................................................................................................. Date ................................................
VISIT EXPO MARITIMA MERCOSUR, BUENOS AIRES, NOV. 11-13 1999

AfricaBoskalis South Africa (Pty.) Ltd., Capetown, South AfricaBoskalis Togo Sarl., Lomé, TogoBoskalis Westminster Cameroun Sarl., Douala, CamerounBoskalis Zinkcon (Nigeria) Ltd., Lagos, NigeriaDredging International Services Nigeria Ltd., Lagos, NigeriaHAM Dredging (Nigeria) Ltd., Ikeja, NigeriaNigerian Dredging and Marine Ltd., Apapa, NigeriaWestminster Dredging (Nigeria) Ltd., Lagos, Nigeria
The AmericasACZ Marine Contractors Ltd., Brampton, Ont., CanadaBeaver Dredging Company Ltd., Calgary, Alta., CanadaDragamex SA de CV, Coatzacoalcos, MexicoGulf Coast Trailing Company, New Orleans, LA, USAHAM Caribbean Office, Curaçao, NANorham/Dragagens, Rio de Janeiro, BrazilStuyvesant Dredging Company, Metairie, LA, USAUscodi, Wilmington, DE, USA
AsiaBallast Nedam Malaysia Ltd., Kuala Lumpur, MalaysiaBallast Nedam Dredging, Hong Kong Branch, Hong KongBoskalis International BV., Hong KongBoskalis International Far East, SingaporeBoskalis Taiwan Ltd., Hualien, TaiwanDredging International Asia Pacific (Pte) Ltd., SingaporeDredging International N.V., Hong KongDredging International N.V., SingaporeFar East Dredging Ltd., Hong KongHAM Dredging (M) Sdn Bhd, Kuala Lumpur, MalaysiaHAM East Asia Pacific Branch, Taipei, TaiwanHAM Hong Kong Office, Wanchai, Hong KongHAM Philippines, Metro Manila, PhilippinesHAM Singapore Branch, SingaporeHAM Thai Ltd., Bangkok, ThailandJan De Nul Singapore Pte. Ltd., SingaporeMumbai Project Office, Mumbai, IndiaPT Penkonindo, Jakarta, IndonesiaTideway DI Sdn. Bhd., Selangor, MalaysiaVan Oord ACZ B.V., Dhaka, BangladeshVan Oord ACZ B.V., Hong KongVan Oord ACZ B.V., SingaporeVan Oord ACZ Overseas B.V., Karachi, PakistanZinkcon Marine Malaysia Sdn. Bhd., Kuala Lumpur, MalaysiaZinkcon Marine Singapore Pte. Ltd., Singapore
Middle EastBoskalis Westminster Al Rushaid Ltd., Dhahran, Saudi ArabiaBoskalis Westminster M.E. Ltd., Abu Dhabi, UAEDredging International N.V., Middle East, DubaiDredging International N.V., Tehran Branch, Tehran, IranGulf Cobla (Limited Liability Company), Dubai, UAEHAM Dredging Company, Abu Dhabi, UAEHAM Saudi Arabia Ltd., Damman, Saudi ArabiaJan De Nul Dredging, Abu Dhabi, UAEVan Oord ACZ Overseas BV., Abu Dhabi, UAE
AustraliaCondreco Pty. Ltd., Milton, QLD., AustraliaDredeco Pty. Ltd., Brisbane, QLD., AustraliaNew Zealand Dredging & General Works Ltd., Wellington
Van Oord ACZ B.V., Victoria, AustraliaWestHam Dredging Co. Pty. Ltd., Sydney, NSW, Australia
EuropeACZ Ingeniører & Entreprenører A/S, Copenhagen, DenmarkAnglo-Dutch Dredging Company Ltd., Beaconsfield,United KingdomA/S Jebsens ACZ, Bergen, NorwayAtlantique Dragage S.A., Nanterre, FranceBaggermaatschappij Boskalis B.V., Papendrecht, NetherlandsBaggermaatschappij Breejenbout B.V., Rotterdam, NetherlandsBallast Nedam Bau- und Bagger GmbH, Hamburg, GermanyBallast Nedam Dredging, Zeist, NetherlandsBallast Nedam Dragage, Paris, FranceBoskalis Dolman B.V., Dordrecht, NetherlandsBoskalis International B.V., Papendrecht, NetherlandsBoskalis B.V., Rotterdam, NetherlandsBoskalis Westminster Aannemers N.V., Antwerp, BelgiumBoskalis Westminster Dredging B.V., Papendrecht, NetherlandsBoskalis Westminster Dredging & Contracting Ltd., CyprusBoskalis Zinkcon B.V., Papendrecht, NetherlandsBrewaba Wasserbaugesellschaft Bremen mbH, Bremen, GermanyCEI Construct NV, Afdeling Bagger- en Grondwerken, Zele, BelgiumDelta G.m.b.H., Bremen, GermanyDraflumar SA., Neuville Les Dieppe, FranceDragados y Construcciones S.A., Madrid, SpainDravo S.A., Madrid, SpainDredging International N.V., Madrid, SpainDredging International N.V., Zwijndrecht, BelgiumDredging International Scandinavia NS, Copenhagen, DenmarkDredging International (UK), Ltd., Weybridge, United KingdomEnka-Boskalis, Istanbul, TurkeyEspadraga, Los Alcázares (Murcia), SpainHAM Dredging Ltd., Camberley, United KingdomHAM, dredging and marine contractors, Capelle a/d IJssel,NetherlandsHAM-Van Oord Werkendam B.V., Werkendam, NetherlandsHeinrich Hirdes G.m.b.H., Hamburg, GermanyHolland Dredging Company, Papendrecht, NetherlandsJan De Nul N.V., Aalst, BelgiumJan De Nul Dredging N.V., Aalst, BelgiumJan De Nul (U.K.) Ltd., Ascot, United KingdomNordsee Nassbagger- und Tiefbau GmbH, Wilhelmshaven,GermanyN.V. Baggerwerken Decloedt & Zoon, Brussels, BelgiumS.A. Overseas Decloedt & Fils, Brussels, BelgiumSider-Almagià S.p.A., Rome, ItalySkanska Dredging AB, Gothenborg, SwedenSociedade Portuguesa de Dragagens Lda., Lisbon, PortugalSociedad Española de Dragados SA., Madrid, SpainSocietà Italiana Dragaggi SpA. “SIDRA”, Rome, ItalySociété de Dragage International “S.D.I.” S.A., Marly le Roi, FranceSodranord SARL, Paris, FranceTideway B.V., Breda, NetherlandsVan Oord ACZ B.V., Gorinchem, NetherlandsVan Oord ACZ Ltd., Newbury, United KingdomWasserbau ACZ GmbH, Bremen, GermanyWestminster Dredging Co. Ltd., Fareham, United KingdomZanen Verstoep B.V., Papendrecht, NetherlandsZinkcon Contractors Ltd., Fareham, United KingdomZinkcon Dekker B.V., Rotterdam, NetherlandsZinkcon Dekker Wasserbau GmbH, Bremen, Germany
Membership List IADC 1999Through their regional branches or through representatives, members of IADC operate directly at all locations worldwide.

INTERNATIONAL ASSOCIATION OF DREDGING COMPANIES
Duinweg 21 - 2585 JV The Hague - The Netherlands