Embed Size (px)
Citation preview

INTERNATIONAL MIGRATION MOVEMENTS IN THE WAVES OF GLOBALIZATION1
Meriç SUBAŞI ERTEKİN2 Betül YÜCE DURAL3
ABSTRACT Increasing the international mobility of people is an important aspect of globalization, and the relation-ship between globalization and migration emerges as an important area of inquiry. This study aims to examine trends in international migration throughout the three waves of globalization, namely the waves of free trade, the free movement of people and capital, and the economic integration of national econo-mies by means of the literature and statistical data. The results of the study show that, flows of migration in the first stages of globalization and current flows of migration differ from one another in terms of the direction, structure and policies of migration.
Keywords: International migration, Globalization, Globalization waves
JEL Classification: F22, F15, J61
KÜRESELLEŞME DALGALARI VE ULUSLARARASI GÖÇ HAREKETLERİ
ÖZ İnsanların artan uluslararası hareketliliği küreselleşmenin önemli bir yönünü oluşturduğundan, küresel-leşme ve göç arasındaki ilişkinin incelenmesi önem taşımaktadır. Bu çalışmada, literatür ve istatistiki veriler ele alınarak serbest ticaret, serbest sermaye hareketliliği ve göç ile ulusal ekonomilerin ekonomik bütünleşmesi olarak görülen küreselleşmenin üç dalgası esnasında uluslararası göçün nasıl bir değişim izlediğinin gösterilmesi amaçlanmaktadır. Çalışmanın sonucunda küreselleşmenin ilk aşamalarında göz-lenen göç hareketleri ile günümüzdeki göç hareketlerinin yönünün, yapısının ve politikalarının farklılaştı-ğı görülmektedir.
Anahtar kelimeler: Uluslararası göç, Küreselleşme, Küreselleşme dalgaları JEL Sınıflandırması: F22, F15, J61
1 This study is the revised version of the unpublished paper presented at the ICOPEC 2011-International Conference of Political Economy organized by Kocaeli University between 15-17 September 2011 in Kocaeli. The original language of the paper as presented was Turkish. 2 Associate Professor., Anadolu Üniversitesi, İİBF, [email protected] 3 Assistant Professor., Anadolu Üniversitesi, İİBF, [email protected]
46 International Journal of Economic and Administrative Studies
Year:5 Number 10, Winter 2013 ISSN 1307-9832
1. Introduction
Every country is faced with the process of economic globalization. The re-structuring of production, with the domestic and external debts, has created the need for countries to obtain a place in the international arena in the context of globaliza-tion, along with the downsizing of state mechanisms and pressure from the deterio-ration of living standards in sectors with highly concentrated population. (Joly, 2004: 76-77).
The international migration constituting an important part of globalization (WB, 2002a:19) along with the flow of the capital and goods, is a common feature, which has been seen throughout history repeatedly. Though different factors are ef-fective on international migration, globalization has given new shape to migration (Ciarnienè-Kumpikaitë, 2008: 43). Globalization has increased the pressure and the opportunities for people to move between countries. The international migration movements have also surged along with the development trends and communication between different societies and cultures. With the increase in inequality between countries, the need for immigration has become an economic need rather than a choice for a lot of people (Wellink, 2004). That is why it is vital to determine the effect of globalization on the migration process.
The aim of this study is to show the change the international migration flows alongside with the new trends in the world economy and the previous two waves of globalization in 1870-1914 and 1950-1980. In this study, by taking the literature and statistical data into consideration, the labor migration will be analyzed during the time period, that make up the three waves of globalization, starting from 1870-1914, 1950-1980s and continuing until today.
2. Determinants of International Migration and Globalization
The concept of globalization implies free trade, free capital mobility and mi-gration and global economic integration of the former national economies. Relations between nations for the purposes of economic transactions transform into relations between regions (Daly, 2004).
While migration is the result of global changes, it is also the driving force of more changes in societies, which accepts and rejects immigrants. Though the first impact of migration is felt on the economic level, it will also affect social relations, culture, national policies and international relations (Castles, 1998: 179). While the dependencies have increased as a result of trade, foreign investment, foreign aid and the increase in the international migration of ideas and people and the integration of countries as a consequence of globalization, the determinants of international migra-tion have also diversified.
There are several established push and pull factors of migration. To start with, immigrants are usually affected by both the conditions of the environment. In-

Uluslararası İktisadi ve İdari İncelemeler Dergisi 47
Yıl:5 Sayı:10, Kış 2013 ISSN 1307-9832
deed, they confront with the difficulties and costs during their journeys. On the other hand globalization is effective on the flow of migration. Flow of immigration has also increased with the increasing global integration.
Table 1: Measures of Global Integration (1820-1995) Capital
flows Trade flows
Transport and communications costs (constant US$)
Years Foreign assets/ World GDP(in per cent)
Trade/ GDP (in per cent)
Sea freight (average ocean freight and port charges per ton)
Air transport (average revenue per passenger mile)
Telephone call (3min NY/London)
Com-puter (index 1990=100)
1820 - 2a - - - - 1870 6.9 10a - - - - 1890 - 12b - - - - 1900 18.6 - - - - - 1914 17.5 18ab - - - - 1920 - - 95 - - - 1930 8.4 18a 60 0.68 245 - 1940 - - 63 0.46 189 - 1945 4.9 - - - - - 1950 - 14a 34 0.3 53 - 1960 6.4 16b 27 0.24 46 12500 1970 - 22.4a-20b 27 0.16 32 1947 1980 17.7 - 24 0.1 5 362 1990 - 26ab 29 0.11 3 100 1995 56.8 - - - - -
Source: David Dollar, Globalization, Inequality and Poverty since 1980, World Bank Policy Research Working Paper 3333, June 2004, p.5; Crafts (2000) a.Maddison (1995) UNDP (1999) UNDP (1999) UNDP (1999) b.Crafts (2000) http://www.wds.worldbank.org/external/default/WDSContentServer/IW3P/IB/2004/09/28/000112742_20040928090739/ Rendered/PDF/wps3333.pdf
Looking at indicators of global integration (Table 1), organized by David Dollar (2001), foreign assets and the share of trade in GDP has been increasing year by year while the transportation and communication costs decreased. Accordingly, the world has integrated even more globally.
Increase in the inequality of the level of development of countries, the in-creasing global integration, the differences in wages between countries, increased knowledge about differences in living conditions worldwide, has provided cheaper travel and communication opportunities:
- Inequality in the level of development is the main determinant of interna-tional migration. It is widely acknowledged that the more industrialized countries and the newly industrializing economies in Latin America and Asia benefit from globalization, the developing countries such as Argentina and Turkey remain outside the global market and that the gap in living standards between the North and South is growing (Abella, 1998: 1). Significant income differences between rich and poor

48 International Journal of Economic and Administrative Studies
Year:5 Number 10, Winter 2013 ISSN 1307-9832
countries are an important incentive for migration. According to UNDP (United Na-tions Development Programme), in 1975, in high-income countries the GDP was 41 times higher in comparison with the low-income countries such as Kenya and Nepal and 8 times higher than in the middle-income countries such as Mexico and Latvia.
In 2005, GDP of the high-income countries such as Germany and Canada is 66 times higher than the low income countries and 14 times higher than the middle-income countries (UNDP, 2005). According to the latest information on GDP prove the differences between high and low income countries. In 2011, while GDP in Germany is 3628.6 billion USD and 1758.7 billion USD in Canada, in the same year it is 115 billion USD in Bangladesh and 63.3 billion USD in Sudan (World Econom-ic Outlook, September 2011). This difference, which increased dramatically in the last 30 years, is a strong incentive for international migration (Murru, 2008: 154).
- There is a positive correlation between the net migration flows (immigra-tion-emigration) and the income (or real wages) per person, in the country receiving additional immigrants (Solimano, 2004: 6). Divergence between the rich countries of the West, and in most developing countries, has created an attractive difference in wages and has caused a very new immigration stream (Stalker, 2000: 21).
- The migration movements have increased along with the awareness of the attractive factors of destination countries through media channels. Because televi-sion penetrated into remote villages and poor countries, the people living in these countries became more aware of different living conditions in the world and dreamed that they could pursue a better life (Murru, 2008: 153).
- Reduced transportation costs have been effective in the changes of popula-tion location (Das, 2004: 86).
- The globalization of communications technology has affected the individu-als’ unique tendency for migration. The connections can be easily established be-tween the migrant receiving and sending countries. The exchange of news with the communication networks of the immigrants and non-migrants has encouraged mi-gration (Hefti, 1997).
3. Waves of Globalization and Migration
“During the past two hundred years the different local economies around the world have become more integrated because of increased flows of goods, capital, and knowledge and the growth rate of the global economy has accelerated dramati-cally” (Dollar, 2001:3). In this period with the reduced transportation costs prior to World War I, the integration of global markets has been ensured. Although forces of globalization are more powerful in the Atlantic economies, it balanced itself with increasing protectionism (Williamson, 2002: 4). Some of the researchers like Soubbotina, Dollar, Goldin and Reinert have indicated three waves of modern glob-alization: the first wave of 1870 and 1914, the second wave between 1950 and 1980

Uluslararası İktisadi ve İdari İncelemeler Dergisi 49
Yıl:5 Sayı:10, Kış 2013 ISSN 1307-9832
and the third wave, which started in 1980 and continues to the present day (Soubbotina, 2004; Goldin-Reinert, 2007; Dollar, 2001, WB, 2002b).
3.1. First Wave of Globalization and Mass Migration Age (1870-1913)
Globalization is seen as a vehicle for facilitating the flow of goods, labor and capital between countries. Between the late 19th century and the beginning of the 20th century, in the early stages of globalization, the countries of the world were more in touch with each other and financial and trade flows were liberalized in comparison with the previous periods (UN, 2002: 229). During this period (1870-1913), while export reached approximately two times the global GDP (about 8 per cent) foreign investments have increased almost three times in comparison with the GDP of the African, Asian and Latin American developing countries (Soubbotina, 2004: 83). While the ratio of trade to global income was 10%, in 1870, it increased to 18% prior to World War I. Large capital flows infiltrated the developing parts of the United States and foreign assets (assets of other countries, generally Europeans), by increasing more than double, went up from 7% to 18% of the worldwide revenue. Mass migration has been the most prominent feature of this era. In this period ap-proximately 10% of the world's population has permanently moved place (Dollar, 2001: 4). International migration with about 10 percent of the world's population has permanently relocated from Europe to the New World, from China and India to neighboring countries with less population. This wave of immigration brought the economy of the Atlantic's per capita income and factor prices noticeably closer (Das, 2004: 86).
In the beginning of the modern era (1870-1914) the probability of a better economic life and liberal immigration policies have been fundamental on intense labor movement. In the period covering 1870-1913, per capita income disparity, be-tween Europe and America, Canada, Australia and other New World countries, has been higher in favor of the new world countries (Table 2). Immigration policies of the New World countries have been more liberal compared to other waves of global-ization after 1914. Because of this reason, it has widely encouraged overseas migra-tion (Solimano, 2004: 2).

50 International Journal of Economic and Administrative Studies
Year:5 Number 10, Winter 2013 ISSN 1307-9832
Table 2: Per Capita GDP (1990 International Geary-Khamis dollars) (1820-2008)
1820 1870 1913 1950 1973 1990 1998 2000 2008 Western Europe Italy 1117 1499 2564 3502 10634 16313 17834 18774 19909 Spain 1008 1207 2056 2189 7661 12055 14236 15622 19706 Norway 801 1360 2447 5430 11324 18466 24138 25102 28500 Switzerland 819 1359 3073 6769 14018 17781 19073 20710 25104 Germany 1077 1839 3648 3881 11966 15929 18029 18944 20801 Total 30 Western Europe
1194 1953 3457 4569 11392 15908 18008 19176 21672
Latin American Countries
Argentina 1311 3797 4987 7962 6433 9155 8581 10995 Brazil 646 713 811 1672 3880 4920 5414 5532 6429 Chile 694 1290 2988 3670 5034 6401 10186 10309 13185 Colombia 1236 2153 3499 4826 5333 5079 6330 Mexico 759 674 1732 2365 4853 6085 6753 7275 7979 Peru 1032 2308 4023 3008 3787 3817 5388 Uruguay 2181 3310 4659 4974 6465 8304 7873 9893 Venezuela 460 569 1104 7462 10625 8313 8986 8433 10596 Total 8 Latin American Coun-tries
712 724 1618 2696 4874 5461 6352 6418 7614
Other OECD Countries
Australia 518 3273 5157 7412 12878 17173 20978 21732 25301 New Zealand 400 3100 5152 8456 12424 13687 15263 16246 18653 Canada 904 1695 4447 7291 13838 18872 20613 22488 25267 United States 1257 2445 5301 9561 16689 23201 26849 28467 31178 Total Other OECD Countries
1202 2419 5233 9268 16179 22346 25805 27394 30152
West Asian Countries
Iran 588 719 1000 1720 5462 3526 4580 4838 6944 Iraq 588 719 1000 1364 3753 2458 1075 1211 1049 Jordan 590 718 1000 1663 2388 3792 4044 4089 5702 Lebanon 657 845 1350 2429 3155 1936 3469 3403 4453 Syria 658 844 1350 2409 4017 5701 7829 7368 8360 Turkey 643 825 1213 1623 3477 5399 6508 6446 8066 Total Asia 581 553 695 714 1711 2776 3528 3789 5611
Source: Angus MADDISON, Statistics on Population, GDP and per Capita GDP, 1-2008 AD, Groningen Growth and Development Centre, from http://www.ggdc.net/maddison.

Uluslararası İktisadi ve İdari İncelemeler Dergisi 51
Yıl:5 Sayı:10, Kış 2013 ISSN 1307-9832
However, these policies became more restrictive in later periods. As a result of the demographic profile, its colonies, and the fluctuating economic supremacy, England has been the main source of migration. When the industrial revolution has spread across the Europe, migration in Europe spread across the European continent and increased significantly because of the separated parts of the rural population, and population growth in Europe (Table 3). With the advent of the 20th century, 1.4 million immigrants, the majority being from the poorest regions of South and West-ern Europe, had crossed the Atlantic (per year). Between 1850 and 1914, a total of 55 million Europeans have immigrated mostly to the USA. Most immigrants were unskilled young men who found the high-wages in other countries more attractive (Goldin-Reinert, 2007: 153).
Table 3: Total Intercontinental Emigration from European Countries and Japan, 1846-1924
Region and Countries Number of emi-
grants (000) Per cent of all
emigrants
Emigrants as a per cent of country’s
population in1900
Europe Austria- Hungary
4,878 10.0 10.4
Belgium 172 0.3 2.6 British Isles 16,974 34.9 40.9 Denmark 349 0.7 14.2 Finland 342 0.7 12.9 France 497 1.0 1.3 Germany 4,533 9.3 8.0 Italy 9,474 19.5 29.2 Netherlands 201 0.4 3.9 Norway 804 1.7 35.9 Portugal 1,633 3.4 30.1 Russia-Poland 2,551 5.3 2.0 Spain 4,314 8.9 23.2 Sweden 1,145 2.4 22.3 Switzerland 307 0.6 13.3 Total Europe 48,174 99.2 12.3
Japan 405 0.8 0.9 Total 48,579 100.0 11.1
Sources: Douglas S. MASSEY, Economic Development and International Migration in Comparative Perspective, Population and Development Review, Vol. 14, Issue.3, September 1988, p. 386 in Imre Ferenczi, A Historical Study of Migration Statistics, International Labour Review, Vol.20, p. 356-384 and B. R. Mitchell, European Historical Statistics: 1750-1975, New York: Facts on File.
From the middle of the 19th century until the first quarter of the 20th century,
in the industrialization period of Europe, as shown in Table 3, 48,174 people emi-grated from Europe. This number constituted about 12% of Europe's population in 1900. The countries, with the highest emigration rate compared to the population, had been the United Kingdom (41%), Norway (36%), Portugal (30%), Italy (29%),
52 International Journal of Economic and Administrative Studies
Year:5 Number 10, Winter 2013 ISSN 1307-9832
Spain (23%) and Sweden (22%). Denmark (14%), Switzerland (13%), Finland (13%), Austria-Hungary (10%), and Germany (8%) had moderate level of emigra-tion, while Belgium (3%), Russia-Poland (2%) and France (1%) had a low rate of emigration, when compared to other countries.
This mass immigration during the industrial transformation period in Europe has developed because of the lack of economic development. The United Kingdom, having the potential to develop economically and being the most advanced country in the period, had the highest emigration rate. International Migration, in 10 out of the 15 countries exceeded 10 percent of the country's population and had exceeded 20 percent in 6 countries. Accordingly, migration played an important role at the end of the 19th century and at the beginning of the 20th century in Europe's social, eco-nomic and demographic transition (Massey, 1988: 386).
The amount of migration showed differences among countries. The countries with the highest rate of migration, compared to the population, were Britain and Norway, which were the fastest growing economies among industrialized countries. The following countries with the highest emigration rates were Portugal and Italy, which lagged behind other European Countries in development. On the other hand, while the migration had been observed in different countries at different times, it came to an end in the late 1920s, when all countries receiving immigrants closed their door, Therefore, depending on whether the mass migration had started earlier or later, different number of migration had occurred in different countries (Massey, 1988: 387).
Between the years of 1846 and 1924, the intercontinental migration from Eu-ropean Countries and Japan had been mostly towards more developed countries like Australia, Canada, New Zealand and America. As shown in the Table 4, The United States had the highest number of emigrants compared to Argentina, Canada and Brazil. In 1880 and especially during 1906-24, while there was an increase in the total immigration rates of the other countries, the immigration rate in the United States had fallen.
In the period covering two-thirds of the century, shown in Table 4, whereas the share of other American countries was increasing, the U.S. share had decreased in the total immigration. Between 1856 -1885, while the share of the U.S. immigra-tion intake ranged between 78.7% and 81.4%, it was 56.5% and 61.9% respectively between the years of 1911-24. Argentina's share of immigration remained below 15% until 1885. In the period covering the years of 1921-25, it had increased to its maximum level of 20.4%. Brazil had a rather high migration rate and in the period covering the years 1886-1900, its previous share of 11.6% went up to 21.1% and it stood only at 8.5% between the years of 1921-24. Even though Canada witnessed a relatively high rated share of 8.6% and 11.1% between1856-1870 and 13.1% and 15.2% between 1911 and 1924, this remained below 8% for half of the period (Willcox, 1929: 170).

Uluslararası İktisadi ve İdari İncelemeler Dergisi 53
Yıl:5 Sayı:10, Kış 2013 ISSN 1307-9832
Table 4: Intercontinental Immigration of Aliens into Argentina, Brazil, Canada, and the United States, as Percentage of the Total Immigration into These Countries from 1856 to
1924, in Quinquennial Averages Period Total Immigra-
tion United States
Canada Brazil Argentina
1856-60 203,299 78.7 8.6 7.9 4.8 1861-65 193,362 78.9 11.1 5.2 4.8 1866-70 377,410 81.9 9.6 2.5 6.0 1871-75 384,138 80.4 7.7 4.2 7.7 1876-80 240,573 73.3 5.9 11.5 9.3 1881-85 633,321 81.4 6.2 4.3 8.1 1886-90 683,304 66.4 4.8 11.6 17.2 1891-95 631,146 67.3 4.1 21.1 7.5
1896-1900 513,730 60.8 4.6 18.6 16.0 1901-05 994,718 76.8 6.8 5.8 10.6 1906-10 1,415,077 67.1 9.7 5.7 17.5 1911-15 1,299,119 61.9 13.1 9.4 15.6 1916-20 266,202 56.5 15.2 13.8 14.5 1921-24 713,543 59.7 11.4 8.5 20.4
Source: Walter F. WILLCOX, ‘Migrations According to International Statistics: Intercontinental Move-ments’, International Migration, Volume I: Immigration Statistics, NBER, 1929, p. 172, from http://www.nber.org/chapters/c5130.pdf
3.2. Second Wave of Globalization and Complication in International Migration (1950-1980)
The impressive first wave of globalization was reversed during the non-globalization period of 1914-1945, which saw the First World War and the Second World War, high inflation in the 1920s, economic depression in the 1930s and polit-ical instability (Soubbotina, 2004: 83-84; Solimano, 2004; 1). By the end of 1940s both the trade and foreign asset ownership, returned to their levels of 1870 by the protectionist period undid 50 years of integration (Dollar, 2004: 6). These events led to a discontinuation of economic connections developed in the world economy. In fact, a period of ever more restrictive immigration policies occurred.
The second wave of globalization proceeded from the 1950s until the 1980s mostly to developed countries. In this process, the integration between the industri-alized countries had been mostly re-established. Trade movements, under the auspi-ces of the General Agreement on Tariffs and Trade (GATT), had increased among European Countries. North America and Japan with the help of multilateral agree-ments on the liberalization of trade. Factor migration had been less effective in this period. The process of liberalization of capital flows operated more slowly. Until 1980 the level of ownership of foreign assets had returned to the 1914 level (Dollar 2004, 6). During this period, many developing countries had preferred to remain passive, as an exporter of primary commodities, and remained largely isolated from international capital movements ((Soubbotina, 2004: 84).

54 International Journal of Economic and Administrative Studies
Year:5 Number 10, Winter 2013 ISSN 1307-9832
The second half of the 1940s and the early years of 1950s, reconstruction of trade and investment relations between the countries and economic reconstruction of Europe have led to a new process of economic wealth in the global economy. Dur-ing this second phase of globalization, the more rapid growth of the OECD econo-mies in comparison to the worlds other economies; expansion of economic diversity has created an intense international migration from poor regions and countries to in-come-rich regions (Das, 2004: 87). Starting from the year 1945 and in particular the 1970s, the international population movements escalated in each geographic region. People immigrated to neighboring countries or other distant countries as migrant workers, professionals or as refugees. Economic migrants and refugees embodied an increasing number of women (Castles, 1998: 180). However, this pressure following World War II has controlled people's movements by limiting firm laws. The globali-zation strategies of this process were inclined more to the movement of capital and goods across international borders rather than people. Strategies have often changed, and these restrictions, which became at the time a powerful influence on wages in developing countries, have been extended by limitations and their size was deter-mined. The direction of migration has been from developing countries to developed industrial economies in the modern age (Das, 2004: 87).
Western Europe, which was an important source of immigrants in the past, was first to attract immigrants. Rapid economic growth of France, Germany, Nether-lands and England has led to a lack of low-wage labor at the end of the 1940s and 1950s. Initially, this demand was met by migrants from South African countries, but in a short time, these sources were insufficient. In the 1960s, Western European countries-especially Germany- was importing millions of working guests from Tur-key and North Africa. Because of the 1973 oil crisis and the ensuring high unem-ployment rate, the running guest program was interrupted in Western Europe. Mid-dle East oil-exporting countries had expanded by copying the working model of immigrant guests (Goldin and Reinert, 2007: 156).
The most significant change in the modern immigration has been in the mid-1960s in Australia, Canada, and U.S., when the immigration policies have been re-viewed. These reforms did not only cause more flow, but they have also allowed Af-rica, Asia and Latin America, which were not accustomed with such trends, to open their doors to immigration. Significant reduction in costs together with the rapid in-crease in intercontinental transport and communication and the previous reforms that limit the volume of migration flows have created a steady growth for both volume and the distribution of migration (Goldin and Reinert, 2007: 156).
While the share of migration was 75 million in 1965, it reached 99 million in 1980. It showed an annual increase of 1.2 percent during 1965-75 (Table 7). On the other hand, starting from 1965 the number of international migrants and their share of the total population have been more diverse. During this period, the number of the immigrated countries increased rapidly due to growing transportation. In that ex-change, the number of women migrants has also increased (Zlotnik, 1998: 434)

Uluslararası İktisadi ve İdari İncelemeler Dergisi 55
Yıl:5 Sayı:10, Kış 2013 ISSN 1307-9832
Table 7: Migrant Stock by Region and as a Percentage of Region’s Total Population; Growth Rate of Migrant Stock by Region; and Migrant Stock by Region as a Percentage
of Migrant Stock World Total, 1965, 1975, and 1980 Estimated foreign-born
population (Million) As a percent-age of total population of region
Annual rate of change -percent
As a percentage of migrant stock world total
Region 1965 1975 1980 1965 1975 1965-1975 1965 1975 World total 75,2 84,5 99,8 2.3 2.1 1.2 100.0 100.0
Developed countries
30,4 38,3 47,7 3.1 3.5 2.3 40.4 45.3
Developing Countries
44,8 46,2 52,1 1.9 1.6 0.3 59.6 54.7
Africa 7,9 11,2 14,1 2.5 2.7 3.4 10.6 13.2 Asia(1) 31,4 29,7 32,3 1.7 1.3 -0.6 41.8 35.1 Latin America and the Carib-bean(2)
5,9 5,8 6,1 2.4 1.8 -0.2 7.9 6.8
Northern Amer-ica
12,7 15,0 18,1 6.0 6.3 1.7 16.9 17.8
Europe and Former Soviet Union(3)
14,7 19,5 25,5 2.2 2.7 2.8 19.6 23.1
Oceania 2,5 3,3 3,8 14.4 15.6 2.8 3.3 3.9 (1) Excluding Armenia, Azerbaijan, Georgia, Kazakhstan, Kyrgyzstan, Tajikistan, Turkmenistan, and Uzbekistan. (2) Including Mexico. (3) Albania, Bulgaria, the former Czechoslovakia, the former German Democratic Republic, Hungary, Poland, Romania, and the former Yugoslavia Source: Hania Zlotnik, International Migration 1965-96: An Overview, Population and Development Re-view, Vol. 24, No. 3, September 1998, p.431 from http://www.jstor.org/pss/2808151
3.3 Third Wave of Globalization After 1980
The current third wave of globalization began in the 1980s and still continues today, depends on two main factors. One includes technological developments, which decrease the cost of transportation and communication as far as economically possible, at different stages of production, which is located far away in different countries. The other factor relates to the increased liberalization of trade and capital markets. Every day, more and more countries open their economies to outside com-petition by lowering import duties, by minimizing import quotas, export restrictions and legal limitations such as non-tariff barriers. Hence they reduce the level of pro-tectionism. Established after the Second World War, a series of institutions, includ-ing the World Bank, the International Monetary Fund (IMF) and the World Trade Organization (WTO, preceded by the GATT until 1995), play an important role for global free trade to override of protectionism (Soubbotina, 2004: 84).

56 International Journal of Economic and Administrative Studies
Year:5 Number 10, Winter 2013 ISSN 1307-9832
The fall of communism in the former Eastern Bloc and the mess in Balkans, since the late 1980s, have encouraged the immigration. Although Western Europe was increasingly popular for immigrants America accepted more immigrants than the other countries in the Middle East, particularly in the South, had become an im-portant area for low-skilled labor migration from South Asia. The countries with the maximum migration output have been middle-income countries. Mexico and the Philippines have been the most labor power-exporting countries (Goldin and Reinert, 2007: 157).
Between 1980 and 2000, the share of international migration had increased by 75% from 100 million to 175 million. More than a third of that increase was due to the break-up of the former Soviet Union (Zlotnik, 2005: 15). The amount of inter-national migration has been 213 million in 2010 and has slowed down all over the world because of the recession in developing countries. As shown in Table 8, while migration from developing countries was 52 million in 1980, it has increased by 12 million and reached 64 million in 1990 and it has remained unchanged at 64 million in 2000 and increased in 2010 to about 75 million. Developed countries received about 15 million immigrants between the years of 1980-1990, approximately 50 mil-lion immigrants between the years of 1990 and 2000, and approximately 11 million immigrants between the years of 2000 and 2010.
Table 8: Migrant Stock by Region and as a Percentage of Region’s Total Population;
Growth Rate of Migrant Stock by Region; And Migrant Stock by Region as a Percent-age of Migrant Stock World Total 1980, 1990, 2000, 2005 and 2010
Number of international mi-
grants (million) International mi-grants as a percent-age of the popula-tion
Average annual rate of growth of the number of international migrants (percentage)
Percentage distribu-tion of international migrants by region
Major area
1980 1990 2000 2005 2010 1980 2000 2010 1980-1990
1990-2000
2000-2005
2005-2010
1980 2000 2010
World 99.8 154.0 174.9 195.2 213.4 2,3 2,9 3.1 4,3 1,3 1,8 1,8 100,0 100,0 100,0 Developed countries
44.5 59.3 110.3 117.1 127.7 4,2 8,7 10,3 6,3 2,1 2,3 1,7 47,8 63,1 59,7
Developing countries
52.1 64.3 64.6 67.1 74.7 1,6 1,3 1,6 2,1 0,0 1,2 2,1 52,2 36,9 34,9
Africa 14.1 16.2 16.3 17.7 19.2 3,0 2,0 1,9 1,4 0,0 0.8 1.7 14,1 9,3 9.0 Asia(1) 32.3 41.8 43.8 55.1 61.3 1,3 1,2 1,5 2,6 0,5 1,2 2,1 32,4 25,0 28,7 Latin America and the Caribbean
6.1 7.0 5.9 6.8 7.4 1,7 1,1 1,3 1,3 -1,7 1,2 1,7 6,2 3,4 3,5
Northern America
18.1 27.6 40.8 45.5 50.0 7,1 12,9 14,2 4,2 3,9 2,4 1,9 18,1 23,3 23,4
Oceania 3.8 4.8 5.8 5.5 6.0 16,4 18,8 16,8 2,3 2,1 1,9 1,7 3,8 3,3 2,8 Europe(2) 22.2 49.4 57.6 64.3 69.8 4,6 7,9 9,5 1,7 2,2 2,2 1,6 22,2 32,3 32,6
(1) Excluding Armenia, Azerbaijan, Georgia, Kazakhstan, Kyrgyzstan, Tajikistan, Turkmenistan, and Uzbekistan except 1980. (2) Excluding Belarus, Estonia, Latvia, Lithuania, the Republic of Moldova, the Russian Federation and Ukraine for 1980, 1990, and 2000.
Source: Hania Zlotnik, International Migration Trends Since 1980, International Migration and the Millennium development Goals, UNFPA, Marrakech, Morocco, 11-12 May 2005, p.15 http://www.unfpa.org/webdav/site/global/shared/documents/publications/2005/migration_report_2005.pdf; United Nations Population Divi-sion, International Migration Report 2009: A Global Assessment, http://esa.un.org/migprofiles/#Regions, http://www.un.org/esa/population/migration

Uluslararası İktisadi ve İdari İncelemeler Dergisi 57
Yıl:5 Sayı:10, Kış 2013 ISSN 1307-9832
Significant estimates of migration between significant groups show that the advanced developed regions have been more lucrative than the less developed re-gions since 1960. The migration to the more developed regions had increased steadi-ly from 1960 until 2000 (UN, 2009: 18). While in 1980, 48% of international immi-grants lived in developed countries (excluding the former USSR), and 52% lived in developing countries, in 2010 60% of immigrants lived in developed countries and 35% lived in developing countries. Including the former USSR, in 1980, 48% of immigrants and in 2000 63% lived in developing countries (Table 8).
Between 2000 and 2010, Asia was the region that provided the major migra-tion, and it was followed by Latin America (1.3 million annually) and the Caribbean (1.1 million annually) and then Africa (0.5 million annually). More than half of the migration from less developed regions came from Asia, this was followed by Latin America and Caribbean with 25-30%, and the rest from Africa, (UN 2009, 18). Be-tween 1980 and 2000, the share of international migration at the regional level has increased in North America (from 18% in 1980 to 23% in 2000), while it was 3% in the former USSR in 1980, it stood at 17% in 2000 (Zlotnik, 2005: 15; UN, 2009: 15). The share fell down in all regions. The most significant decrease has been in Asia from 32% in 1980 to 28% in 2010. In Latin America and the Caribbean 1980 - 2010 years, it decreased from 6% to 3%. Immigration had increased in Europe, es-pecially in the 1990s. In the years 1980-2010, it increased from 22% to 33%. While the share of population in 1980 was 4.6%, it increased to 9.5% in 2010 (Table 8).
33 out of 45 developed countries have been net receiver of immigrants in the 2000-2010 periods on the country basis. This group consists of the traditional popu-lar immigration destinations such as Australia, Canada, New Zealand and the United States, most of the populous countries in Northern, Southern, and Western as well as the Russian Federation and Japan. During 2000-2010, China, India, Indonesia, Mex-ico, Philippines, Pakistan, and Iran had the highest emigration rates (UN, 2008: 18). In 2010, the major destination countries of immigrants have been the United States, Russian Federation, Germany, Saudi Arabia, Canada, Great Britain, Spain and France. The highest emigration countries were Mexico, India, Russian Federation, China, Ukraine, Bangladesh, Pakistan and the United Kingdom in 2010 (Munz, 2011: 12 and 16).
4. Structure of Migration
Although the underlying belief professed that migration transpired from the poorest countries to the richest countries, this hasn’t been the case in the past. In the 19th century migration had started from the rich countries- first from England and then from Germany. Immigration from the poorer countries of northern Europe fol-lowed. Historically, there is a very high correlation between the commencement of large-scale migration and the initiation of industrialization (Stalker, 2000: 22-23).

58 International Journal of Economic and Administrative Studies
Year:5 Number 10, Winter 2013 ISSN 1307-9832
Table 9: Distribution of Alien Immigrants (United States) by Gender, from 1831 to 1924 in Quinquennial Averages
Numbers Percentage Years Total Males Females Males Females
1831-35 248,214 162,734 85,480 65.6 34.4 1836-40 341,139 215,991 125,148 63.3 36.7 1841-45 428,535 249,874 178,661 58.3 41.7 1846-50 1,278,850 764,322 514,528 59.8 40.2 1851-55 1,746,845 1,009,092 737,753 57.8 42.2
1856-60(a) 649,354 377,283 272,071 58.1 41.9 1861-65 801,680 477,382 324,298 59.5 40.5 1866-70 1,644,948 1,003,264 641,684 61.0 39.0 1871-75 1,659,278 1,001,561 657,717 60.4 39.6 1876-80 1,285,432 806,667 478,765 62.8 32.2 1881-85 2,832,342 1,714,246 1,118,096 60.5 39.5 1886-90 2,361,795 1,455,591 906,204 61.6 38.4 1891-95 2,208,026 1,350,823 857,203 61.2 38.8
1896-1900 1,596,193 1,011,013 585,180 63.3 36.7 1901-05 4,061,932 2,834,315 1,227,617 69.8 30.2 1906-10 4,988,311 3,474,747 1,513,564 69.7 30.3 1911-15 4,143,396 2,691,732 1,451,664 65.0 35.0 1916-20 1,580,562 921,040 659,522 58.3 41.7 1921-24 2,050,892 1,158,188 892,704 56.5 43.5
(a)1857-60 Source: Walter F. WILLCOX, “Migrations According to International Statistics: Intercontinental Move-ments”, International Migration, Volume I: Immigration Statistics, NBER, 1929, p. 211, from http://www.nber.org/chapters/c5130.pdf
Because the U.S. had significant migration and the statistical data has been
created earlier than other countries, it is the most appropriate country for showing the gender distribution of migration (Wilcox, 1929: 210). The number of men among those who immigrated to the United States was numerous in the years 1831-1924 as shown in Table 9. While 65.6% of those who immigrated to the United States were initially men, the number slightly decreased in the following years. In the period from 1841-45 until 1901-05, it varied between 57.8 and 62.8%. Between the periods 1881-85 and 1901-05 the rate of men went up from 60.5% to 69.8% and it remained about the same rate in the period 1906-10. In the years with the highest rate of migration, the immigration rate of men remained at its highest level as well. After the period of 1906-10, the rate of migration of men had decreased.
Immigrants from Northwest and Southeast Asia have been effective in this development. The number of men and women immigrants in 1921-24 has been rela-tively close. 66.5% of migrants came from Europe; this rate was 92.4% in the years 1891-1915 (Willcox, 1929: 211).

Uluslararası İktisadi ve İdari İncelemeler Dergisi 59
Yıl:5 Sayı:10, Kış 2013 ISSN 1307-9832
Table 10: International Migration, 1960-2010: Per Cent Female Major area or region 1960 1970 1980 1990 2000 2010 World 46.9 47.2 47.3 47.9 48.6 49.0 More developed regions 48.7 49.0 50.0 51.7 51.0 51.5 Less developed regions 45.3 45.7 44.7 44.2 44.6 45.3 Africa 42.3 42.7 44.2 45.9 46.7 46.8 Asia 46.4 46.6 44.4 42.8 43.3 44.6 Europe 48.5 48.0 48.5 49.8 51.0 52.3 Latin America/ Caribbean 44.7 46.8 48.2 49.9 50.2 50.1 Northern America 49.8 51.1 52.6 51.0 50.3 50.1 Oceania 44.4 46.1 47.9 49.1 50.5 51.2 USSR (former) 48.5 48.0 48.5 51.1 52.1 58.0
Source: Maruja M. B. ASIS, International Migration and Prospects for Gender Equality, UN, Interna-tional Migration and the Millennium Development Goals, UNFPA, Marrakech, Morocco, 11-12 May 2005, p. 121, from http://www.unfpa.org/webdav/site/global/shared/documents/publications/2005/migration_report_2005.pdf ; UN, International Migration Report 2009: A Global Assessment, United Nations, Department of Eco-nomic and Social Affairs, population Division, from http://esa.un.org/migprofiles/
According to the United Nations (UN) in the database, which considers the
gender disparity, the international migration rate of women migrants in the years 1960-2010 went up from 46.9% to 49% and reached an approximate increase of 2%. In this process, the highest increase happened in Oceania, (from 44% to 51%), Latin America and the Caribbean (from 45% to 50%), Africa (42'ten% to 47%), and parts of the Soviet Union (48% 'than 58%). The share of women has decreased only in the Asian region (44.6% from 46% to). Europe, Oceania, and the Soviet Union, had more female immigrants than male immigrants. While the number of female and male immigrants is equal in Latin America and the Caribbean and North America, the number of male immigrants is higher than the number of female immigrants in Africa and Asia. In addition, the number of female migrants from developing coun-tries is higher than in developed countries. In total, in the last 45 years, women's share of the world migration share has increased steadily (Table 10).
Women migrants had an important role in the 20th century immigration movements. Since 1974 the number of women immigrants has been more than male immigrants. It can be seen from official data that women migrants are mostly from the Asian countries and they migrate to developed countries.
The highest labor share was mostly in periods (1847-54, 1865-73, 1881-93, 1899-1914), during which the unskilled workers found jobs easily, when the Ameri-ca's economy was stronger. Professionals, creating a small portion of immigrants until 1930, constituted the largest share starting from 1930 (Table 11).During the periods with more intense migration, 1873-80 and 1899-1914, farmers, servants and migrant workers constituted respectively 66% and 78% of migration (Cohn).

60 International Journal of Economic and Administrative Studies
Year:5 Number 10, Winter 2013 ISSN 1307-9832
Table 11: The Occupations of US Immigrants, 1820-1898 Occupation 1865-
1873 1873-1880
1881-1893
1894-1898
1920-1930
1931-1946
1961-1970
1981-1990
1991-1998
Skilled 31 30 24 30 39 68 70 71 55 Farmer 18 18 14 12 13 6 6 7 32 Unskilled 51 48 60 55 48 26 25 22 14
Source: Raymond L. COHN, Immigration to the United States, EH.net Encyclopaedia, http://eh.net/encyclopedia/article/cohn.immigration.us Note: Qualified: professionals, technical staff, administrators, clerks, skilled artisans, dealer, expert, fac-tory workers, unskilled: servants and workers.
America and other overseas regions have faced the increased amount of im-
migrants and decreasing quality of immigrants before World War I (Hatton-Williamson 2004, 16). In the 1920s, after the introduction of restrictions, the rate of immigration of unskilled labor force was only 31-34% between 1930 and 1970. As illegal immigrants were registered as farmer and servants because of the amnesty law, the rate had decreased (Cohn).
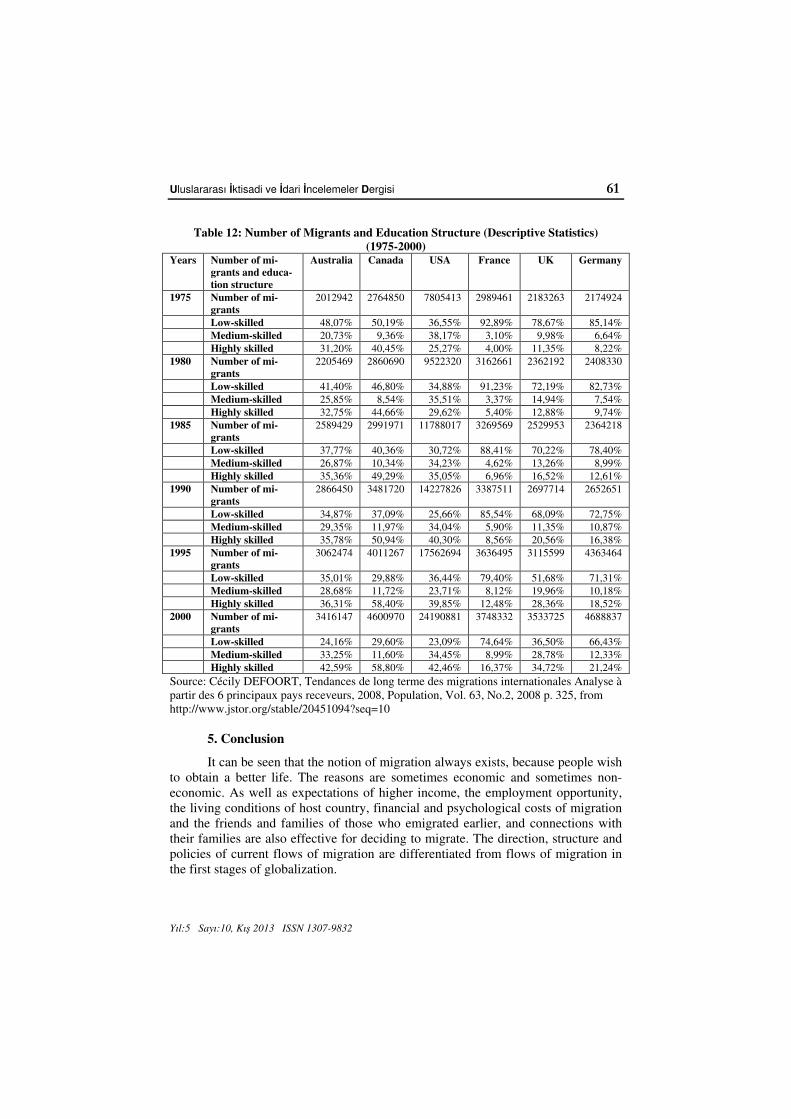
The United States corresponds to the country where the number of immi-grants increased the most (it was increased more than three), from nearly 8 million in 1975 to over 25 million in 2000 in Table 12. While there was a two-fold increase on the same dates in Germany, the increase was approximately 1.6-fold in other countries. In France, since 1975, there was a limited number of increase and hence it increased by 1.2. It has been observed that the quality of immigrants has increased in the host countries. Canada has the most qualified immigrants. This has reached ap-proximately 60% in 25 years. The share of skilled migrants in Australia and the United States in 2000 was 42%. In 2000, France and Germany are the countries where this proportion is lowest, with 16% among qualified migrants to the former and 21% respectively in Table 12 (Defoort, 2008: 326).
Uluslararası İktisadi ve İdari İncelemeler Dergisi 61
Yıl:5 Sayı:10, Kış 2013 ISSN 1307-9832
Table 12: Number of Migrants and Education Structure (Descriptive Statistics) (1975-2000)
Years Number of mi-grants and educa-tion structure
Australia Canada USA France UK Germany
1975 Number of mi-grants
2012942 2764850 7805413 2989461 2183263 2174924
Low-skilled 48,07% 50,19% 36,55% 92,89% 78,67% 85,14% Medium-skilled 20,73% 9,36% 38,17% 3,10% 9,98% 6,64% Highly skilled 31,20% 40,45% 25,27% 4,00% 11,35% 8,22% 1980 Number of mi-
grants 2205469 2860690 9522320 3162661 2362192 2408330
Low-skilled 41,40% 46,80% 34,88% 91,23% 72,19% 82,73% Medium-skilled 25,85% 8,54% 35,51% 3,37% 14,94% 7,54% Highly skilled 32,75% 44,66% 29,62% 5,40% 12,88% 9,74% 1985 Number of mi-
grants 2589429 2991971 11788017 3269569 2529953 2364218
Low-skilled 37,77% 40,36% 30,72% 88,41% 70,22% 78,40% Medium-skilled 26,87% 10,34% 34,23% 4,62% 13,26% 8,99% Highly skilled 35,36% 49,29% 35,05% 6,96% 16,52% 12,61% 1990 Number of mi-
grants 2866450 3481720 14227826 3387511 2697714 2652651
Low-skilled 34,87% 37,09% 25,66% 85,54% 68,09% 72,75% Medium-skilled 29,35% 11,97% 34,04% 5,90% 11,35% 10,87% Highly skilled 35,78% 50,94% 40,30% 8,56% 20,56% 16,38% 1995 Number of mi-
grants 3062474 4011267 17562694 3636495 3115599 4363464
Low-skilled 35,01% 29,88% 36,44% 79,40% 51,68% 71,31% Medium-skilled 28,68% 11,72% 23,71% 8,12% 19,96% 10,18% Highly skilled 36,31% 58,40% 39,85% 12,48% 28,36% 18,52% 2000 Number of mi-
grants 3416147 4600970 24190881 3748332 3533725 4688837
Low-skilled 24,16% 29,60% 23,09% 74,64% 36,50% 66,43% Medium-skilled 33,25% 11,60% 34,45% 8,99% 28,78% 12,33% Highly skilled 42,59% 58,80% 42,46% 16,37% 34,72% 21,24% Source: Cécily DEFOORT, Tendances de long terme des migrations internationales Analyse à partir des 6 principaux pays receveurs, 2008, Population, Vol. 63, No.2, 2008 p. 325, from http://www.jstor.org/stable/20451094?seq=10
5. Conclusion
It can be seen that the notion of migration always exists, because people wish to obtain a better life. The reasons are sometimes economic and sometimes non-economic. As well as expectations of higher income, the employment opportunity, the living conditions of host country, financial and psychological costs of migration and the friends and families of those who emigrated earlier, and connections with their families are also effective for deciding to migrate. The direction, structure and policies of current flows of migration are differentiated from flows of migration in the first stages of globalization.

62 International Journal of Economic and Administrative Studies
Year:5 Number 10, Winter 2013 ISSN 1307-9832
During the first wave of globalization, at the end of the 19th century and the beginning of the 20th century, there have been significant migration movements and intense labor migration has been followed by large capital flows. Today, however, though links between countries have increased in number and the financial and trade flows are liberalized more than ever, the human movements have been limited. Globalization has shown a tendency to introduce more restrictive rules when it comes to immigration policies. It can be said, that international migration seems to be outside the process of new globalization. This feature of globalization constitutes the biggest difference between the new trends of the world economy and the previ-ous two great periods. If we compare current situation with the end of the 19th centu-ry, at that time, significant numbers of Europeans and Asians immigrated to the United States for a better future. However today, the international migration increas-es with the mobility of more goods, capital and information flows. While initially migration took place from rich countries, today the trend of migration moves to-wards from developing countries to developed economies.
In addition, international migration has evolved into the migration of quali-fied labor force. The big difference is the changes in policies. However today, while the international migration of unskilled and poor is becoming more difficult, the mobility of experts, executives and international investors has increased. Moreover, women's share of immigrants has increased in comparison to the first wave of the globalization.
World population is increasing more in developing countries than in devel-oped ones because fertility rates are generally low in developed countries. Due to social, cultural and economic effects, the migration of unskilled labor is restricted. The measures taken to prevent immigration in developed countries resulted with the lack of employment and aging of the population. Given Europe and Japan's aging population, the labor force will decrease without immigration. Therefore this policy has been criticized on the grounds that it will lead to the misuse of illegal immigra-tion.
References
ABELLA, Manolo I. (1998), Globalization, Poverty and International Migra-tion, ILO, http://repository.forcedmigration.org/show_metadata.jsp?pid=fmo:3310, Access Date: 19.10.2010.
ASIS, Maruja M. B. (2005), “International Migration and Prospects for Gen-der Equality”, International Migration and the Millennium Development Goals, -UNFPA, Marrakech, Morocco, 11-12 May 2005, 113-123), http://www.unfpa.org/ webdav/site/global/shared/documents/publications/2005/migration_report_2005.pdf, Access Date: 02.03.2010.

Uluslararası İktisadi ve İdari İncelemeler Dergisi 63
Yıl:5 Sayı:10, Kış 2013 ISSN 1307-9832
CASTLES, Stephen (1998), “Globalization and migration: some pressing contradictions”, International Social Science Journal, 50/156, June 1998, 179-186, http://onlinelibrary.wiley.com/doi/10.1111/1468-2451.00122/pdf, Access Date: 09.04.2011.
CIARNIENÈ, Ramuné and KUMPIKAITË, Vilmanté (2008), “The Impact of Globalization on Migration Processes”, SociaUniai tyrimai / Social Research, 3 (13), 42-48, http://web.ebscohost.com/ehost/pdfviewer/pdfviewer?vid=2&hid=7& sid=8aea9c06-71c0-4335-b844-be7d07d73a93%40sessionmgr10, Access Date: 07.10.2010.
COHN, Raymond L. ,Immigration to the United States. EH.net Encyclopae-dia, http://eh.net/encyclopedia/article/cohn.immigration.us, Access Date: 21.02.2011.
COLLIER, Paul and DOLLAR, David (2002), Globalization, Growth, and Poverty: Building an Inclusive World Economy, World Bank Policy Research Reports, World bank Publication, New York.
DALY, Herman E. (2004), “Population, Migration, and Globalization”, World Watch Magazine, Volume 17, No. 5, September/October 2004, Internet Ad-dress; www.worldwatch.org/pubs/mag/, Access Date: 09.11.2010.
DAS, Dilip K. (2004), Economic Dimensions of Globalization, Gordonsville. VA. U.S.A: Palgrave Macmillan.
DEFOORT, Cécily (2008), “Tendances de Long Terme des Migrations Inter-nationales Analyse à Partir des 6 Principaux Pays Receveurs”, Population, 63/2, 2008, 317-352, Internet Address; http://www.jstor.org/stable/20451094?seq=10, Access Date: 27.05.2011.
DOLLAR, David (2004), Globalization, Poverty, and Inequality since 1980, The World Bank Policy Research Working Paper 3333, June 2004, http://www-wds.worldbank.org/servlet7WDSContentServer/WDSP/IB/2004/09/28/000112742_20040928090739/Rendered/PDF/wps3333.pdf
DOLLAR, David (2001), Globalization, Inequality and Poverty since 1980, Development Research Group, World Bank, November 2001.
GOLDIN, Ian., and KENNETH, Reinert (2007), Globalization for Develop-ment: Trade, Finance, Aid, Migration and Policy, New York: A Copublication of the World Bank and Palgrave Macmillan.

64 International Journal of Economic and Administrative Studies
Year:5 Number 10, Winter 2013 ISSN 1307-9832
HATTON, Timothy J. and Williamson, Jeffrey G. (2004), “International Migration in the Long-Run: Positive Selection, Negative Selection and Policy”, Kiel Institute for World Economics 36th Kiel Week Conference on Labour Mobility and the World Economy, June 21-22, 2004, http://www.cgdev.org/doc/event%20docs/ MADS/Williamson%20- %20International%20Migration%20in%20the%20Long-Run.pdf, Access Date: 19.05.2011.
HEFTI Anny M. (1997), “Globalization and Migration”, European Solidarity Conference on the Philippines, Responding to Globalization, Boldern House Män-nedorf, Zurich, Switzerland, 19-21 September 1997, http://www.geocities.ws/ nymia20001/articles/ocw_002.html, Access Date: 21.11.2010.
JOLY, Daniele (2004), International Migration in the New Millenium: Global Movement and Settlement, England: Ashgate Publishing Limited.
MADDISON, Angus, Statistics on Population, GDP and per Capita GDP, 1-2006 AD, Groningen Growth and Development Centre, Internet Address; http://www.ggdc.net/maddison, Access Date: 07.02.2010.
MADDISON, Agnus (1995), Monitoring the World Economy 1820-1992, Development Center Studies, Organization for Economic Co-operation and Development, Paris.
MASSEY, Douglas S. and others (2005), World in Motion: Understanding International Migration at the End of Millennium, Clarendon Press, Oxford.
MASSEY, Douglas S. (1988), “Economic Development and International Migration in Comparative Perspective”, Population and Development Review, 14/3, September 1988, 383-413.
MURRU, Maurizio (2008), “Globalization, Migration and Brain Drain: A Reality Check”, Health Policy and Development Journal, 6/3, December 2008, 153-163.
SOLIMANO, Andres (2004), “Globalization, History and International Mi-gration: A View from Latin America” International Labour Organization Working Paper, 37, Geneva, July 2004, SSRN: http://ssrn.com/abstract=908241, Access Date: 23.01.2011.
STALKER, Peter (2002), Workers without Frontiers: The Impact of Global-ization on International Migration, Switzerland: International Labour Organization.
UN (2002), International Migration and Globalization, UN, ECLAC, TWENTY-NINTH SESSION, Brazil, 15 April 2002, 229-258, http://www.eclac.org/celade/ noticias/paginas/6/11186/LCG2157_chap8_i.pdf), Access Date: 09.10.2010.
UN, International Migration Report 2009: A Global Assessment, United Na-tions Population Division, Internet Address; http://esa.un.org/migprofiles/#Regions; http://www.un.org/esa/population/migration, Access Date: 11.07.2011.

Uluslararası İktisadi ve İdari İncelemeler Dergisi 65
Yıl:5 Sayı:10, Kış 2013 ISSN 1307-9832
UN, International Migration Report 2009: A Global Assessment, United Na-tions, Department of Economic and Social Affairs, Population Division, Internet Address; http://esa.un.org/migprofiles/ , Access Date: 26.05.2011.
UN, World Population Prospects: The 2008 Revision, UN Department of Economic and Social Affairs Population Division, New York 2009, http://www.un.org/esa/population/publications/wpp2008/wpp2008_highlights.pdf, Access Date: 11.07.2011.
WB (2002a), International Migration, Economic Development and Policy. Özden Çağlar and Schiff Maurice (Eds.), New York: A Copublication of the World Bank and Palgrave Macmillan.
WB (2002b), Globalization, Growth and Poverty: Building an Inclusive World Economy, World Bank and Oxford University Press, New York.
WELLINK, A.H.E.M (2004), “Globalization and International Migration”, Lunch Meeting of the “Rotterdam Japan Club”, De Nederlandsche Bank, 12 March 2004, Internet Address; http://www.dnb.nl/nieuws-en-publicaties/nieuwsoverzicht-en-archief/speeches-2004/auto39685.jsp, Access Date: 10.10.2010.
WILLCOX,Walter F. (1929), “Migrations According to International Statis-tics: Intercontinental Movements”, International Migration : Immigration Statistics, NBER, Internet Adresi; http://www.nber.org/chapters/c5130.pdf . Access Date: 17.07.2011.
WILLIAMSON, Jeffrey G. (2002), “Winners and Losers over Two Centuries of Globalization”, NBER Working Paper, 9161, September 2002, Internet Address; http://www.nber.org/papers/w9161, Access Date: 02.03.2011.
World Economic Outlook, September 2011,http://knoema.com/IMFWEO 2011Sep, Access Date: 07.03.2012
ZLOTNIK, Hania (2005), “International Migration Trends Since 1980. UN”, International Migration and the Millennium Development Goals, Marrakech, Mo-rocco: UNFPA, 11-12 May 2005, 13-25.
ZLOTNIK, Hania (1998), “International Migration 1965-96: An Overview”, Population and Development Review, 24/3, September 1998, 429-468.

66 International Journal of Economic and Administrative Studies
Year:5 Number 10, Winter 2013 ISSN 1307-9832