Embed Size (px)
Citation preview

INTERNATIONAL MONETARY FUND
Financial Soundness Indicators: Experience with the Coordinated Compilation Exercise and Next Steps: Background Paper
Prepared by the Statistics Department
(In consultation with the Monetary and Capital Markets Department and other Departments)
Approved by Robert W. Edwards
October 18, 2007
Contents Page List of Abbreviations .................................................................................................................4
I. Introduction ............................................................................................................................5 II. Modalities of the CCE...........................................................................................................5
III. Experience with the CCE.....................................................................................................9
IV. Methodological Issues in Compiling FSIs.........................................................................16 A. Consolidation Basis.................................................................................................17 B. Inter-Group Consolidation Adjustments .................................................................21 C. Relation of the Guide with BCBS Guidance...........................................................24 D. Relation of the Guide with IFRS.............................................................................25 E. Contents of FSI List.................................................................................................26 F. Definitions of Specific FSIs.....................................................................................27 G. Conclusion ..............................................................................................................30
Figure 1. Rationale for Countries in Choosing Consolidation Bases for Reporting FSIs in the CCE ...........................................................................................................20 Boxes 1. CCE Participating Countries..........................................................................................6 2. Timetable of Key Actions in the CCE ...........................................................................7 3. Members of the CCE/FSI Reference Group ..................................................................8 4. Consolidation Bases.....................................................................................................11 5. Consolidation Adjustments..........................................................................................13 6. Main Differences between the Guide and IFRS ..........................................................14 7. Implications for FSIs from Varying the Consolidation Basis......................................18 8. Quantitative Effect of Inter-Group Consolidation Adjustments on FSIs.....................23

2
9. Key Differences between Basel I and Basel II ............................................................25 Tables 1. FSIs Compiled by Countries in the CCE .....................................................................31 2a. Core FSIs for Countries Using the DCCB Consolidation Basis..................................32 2b. Core FSIs for Countries Using the DC Consolidation Basis .......................................33 2c. Core FSIs for Countries Using the DCCBS Consolidation Basis................................37 2d. Core FSIs for Countries Using the CBCSDI Consolidation Basis ..............................40 2e. Core FSIs for Countries Using the Other Consolidation Bases...................................42 3a. FSI Core Data for Countries Using the DCCB Consolidation Basis with Full Adoption of IFRS .........................................................................................44 3b. Core FSIs for Countries Using the DC Consolidation Basis with Full Adoption of IFRS.........................................................................................................45 3c. FSI Core Data for Countries Using the DCCBS Consolidation Basis with Full Adoption of IFRS .................................................................................................47 3d. Core FSIs for Countries Using the CBCSDI Consolidation Basis with Full Adoption of IFRS.........................................................................................................48 4a. Core FSIs for Countries Using the DCCB Consolidation Basis with Full Adoption of IFRS and Full Intra-Group Consolidation...............................................50 4b. Core FSIs for Countries Using the DC Consolidation Basis with Full Adoption of IFRS and Full Intra-Group Consolidation...............................................51 4c. Core FSIs for Countries Using the DCCBS Consolidation Basis with Full Adoption of IFRS and Full Intra-Group Consolidation...............................................52 4d. Core FSIs for Countries Using the CBCSDI Consolidation Basis with Full Adoption of IFRS and Full Intra-Group Consolidation .......................................53 5a. Data Sources by Indicator............................................................................................55 5b. Data Sources by Indicator: Core FSIs for Deposit Takers...........................................56 5c. Data Sources by Indicator: Encouraged FSIs for Deposit Takers ...............................57 5d. Data Sources by Indicator: Encouraged FSIs for Other Financial Corporations.........58 5e. Data Sources by Indicator: Encouraged FSIs for Non-Financial Corporations...........58 6a. Consolidation Basis by Indicator .................................................................................59 6b. Consolidation Basis by Indicator: Core FSIs for Deposit Takers................................60 6c. Consolidation Basis by Indicator: Encouraged FSIs for Deposit Takers ....................61 6d. Consolidation Basis by Indicator: Encouraged FSIs for Other Financial Corporations.................................................................................................................62 6e. Consolidation Basis by Indicator: Encouraged FSIs for Non-Financial Corporations.................................................................................................................62 7. FSIs for Deposit Takers: Consolidation Bases Used by Countries in the CCE...........63 8a. FSIs for Deposit Takers: Consolidation Adjustments Carried Out by Countries in the CCE....................................................................................................................64 8b. FSIs for Deposit Takers: Consolidation Adjustments by Indicators (Core FSIs)...................................................................................................................65 8c. FSIs for Deposit Takers: Consolidation Adjustments by Indicators (Encouraged FSIs) .......................................................................................................66 8d. FSIs for Deposit Takers: Inter-Group Consolidation Adjustments by Indicators (Core FSIs)..................................................................................................67

3
8e. FSIs for Deposit Takers: Inter-Group Consolidation Adjustments by Indicators (Encouraged FSIs) .......................................................................................................68 9a. FSIs for Deposit Takers: Inter-Group Consolidation Adjustments in the Financial Statements ...................................................................................................69 9b. FSIs for Deposit Takers: Inter-Group Consolidation Adjustments in the Financial Statements (by Country) ..............................................................................70 10. Accounting Standards Adopted by the CCE Participating Countries..........................71 11a. FSIs for Deposit Takers: General Methodological Practices.......................................72 11b. FSIs for Other Financial Corporations—General Methodological Practices ..............72 11c. FSIs for Nonfinancial Corporations: General Methodological Practices ....................73 11d. FSIs for Households—General Methodological Practices ..........................................73 12. Supervisory Standards Used by the CCE Countries to Compile FSIs I1 and I2...............................................................................................................74 13. Survey of the CCE Participating Country Views: Selected Questions........................75 14. Combinations of Consolidation Bases Suggested by Countries in Survey..................80

4
LIST OF ABBREVIATIONS
BCBS Basel Committee on Banking Supervision CBCSDI Cross-Border, Cross-Sector Consolidation Basis for All Domestically
Incorporated Entities CBDI Cross-Border Consolidation Basis for All Domestically Incorporated Entities CCE Coordinated Compilation Exercise DC Domestic Consolidation Basis DCCB Domestically controlled, Cross-Border Basis DCCBS Domestically controlled, Cross-Border and Cross-Sector Basis DRF Data Report Form DT Deposit Taker FSI Financial Soundness Indicator IAS International Accounting Standards IASB International Accounting Standards Board IFRS International Financial Reporting Standards MCM Monetary and Capital Markets Department, IMF MQ Metadata Questionnaire MT Metadata Template NFC Nonfinancial Corporation OFC Other Financial Corporation SNA System of National Accounts STA Statistics Department, IMF TGS Technology and General Services Department, IMF TOR Terms of Reference

5
I. INTRODUCTION1 2
1. This is the companion background paper to the staff report on Financial Soundness Indicators (FSIs): Experience with the Coordinated Compilation Exercise and Next Steps. It provides detailed information on the modalities of the Coordinated Compilation Exercise (CCE), the experience with the CCE, the issues that arose in that exercise regarding the compilation methodology in the Financial Soundness Indicators: Compilation Guide (Guide), and the matters that were taken into account in considering the specific amendments to the Guide, presented in the staff report.
II. Modalities of the CCE
2. Countries participating in the CCE (Box 1) were required to compile the 12 core FSIs as of end-2005 and provide them to the Fund along with underlying data series and related metadata. CCE countries were also encouraged to compile some or all of the 28 encouraged FSIs and provide them along with their metadata.3 The terms of reference (ToR) of the CCE included a timetable of key actions for the Fund and for the countries participating in the CCE (Box 2). It was agreed that all FSI data and metadata provided to the Fund would be disseminated to the public through the Fund’s website.
3. To ensure full collaboration with other international and regional institutions in the area of FSI work, the Statistics Department (STA) created a CCE/FSI Reference Group. The Reference Group is composed of 17 international and regional agencies (Box 3). In the course of the CCE, three meetings were held with representatives of the Reference Group, who also joined the plenary meetings of CCE countries in 2004 and 2007. The Reference Group meetings provided a forum for the exchange of information on the work of various institutions in the area of FSIs and in related data areas. The meetings provided opportunities for Fund staff to present to the Reference Group issues about the conduct of the CCE, the methodology for compiling FSIs, and the way forward with FSIs, and to receive feedback on these matters. Finally, the meetings of the Reference Group provided opportunities to identify areas where harmonization of data compilation and reporting methodologies is needed to minimize duplication of effort on the part of countries and institutions.
1 This paper was prepared by a team led by Andreas Georgiou and comprising Xiuzhen Zhao, Agus Firmansyah, and Phousnith Khay under the guidance of Alfredo Leone and Armida San Jose (all STA), in close collaboration with a team led by Marina Moretti and comprising Philip Bartholomew, Nicolas Blancher, Olivier Frecaut, and Michael Moore under the guidance of Christopher Towe (all MCM).
2 “Country” in this paper also covers nonsovereign entities, for which statistical data are provided internationally on a separate basis.
3 See Table 1.
6
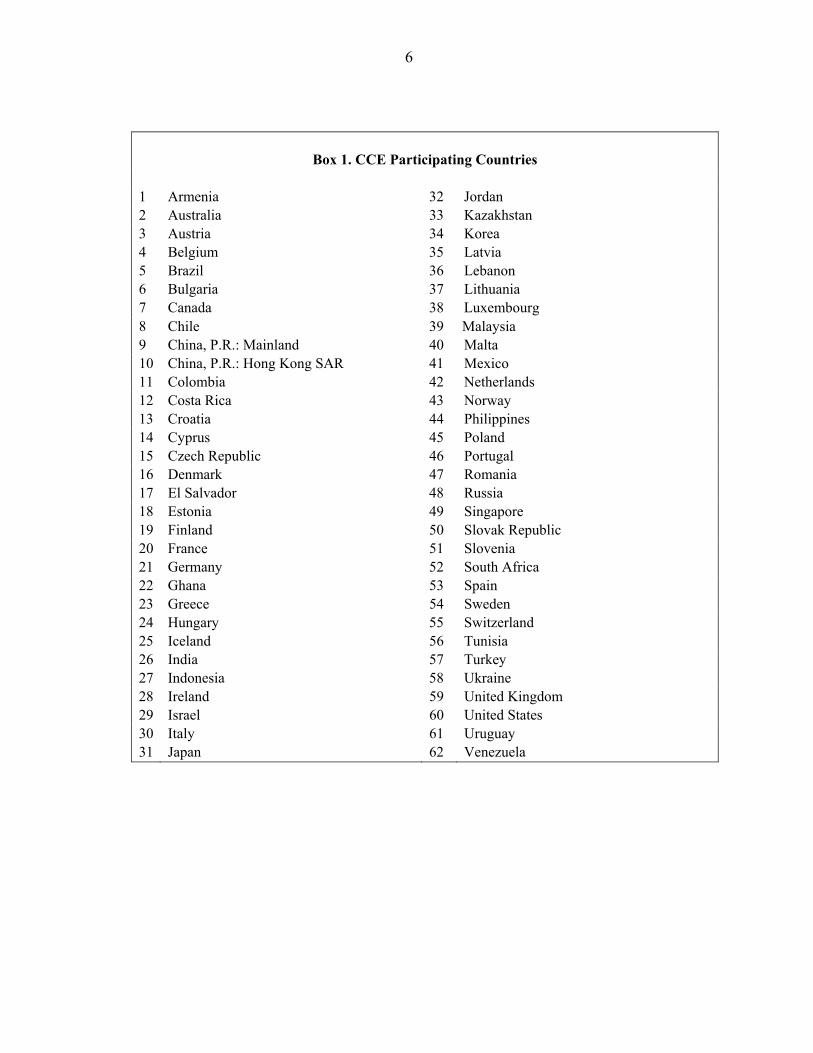
Box 1. CCE Participating Countries
1 Armenia 32 Jordan 2 Australia 33 Kazakhstan 3 4 5 6 7
Austria Belgium Brazil Bulgaria Canada
34 35 36 37 38
Korea Latvia Lebanon Lithuania
Luxembourg 8 Chile 39 Malaysia 9 China, P.R.: Mainland 40 Malta 10 China, P.R.: Hong Kong SAR 41 Mexico 11 Colombia 42 Netherlands 12 Costa Rica 43 Norway 13 Croatia 44 Philippines 14 Cyprus 45 Poland 15 Czech Republic 46 Portugal 16 Denmark 47 Romania 17 El Salvador 48 Russia 18 Estonia 49 Singapore 19 Finland 50 Slovak Republic 20 France 51 Slovenia 21 Germany 52 South Africa 22 Ghana 53 Spain 23 Greece 54 Sweden 24 Hungary 55 Switzerland 25 Iceland 56 Tunisia 26 India 57 Turkey 27 Indonesia 58 Ukraine 28 Ireland 59 United Kingdom 29 Israel 60 United States 30 Italy 61 Uruguay 31 Japan 62 Venezuela

7
Box 2. Timetable of Key Actions in the CCE
Key Action Date Achieved Goal Plenary meeting for CCE countries
November 2004
Finalization of TOR and work program of the CCE
Finalization of data and metadata report forms
February 2005
Finalized forms in consultation with CCE countries
Submissions of data and metadata First draft metadata
End-March 2005
First review of FSI metadata
Second draft metadata
End-October 2005
Second review of FSI metadata
Third draft metadata
End-March 2006
Third review of FSI metadata
Final data and metadata
End-July 2006
Collection of final FSI data and metadata
Two rounds of (cross-) regional meetings Joint Vienna Institute
May 2005, May 2006
Provision of technical assistance
European Central Bank
May 2005, May 2006
Provision of technical assistance
Singapore Regional Training Center
June 2005, May 2006
Provision of technical assistance
Brazil Training Center
July 2005, July 2006
Provision of technical assistance
Dissemination of FSI data and metadata
January 2007 February 2007 May 2007
Enhanced transparency of data and metadata
Three rounds of Reference Group meetings
November 2004 December 2005 May 2007
Exchange of information/views with international organizations on FSI/CCE work and issues
Post-exercise meeting for CCE countries May 2007
Assessment of experience and discussion of proposals for further work on FSIs
Survey of country views on the CCE/FSIs
End-June 2007
Collection of views from all CCE countries on the CCE experience and on further work on FSIs
8
Box 3. Members of the CCE/FSI Reference Group 1. African Development Bank (AfDB) 2. Arab Monetary Fund (AMF) 3. Asian Development Bank (ADB) 4. Association of Supervisors of Banks of the Americas (ASBA) 5. Central Bank of West African States (BCEAO) 6. Center for Latin American Monetary Studies (CEMLA) 7. Committee of European Banking Supervisors (CEBS) 8. Bank of Central African States (BEAC) 9. Bank for International Settlements (BIS) 10. European Central Bank (ECB) 11. Eastern Caribbean Central Bank (ECCB) 12. Inter-American Development Bank (IADB) 13. Islamic Banking Supervision Association 14. Islamic Financial Services Board (IFSB)15. Organization for Economic Co-operation and Development (OECD) 16. World Bank (WB) 17. International Accounting Standards Board (IASB)
4. To facilitate the implementation of the CCE work program, STA provided technical assistance to countries in the compilation methodology recommended in the Guide. This assistance took the form of (i) provision of technical advice from headquarters, in particular during the staff review of three submissions of countries’ draft metadata, and the submission of countries’ final data and metadata; (ii) two rounds of (cross-) regional meetings to discuss issues in the implementation of the CCE, address cross-cutting issues in the compilation of FSIs and the preparation of metadata, and review with countries their draft FSI metadata and preliminary FSI data; (iii) bilateral consultations with countries that visited STA for additional technical assistance in their work in the CCE;4 and (iv) a mission for technical assistance and training.5 5. To ensure uniform and consistent collection and reporting of data and metadata, STA in consultation with CCE countries and the Monetary and Capital Markets Department (MCM) developed standard data and metadata report forms. These forms included a data report form (DRF), a metadata template (MT), and a metadata questionnaire (MQ). The DRF facilitated the presentation of FSI ratios compiled and the underlying data series used in their compilation, the review of the reported FSI ratios, and the processing and tabulation of the FSIs for meeting various data needs. The MT and MQ aimed at organizing the information
4 STA received visits of officials from Indonesia and China in 2006.
5 A training course for Chinese officials on the framework of the Guide and specific issues in the compilation of FSIs for the CCE was conducted by STA staff in Dalian, China in November 2005.

9
on the national practices that govern the compilation of FSIs. The MT was used to describe succinctly the deviations of the country practice from the Guide. The MQ provided a fuller and more comprehensive description of national practices and deviations from the Guide. 6. STA with the assistance of the Technology and General Services Department (TGS) created a set of web pages on the Fund’s external website to disseminate the information collected in the CCE. They include a CCE home page, a FSI data page, and a FSI metadata page.6 The CCE home page provides information on the FSIs and the CCE. The FSI data page provides access to the FSI data and underlying data reported by countries. Information can be accessed by country participating in the CCE. Links take the user to the specific metadata of a given FSI or underlying series. The FSI metadata page provides access to the metadata submitted by countries—the MT and the MQ. Information on metadata can be searched by country, by questions, and by text search within the MQ for one or more countries, as well as by type of information within the MT for one or more countries. Moreover, links take the user from metadata to the data, from the MT to the MQ, and from both the MQ and the MT to the relevant passages in the Guide. These facilities are provided to assist data users to obtain and compare information across countries effectively, and facilitate the retrieval of metadata and their comparison with the recommendations of the Guide. 7. STA with TGS also made available FSI data and metadata to Fund internal users through the Economic Data Sharing System (EDSS). Apart from the provision of the standardized FSI tables for each country, internal Fund users were given the facility to sort the FSI data, as well as the underlying data, by nine analytically significant dimensions (e.g., consolidation basis, presence of consolidation adjustments, use of accrual accounting, etc.), thus promoting the identification of truly comparable data.
III. EXPERIENCE WITH THE CCE
8. Following the CCE work program, 57 out of the 62 CCE participating countries have submitted their final FSI data and metadata so far. FSI data for individual countries are included in Tables 2, 3, and 4, arranged in various potential peer groups.7
9. FSIs for deposit takers (DTs) were the most commonly compiled indicators, reflecting a number of factors. All countries compiled the core set of FSIs (Table 1), which all pertain to the sector of DTs, as compilation of the core set was required under the terms of reference of the CCE.8 The DTs sector was also the sector for which encouraged FSIs were most 6 They can be found at http://www.imf.org/external/np/sta/fsi/eng/cce/index.htm. 7 On peer groups see paragraph 18.
8 However, not all indicators in the core set were reported by all countries. For a few countries it was not possible to submit data for one or more of the core FSIs (Table 1).

10
commonly compiled by countries (84 percent), confirming the view of the Guide that this sector remains central to financial soundness analysis, and is favored by a greater availability of data. FSIs for the other financial corporations (OFCs) sector were the second most compiled FSIs, followed by the household sector and the sector of nonfinancial corporations (NFCs). The relatively small number of countries (35 percent) compiling FSIs for NFCs reflected to a large extent the difficulties experienced by many countries in collecting aggregate data for the NFC sector. 10. Regarding the source of data, supervisory sources dominated the compilation of FSIs for DTs with well over 80 percent of FSIs compiled using such data (Table 5.a). This reflected the fact that FSIs are seen (and used) by countries by-and-large as an extension of microprudential ratios compiled for individual deposit takers (groups) for supervisory purposes. For other sectors, the data sources are more diverse, confirming a lower degree of data development for these sectors. The number of submissions for any given FSI may exceed the number of countries reporting FSIs in the CCE (Table 1) because some countries saw the need for different coverages for certain indicators. 11. A wide range of methodologies were used in compiling FSIs for the CCE. This was due to (i) diversity of supervisory and accounting practices across CCE participating countries; (ii) data availability in the participating countries; (iii) costs involved in collecting additional data to fully implement the recommendations of the Guide; and (iv) diversity of country views on the appropriate methodology of FSI compilation. The main areas of methodological differences from the Guide are on the consolidation basis, inter-group consolidation adjustments, and on a few accounting practices under the International Financial Reporting Standards (IFRS). 12. There was wide diversity of consolidation bases in data reported for deposit takers in the CCE. Domestically controlled, cross-border (DCCB) consolidation basis is the approach recommended by the Guide for compiling FSIs for DTs (Box 4). However, as shown in Table 6.a, DCCB was not the consolidation basis most commonly used to compile the core set of FSIs for DTs—only 9 percent of the reported core FSIs were compiled on this basis. More commonly used than the DCCB were the domestic consolidation (DC) basis (39 percent), the domestically controlled, cross-border and cross-sector (DCCBS) basis (26 percent), the cross-border, cross-sector basis for all domestically incorporated DTs (CBCSDI) (15 percent), and other bases (11 percent). A similar result emerges from an inspection of the consolidation bases used, arranged by country (Table 7). The additional element that emerges from this view is that there is a diversity of consolidation bases used not only across countries but also within countries. More than a third of the countries in the CCE used a mix of consolidation bases to compile the core set of FSIs, while 19 percent of countries compiled more than one set of core FSIs using different consolidation bases.

11
Box 4. Consolidation Bases
Consolidation basis refers to institutional coverage, i.e., the totality of entities that are defined to constitute a population of institutions (a sector) for which FSIs are to be compiled. There are different consolidation bases, and thus different populations that can be defined. The data of the institutions that belong to the defined population are the basis on which aggregation and any consolidation adjustments can be applied to produce the population-level (sector-level) data from which FSIs are compiled. It should be noted that the term consolidation basis does not imply that certain consolidation adjustments have necessarily been applied to the aggregated data. The consolidation bases used by countries in the CCE are the following: Domestically controlled, cross-border (DCCB) consolidation basis includes the data of domestically controlled and incorporated entities with their branches (domestic and foreign) and all their subsidiaries (domestic and foreign) that are classified in the same sector. Domestic consolidation (DC) basis includes the data of resident entities along with those of their branches and subsidiaries (if any) in the same sector that are resident in the domestic economy. Domestically controlled, cross-border and cross-sector (DCCBS) consolidation basis is similar to DCCB, but has a broader coverage in that the data also include those of subsidiaries in other sectors (such as securities dealers and investment funds). Cross-border consolidation basis for all domestically incorporated entities (CBDI) covers both domestically controlled entities and the local subsidiaries of foreign entities in the sector, along with their branches and subsidiaries in the same sector, which can be either domestic or foreign residents. Cross-border and cross-sector consolidation basis for all domestically incorporated entities (CBCSDI) has a broader coverage than CBDI as the data also include those of subsidiaries of the reporting groups in other sectors. Other consolidation basis refers to institutional coverages other than those mentioned above.
13. Intra-group consolidation adjustments were the norm in the CCE data. The Guide recommends that both intra-group and inter-group consolidation adjustments are carried out in compiling FSIs (see Box 5 for a brief description of consolidations adjustments). Regarding intra-group consolidation adjustments, there was wide ranging consistency with the Guide, as intra-group consolidation adjustments were fully carried out in 71 percent of core FSIs reported, and were partially carried out in 17 percent of core FSIs (Table 8.b). The reason is that these data are by-and-large from supervisory sources, which usually require that such adjustments be carried out in the data by reporting entities (groups).
14. Inter-group consolidation adjustments were carried out to a much smaller extent and most often in a partial manner. About 34 percent of the submitted core FSIs were compiled using full (10 percent) or partial inter-group adjustments, while 42 percent were

12
compiled without any inter-group adjustments; inter-group adjustments were not applicable to 24 percent of the reported core FSIs (Table 8.b). The incidence of inter-group consolidation adjustments was significantly increased by the fact that they were de facto carried out (in part or in full) on account of supervisory deductions from the FSI-underlying data series for total regulatory capital, Tier 1 capital, and risk-weighted assets. However, this often also led to differential application, across different FSIs of a given country, of the adjustments related to equity positions in the population. If one were to abstract from the effect of the supervisory-based series, any given inter-group adjustment of balance sheet data would be found to have taken place in 23–25 percent of countries, and for income and expense statement data in 9–14 percent of countries (Table 9.a). Partial inter-group adjustments for a given FSI were common: countries often either carried out fully only a subset of the recommended adjustments (Table 9.b) and/or they applied thresholds which would not permit the adjustment of positions (flows) with some members of the population.9 In the event, only three countries made in full all recommended inter-group adjustments to balance sheet and income and expense statement data used in their reported FSIs.
9 For example, a country may have data where fees and commissions among deposit takers are eliminated from sector-level data, but the remaining six inter-group consolidation adjustments recommended for income and expense data are not carried out. Another case is when the country carries out the recommended elimination of the market value of the shares and other equity investments in other groups in the reporting population, as long as this value is above a certain threshold, specified usually in national supervisory regulations as a percent of capital.

13
Box 5. Consolidation Adjustments
Intra-group consolidation adjustments involve consolidation of all flows and positions among units within each group in the population. A group may consist of more than one institutional unit and in the Guide it is defined to include a parent, its subsidiaries, and its branches. It should be noted that if a cross-border consolidation basis is adopted (such as DCCB, DCCBS, or CBCSDI), these institutional units may be domestically based or foreign based. Moreover, if a cross-sector consolidation basis is adopted (such as DCCBS or CBCSDI), these institutional units may belong to the same or different economic sectors. Therefore, the composition of groups would vary if the consolidation basis changes, and thus the intra-group consolidation adjustments that are applicable would vary in magnitude.
Inter-group consolidation adjustments involve the elimination of some (but not all) flows and positions among groups. This amounts to the elimination of positions and flows between a parent and its associates (i.e., institutions on which the parent has some control, and which are not subsidiaries) as well as between one group and other (less-related or unrelated) entities in the population. However, inter-group interest flows are not eliminated. Moreover, inter-group positions exempted from consolidation are positions among groups in debt and financial derivatives. This is recommended in order to enhance monitoring of risk exposures and the potential for contagion.
For the income and expense statement, there are seven inter-group adjustments, which relate to the elimination of (1) provisions for accrued interest on inter-group loans, (2) inter-group fees and commissions, (3) inter-group dividends receivable and payable, (4) an investing group’s pro-rated share of the earnings of an associate from the same reporting population, (5) other inter-group income, (6) gains and losses on ownership of shares and equity of other groups in the reporting population, and (7) specific provisions on loans to other groups in the reporting population.
For the balance sheet, there are three inter-group adjustments, which relate to the elimination of (1) the investing group’s pro-rated share of capital and reserves of an associate in the reporting population, (2) the market value of the shares and other equity investments in other groups in the reporting population, and (3) specific provisions on loans to other groups in the reporting population.
15. The ongoing convergence towards adoption of IFRS increased overall consistency between national accounting practices and the Guide. However, in a few areas in which the Guide departs from IFRS it also resulted in the divergence of practices of the majority of CCE participating countries from the Guide. The Guide’s recommendations that differ from the IFRS are identified in Box 6. As of the end-2005 reference date of the CCE, 75 percent of CCE participating countries prepared FSIs for DTs that had been compiled in full (32 percent) or partial consistency with IFRS (Table 10). Regarding the specific areas of divergence between the Guide and IFRS (abstracting from the matter of consolidation basis), 44–70 percent of countries opted for the IFRS treatment on any given area (Table 10). The remainder provided data consistent either with the Guide’s recommendations on any given area (5–40 percent of countries) or with local accounting standards, which differ from both the IFRS and the Guide.

14
Box 6. Main Differences between the Guide and IFRS
Consolidation basis: IFRS, according to International Accounting Standards (IAS) 27, require that financial statements be prepared for a group that includes the parent company and all of its subsidiaries irrespective of the sector they belong to. Subsidiaries are entities controlled by a parent company. The Guide recommends that a domestically controlled cross-border (DCCB) consolidation basis be used, where the consolidation includes only deposit takers (see Box 4). Principle for recognizing assets and liabilities: The International Accounting Standards Board (IASB) framework determines whether assets and liabilities exist and are outstanding on the basis of criteria regarding control and the probability of future economic benefits that can be measured reliably. Moreover, IAS 39 notes that an entity shall recognize a financial asset or liability on its balance sheet when the entity becomes a party to the contractual provisions of the instrument. IAS 39 also states that a regular way purchase or sale of financial assets shall be recognized and derecognized, as applicable, using trade date accounting or settlement date accounting. The Guide states instead that whether assets and liabilities exist and are outstanding is determined at any moment in time by the principle of ownership. Fees and commissions receivable/payable: The Guide differs from IAS 18 in that it does not adjust the effective yield of a financial instrument for fees that are an integral part of the effective yield of an instrument, but records them under fees and commissions receivable and payable. Gains and losses on available-for-sale assets: Under IAS 39, they are recognized in equity except in the case of impairment losses, foreign exchange gains and losses, and when the asset is derecognized. The Guide recommends instead that gains and losses on available-for-sale assets always be included in the income statement. Gains and losses on cash flow hedges, hedges of a net investment in a foreign operation, and (potentially) hedges for the foreign currency risk of a firm commitment: According to IAS 39, the ineffective portion of gains and losses on the above hedging instruments is recorded in the income statement. Meanwhile, the effective portion of the gains or losses on a cash flow hedge or hedge of a net investment in a foreign operation, and potentially on a hedge for the foreign currency risk of a firm commitment, is accounted directly in equity and is recycled to the income statement only when the hedged transaction affects profit or loss. This differs from the Guide, which recommends that all gains and losses on hedging instruments always be included in the income statement. Valuation of held-to-maturity instruments: Under IAS 39, held-to-maturity instruments (that are otherwise tradable) are to be valued at amortized cost. In the Guide it is recommended that they are market or fair valued if they are tradable. Valuation of loans and receivables: Under IAS 39, loans and receivables are to be valued at amortized cost. In the Guide it is recommended that nominal value is used instead, as for all nontradables.
16. Besides country differences from the Guide on consolidation basis, consolidation adjustments, and IFRS-related accounting, there were also other differences. These differences were either related to the definition of a specific FSI and its underlying series or to some aspect of accounting. Regarding differences from the Guide in the definition of data series,

15
some of the most common were those related to the series underlying liquidity indicators (I10 and I11) in the core set: 51 percent of countries defined liquid assets to include inter-bank claims and 58 percent of countries defined short-term liabilities to include inter-bank liabilities. Differences also arose often regarding the definition of loans—59 percent of countries deviated from the Guide by including tradable loans and trade credits and/or excluding repos/financial leasing and inter-bank loans. The definition of the encouraged FSI on large exposures (I14) was also an area where there were significant differences from the Guide, and several countries opted to redefine the indicator as total value of large exposures to capital in place of the available options offered in the Guide. Other differences with the Guide, included the exchange rate used for conversion into the unit of account, the definition of foreign currency instruments, the treatment of potential costs, and the specification of the asset boundary (see Tables 11a, 11b, 11c, and 11d).
17. The use of national practices in compiling supervisory-based series, which can differ from the Basel Committee on Banking Supervision (BCBS) approach under Basel I,10 introduced another source of variation across country practices in compiling FSIs. The Guide defers to national practices in compiling such data series, which comprise total regulatory capital, Tier 1 capital, and risk-weighted assets.11 Almost all CCE countries (98 percent) used the Basel framework to compile these series, but only 54 percent followed BCBS guidance in all areas (Table 12). Almost all of the remaining countries (44 percent) differed from the framework in one or more of the following areas: use of Tier 3 capital, treatment of goodwill, and treatment of certain innovative instruments.12 The remaining two percent of participating countries followed national standards.
18. The diversity of methodologies used in compiling FSIs for the CCE indicates that wide-ranging cross-country comparability of FSIs remains a goal still to be achieved, but comparisons among countries can now be made more reliably. The extensive metadata on CCE countries’ data provide crucial information on the establishment of suitable peer groups within which comparisons could be made. Different peer groups can be constructed by specifying an increasing number of methodological areas where countries have the same practice. Given the current level of diversity of compilation practices across countries, specifying a larger number of methodological areas in which countries follow the same approach would lead to peer groups with very few members. The analyst therefore has to exercise judgment in striking an appropriate balance between homogeneity of peer groups and adequate number of countries in these groups. An important input into such an assessment is the potential effect of a
10 Basel II was not widely applied by the reference date of the CCE.
11 These are series to be directly sourced from supervisory information because the definitions conform to supervisory guidance.
12 Not using Tier 3 capital was the most common deviation, characterizing 37 percent of CCE countries.

16
methodological variation on the value of a FSI.13 Examples of possible peer-groups constructed from the CCE data (Tables 2, 3, and 4) show how a continuum of peer groups can be created by using countries’ FSIs whose compilation is the same in an increasing number of methodological dimensions.
IV. METHODOLOGICAL ISSUES IN COMPILING FSIS
19. Countries found the Guide helpful during the CCE,14 but in the light of the experience gained in this exercise and in the Fund’s surveillance and analytical work with FSIs in recent years, amendments to the Guide in specific areas are deemed necessary. The issues and perspectives that were taken into consideration to ascertain the needed amendments, which are summarized in section IV.B of the staff report, are described in detail below.
20. The views of CCE participating countries and collaborating international institutions were major inputs in considering possible amendments in FSI methodology. Countries, along with collaborating international and regional institutions, expressed their views during a meeting held at IMF headquarters during May 30–31, 2007 on the occasion of the completion of the CCE. The staff also sent out a survey to methodically collect the views of all CCE participating countries so as to reflect their views in this paper. In the event, 51 out of the 62 countries participating in the CCE returned the survey to STA with their answers.15 The results of the survey are provided in Table 13.
13 For example, varying the consolidation bases used by countries in the CCE appears to significantly affect FSI values and should probably not be ignored in constructing any peer groups (see Box 7). Other differences, however, such as those arising from the presence/absence of inter-group consolidation adjustments may have a smaller effect in many cases and could potentially be ignored under certain circumstances (see Box 8).
14 See Table 13.
15 The percentages reported from the survey refer to percent of countries that have responded to the given question in the survey.
17
A. Consolidation Basis
21. A major issue that arose in the CCE was the appropriate consolidation basis in compiling FSIs for deposit takers.16 In the view of most of the CCE participating countries (86 percent) that responded to the survey, the Guide’s recommendation for a domestically controlled cross-border consolidation basis should be amended (Table 13). Most responding countries (86 percent) also expressed a preference for the Guide not to provide a singular recommendation on consolidation basis; virtually all of those countries preferred a limited set of options to be offered by the Guide. From the combination of options offered by countries, no clearly preferred combination emerged. However, certain options for consolidation basis were clearly more often included than others in the combinations proposed by countries (Table 14); these were the DCCBS, DC, and CBCSDI bases, in order of prevalence. When countries were asked which single consolidation basis was best suited for assessing the health of a country’s financial system, CBCSDI, DCCBS, and DC were noted in that order of preference (Table 13, section II, question 1).
22. The issue of whether the Guide should amend its current recommendation on consolidation basis ought to be informed by countries’ needs in financial soundness analysis. Currently, there is clearly a diversity of needs across countries in their financial soundness analyses. These needs depend on country circumstances regarding (i) the degree of cross-sectoral ownership between deposit takers and other financial corporations, (ii) the prevalence of foreign control of deposit takers operating domestically, (iii) the modalities of the presence of foreign controlled institutions in the country (i.e., subsidiaries as opposed to branches), and (iv) the extent of cross-border operations of domestically incorporated deposit takers. For example, countries would find most useful DCCBS as a consolidation basis when they have a high degree of cross-sectoral ownership, foreign controlled institutions are limited in importance, and cross-border operations are significant. If, in addition, there is also a significant degree of foreign control of domestically incorporated institutions, then CBCSDI would be an appropriate choice (potentially with DCCBS as a supplementary option to provide a view of the part of the sector primarily supervised by national supervisory authorities). Finally, in case there is little cross-sectoral ownership, significant foreign presence—including in the form of branches of foreign deposit takers—and limited cross-border operations, then the DC basis would meet the needs of financial soundness analysis.
23. In amending the recommendation of the Guide on consolidation basis it is important to consider the need for cross-country comparable data. CCE countries have emphasized during the CCE plenary meeting and elsewhere the importance of generating cross-country comparable indicators. Cross-country comparable data would help enrich financial soundness analysis in a given country as well as across countries, by providing large numbers of countries 16 Regarding the consolidation basis for sectors other than deposit takers (i.e., other financial corporations, nonfinancial corporations, and households), countries have expressed the view that DC basis is more relevant than other bases. The Guide currently recommends DC along with DCCB as two alternative bases for these sectors.

18
as true comparators.17 At the same time, however, such country-comparable data should be able to capture emerging trends in the financial system, such as increasing cross-sector ownership, foreign control of institutions operating domestically, and cross-border operations. If the Guide were to recommend a very limited number of consolidation bases that addressed those issues, it would serve to move towards clustering of FSI compilation approaches of countries around those few options over the medium term. In these circumstances, even if not all countries’ FSIs would be comparable, there would be comparability among the FSIs of significant numbers of countries that form a given cluster.
Box 7. Implications for FSIs from Varying the Consolidation Basis
The FSI data collected for the CCE provide a rough indication of the implications of different consolidation bases on FSI values because several countries compiled two or more sets of FSIs using a different consolidation basis for each set. The data presented below show the effect on FSI ratios from switching from a given consolidation basis to another, averaged over the—admittedly small—number of countries that provided data on each pair of consolidation bases. A caveat is that while in some of these country cases the consolidation basis is the only variable that is changing, in others there are some other variables (such as accounting standards) that may be changing too.
Average Diff 1/ Average Diff 1/ Average Diff 1/ Average Diff 1/
DCCBS - CBCSDI DC - DCCB DC - CBCSDI DC - DCCBS
I1 Regulatory capital to risk-weighted assets 0.43 3.04 0.61 0.86I2 Regulatory Tier 1 capital to risk-weighted assets 0.18 3.48 0.65 2.30I3 Nonperforming loans net of provisions to capital 2.10 11.75 4.51 6.33I4 Nonperforming loans to total gross loans 0.20 2.85 1.78 1.07I5 Sectoral distribution of loans to total loans n.a n.a n.a n.aI6 Return on assets 0.12 0.05 0.14 0.35I7 Return on equity 3.03 2.49 3.26 4.70I8 Interest margin to gross income 0.54 9.32 4.70 11.13I9 Noninterest expenses to gross income 1.23 4.17 4.16 8.79I10 Liquid assets to total assets 1.13 6.08 0.21 3.09I11 Liquid assets to short-term liabilities 2.36 6.99 3.16 10.11I12 Net open position in foreign exchange to capital 2.40 2.98 n.a 7.91
1/ Average of the absolute value of differences.
(in percent)Core Set: Quantitative Implications of the Use of Different Consolidation Bases
Descriptions
The data show that the changes caused to FSI ratios by switching consolidation bases can be up to several percentage points. Therefore, consolidation basis appears to be an important methodological dimension that has to be taken into account in identifying which FSIs (within or across countries) are comparable.
17 On the implications of using different consolidation bases on the comparability of FSIs, see Box 7.
19
24. Given the considerations above, there are two main options in amending the recommendation of the Guide on consolidation basis:
• One recommendation would be to choose CBCSDI and/or DCCBS as consolidation bases as these two bases appear suitable to capture most potential risks within the group. The Guide would recommend that FSIs and their underlying data be provided for both these consolidation bases if the country authorities assess that there is significant but not nearly complete foreign control of domestically incorporated deposit takers. The Guide would continue to include a discussion on alternative consolidation bases (such as DC, DCCB, CBDI) for the reference of countries that may still prefer to use such approaches as best suiting their circumstances.18 • An alternative recommendation would be to offer CBCSDI and DCCBS as choices, but also explicitly add DC as a fully recommended alternative consolidation basis; other elements of the first approach would be maintained.
25. Regarding the two alternative recommendations above, a number of issues could be highlighted: • The first recommendation would be consistent with the views of those CCE participating countries that have argued that the Guide should recommend only consolidation bases that a priori satisfy the cross-sector and cross-border institutional coverages of the Basel capital adequacy framework. The second recommendation would be consistent with the views of countries that argued that the set of options should be determined by the frequency with which consolidation bases were actually used in the CCE (Table 6). • If the second recommendation were to be adopted, there would likely be greater diversity of compilation methodologies over the long-term. This would decrease somewhat the comparability of FSIs across countries. • The DC basis in the second recommendation could offer a more tailored view of some countries’ financial sectors, at least for a while. • The second recommendation would lead in the short-run to a lower reporting cost of FSIs for countries currently using the DC basis, as data availability considerations were the single most important factor for countries in choosing their consolidation basis for reporting FSIs in the CCE (Figure 1).19 However, even under the first recommendation, countries would not be 18 The Guide could also be amended to encourage countries to compile and disseminate FSIs and underlying data series for the branches of foreign deposit takers operating in their territory as supplementary information, if they deemed such branches important to the assessment of soundness of their financial systems.
19 In this context, it is noteworthy that the outcome of the CCE shows that 37 percent of countries used to varying degrees multiple consolidation bases to compile different FSIs, and DC basis was often the one of the multiple bases used by such countries (Table 7). This may be attributed to data availability in some cases and in other cases to countries’ views that consolidation basis should be allowed to vary given the specific FSI compiled (and its use).

20
required to abandon the DC basis, but would be able to compile FSIs using any basis they wished (with supporting metadata). • Under the second recommendation, there would probably be more switches in country practices from DC to CBCSDI over the medium- and long-term (instead of in the short-term) as developments in countries regarding cross-sector ownership and cross-border operations eventually render the DC basis less useful. This would lead to breaks in the FSI time series (along with deferred increased reporting costs) for these countries and, consequently, difficulties in analysis.
Figure 1: CCE–Rationale for Countries in Choosing Consolidation Bases for Reporting FSIs
38%
19%
23%
11% 3%6%
data availabilitysuitability for the analysis of the financial soundness of a countryrelevance of foreign controlled deposit takers in a countrytrying to follow the Guide’s recommendationFSI data comparability across countriesOther
26. Taking into consideration the matters above, the following amendments to the Guide were deemed appropriate: The Guide’s current recommendation for a domestically controlled cross-border consolidation basis will be amended. The new recommendation will be (i) the cross-border cross-sector consolidation basis for all domestically incorporated deposit takers (CBCSDI) and/or (ii) the domestically controlled cross-border and cross-sector (DCCBS) consolidation basis. The Guide will recommend that FSIs and their underlying data be provided for both these consolidation bases if the countries consider that there is significant foreign control of domestically incorporated deposit takers.20 The Guide will continue to include a 20 FSIs would be usefully compiled using both consolidation bases when a country deems that the share of foreign controlled institutions in the sector is not so large so as to render compilation for the domestically controlled part of the sector of little value.

21
discussion on alternative consolidation bases (such as DCCB, CBDI, DC) for the reference of countries that may still prefer to use such approaches as best suiting their circumstances. Metadata and data report forms for reporting to the IMF will be amended accordingly. The Guide will be amended to encourage countries to compile and disseminate FSIs and underlying data series for the branches of foreign deposit takers operating in their territories as supplementary information, if the presence of such branches is deemed by the country as significant.
B. Inter-Group Consolidation Adjustments
27. Another major issue that arose in the CCE was the relevance of inter-group consolidation adjustments for data used to compile FSIs. As discussed in paragraph 14, there was some use of inter-group consolidation adjustments in compiling data for the CCE, mostly for certain inter-group positions (and to a much lesser extent for inter-group flows) (Tables 8 and 9). Supervisory-based concepts of capital were the data series that showed the highest incidence of adjustments,21 as the latter were de facto carried out when supervisory deductions were made. About 62 percent of the countries responding to the survey expressed the view that inter-group adjustments should not be recommended by the Guide, citing analytical, data availability, quantitative significance, and cost considerations (Table 13). The remaining 38 percent of responding countries were of the view to maintain the recommendation of the Guide on the matter, and expressed a preference for fully inter-group consolidated data as opposed to data that had been consolidated just at the level of reporting groups.
28. Regarding whether the Guide should amend its current recommendation on inter-group consolidation adjustments, the following issues could be highlighted: • Inter-group adjustments were recommended by the Guide to eliminate the double-counting of income and capital in the sector. They are essential in measuring the flows of resources between sectors as well as the equity positions among sectors, but they may not always be useful for the analysis of financial soundness for reasons indicated below. • Inter-group consolidation adjustments render the derived FSIs different from simple weighted averages of reporting group data, and thus FSIs cannot be simply disaggregated to the indicators of individual reporting groups. Therefore, interpretation of FSIs with inter-group consolidation adjustments may become more complex. • Certain inter-group adjustments could be justified for the same reasons that supervisory deductions for total regulatory capital or Tier 1 capital can include eliminations of positions between institutions where there is a greater-than-specified degree of control: the resources of an
21 Total regulatory capital and Tier 1 capital.

22
institution could potentially be used to buttress those of another one if it was a related entity.22 If such a rationale of inter-group adjustments were to be accepted, adjustments would be called for positions or flows among institutions for which supervisors feel there is a high enough degree of relatedness, and not for all institutions in the population (sector) as currently recommended in the Guide. • The quantitative effect of inter-group adjustments on the values of FSIs is difficult to determine a priori and is bound to be country specific. Most CCE countries that responded to the survey viewed the effect as not significant (43 percent on flows and 41 percent on positions), but 24 percent of countries rated the effect as significant or somewhat significant (Table 13). About one third of responding countries indicated the significance of the effect was unknown. There are indications that in the countries that actually carried out the adjustments in the CCE, the effect was relatively limited but not necessarily negligible (see Box 8). • The data requirements for carrying out inter-group adjustments could be burdensome and costly, especially for countries with many institutions, whose data would be subject to such consolidations. The Guide currently notes that judgment would need to be exercised on the benefits and costs of collecting new data to carry out inter-group adjustments. • If the Guide were to recommend against inter-group adjustments, there would still be inter-group adjustments de facto being carried out for many countries’ supervisory-based series used to compile several FSIs for deposit takers. Reversing such inter-group adjustments would also be costly and burdensome.
• Cross country comparability of FSIs could decrease if quantitatively significant inter-group adjustments are made in the data by some countries and not by others. Comparability may be further compromised if countries do not carry out all consolidation adjustments that may be significant, but only some of them.
22 Such positions are also eliminated when they are deemed by supervisors to be in place to inflate the capital position of banks.

23
Box 8. Quantitative Effect of Inter-Group Consolidation Adjustments on FSIs
The FSI data collected for the CCE provide an indication of the effect of certain inter-group consolidation adjustments on the values of FSIs. This is possible because several countries reported, as part of the memorandum items in their sectoral financial statements, the magnitudes of adjustments on account of deposit takers’ shares and other equity investments in associates and other deposit takers in the population. These figures correspond to two of the three adjustments recommended by the Guide for stock data such as capital and total assets. With data on these adjustments, it is possible to generate two sets of FSI values (with adjustments and without adjustments, respectively) and to compare the magnitudes of these two sets of FSIs. The results are presented in the summary table below:
DCCB DC DCCBS CBCSDI OTHER ALL
I1 Regulatory capital to risk-weighted assets 0.37 0.41 0.20 0.10 1.04 0.45I2 Regulatory Tier 1 capital to risk-weighted assets 0.39 0.42 0.21 0.10 1.05 0.46I3 Nonperforming loans net of provisions to capital 0.86 0.99 0.08 n.a 0.61 0.71I7 Return on equity 0.36 0.80 0.46 0.30 2.01 0.79I12 Net open position in foreign exchange to capital 0.24 7.44 0.10 n.a 2.57 2.84
1/ Average of the absolute value of differences.
Core Set: Quantitative Implications of the Inter-Group Consolidation Adjustments for Equity Investments in Associates and Other Deposit Takers Resident in the Economy
Average Diff 1/Descriptions
(in percent)
The data show that the changes caused to FSI ratios by carrying out these specific adjustments have amounted by-and-large to fractions of percentage points for the countries for which data were available. For some countries, therefore, inter-group adjustments may be of limited quantitative significance. However, this does not preclude the possibility that for other countries the quantitative effect of the adjustments could be significant.
29. Given the considerations above, there are two main options in addressing the recommendation of the Guide on consolidation adjustments:
• One recommendation would advise against all inter-group consolidation adjustments. Countries whose supervisory-based series are de facto inter-group consolidated would still be able to use these series to compile FSIs, but the presence and degree of the existing adjustments would be documented in the metadata as they could affect cross-country comparability of FSIs. • An alternative recommendation would have the Guide cease to recommend inter-group adjustments. The Guide would offer a limited discussion of inter-group consolidation adjustments in financial statements for the reference of countries that may still prefer to use them. Moreover, de facto inter-group consolidation adjustments on account of implementation of supervisory deductions would not be discouraged by the Guide. The presence and degree of any

24
adjustments (explicitly or otherwise carried out) in a country’s data would be documented in the metadata as they could affect cross-country comparability of FSIs. 30. Taking into consideration the matters above, the following amendments to the Guide were deemed appropriate: Intra-group consolidation adjustments will continue to be fully recommended by the Guide. However, consolidation adjustments of inter-group positions and flows will cease to be recommended by the Guide. The Guide will offer a limited discussion of inter-group consolidation adjustments in financial statements for the reference of countries that may still prefer to use them. Moreover, de facto inter-group consolidation adjustments on account of implementation of supervisory deductions will not be discouraged by the Guide. Metadata forms for potential reporting to the IMF would be amended accordingly.
C. Relation of the Guide with BCBS Guidance
31. An issue that arose in the CCE is that the Guide relies on national practice in compiling supervisory-based series and does not explicitly defer to BCBS standards. The large majority (85 percent) of CCE participating counties expressed the view that the Guide should be amended to explicitly recommend that the approaches set out in Basel I and Basel II be followed in compiling supervisory-based underlying data series used to compile FSIs (Table 13).23 Moreover, about 63 percent of countries responding to the survey preferred that the Guide also explicitly follow BCBS on the matter of consolidation basis, which would favor the DCCBS and CBCSDI consolidation bases. The issues related to this latter matter were addressed above. 32. If the Guide were to be clarified to explicitly accept BCBS guidance in compiling supervisory-based series, the following issues would need to be taken into consideration:
• The existence of national variations in the implementation of BCBS guidance could be acknowledged in the Guide and these variations would usefully be documented in the FSI metadata so as to ensure transparency in determining the comparability of data. • With the gradual adoption of Basel II across and within counties, there may be issues of comparability of data both across countries as well as over time and across deposit takers within a given country (Box 9). Half of the CCE countries that responded to the survey expressed the view that with the introduction of Basel II, FSI data will become less comparable within a country, while 45 percent said that there would be less comparability across countries.24 In this 23 The supervisory-based series include total regulatory capital, Tier 1 capital, and risk-weighted assets.
24 Some countries have argued that the source of decreased comparability could arise from the concurrent use of Basel I and Basel II (and potentially also local standards) by different groups of deposit takers in a country, and/or the availability of different options for calculating risk-weighted assets under Basel II.

25
context, the FSI metadata would need to document how BCBS guidance is implemented in each country regarding the supervisory-based series used to compile FSIs. • The Guide may need to be amended to include a discussion on Basel II, in addition to the existing discussion on Basel I.
Box 9. Key Differences Between Basel I and Basel II
Basel I and Basel II both employ a common set of definitions for capital (i.e., total regulatory capital and Tier 1 capital) for calculation of FSIs that use these as underlying data. The key difference pertains to the method of calculation of another FSI-underlying series—risk-weighted assets. Under Basel I, risk-weighted assets are based on a uniform set of risk weights that are assigned to common asset categories. For example, all deposit takers must assign the same risk-weight to loans to OECD governments with no difference in the risk weighting. Basel II reflects the evolution of the Basel capital adequacy framework, as the assignment of risk-weights now more closely reflects loss experience for asset types. Basel II provides a further option that allows countries to use more than one approach for the assignment of the risk weights. These approaches range from the simpler standardized approach (which is very similar to Basel I), to more sophisticated internal ratings based (IRB) approaches that allow deposit takers to use their own risk models to determine the minimum capital.
33. Taking into consideration the matters above, the following amendments to the Guide were deemed appropriate: The Guide will be clarified to explicitly defer to Basel I and Basel II as the standards for compiling supervisory-based underlying data series, acknowledging that there could be national variations in implementation. The Guide will provide a description of Basel II, in addition to the one on Basel I already included. Metadata forms for potential reporting to the IMF will be amended accordingly.
D. Relation of the Guide with IFRS
34. An issue that arose in the CCE was whether the few differences between the Guide and IFRS should be maintained or the Guide should defer to IFRS on accounting issues. The vast majority of CCE participating countries (above 90 percent) responding to the survey expressed the view that the Guide should defer to IFRS on all accounting issues, except on the

26
matter of the consolidation basis (Table 13).25 Apart from the latter, the divergences between the Guide and IFRS concern only five areas, and responding countries (91 to 95 percent of them, depending on the area of divergence) felt that these differences should be eliminated by following IFRS guidance. The availability of data and cost of making the adjustments to IFRS-consistent data to conform to the Guide’s recommendations, as well as the harmonization of standards were noted as important considerations. Moreover, there do not appear to be overwhelming analytical arguments in favor of maintaining the current accounting recommendations of the Guide in the areas of divergence with IFRS. 35. Taking into consideration the matters above, the following amendments to the Guide were deemed appropriate: The Guide will be amended to defer to IFRS as the standard on accounting issues.26 Metadata forms for potential reporting to the IMF will be updated accordingly.
E. Contents of FSI List
36. The issue is whether there should be additions or deletions of FSIs regarding the list endorsed by the Executive Board and used in the CCE. There have been proposals advanced by about 60 percent of CCE participating countries that responded to the survey to eliminate some FSIs from the current list, while the remaining countries expressed the view that no FSI should be deleted from the current list (Table 13). While the majority of responding countries did favor some deletion from the list, there was significant diversity in their views as to which FSI should be eliminated. In all cases of FSIs being proposed for elimination, the view was supported by a couple of countries only, except in the case of encouraged FSI I14 (Large exposures to capital), the elimination of which was supported by about a quarter of responding countries. There were also numerous proposals for additions to the FSI list. However, there was little convergence on specific FSI formulations in the proposals for new FSIs offered by countries. The need to develop FSIs for OFC subsectors was however noted by several countries. Overall, 35 percent of countries proposed to add to the FSI list, while 30 percent of countries indicated that no new FSIs should be added to the list, and another 35 percent had no view on the matter. 37. A specific area for adding new FSIs that attracted significant interest throughout the CCE, has been the OFC sector. In the CCE plenary meeting in May 2007, there were calls for adding FSIs for major OFC subsectors (such as insurance, pension funds, other financial intermediaries, and financial auxiliaries) to the current list of FSIs. This was also the area for addition of FSIs pointed out most frequently by countries in the survey, although the number of 25 Regarding consolidation basis, the objection to adopting IFRS guidance was by-and-large an objection to IFRS being interpreted as including in the consolidation basis subsidiaries from the insurance subsector or from the nonfinancial corporations sector.
26 With regard to the consolidation basis, IFRS guidance would be followed at the level of the financial sector (excluding insurance companies).

27
countries that mentioned the matter in their survey responses was still quite limited. While some countries have offered some concrete proposals for such FSIs, in the CCE meeting the general view was that there is a need to reflect further on the appropriate FSIs for OFCs to include in the list, taking into consideration the new international supervisory standards that are being proposed as well as ongoing analytical research on the matter.
38. Taking into consideration the matters above, the following approach was deemed appropriate: For the time being, the FSI list will remain unchanged. Definitions of FSIs and their underlying series will also remain unchanged with a small number of technical modifications that are described in the below. Over the medium term, work would continue on assessing the need and feasibility of refining the list of FSIs and adding new FSIs.27 Moreover, it will be explored whether reporting countries should be asked to give priority in compiling certain encouraged FSIs, given their importance in Fund surveillance. Any proposal for additions to the FSI list would be based on broad-based consultations with Fund departments, international experts, and would be brought for consideration by the Board.
F. Definitions of Specific FSIs
39. There were proposals advanced by about 74 percent of responding countries to change the Guide’s definitions of certain data series used to compile FSIs. However, the survey results show little convergence on specific reformulations of FSIs in the proposals offered by countries. Nevertheless, from the discussions in the CCE plenary meeting, certain FSIs/underlying data series did appear to emerge as potential candidates for redefinition. They include the encouraged FSIs I14 (large exposures to capital), I32 (Number of applications for protection from creditors), I12 (net open position in foreign exchange to capital), and I25 (net open position in equities to capital), as well as the following underlying series for various FSIs: liquid assets, short-term liabilities, nonperforming loans, and net income. It should be noted, however, that in each of these cases, there were also participants to the CCE meeting who expressed support for retaining the current definitions of the Guide.
40. In considering amending the definitions of the identified FSIs and underlying series, the following issues were raised:
• Liquid assets: A view expressed by some CCE participating countries is that customer loans with up to three months remaining maturity could be excluded from liquid assets, either because of their perceived low liquidity or on prudential grounds. In support of the
27 New FSIs could potentially be added for major other financial corporations subsectors, for nonfinancial corporations and households in light of the need to provide leading indicators of financial soundness, as well as for deposit takers and financial markets. In addition, further work could involve assessing qualitative indicators (such as disclosure and transparency of the financial and nonfinancial corporations subsectors) as possible additional measures of soundness of the financial system.

28
continued inclusion of such customer loans in liquid assets, there is some evidence that in periods of uncertainty banks reduce the maturity of their customer loans.28 Moreover, the Guide currently recognizes that determining which assets are liquid involves judgment and allows flexibility in defining the series in each country (which may affect cross-country comparability of data). Only one country compiled data for the CCE excluding customer loans. Some countries have also argued that liquid assets should not exclude interbank positions, on the basis of their liquidity as well as for consistency with the definition of total assets. Moreover, the inclusion of interbank positions would render the resulting FSI comparable to the ratios reported by individual DTs. At the same time, the Guide argues that interbank positions do not constitute an “external” source of liquidity for the sector.
• Short-term liabilities: Some counties expressed the view that short-term liabilities should exclude customer deposits, given their perceived stability. Only one country compiled data for the CCE on this basis. Other countries have noted that such deposits could be volatile and therefore should be retained in the definition, as currently recommended in the Guide. Another matter concerns interbank positions: if the definition of liquid assets were to be modified to include them, then the definition of short-term liabilities would arguably need to be modified in that respect also.
• Nonperforming loans: There were views among CCE participating countries to modify
the definition by having a uniform criterion of 90 days for declaring a loan as nonperforming (i.e., by excluding stricter approaches) so as to improve cross-country comparability of data. This approach would also make the definition consistent with the draft of the ongoing System of National Accounts (SNA) revision and the forthcoming sixth edition of the Balance of Payments Manual.
• Net Income: Some countries have argued for keeping only one of the two options
currently offered in the Guide—the pre-tax (and extraordinary items) measure of net income or the post-tax measure—to promote cross-country comparability. To avoid the effects of different tax regimes, the pre-tax measure would be preferable. This measure was followed by 82 percent of countries in their CCE submissions.
• Large exposures to capital: This indicator was identified by a number of countries
responding to the survey either for elimination (25 percent) or redefinition (7.6 percent). The current three versions of the FSI are seen by many countries as either unsuitable for measuring large exposures (in the case of the version measuring total exposure of the 5 largest DTs to the 5 largest resident entities to capital and the version assessing total
28 Dangerous Markets: Managing in Financial Crises, Dominic Barton, Roberto Newell, and Gregory Wilson, 2002 (New York:Wiley).

29
exposure of DTs to affiliated entities and connected parties to capital) or leading to low cross-country comparability of data (such as in the version measuring the number of large exposures). Several countries used in their CCE submissions an alternative definition of the indicator—total value of large exposures to capital.
• Number of applications for protection from creditors: The indicator may not be
applicable to different countries’ legal frameworks, leading to low cross-country comparability of data. To address these issues, some countries proposed that the indicator be modified to measure the cases where bankruptcy proceedings are actually initiated.
• Net open position in foreign exchange to capital, large exposures to capital, and net
open position in equities to capital: The view was expressed that for these ratios, which are assessing solvency, only supervisory-based series of capital should be used, and not the balance sheet series for capital, as currently offered as an option in the Guide.
41. Taking into consideration the matters above, the following approach was deemed appropriate: All FSIs and their underlying series will retain the definitions currently recommended in the Guide. A limited number of exceptions follow, for which data and metadata report forms will be amended accordingly.
a. The definition of the data series “liquid assets,” underlying the FSIs “liquid assets to total assets” and “liquid assets to short-term liabilities,” will be amended to include interbank positions.
b. The definition of the data series “short-term liabilities” underlying the FSI “liquid assets to short-term liabilities” will be amended to include interbank positions.
c. The series “nonperforming loans” used to compile the FSIs “nonperforming loans net of provisions to capital” and “nonperforming loans to total gross loans” will be redefined on the basis of a uniform criterion of “principal or interest payments 90 days overdue” for declaring a loan as nonperforming (i.e., the definition would not allow, as it currently does, stricter approaches).
d. The Guide will be amended to restrict the definition of net income to net income before taxes and extraordinary items.
e. The FSI on large exposures will be redefined as the ratio of the value of large exposures to capital, replacing the current versions of the indicator offered as options in the Guide.
f. The FSIs “net open position in foreign exchange to capital,” “large exposures to capital,” and “net open position in equities to capital” will be redefined to be compiled using total regulatory capital or Tier 1 capital.

30
g. The FSI “number of applications for protection from creditors” will be modified to measure the cases where bankruptcy proceedings are actually initiated.
G. Conclusion
42. As discussed above in this paper, there is a need to amend the Guide. It is intended that some aspects of the Guide be amended, as noted above, to deal with the methodological issues that arose in the conduct of the CCE. The current Guide together with an annotation on the amendments would provide the technical underpinning for future Fund work on FSIs as proposed in the Financial Soundness Indicators: Experience with the Coordinated Compilation Exercise and Next Steps.

Number of Countries Number of Indicators 1/
Core FSIs for Deposit TakersI1 Regulatory capital to risk-weighted assets 57 66I2 Regulatory Tier 1 capital to risk-weighted assets 57 66I3 Non-performing loans net of provisions to capital 56 64I4 Non-performing loans to total gross loans 56 65I5 Sectoral distribution of loans to total loans 55 59I6 Return on assets 57 68I7 Return on equity 57 68I8 Interest margin to gross income 57 68I9 Non-interest expenses to gross income 57 68
I10 Liquid assets to total assets 56 65I11 Liquid assets to short-term liabilities 56 65I12 Net open position in foreign exchange to capital 52 57
I13 Capital to assets 48 56I14 Large exposures to capital 36 42I15 Geographical distribution of loans to total loans 36 42I16 Gross asset position in financial derivatives to capital 34 40I17 Gross liability position in financial derivatives to capital 34 40I18 Trading income to total income 44 51I19 Personnel expenses to non-interest expenses 47 55I20 Spread between reference lending and deposit rates 36 39I21 Spread between highest and lowest interbank rates 23 23I22 Customer deposits to total (non-interbank) loans 46 53I23 Foreign-currency-denominated loans to total loans 46 51I24 Foreign-currency-denominated liabilities to total liabilities 45 50I25 Net open position in equities to capital 28 31
Encouraged FSIs for Other Financial CorporationsI26 Assets to total financial system assets 31 32I27 Assets to Gross Domestic Product (GDP) 31 32
Encouraged FSIs for Nonfinancial CorporationsI28 Total debt to equity 20 20I29 Return on equity 17 17I30 Earnings to interest and principal expenses 7 7I31 Net foreign exchange exposure to equity 1 1I32 Number of applications for protection from creditors 13 13
Encouraged FSIs for HouseholdsI33 Household debt to GDP 26 26I34 Household debt service and principal payments to income 14 14
Encouraged FSIs for Market LiquidityI35 Average bid-ask spread in the securities market 2/ 17 17I36 Average daily turnover ratio in the securities market 2/ 22 22
Encouraged FSIs for Real Estate MarketsI37(i) Residential real estate prices (annual percentage increase) 30 30I37(ii) Commercial real estate prices (annual percentage increase) 12 12
I38 Residential real estate loans to total loans 37 38I39 Commercial real estate loans to total loans 23 23
Source: CCE.
1/ A given FSI may be compiled more than once by a given country using different consolidation bases.2/ Or in other markets that are most relevant to bank liquidity, such as foreign exchange markets.
DescriptionsIndicator Number
Encouraged FSIs for Deposit Takers
Indicators Compiled
Table 1. FSIs Compiled by Countries in the CCE
31

Tabl
e 2.
a. C
ore
FSIs
for C
ount
ries
Usi
ng th
e D
CC
B C
onso
lidat
ion
Bas
is(In
per
cent
)
CO
UN
TRIE
S
IND
ICA
TOR
S 1/
Cyp
rus
Indo
nesi
aK
orea
Leba
non
Mal
aysi
aM
alta
Nor
way
Ukr
aine
Ave
rage
Cap
ital A
dequ
acy:
Reg
ulat
ory
Cap
ital t
o R
isk
Wei
ghte
d A
sset
s (I
1)12
.36
19.5
113
.73
17.3
110
.19
14.9
514
.68
Reg
ulat
ory
Tier
1 C
apita
l to
Ris
k W
eigh
ted
Ass
ets
(I2)
9.98
15.3
910
.83
14.1
29.
5311
.54
11.9
0N
on-p
erfo
rmin
g Lo
ans
Net
of P
rovi
sion
s to
Cap
ital
(I3)
34.8
228
.68
4.23
25.6
649
.37
1.25
24.0
0 U
se o
f Tot
al C
apita
l & R
eser
ves
28.6
84.
2325
.66
19.5
2 U
se o
f Tot
al R
egul
ator
y C
apita
l34
.82
49.3
71.
2528
.48
Use
of T
ier 1
Cap
ital
Ass
et Q
ualit
y:N
on-p
erfo
rmin
g Lo
ans
to T
otal
Gro
ss L
oans
(I4
)7.
088.
060.
989.
0812
.01
5.11
7.05
Ear
ning
s an
d P
rofit
abili
ty:
Ret
urn
on A
sset
s (I
6)0.
762.
251.
320.
851.
351.
311.
31 U
se o
f Net
Inco
me
Bef
ore
Taxe
s0.
762.
250.
851.
351.
311.
30 U
se o
f Net
Inco
me
Afte
r Tax
es1.
321.
32R
etur
n on
Equ
ity (
I7)
14.1
424
.02
19.5
311
.83
16.9
210
.37
16.1
4 U
se o
f Net
Inco
me
Bef
ore
Taxe
s14
.14
24.0
211
.83
16.9
210
.37
15.4
6 U
se o
f Tot
al C
apita
l & R
eser
ves
24.0
211
.83
17.9
2 U
se o
f Tot
al R
egul
ator
y C
apita
l16
.92
10.3
713
.65
Use
of T
ier 1
Cap
ital
14.1
414
.14
Use
of N
et In
com
e A
fter T
axes
19.5
319
.53
Use
of T
otal
Cap
ital &
Res
erve
s19
.53
19.5
3 U
se o
f Tot
al R
egul
ator
y C
apita
l U
se o
f Tie
r 1 C
apita
l U
se o
f Nar
row
Cap
ital a
nd R
eser
ves
Inte
rest
Mar
gin
to G
ross
Inco
me
(I8)
66.2
165
.51
77.7
166
.10
68.1
048
.36
65.3
3N
on-in
tere
st E
xpen
ses
to G
ross
Inco
me
(I9)
59.0
652
.97
39.0
859
.71
45.9
165
.99
53.7
9Li
quid
ity:
Liqu
id A
sset
s to
Tot
al A
sset
s (I
10)
29.4
824
.01
30.8
625
.75
26.7
718
.03
25.8
1 U
se o
f Cor
e M
easu
re o
f Liq
uid
Ass
ets
29.4
824
.01
25.7
526
.41
Use
of B
road
Mea
sure
of L
iqui
d A
sset
s30
.86
26.7
718
.03
25.2
2Li
quid
Ass
ets
to S
hort-
Term
Lia
bilit
ies
(I11
)34
.89
28.6
056
.50
30.8
454
.14
40.1
740
.86
Use
of C
ore
Mea
sure
of L
iqui
d A
sset
s34
.89
28.6
030
.84
31.4
4 U
se o
f Bro
ad M
easu
re o
f Liq
uid
Ass
ets
56.5
054
.14
40.1
750
.27
Sen
sitiv
ity to
Mar
ket R
isks
:N
et O
pen
Pos
ition
in F
orex
to C
apita
l (I1
2)1.
962.
330.
1019
.16
4.35
8.52
6.07
Use
of T
otal
Cap
ital &
Res
erve
s0.
1019
.16
9.63
Use
of T
otal
Reg
ulat
ory
Cap
ital
4.35
8.52
6.44
Use
of T
ier 1
Cap
ital
1.96
2.33
2.14
Sou
rce:
CC
E.
1/ In
par
enth
esis
is th
e in
dica
tor n
umbe
r.
DC
Dom
estic
con
solid
atio
n ba
sis.
DC
CB
Dom
estic
ally
con
trolle
d, c
ross
bor
der c
onso
lidat
ion
basi
s.D
CC
BS
D
omes
tical
ly c
ontro
lled,
cro
ss b
orde
r, cr
oss
sect
or c
onso
lidat
ion
basi
s.
DC
CB
OTH
ER
O
ther
con
solid
atio
n ba
ses.
OTH
ER
refe
rs to
con
solid
atio
n ba
ses
othe
r tha
n C
BC
SD
I, D
C, D
CC
B, o
r DC
CB
S.
OTH
ER
als
o in
clud
es th
e co
nsol
idat
ion
basi
s of
a F
SI c
ompi
led
with
the
unde
rlyin
g da
ta c
alcu
late
d us
ing
mor
e th
an o
ne c
onso
lidat
ion
basi
s.
CB
CS
DI
Cro
ss b
orde
r and
cro
ss s
ecto
r con
solid
atio
n ba
sis
for a
ll do
mes
tical
ly in
corp
orat
ed e
ntiti
es.
32

CO
UN
TRIE
S
IND
ICA
TOR
S 1/
Arm
enia
Bul
garia
Chi
leC
osta
Ric
aC
roat
iaC
ypru
sD
enm
ark
El S
alva
dor
Cap
ital A
dequ
acy:
Reg
ulat
ory
Cap
ital t
o R
isk
Wei
ghte
d A
sset
s (I
1)34
.92
15.3
315
.39
14.6
514
.07
Reg
ulat
ory
Tier
1 C
apita
l to
Ris
k W
eigh
ted
Ass
ets
(I2)
32.6
812
.53
11.4
313
.05
10.7
4N
on-p
erfo
rmin
g Lo
ans
Net
of P
rovi
sion
s to
Cap
ital
(I3)
3.67
2.92
3.05
17.6
028
.68
11.2
7 U
se o
f Tot
al C
apita
l & R
eser
ves
3.67
3.05
11.2
7 U
se o
f Tot
al R
egul
ator
y C
apita
l2.
9228
.68
Use
of T
ier 1
Cap
ital
17.6
0A
sset
Qua
lity:
Non
-per
form
ing
Loan
s to
Tot
al G
ross
Loa
ns (
I4)
1.93
2.23
1.42
6.16
7.51
1.95
Ear
ning
s an
d P
rofit
abili
ty:
Ret
urn
on A
sset
s (I
6)3.
182.
011.
991.
640.
761.
33 U
se o
f Net
Inco
me
Bef
ore
Taxe
s3.
181.
991.
640.
761.
33 U
se o
f Net
Inco
me
Afte
r Tax
es2.
01R
etur
n on
Equ
ity (
I7)
16.0
521
.39
19.0
320
.21
11.4
511
.86
Use
of N
et In
com
e B
efor
e Ta
xes
16.0
519
.03
20.2
111
.45
11.8
6 U
se o
f Tot
al C
apita
l & R
eser
ves
16.0
519
.03
11.8
6 U
se o
f Tot
al R
egul
ator
y C
apita
l U
se o
f Tie
r 1 C
apita
l20
.21
11.4
5 U
se o
f Net
Inco
me
Afte
r Tax
es21
.39
Use
of T
otal
Cap
ital &
Res
erve
s21
.39
Use
of T
otal
Reg
ulat
ory
Cap
ital
Use
of T
ier 1
Cap
ital
Use
of N
arro
w C
apita
l and
Res
erve
sIn
tere
st M
argi
n to
Gro
ss In
com
e (I
8)51
.25
68.3
650
.54
58.8
862
.61
34.3
6N
on-in
tere
st E
xpen
ses
to G
ross
Inco
me
(I9)
61.4
055
.27
49.4
663
.08
56.3
742
.18
Liqu
idity
:Li
quid
Ass
ets
to T
otal
Ass
ets
(I10
)45
.95
28.6
518
.98
20.4
111
.36
34.1
921
.32
29.8
2 U
se o
f Cor
e M
easu
re o
f Liq
uid
Ass
ets
18.9
820
.41
11.3
634
.19
29.8
2 U
se o
f Bro
ad M
easu
re o
f Liq
uid
Ass
ets
45.9
528
.65
21.3
2Li
quid
Ass
ets
to S
hort-
Term
Lia
bilit
ies
(I11
)10
1.80
45.9
637
.33
27.5
016
.82
51.1
263
.99
41.3
5 U
se o
f Cor
e M
easu
re o
f Liq
uid
Ass
ets
37.3
327
.50
16.8
251
.12
41.3
5 U
se o
f Bro
ad M
easu
re o
f Liq
uid
Ass
ets
101.
8045
.96
63.9
9S
ensi
tivity
to M
arke
t Ris
ks:
Net
Ope
n P
ositi
on in
For
ex to
Cap
ital
(I12)
0.70
2.33
-29.
3552
.33
7.96
67.2
1-1
.52
Use
of T
otal
Cap
ital &
Res
erve
s0.
70-2
9.35
52.3
367
.21
-1.5
2 U
se o
f Tot
al R
egul
ator
y C
apita
l2.
33 U
se o
f Tie
r 1 C
apita
l7.
96
Sou
rce:
CC
E.
1/ In
par
enth
esis
is th
e in
dica
tor n
umbe
r.
DC
Dom
estic
con
solid
atio
n ba
sis.
DC
CB
Dom
estic
ally
con
trolle
d, c
ross
bor
der c
onso
lidat
ion
basi
s.D
CC
BS
D
omes
tical
ly c
ontro
lled,
cro
ss b
orde
r, cr
oss
sect
or c
onso
lidat
ion
basi
s.O
THE
R
Oth
er c
onso
lidat
ion
base
s.O
THE
R re
fers
to c
onso
lidat
ion
base
s ot
her t
han
CB
CS
DI,
DC
, DC
CB
, or D
CC
BS
. O
THE
R a
lso
incl
udes
the
cons
olid
atio
n ba
sis
of a
FS
I com
pile
d w
ith th
e un
derly
ing
data
cal
cula
ted
usin
g m
ore
than
on
e co
nsol
idat
ion
basi
s.
CB
CS
DI
Cro
ss b
orde
r and
cro
ss s
ecto
r con
solid
atio
n ba
sis
for a
ll do
mes
tical
ly in
corp
orat
ed e
ntiti
es.
DC
Tabl
e 2.
b. C
ore
FSIs
for C
ount
ries
Usi
ng th
e D
C C
onso
lidat
ion
Bas
is(In
per
cent
)
33

CO
UN
TRIE
S
IND
ICA
TOR
S 1/
Esto
nia
Gha
naG
reec
eH
ong
Kon
g SA
RH
unga
ryJo
rdan
Kor
eaLa
tvia
Cap
ital A
dequ
acy:
Reg
ulat
ory
Cap
ital t
o R
isk
Wei
ghte
d A
sset
s (I
1)12
.92
16.2
311
.92
17.6
012
.69
Reg
ulat
ory
Tier
1 C
apita
l to
Ris
k W
eigh
ted
Ass
ets
(I2)
12.9
115
.39
11.8
117
.18
9.24
Non
-per
form
ing
Loan
s N
et o
f Pro
visi
ons
to C
apita
l (I3
)1.
1016
.70
5.00
5.60
5.08
4.23
1.98
Use
of T
otal
Cap
ital &
Res
erve
s1.
1016
.70
5.00
5.08
4.23
1.98
Use
of T
otal
Reg
ulat
ory
Cap
ital
5.60
Use
of T
ier 1
Cap
ital
Ass
et Q
ualit
y:N
on-p
erfo
rmin
g Lo
ans
to T
otal
Gro
ss L
oans
(I4
)0.
1712
.95
1.35
2.24
6.56
0.99
0.54
Ear
ning
s an
d P
rofit
abili
ty:
Ret
urn
on A
sset
s (I
6)1.
974.
491.
142.
121.
951.
24 U
se o
f Net
Inco
me
Bef
ore
Taxe
s1.
974.
491.
142.
12 U
se o
f Net
Inco
me
Afte
r Tax
es1.
951.
24R
etur
n on
Equ
ity (
I7)
19.4
134
.45
19.0
726
.96
20.8
618
.66
Use
of N
et In
com
e B
efor
e Ta
xes
19.4
134
.45
19.0
726
.96
Use
of T
otal
Cap
ital &
Res
erve
s19
.41
34.4
519
.07
Use
of T
otal
Reg
ulat
ory
Cap
ital
Use
of T
ier 1
Cap
ital
26.9
6 U
se o
f Net
Inco
me
Afte
r Tax
es20
.86
18.6
6 U
se o
f Tot
al C
apita
l & R
eser
ves
20.8
618
.66
Use
of T
otal
Reg
ulat
ory
Cap
ital
Use
of T
ier 1
Cap
ital
Use
of N
arro
w C
apita
l and
Res
erve
sIn
tere
st M
argi
n to
Gro
ss In
com
e (I
8)91
.16
72.6
749
.59
61.5
556
.38
78.6
9N
on-in
tere
st E
xpen
ses
to G
ross
Inco
me
(I9)
50.9
461
.66
49.6
258
.74
37.5
741
.41
Liqu
idity
:Li
quid
Ass
ets
to T
otal
Ass
ets
(I10
)24
.93
20.6
933
.96
28.9
619
.73
49.1
631
.53
30.3
0 U
se o
f Cor
e M
easu
re o
f Liq
uid
Ass
ets
24.9
320
.69
Use
of B
road
Mea
sure
of L
iqui
d A
sset
s33
.96
28.9
619
.73
49.1
631
.53
30.3
0Li
quid
Ass
ets
to S
hort-
Term
Lia
bilit
ies
(I11
)39
.46
28.1
747
.00
57.2
533
.74
64.4
855
.92
38.5
0 U
se o
f Cor
e M
easu
re o
f Liq
uid
Ass
ets
39.4
628
.17
Use
of B
road
Mea
sure
of L
iqui
d A
sset
s47
.00
57.2
533
.74
64.4
855
.92
38.5
0S
ensi
tivity
to M
arke
t Ris
ks:
Net
Ope
n P
ositi
on in
For
ex to
Cap
ital
(I12)
61.7
5-2
2.80
0.48
0.12
Use
of T
otal
Cap
ital &
Res
erve
s61
.75
0.48
0.12
Use
of T
otal
Reg
ulat
ory
Cap
ital
-22.
80 U
se o
f Tie
r 1 C
apita
l
DC
Tabl
e 2.
b. C
ore
FSIs
for C
ount
ries
Usi
ng th
e D
C C
onso
lidat
ion
Bas
is (C
ont.)
(In p
erce
nt)
34

CO
UN
TRIE
S
IND
ICA
TOR
S 1/
Lith
uani
aLu
xem
bour
gM
alay
sia
Mal
taM
exic
oN
orw
ayPo
land
Rom
ania
Cap
ital A
dequ
acy:
Reg
ulat
ory
Cap
ital t
o R
isk
Wei
ghte
d A
sset
s (I
1)20
.36
14.5
521
.07
Reg
ulat
ory
Tier
1 C
apita
l to
Ris
k W
eigh
ted
Ass
ets
(I2)
17.6
014
.42
16.3
6N
on-p
erfo
rmin
g Lo
ans
Net
of P
rovi
sion
s to
Cap
ital
(I3)
5.68
50.6
820
.24
-11.
856.
8611
.82
6.67
Use
of T
otal
Cap
ital &
Res
erve
s5.
6850
.68
-11.
856.
8611
.82
6.67
Use
of T
otal
Reg
ulat
ory
Cap
ital
20.2
4 U
se o
f Tie
r 1 C
apita
lA
sset
Qua
lity:
Non
-per
form
ing
Loan
s to
Tot
al G
ross
Loa
ns (
I4)
0.60
9.40
3.92
2.08
0.72
4.80
2.61
Ear
ning
s an
d P
rofit
abili
ty:
Ret
urn
on A
sset
s (I
6)1.
051.
422.
681.
211.
641.
88 U
se o
f Net
Inco
me
Bef
ore
Taxe
s1.
051.
422.
681.
21 U
se o
f Net
Inco
me
Afte
r Tax
es1.
641.
88R
etur
n on
Equ
ity (
I7)
14.1
220
.82
24.4
320
.14
20.6
614
.87
Use
of N
et In
com
e B
efor
e Ta
xes
14.1
220
.82
24.4
320
.14
Use
of T
otal
Cap
ital &
Res
erve
s14
.12
24.4
320
.14
Use
of T
otal
Reg
ulat
ory
Cap
ital
20.8
2 U
se o
f Tie
r 1 C
apita
l U
se o
f Net
Inco
me
Afte
r Tax
es20
.66
14.8
7 U
se o
f Tot
al C
apita
l & R
eser
ves
14.8
7 U
se o
f Tot
al R
egul
ator
y C
apita
l20
.66
Use
of T
ier 1
Cap
ital
Use
of N
arro
w C
apita
l and
Res
erve
sIn
tere
st M
argi
n to
Gro
ss In
com
e (I
8)51
.40
44.7
461
.56
53.9
657
.72
8.08
Non
-inte
rest
Exp
ense
s to
Gro
ss In
com
e (I
9)45
.28
38.4
258
.66
55.5
272
.34
87.9
1Li
quid
ity:
Liqu
id A
sset
s to
Tot
al A
sset
s (I
10)
53.3
317
.90
13.9
228
.81
5.98
19.8
454
.60
Use
of C
ore
Mea
sure
of L
iqui
d A
sset
s5.
9854
.60
Use
of B
road
Mea
sure
of L
iqui
d A
sset
s53
.33
17.9
013
.92
28.8
119
.84
Liqu
id A
sset
s to
Sho
rt-Te
rm L
iabi
litie
s (I
11)
64.3
219
.34
58.3
011
1.03
8.67
27.5
338
7.67
Use
of C
ore
Mea
sure
of L
iqui
d A
sset
s8.
6738
7.67
Use
of B
road
Mea
sure
of L
iqui
d A
sset
s64
.32
19.3
458
.30
111.
0327
.53
Sen
sitiv
ity to
Mar
ket R
isks
:N
et O
pen
Pos
ition
in F
orex
to C
apita
l (I1
2)1.
37-1
.60
-0.0
768
0.53
2.49
-0.5
5 U
se o
f Tot
al C
apita
l & R
eser
ves
1.37
-0.0
768
0.53
-0.5
5 U
se o
f Tot
al R
egul
ator
y C
apita
l-1
.60
2.49
Use
of T
ier 1
Cap
ital
DC
Tabl
e 2.
b. C
ore
FSIs
for C
ount
ries
Usi
ng th
e D
C C
onso
lidat
ion
Bas
is (C
ont.)
(In p
erce
nt)
35

CO
UN
TRIE
S
IND
ICA
TOR
S 1/
Sing
apor
eSl
ovak
iaSl
oven
iaSo
uth
Afr
ica
Spai
nU
nite
d K
ingd
omU
rugu
ayA
vera
ge
Cap
ital A
dequ
acy:
Reg
ulat
ory
Cap
ital t
o R
isk
Wei
ghte
d A
sset
s (I
1)12
.32
10.5
312
.72
16.1
916
.09
Reg
ulat
ory
Tier
1 C
apita
l to
Ris
k W
eigh
ted
Ass
ets
(I2)
13.0
78.
858.
4514
.56
14.1
3N
on-p
erfo
rmin
g Lo
ans
Net
of P
rovi
sion
s to
Cap
ital
(I3)
6.03
6.39
5.36
6.42
53.0
210
.97
Use
of T
otal
Cap
ital &
Res
erve
s6.
036.
3953
.02
10.4
1 U
se o
f Tot
al R
egul
ator
y C
apita
l5.
366.
4211
.54
Use
of T
ier 1
Cap
ital
17.6
0A
sset
Qua
lity:
Non
-per
form
ing
Loan
s to
Tot
al G
ross
Loa
ns (
I4)
0.92
5.03
2.96
1.49
0.65
11.5
23.
57E
arni
ngs
and
Pro
fitab
ility
:R
etur
n on
Ass
ets
(I6)
0.74
1.07
0.99
1.55
0.71
1.60
1.68
Use
of N
et In
com
e B
efor
e Ta
xes
0.74
1.07
0.99
1.60
1.73
Use
of N
et In
com
e A
fter T
axes
1.55
0.71
1.57
Ret
urn
on E
quity
(I7
)8.
2213
.66
13.4
920
.09
11.8
519
.83
18.4
0 U
se o
f Net
Inco
me
Bef
ore
Taxe
s8.
2213
.66
13.4
919
.83
18.4
2 U
se o
f Tot
al C
apita
l & R
eser
ves
8.22
13.6
613
.49
19.8
317
.98
Use
of T
otal
Reg
ulat
ory
Cap
ital
20.8
2 U
se o
f Tie
r 1 C
apita
l19
.54
Use
of N
et In
com
e A
fter T
axes
20.0
911
.85
18.3
4 U
se o
f Tot
al C
apita
l & R
eser
ves
18.9
5 U
se o
f Tot
al R
egul
ator
y C
apita
l20
.09
20.3
7 U
se o
f Tie
r 1 C
apita
l U
se o
f Nar
row
Cap
ital a
nd R
eser
ves
11.8
511
.85
Inte
rest
Mar
gin
to G
ross
Inco
me
(I8)
30.3
565
.42
52.8
838
.18
56.6
510
.29
52.8
0N
on-in
tere
st E
xpen
ses
to G
ross
Inco
me
(I9)
66.1
169
.11
62.4
361
.62
52.1
587
.42
57.6
9Li
quid
ity:
Liqu
id A
sset
s to
Tot
al A
sset
s (I
10)
0.70
33.5
04.
844.
8434
.86
35.1
048
.13
26.8
8 U
se o
f Cor
e M
easu
re o
f Liq
uid
Ass
ets
0.70
22.1
7 U
se o
f Bro
ad M
easu
re o
f Liq
uid
Ass
ets
33.5
04.
844.
8434
.86
35.1
048
.13
29.2
3Li
quid
Ass
ets
to S
hort-
Term
Lia
bilit
ies
(I11
)83
.19
40.3
18.
797.
0183
.52
55.6
294
.77
60.0
2 U
se o
f Cor
e M
easu
re o
f Liq
uid
Ass
ets
70.9
0 U
se o
f Bro
ad M
easu
re o
f Liq
uid
Ass
ets
83.1
940
.31
8.79
7.01
83.5
255
.62
94.7
755
.35
Sen
sitiv
ity to
Mar
ket R
isks
:N
et O
pen
Pos
ition
in F
orex
to C
apita
l (I1
2)-4
9.07
21.7
91.
154.
6139
.99
38.1
8 U
se o
f Tot
al C
apita
l & R
eser
ves
-49.
074.
6139
.99
55.2
4 U
se o
f Tot
al R
egul
ator
y C
apita
l21
.79
1.15
0.56
Use
of T
ier 1
Cap
ital
7.96
DC
Tabl
e 2.
b. C
ore
FSIs
for C
ount
ries
Usi
ng th
e D
C C
onso
lidat
ion
Bas
is (C
oncl
.)(In
per
cent
)
36

CO
UN
TRIE
S
IND
ICA
TOR
S 1/
Aus
tral
iaA
ustr
iaB
razi
lC
anad
aC
olom
bia
Den
mar
kFi
nlan
dG
reec
e
Cap
ital A
dequ
acy:
Reg
ulat
ory
Cap
ital t
o R
isk
Wei
ghte
d A
sset
s (I
1)10
.25
11.8
218
.71
10.2
914
.65
11.4
721
.66
13.2
0R
egul
ator
y Ti
er 1
Cap
ital t
o R
isk
Wei
ghte
d A
sset
s (I
2)7.
498.
1715
.28
8.05
10.3
810
.14
18.8
211
.01
Non
-per
form
ing
Loan
s N
et o
f Pro
visi
ons
to C
apita
l (I3
)4.
65-1
0.71
3.71
10.3
60.
441.
64 U
se o
f Tot
al C
apita
l & R
eser
ves
-10.
713.
7110
.36
0.44
1.64
Use
of T
otal
Reg
ulat
ory
Cap
ital
4.65
Use
of T
ier 1
Cap
ital
Ass
et Q
ualit
y:N
on-p
erfo
rmin
g Lo
ans
to T
otal
Gro
ss L
oans
(I4
)0.
564.
530.
504.
160.
150.
25E
arni
ngs
and
Pro
fitab
ility
:R
etur
n on
Ass
ets
(I6)
1.76
0.61
2.66
0.96
2.95
0.87
0.87
0.95
Use
of N
et In
com
e B
efor
e Ta
xes
1.76
2.66
0.96
2.95
0.87
0.87
Use
of N
et In
com
e A
fter T
axes
0.61
0.95
Ret
urn
on E
quity
(I7
)25
.30
14.8
133
.33
25.4
333
.93
18.8
69.
3615
.29
Use
of N
et In
com
e B
efor
e Ta
xes
25.3
033
.33
25.4
333
.93
18.8
69.
36 U
se o
f Tot
al C
apita
l & R
eser
ves
25.3
033
.33
25.4
333
.93
18.8
69.
36 U
se o
f Tot
al R
egul
ator
y C
apita
l U
se o
f Tie
r 1 C
apita
l U
se o
f Net
Inco
me
Afte
r Tax
es14
.81
15.2
9 U
se o
f Tot
al C
apita
l & R
eser
ves
15.2
9 U
se o
f Tot
al R
egul
ator
y C
apita
l U
se o
f Tie
r 1 C
apita
l14
.81
Use
of N
arro
w C
apita
l and
Res
erve
sIn
tere
st M
argi
n to
Gro
ss In
com
e (I
8)41
.87
72.1
555
.21
45.3
339
.00
62.0
764
.59
66.9
5N
on-in
tere
st E
xpen
ses
to G
ross
Inco
me
(I9)
58.4
471
.93
45.1
072
.63
59.4
853
.53
56.3
257
.75
Liqu
idity
:Li
quid
Ass
ets
to T
otal
Ass
ets
(I10
)9.
8155
.52
5.70
12.4
75.
97 U
se o
f Cor
e M
easu
re o
f Liq
uid
Ass
ets
5.70
5.97
Use
of B
road
Mea
sure
of L
iqui
d A
sset
s9.
8155
.52
12.4
7Li
quid
Ass
ets
to S
hort-
Term
Lia
bilit
ies
(I11
)22
.50
96.0
515
.56
39.0
79.
53 U
se o
f Cor
e M
easu
re o
f Liq
uid
Ass
ets
15.5
69.
53 U
se o
f Bro
ad M
easu
re o
f Liq
uid
Ass
ets
22.5
096
.05
39.0
7S
ensi
tivity
to M
arke
t Ris
ks:
Net
Ope
n P
ositi
on in
For
ex to
Cap
ital
(I12)
0.00
-5.5
324
9.97
0.87
0.86
3.01
Use
of T
otal
Cap
ital &
Res
erve
s0.
00-5
.53
249.
970.
870.
86 U
se o
f Tot
al R
egul
ator
y C
apita
l3.
01 U
se o
f Tie
r 1 C
apita
l
Sou
rce:
CC
E.
1/ In
par
enth
esis
is th
e in
dica
tor n
umbe
r.
DC
Dom
estic
con
solid
atio
n ba
sis.
DC
CB
Dom
estic
ally
con
trolle
d, c
ross
bor
der c
onso
lidat
ion
basi
s.D
CC
BS
D
omes
tical
ly c
ontro
lled,
cro
ss b
orde
r, cr
oss
sect
or c
onso
lidat
ion
basi
s.
Tabl
e 2.
c. C
ore
FSIs
for C
ount
ries
Usi
ng th
e D
CC
BS
Con
solid
atio
n B
asis
(In p
erce
nt)
OTH
ER
O
ther
con
solid
atio
n ba
ses.
OTH
ER
refe
rs to
con
solid
atio
n ba
ses
othe
r tha
n C
BC
SD
I, D
C, D
CC
B, o
r DC
CB
S.
OTH
ER
als
o in
clud
es th
e co
nsol
idat
ion
basi
s of
a F
SI c
ompi
led
with
the
unde
rlyin
g da
ta c
alcu
late
d us
ing
mor
e th
an
one
cons
olid
atio
n ba
sis.
CB
CS
DI
Cro
ss b
orde
r and
cro
ss s
ecto
r con
solid
atio
n ba
sis
for a
ll do
mes
tical
ly in
corp
orat
ed e
ntiti
es.
DC
CB
S
37
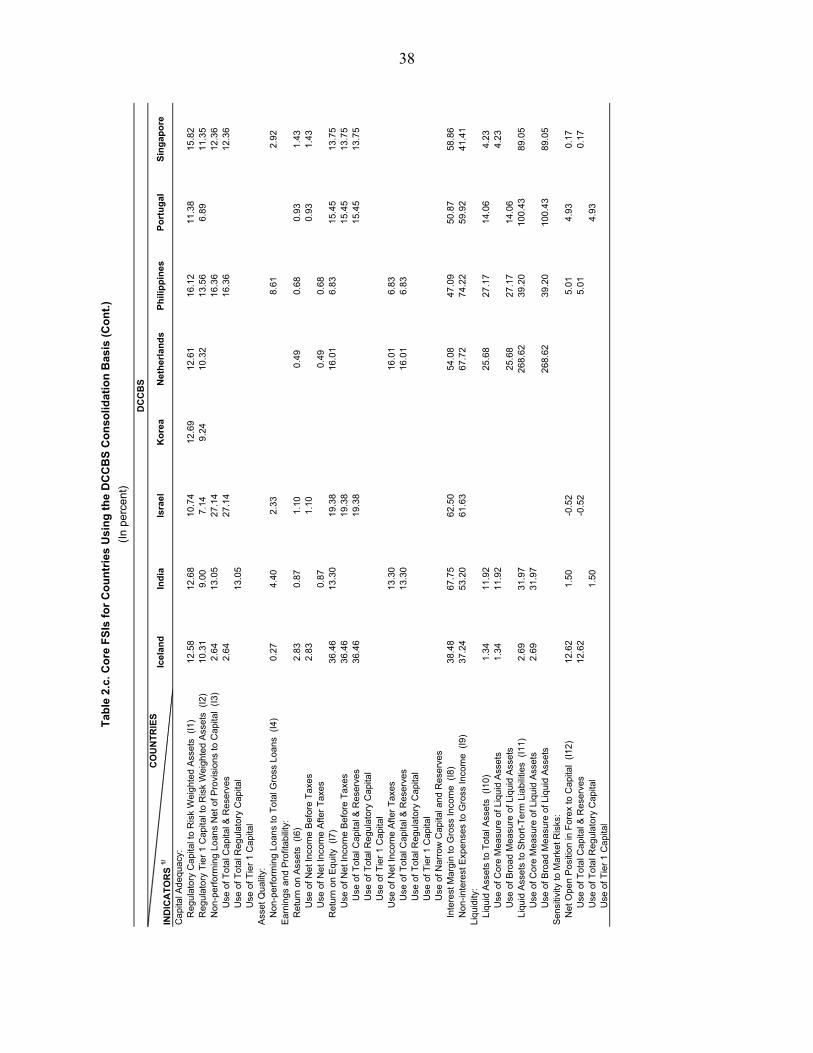
CO
UN
TRIE
S
IND
ICA
TOR
S 1/
Icel
and
Indi
aIs
rael
Kor
eaN
ethe
rland
sPh
ilipp
ines
Port
ugal
Sing
apor
e
Cap
ital A
dequ
acy:
Reg
ulat
ory
Cap
ital t
o R
isk
Wei
ghte
d A
sset
s (I
1)12
.58
12.6
810
.74
12.6
912
.61
16.1
211
.38
15.8
2R
egul
ator
y Ti
er 1
Cap
ital t
o R
isk
Wei
ghte
d A
sset
s (I
2)10
.31
9.00
7.14
9.24
10.3
213
.56
6.89
11.3
5N
on-p
erfo
rmin
g Lo
ans
Net
of P
rovi
sion
s to
Cap
ital
(I3)
2.64
13.0
527
.14
16.3
612
.36
Use
of T
otal
Cap
ital &
Res
erve
s2.
6427
.14
16.3
612
.36
Use
of T
otal
Reg
ulat
ory
Cap
ital
13.0
5 U
se o
f Tie
r 1 C
apita
lA
sset
Qua
lity:
Non
-per
form
ing
Loan
s to
Tot
al G
ross
Loa
ns (
I4)
0.27
4.40
2.33
8.61
2.92
Ear
ning
s an
d P
rofit
abili
ty:
Ret
urn
on A
sset
s (I
6)2.
830.
871.
100.
490.
680.
931.
43 U
se o
f Net
Inco
me
Bef
ore
Taxe
s2.
831.
100.
931.
43 U
se o
f Net
Inco
me
Afte
r Tax
es0.
870.
490.
68R
etur
n on
Equ
ity (
I7)
36.4
613
.30
19.3
816
.01
6.83
15.4
513
.75
Use
of N
et In
com
e B
efor
e Ta
xes
36.4
619
.38
15.4
513
.75
Use
of T
otal
Cap
ital &
Res
erve
s36
.46
19.3
815
.45
13.7
5 U
se o
f Tot
al R
egul
ator
y C
apita
l U
se o
f Tie
r 1 C
apita
l U
se o
f Net
Inco
me
Afte
r Tax
es13
.30
16.0
16.
83 U
se o
f Tot
al C
apita
l & R
eser
ves
13.3
016
.01
6.83
Use
of T
otal
Reg
ulat
ory
Cap
ital
Use
of T
ier 1
Cap
ital
Use
of N
arro
w C
apita
l and
Res
erve
sIn
tere
st M
argi
n to
Gro
ss In
com
e (I
8)38
.48
67.7
562
.50
54.0
847
.09
50.8
758
.86
Non
-inte
rest
Exp
ense
s to
Gro
ss In
com
e (I
9)37
.24
53.2
061
.63
67.7
274
.22
59.9
241
.41
Liqu
idity
:Li
quid
Ass
ets
to T
otal
Ass
ets
(I10
)1.
3411
.92
25.6
827
.17
14.0
64.
23 U
se o
f Cor
e M
easu
re o
f Liq
uid
Ass
ets
1.34
11.9
24.
23 U
se o
f Bro
ad M
easu
re o
f Liq
uid
Ass
ets
25.6
827
.17
14.0
6Li
quid
Ass
ets
to S
hort-
Term
Lia
bilit
ies
(I11
)2.
6931
.97
268.
6239
.20
100.
4389
.05
Use
of C
ore
Mea
sure
of L
iqui
d A
sset
s2.
6931
.97
Use
of B
road
Mea
sure
of L
iqui
d A
sset
s26
8.62
39.2
010
0.43
89.0
5S
ensi
tivity
to M
arke
t Ris
ks:
Net
Ope
n P
ositi
on in
For
ex to
Cap
ital
(I12)
12.6
21.
50-0
.52
5.01
4.93
0.17
Use
of T
otal
Cap
ital &
Res
erve
s12
.62
-0.5
25.
010.
17 U
se o
f Tot
al R
egul
ator
y C
apita
l1.
504.
93 U
se o
f Tie
r 1 C
apita
l
Tabl
e 2.
c. C
ore
FSIs
for C
ount
ries
Usi
ng th
e D
CC
BS
Con
solid
atio
n B
asis
(Con
t.)(In
per
cent
)D
CC
BS
38

CO
UN
TRIE
S
IND
ICA
TOR
S 1/
Slov
enia
Spai
nSw
eden
Uni
ted
Kin
gdom
Uni
ted
Stat
esA
vera
ge
Cap
ital A
dequ
acy:
Reg
ulat
ory
Cap
ital t
o R
isk
Wei
ghte
d A
sset
s (I
1)9.
6712
.43
10.0
812
.76
12.7
913
.07
Reg
ulat
ory
Tier
1 C
apita
l to
Ris
k W
eigh
ted
Ass
ets
(I2)
6.55
8.01
7.04
8.91
10.6
99.
92N
on-p
erfo
rmin
g Lo
ans
Net
of P
rovi
sion
s to
Cap
ital
(I3)
0.04
2.40
7.45
5.21
6.45
Use
of T
otal
Cap
ital &
Res
erve
s5.
216.
91 U
se o
f Tot
al R
egul
ator
y C
apita
l0.
042.
407.
455.
52 U
se o
f Tie
r 1 C
apita
lA
sset
Qua
lity:
Non
-per
form
ing
Loan
s to
Tot
al G
ross
Loa
ns (
I4)
0.79
0.17
0.99
0.70
2.09
Ear
ning
s an
d P
rofit
abili
ty:
Ret
urn
on A
sset
s (I
6)1.
120.
950.
981.
121.
611.
29 U
se o
f Net
Inco
me
Bef
ore
Taxe
s1.
120.
981.
121.
611.
51 U
se o
f Net
Inco
me
Afte
r Tax
es0.
950.
76R
etur
n on
Equ
ity (
I7)
16.9
916
.93
18.9
317
.32
17.6
819
.27
Use
of N
et In
com
e B
efor
e Ta
xes
16.9
918
.93
17.3
217
.68
21.5
8 U
se o
f Tot
al C
apita
l & R
eser
ves
16.9
917
.68
22.1
6 U
se o
f Tot
al R
egul
ator
y C
apita
l18
.93
17.3
218
.13
Use
of T
ier 1
Cap
ital
Use
of N
et In
com
e A
fter T
axes
16.9
313
.86
Use
of T
otal
Cap
ital &
Res
erve
s12
.86
Use
of T
otal
Reg
ulat
ory
Cap
ital
Use
of T
ier 1
Cap
ital
14.8
1 U
se o
f Nar
row
Cap
ital a
nd R
eser
ves
16.9
316
.93
Inte
rest
Mar
gin
to G
ross
Inco
me
(I8)
48.4
956
.16
54.6
249
.91
62.1
054
.90
Non
-inte
rest
Exp
ense
s to
Gro
ss In
com
e (I
9)61
.96
50.9
454
.34
56.7
662
.06
57.8
3Li
quid
ity:
Liqu
id A
sset
s to
Tot
al A
sset
s (I
10)
32.2
123
.51
8.61
17.0
1 U
se o
f Cor
e M
easu
re o
f Liq
uid
Ass
ets
23.5
18.
618.
76 U
se o
f Bro
ad M
easu
re o
f Liq
uid
Ass
ets
32.2
125
.27
Liqu
id A
sset
s to
Sho
rt-Te
rm L
iabi
litie
s (I
11)
97.8
951
.03
26.8
063
.60
Use
of C
ore
Mea
sure
of L
iqui
d A
sset
s51
.03
26.8
022
.93
Use
of B
road
Mea
sure
of L
iqui
d A
sset
s97
.89
94.1
0S
ensi
tivity
to M
arke
t Ris
ks:
Net
Ope
n P
ositi
on in
For
ex to
Cap
ital
(I12)
29.7
07.
442.
6620
.85
Use
of T
otal
Cap
ital &
Res
erve
s29
.27
Use
of T
otal
Reg
ulat
ory
Cap
ital
29.7
07.
442.
668.
21 U
se o
f Tie
r 1 C
apita
l
(In p
erce
nt)
Tabl
e 2.
c. C
ore
FSIs
for C
ount
ries
Usi
ng th
e D
CC
BS
Con
solid
atio
n B
asis
(Con
cl.)
DC
CB
S
39

CO
UN
TRIE
S
IND
ICA
TOR
S 1/
Bel
gium
Bra
zil
Chi
leC
ypru
sFr
ance
Hon
g K
ong
SAR
Hun
gary
Irela
nd
Cap
ital A
dequ
acy:
Reg
ulat
ory
Cap
ital t
o R
isk
Wei
ghte
d A
sset
s (I
1)11
.43
17.8
912
.95
13.3
911
.41
14.8
612
.28
12.4
4R
egul
ator
y Ti
er 1
Cap
ital t
o R
isk
Wei
ghte
d A
sset
s (I
2)8.
4115
.11
9.97
10.1
58.
2513
.30
11.0
99.
39N
on-p
erfo
rmin
g Lo
ans
Net
of P
rovi
sion
s to
Cap
ital
(I3)
15.0
5-8
.61
-7.2
08.
664.
15 U
se o
f Tot
al C
apita
l & R
eser
ves
-8.6
1-7
.20
8.66
Use
of T
otal
Reg
ulat
ory
Cap
ital
15.0
5 U
se o
f Tie
r 1 C
apita
l4.
15A
sset
Qua
lity:
Non
-per
form
ing
Loan
s to
Tot
al G
ross
Loa
ns (
I4)
2.27
4.33
0.90
3.54
0.68
Ear
ning
s an
d P
rofit
abili
ty:
Ret
urn
on A
sset
s (I
6)0.
522.
451.
240.
502.
270.
84 U
se o
f Net
Inco
me
Bef
ore
Taxe
s2.
452.
270.
84 U
se o
f Net
Inco
me
Afte
r Tax
es0.
521.
240.
50R
etur
n on
Equ
ity (
I7)
19.2
027
.66
17.3
014
.36
29.7
719
.95
Use
of N
et In
com
e B
efor
e Ta
xes
27.6
629
.77
19.9
5 U
se o
f Tot
al C
apita
l & R
eser
ves
27.6
6 U
se o
f Tot
al R
egul
ator
y C
apita
l U
se o
f Tie
r 1 C
apita
l29
.77
19.9
5 U
se o
f Net
Inco
me
Afte
r Tax
es19
.20
17.3
014
.36
Use
of T
otal
Cap
ital &
Res
erve
s19
.20
17.3
014
.36
Use
of T
otal
Reg
ulat
ory
Cap
ital
Use
of T
ier 1
Cap
ital
Use
of N
arro
w C
apita
l and
Res
erve
sIn
tere
st M
argi
n to
Gro
ss In
com
e (I
8)49
.28
55.3
268
.11
32.3
966
.29
62.3
7N
on-in
tere
st E
xpen
ses
to G
ross
Inco
me
(I9)
71.1
546
.15
61.3
364
.31
58.0
246
.62
Liqu
idity
:Li
quid
Ass
ets
to T
otal
Ass
ets
(I10
)30
.75
54.5
520
.93
19.9
434
.15
Use
of C
ore
Mea
sure
of L
iqui
d A
sset
s U
se o
f Bro
ad M
easu
re o
f Liq
uid
Ass
ets
30.7
554
.55
20.9
319
.94
34.1
5Li
quid
Ass
ets
to S
hort-
Term
Lia
bilit
ies
(I11
)58
.16
99.3
615
0.20
30.5
840
.12
Use
of C
ore
Mea
sure
of L
iqui
d A
sset
s U
se o
f Bro
ad M
easu
re o
f Liq
uid
Ass
ets
58.1
699
.36
150.
2030
.58
40.1
2S
ensi
tivity
to M
arke
t Ris
ks:
Net
Ope
n P
ositi
on in
For
ex to
Cap
ital
(I12)
3.67
-0.9
53.
91 U
se o
f Tot
al C
apita
l & R
eser
ves
-0.9
5 U
se o
f Tot
al R
egul
ator
y C
apita
l3.
67 U
se o
f Tie
r 1 C
apita
l3.
91
Sou
rce:
CC
E.
1/ In
par
enth
esis
is th
e in
dica
tor n
umbe
r.
DC
Dom
estic
con
solid
atio
n ba
sis.
DC
CB
Dom
estic
ally
con
trolle
d, c
ross
bor
der c
onso
lidat
ion
basi
s.D
CC
BS
D
omes
tical
ly c
ontro
lled,
cro
ss b
orde
r, cr
oss
sect
or c
onso
lidat
ion
basi
s.
CB
CSD
I
OTH
ER
O
ther
con
solid
atio
n ba
ses.
OTH
ER
refe
rs to
con
solid
atio
n ba
ses
othe
r tha
n C
BC
SD
I, D
C, D
CC
B, o
r DC
CB
S.
OTH
ER
als
o in
clud
es th
e co
nsol
idat
ion
basi
s of
a F
SI c
ompi
led
with
the
unde
rlyin
g da
ta c
alcu
late
d us
ing
mor
e th
an
one
cons
olid
atio
n ba
sis.
CB
CS
DI
Cro
ss b
orde
r and
cro
ss s
ecto
r con
solid
atio
n ba
sis
for a
ll do
mes
tical
ly in
corp
orat
ed e
ntiti
es.
Tabl
e 2.
d. C
ore
FSIs
for C
ount
ries
Usi
ng th
e C
BC
SDI C
onso
lidat
ion
Bas
is(In
per
cent
)
40
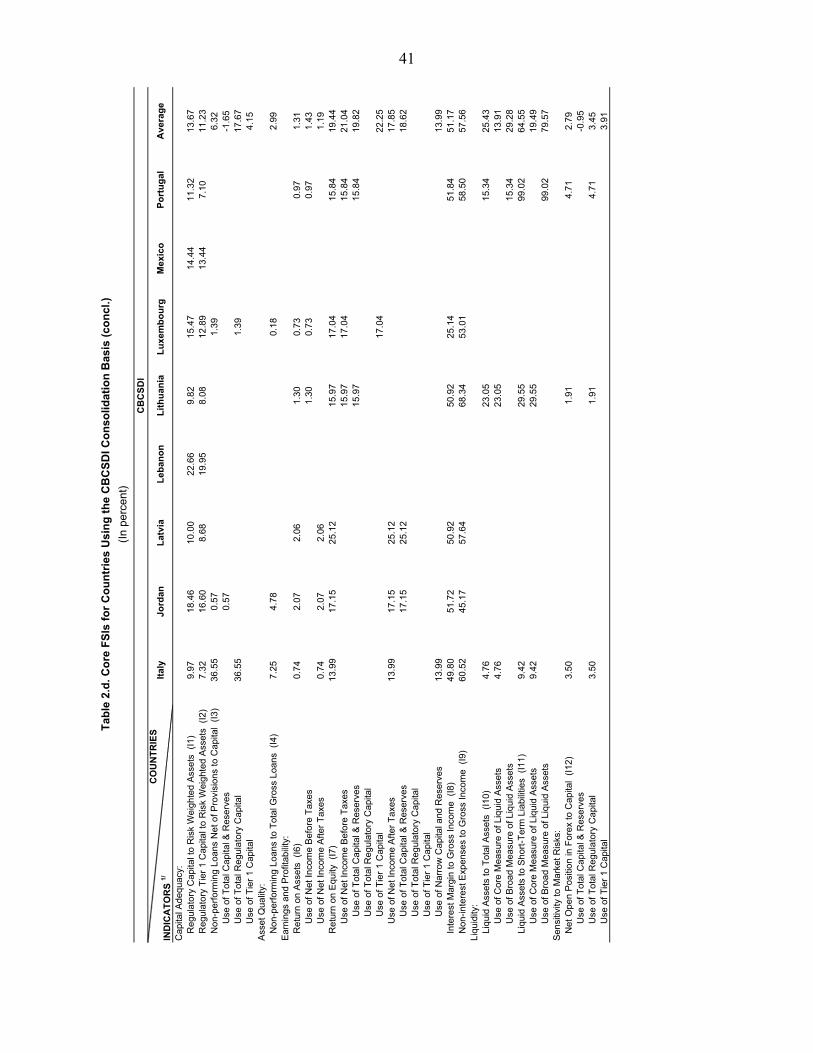
CO
UN
TRIE
S
IND
ICA
TOR
S 1/
Italy
Jord
anLa
tvia
Leba
non
Lith
uani
aLu
xem
bour
gM
exic
oPo
rtug
alA
vera
ge
Cap
ital A
dequ
acy:
Reg
ulat
ory
Cap
ital t
o R
isk
Wei
ghte
d A
sset
s (I
1)9.
9718
.46
10.0
022
.66
9.82
15.4
714
.44
11.3
213
.67
Reg
ulat
ory
Tier
1 C
apita
l to
Ris
k W
eigh
ted
Ass
ets
(I2)
7.32
16.6
08.
6819
.95
8.08
12.8
913
.44
7.10
11.2
3N
on-p
erfo
rmin
g Lo
ans
Net
of P
rovi
sion
s to
Cap
ital
(I3)
36.5
50.
571.
396.
32 U
se o
f Tot
al C
apita
l & R
eser
ves
0.57
-1.6
5 U
se o
f Tot
al R
egul
ator
y C
apita
l36
.55
1.39
17.6
7 U
se o
f Tie
r 1 C
apita
l4.
15A
sset
Qua
lity:
Non
-per
form
ing
Loan
s to
Tot
al G
ross
Loa
ns (
I4)
7.25
4.78
0.18
2.99
Ear
ning
s an
d P
rofit
abili
ty:
Ret
urn
on A
sset
s (I
6)0.
742.
072.
061.
300.
730.
971.
31 U
se o
f Net
Inco
me
Bef
ore
Taxe
s1.
300.
730.
971.
43 U
se o
f Net
Inco
me
Afte
r Tax
es0.
742.
072.
061.
19R
etur
n on
Equ
ity (
I7)
13.9
917
.15
25.1
215
.97
17.0
415
.84
19.4
4 U
se o
f Net
Inco
me
Bef
ore
Taxe
s15
.97
17.0
415
.84
21.0
4 U
se o
f Tot
al C
apita
l & R
eser
ves
15.9
715
.84
19.8
2 U
se o
f Tot
al R
egul
ator
y C
apita
l U
se o
f Tie
r 1 C
apita
l17
.04
22.2
5 U
se o
f Net
Inco
me
Afte
r Tax
es13
.99
17.1
525
.12
17.8
5 U
se o
f Tot
al C
apita
l & R
eser
ves
17.1
525
.12
18.6
2 U
se o
f Tot
al R
egul
ator
y C
apita
l U
se o
f Tie
r 1 C
apita
l U
se o
f Nar
row
Cap
ital a
nd R
eser
ves
13.9
913
.99
Inte
rest
Mar
gin
to G
ross
Inco
me
(I8)
49.8
051
.72
50.9
250
.92
25.1
451
.84
51.1
7N
on-in
tere
st E
xpen
ses
to G
ross
Inco
me
(I9)
60.5
245
.17
57.6
468
.34
53.0
158
.50
57.5
6Li
quid
ity:
Liqu
id A
sset
s to
Tot
al A
sset
s (I
10)
4.76
23.0
515
.34
25.4
3 U
se o
f Cor
e M
easu
re o
f Liq
uid
Ass
ets
4.76
23.0
513
.91
Use
of B
road
Mea
sure
of L
iqui
d A
sset
s15
.34
29.2
8Li
quid
Ass
ets
to S
hort-
Term
Lia
bilit
ies
(I11
)9.
4229
.55
99.0
264
.55
Use
of C
ore
Mea
sure
of L
iqui
d A
sset
s9.
4229
.55
19.4
9 U
se o
f Bro
ad M
easu
re o
f Liq
uid
Ass
ets
99.0
279
.57
Sen
sitiv
ity to
Mar
ket R
isks
:N
et O
pen
Pos
ition
in F
orex
to C
apita
l (I1
2)3.
501.
914.
712.
79 U
se o
f Tot
al C
apita
l & R
eser
ves
-0.9
5 U
se o
f Tot
al R
egul
ator
y C
apita
l3.
501.
914.
713.
45 U
se o
f Tie
r 1 C
apita
l3.
91
CB
CSD
I
Tabl
e 2.
d. C
ore
FSIs
for C
ount
ries
Usi
ng th
e C
BC
SDI C
onso
lidat
ion
Bas
is (c
oncl
.)(In
per
cent
)
41

CO
UN
TRIE
S
IND
ICA
TOR
S 1/
Aus
tral
iaA
ustr
iaC
zech
Rep
.G
erm
any
Gre
ece
Latv
iaLu
xem
bour
g
Cap
ital A
dequ
acy:
Reg
ulat
ory
Cap
ital t
o R
isk
Wei
ghte
d A
sset
s (I
1)11
.28
11.5
812
.15
Reg
ulat
ory
Tier
1 C
apita
l to
Ris
k W
eigh
ted
Ass
ets
(I2)
7.56
11.1
07.
96N
on-p
erfo
rmin
g Lo
ans
Net
of P
rovi
sion
s to
Cap
ital
(I3)
4.39
15.1
312
.49
34.9
716
.73
Use
of T
otal
Cap
ital &
Res
erve
s34
.97
Use
of T
otal
Reg
ulat
ory
Cap
ital
4.39
12.4
916
.73
Use
of T
ier 1
Cap
ital
15.1
3A
sset
Qua
lity:
Non
-per
form
ing
Loan
s to
Tot
al G
ross
Loa
ns (
I4)
0.61
2.59
2.83
4.05
6.96
Ear
ning
s an
d P
rofit
abili
ty:
Ret
urn
on A
sset
s (I
6)1.
411.
730.
48 U
se o
f Net
Inco
me
Bef
ore
Taxe
s1.
411.
730.
48 U
se o
f Net
Inco
me
Afte
r Tax
esR
etur
n on
Equ
ity (
I7)
21.6
432
.14
13.8
6 U
se o
f Net
Inco
me
Bef
ore
Taxe
s21
.64
32.1
413
.86
Use
of T
otal
Cap
ital &
Res
erve
s21
.64
13.8
6 U
se o
f Tot
al R
egul
ator
y C
apita
l U
se o
f Tie
r 1 C
apita
l32
.14
Use
of N
et In
com
e A
fter T
axes
Use
of T
otal
Cap
ital &
Res
erve
s U
se o
f Tot
al R
egul
ator
y C
apita
l U
se o
f Tie
r 1 C
apita
l U
se o
f Nar
row
Cap
ital a
nd R
eser
ves
Inte
rest
Mar
gin
to G
ross
Inco
me
(I8)
50.5
351
.83
68.3
1N
on-in
tere
st E
xpen
ses
to G
ross
Inco
me
(I9)
52.8
950
.11
60.9
9Li
quid
ity:
Liqu
id A
sset
s to
Tot
al A
sset
s (I
10)
13.1
427
.38
32.1
253
.26
Use
of C
ore
Mea
sure
of L
iqui
d A
sset
s U
se o
f Bro
ad M
easu
re o
f Liq
uid
Ass
ets
13.1
427
.38
32.1
253
.26
Liqu
id A
sset
s to
Sho
rt-Te
rm L
iabi
litie
s (I
11)
25.0
968
.02
87.7
212
1.97
Use
of C
ore
Mea
sure
of L
iqui
d A
sset
s U
se o
f Bro
ad M
easu
re o
f Liq
uid
Ass
ets
25.0
968
.02
87.7
212
1.97
Sen
sitiv
ity to
Mar
ket R
isks
:N
et O
pen
Pos
ition
in F
orex
to C
apita
l (I1
2)0.
853.
25-0
.08
6.87
3.27
-7.8
0 U
se o
f Tot
al C
apita
l & R
eser
ves
0.85
3.27
Use
of T
otal
Reg
ulat
ory
Cap
ital
3.25
6.87
-7.8
0 U
se o
f Tie
r 1 C
apita
l-0
.08
Sou
rce:
CC
E.
1/ In
par
enth
esis
is th
e in
dica
tor n
umbe
r.2/ D
ata
on o
ther
con
solid
atio
n ba
ses
are
likel
y no
t to
be c
ompa
rabl
e ac
ross
cou
ntrie
s if
cons
olid
atio
n ba
ses
clas
sifie
d as
oth
er a
re n
ot th
e sa
me.
DC
Dom
estic
con
solid
atio
n ba
sis.
DC
CB
Dom
estic
ally
con
trolle
d, c
ross
bor
der c
onso
lidat
ion
basi
s.D
CC
BS
D
omes
tical
ly c
ontro
lled,
cro
ss b
orde
r, cr
oss
sect
or c
onso
lidat
ion
basi
s.
Tabl
e 2.
e. C
ore
FSIs
for C
ount
ries
Usi
ng th
e O
ther
Con
solid
atio
n B
ases
2/
(In p
erce
nt)
OTH
ER
O
ther
con
solid
atio
n ba
ses.
OTH
ER
refe
rs to
con
solid
atio
n ba
ses
othe
r tha
n C
BC
SD
I, D
C, D
CC
B, o
r DC
CB
S.
OTH
ER
als
o in
clud
es th
e co
nsol
idat
ion
basi
s of
a F
SI c
ompi
led
with
the
unde
rlyin
g da
ta c
alcu
late
d us
ing
mor
e th
an
one
cons
olid
atio
n ba
sis.
CB
CS
DI
Cro
ss b
orde
r and
cro
ss s
ecto
r con
solid
atio
n ba
sis
for a
ll do
mes
tical
ly in
corp
orat
ed e
ntiti
es.
OTH
ER
42

CO
UN
TRIE
S
IND
ICA
TOR
S 1/
Port
ugal
Port
ugal
Rus
sia
Switz
erla
ndTu
rkey
Cap
ital A
dequ
acy:
Reg
ulat
ory
Cap
ital t
o R
isk
Wei
ghte
d A
sset
s (I
1)15
.98
12.4
222
.43
Reg
ulat
ory
Tier
1 C
apita
l to
Ris
k W
eigh
ted
Ass
ets
(I2)
11.4
413
.04
22.8
3N
on-p
erfo
rmin
g Lo
ans
Net
of P
rovi
sion
s to
Cap
ital
(I3)
5.03
4.10
4.97
-0.9
91.
71 U
se o
f Tot
al C
apita
l & R
eser
ves
-0.9
9 U
se o
f Tot
al R
egul
ator
y C
apita
l5.
034.
104.
971.
71 U
se o
f Tie
r 1 C
apita
lA
sset
Qua
lity:
Non
-per
form
ing
Loan
s to
Tot
al G
ross
Loa
ns (
I4)
1.63
1.58
2.62
0.52
3.92
Ear
ning
s an
d P
rofit
abili
ty:
Ret
urn
on A
sset
s (I
6)3.
350.
932.
28 U
se o
f Net
Inco
me
Bef
ore
Taxe
s3.
350.
932.
28 U
se o
f Net
Inco
me
Afte
r Tax
esR
etur
n on
Equ
ity (
I7)
24.1
317
.99
17.8
0 U
se o
f Net
Inco
me
Bef
ore
Taxe
s24
.13
17.9
917
.80
Use
of T
otal
Cap
ital &
Res
erve
s17
.80
Use
of T
otal
Reg
ulat
ory
Cap
ital
24.1
3 U
se o
f Tie
r 1 C
apita
l17
.99
Use
of N
et In
com
e A
fter T
axes
Use
of T
otal
Cap
ital &
Res
erve
s U
se o
f Tot
al R
egul
ator
y C
apita
l U
se o
f Tie
r 1 C
apita
l U
se o
f Nar
row
Cap
ital a
nd R
eser
ves
Inte
rest
Mar
gin
to G
ross
Inco
me
(I8)
46.5
630
.88
59.9
2N
on-in
tere
st E
xpen
ses
to G
ross
Inco
me
(I9)
59.9
959
.24
50.0
9Li
quid
ity:
Liqu
id A
sset
s to
Tot
al A
sset
s (I
10)
28.4
511
.39
46.9
9 U
se o
f Cor
e M
easu
re o
f Liq
uid
Ass
ets
Use
of B
road
Mea
sure
of L
iqui
d A
sset
s28
.45
11.3
946
.99
Liqu
id A
sset
s to
Sho
rt-Te
rm L
iabi
litie
s (I
11)
73.6
127
.42
75.2
2 U
se o
f Cor
e M
easu
re o
f Liq
uid
Ass
ets
Use
of B
road
Mea
sure
of L
iqui
d A
sset
s73
.61
27.4
275
.22
Sen
sitiv
ity to
Mar
ket R
isks
:N
et O
pen
Pos
ition
in F
orex
to C
apita
l (I1
2)-0
.17
30.5
9-0
.17
Use
of T
otal
Cap
ital &
Res
erve
s-0
.17
Use
of T
otal
Reg
ulat
ory
Cap
ital
-0.1
7 U
se o
f Tie
r 1 C
apita
l30
.59
Tabl
e 2.
e. C
ore
FSIs
for C
ount
ries
Usi
ng th
e O
ther
Con
solid
atio
n B
ases
(Con
cl.)
2/
(In p
erce
nt)
OTH
ER
43

Tabl
e 3.
a. C
ore
FSIs
for C
ount
ries
Usi
ng th
e D
CC
B C
onso
lidat
ion
Bas
is
with
Ful
l Ado
ptio
n of
the
Inte
rnat
iona
l Fin
anci
al R
epor
ting
Stan
dard
(IFR
S)(In
per
cent
)
CO
UN
TRIE
S
IND
ICA
TOR
S 1/
Cyp
rus
Mal
aysi
aM
alta
Ave
rage
Cap
ital A
dequ
acy:
Reg
ulat
ory
Cap
ital t
o R
isk
Wei
ghte
d A
sset
s (I
1)12
.36
13.7
317
.31
14.4
7R
egul
ator
y Ti
er 1
Cap
ital t
o R
isk
Wei
ghte
d A
sset
s (I
2)9.
9810
.83
14.1
211
.64
Non
-per
form
ing
Loan
s N
et o
f Pro
visi
ons
to C
apita
l (I3
)34
.82
49.3
742
.09
Use
of T
otal
Cap
ital &
Res
erve
s U
se o
f Tot
al R
egul
ator
y C
apita
l34
.82
49.3
742
.09
Use
of T
ier 1
Cap
ital
Ass
et Q
ualit
y:N
on-p
erfo
rmin
g Lo
ans
to T
otal
Gro
ss L
oans
(I4
)7.
0812
.01
9.55
Ear
ning
s an
d P
rofit
abili
ty:
Ret
urn
on A
sset
s (I
6)0.
761.
351.
06 U
se o
f Net
Inco
me
Bef
ore
Taxe
s0.
761.
351.
06 U
se o
f Net
Inco
me
Afte
r Tax
esR
etur
n on
Equ
ity (
I7)
14.1
416
.92
15.5
3 U
se o
f Net
Inco
me
Bef
ore
Taxe
s14
.14
16.9
215
.53
Use
of T
otal
Cap
ital &
Res
erve
s U
se o
f Tot
al R
egul
ator
y C
apita
l16
.92
16.9
2 U
se o
f Tie
r 1 C
apita
l14
.14
14.1
4 U
se o
f Net
Inco
me
Afte
r Tax
es U
se o
f Tot
al C
apita
l & R
eser
ves
Use
of T
otal
Reg
ulat
ory
Cap
ital
Use
of T
ier 1
Cap
ital
Use
of N
arro
w C
apita
l and
Res
erve
sIn
tere
st M
argi
n to
Gro
ss In
com
e (I
8)66
.21
68.1
067
.15
Non
-inte
rest
Exp
ense
s to
Gro
ss In
com
e (I
9)59
.06
45.9
152
.49
Liqu
idity
:Li
quid
Ass
ets
to T
otal
Ass
ets
(I10
)29
.48
26.7
728
.13
Use
of C
ore
Mea
sure
of L
iqui
d A
sset
s29
.48
29.4
8 U
se o
f Bro
ad M
easu
re o
f Liq
uid
Ass
ets
26.7
726
.77
Liqu
id A
sset
s to
Sho
rt-Te
rm L
iabi
litie
s (I
11)
34.8
954
.14
44.5
1 U
se o
f Cor
e M
easu
re o
f Liq
uid
Ass
ets
34.8
934
.89
Use
of B
road
Mea
sure
of L
iqui
d A
sset
s54
.14
54.1
4S
ensi
tivity
to M
arke
t Ris
ks:
Net
Ope
n P
ositi
on in
For
ex to
Cap
ital
(I12)
1.96
4.35
3.15
Use
of T
otal
Cap
ital &
Res
erve
s U
se o
f Tot
al R
egul
ator
y C
apita
l4.
354.
35 U
se o
f Tie
r 1 C
apita
l1.
961.
96
Sou
rce:
CC
E.
1/ In
par
enth
esis
is th
e in
dica
tor n
umbe
r.
DC
Dom
estic
con
solid
atio
n ba
sis.
DC
CB
D
omes
tical
ly c
ontro
lled,
cro
ss b
orde
r con
solid
atio
n ba
sis.
DC
CB
S
D
omes
tical
ly c
ontro
lled,
cro
ss b
orde
r, cr
oss
sect
or c
onso
lidat
ion
basi
s.
DC
CB
CB
CS
DI
C
ross
bor
der a
nd c
ross
sec
tor c
onso
lidat
ion
basi
s fo
r all
dom
estic
ally
inco
rpor
ated
ent
ities
.
OTH
ER
Oth
er c
onso
lidat
ion
base
s.O
THE
R re
fers
to c
onso
lidat
ion
base
s ot
her t
han
CB
CS
DI,
DC
, DC
CB
, or D
CC
BS
. O
THE
R a
lso
incl
udes
the
cons
olid
atio
n ba
sis
of a
FS
I com
pile
d w
ith th
e un
derly
ing
data
cal
cula
ted
usin
g m
ore
than
on
e co
nsol
idat
ion
basi
s.
44
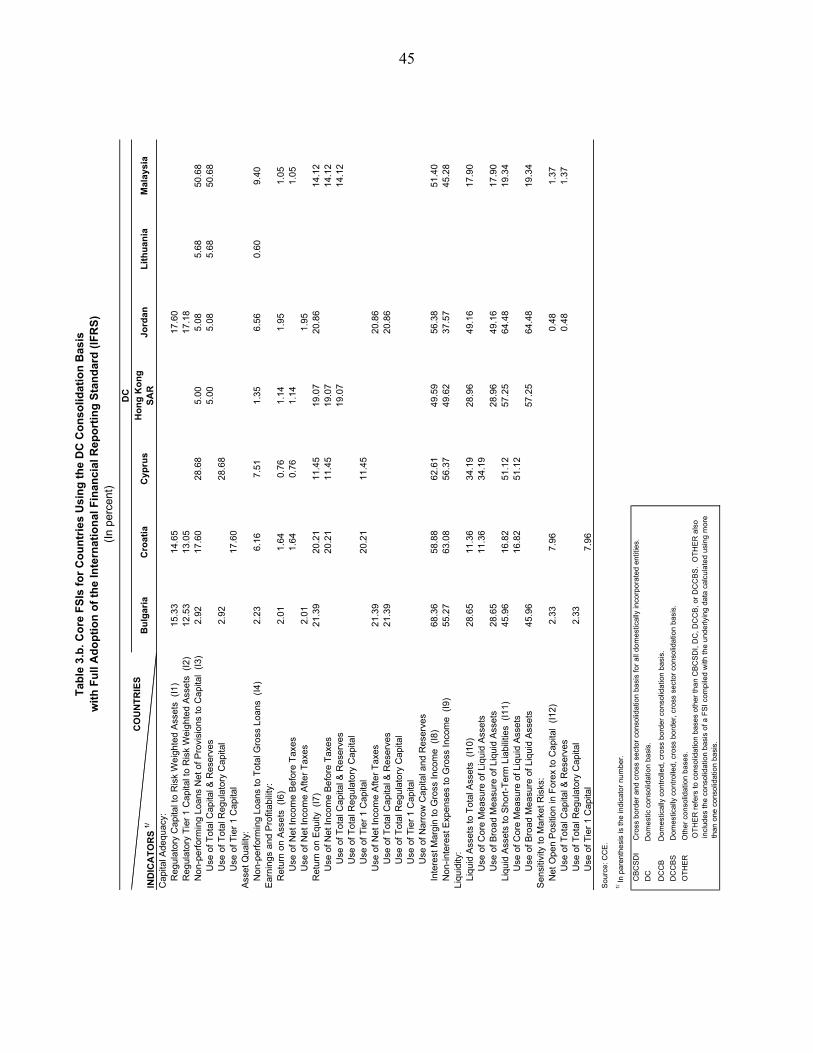
CO
UN
TRIE
S
IND
ICA
TOR
S 1/
Bul
garia
Cro
atia
Cyp
rus
Hon
g K
ong
SAR
Jord
anLi
thua
nia
Mal
aysi
a
Cap
ital A
dequ
acy:
Reg
ulat
ory
Cap
ital t
o R
isk
Wei
ghte
d A
sset
s (I
1)15
.33
14.6
517
.60
Reg
ulat
ory
Tier
1 C
apita
l to
Ris
k W
eigh
ted
Ass
ets
(I2)
12.5
313
.05
17.1
8N
on-p
erfo
rmin
g Lo
ans
Net
of P
rovi
sion
s to
Cap
ital
(I3)
2.92
17.6
028
.68
5.00
5.08
5.68
50.6
8 U
se o
f Tot
al C
apita
l & R
eser
ves
5.00
5.08
5.68
50.6
8 U
se o
f Tot
al R
egul
ator
y C
apita
l2.
9228
.68
Use
of T
ier 1
Cap
ital
17.6
0A
sset
Qua
lity:
Non
-per
form
ing
Loan
s to
Tot
al G
ross
Loa
ns (
I4)
2.23
6.16
7.51
1.35
6.56
0.60
9.40
Ear
ning
s an
d P
rofit
abili
ty:
Ret
urn
on A
sset
s (I
6)2.
011.
640.
761.
141.
951.
05 U
se o
f Net
Inco
me
Bef
ore
Taxe
s1.
640.
761.
141.
05 U
se o
f Net
Inco
me
Afte
r Tax
es2.
011.
95R
etur
n on
Equ
ity (
I7)
21.3
920
.21
11.4
519
.07
20.8
614
.12
Use
of N
et In
com
e B
efor
e Ta
xes
20.2
111
.45
19.0
714
.12
Use
of T
otal
Cap
ital &
Res
erve
s19
.07
14.1
2 U
se o
f Tot
al R
egul
ator
y C
apita
l U
se o
f Tie
r 1 C
apita
l20
.21
11.4
5 U
se o
f Net
Inco
me
Afte
r Tax
es21
.39
20.8
6 U
se o
f Tot
al C
apita
l & R
eser
ves
21.3
920
.86
Use
of T
otal
Reg
ulat
ory
Cap
ital
Use
of T
ier 1
Cap
ital
Use
of N
arro
w C
apita
l and
Res
erve
sIn
tere
st M
argi
n to
Gro
ss In
com
e (I
8)68
.36
58.8
862
.61
49.5
956
.38
51.4
0N
on-in
tere
st E
xpen
ses
to G
ross
Inco
me
(I9)
55.2
763
.08
56.3
749
.62
37.5
745
.28
Liqu
idity
:Li
quid
Ass
ets
to T
otal
Ass
ets
(I10
)28
.65
11.3
634
.19
28.9
649
.16
17.9
0 U
se o
f Cor
e M
easu
re o
f Liq
uid
Ass
ets
11.3
634
.19
Use
of B
road
Mea
sure
of L
iqui
d A
sset
s28
.65
28.9
649
.16
17.9
0Li
quid
Ass
ets
to S
hort-
Term
Lia
bilit
ies
(I11
)45
.96
16.8
251
.12
57.2
564
.48
19.3
4 U
se o
f Cor
e M
easu
re o
f Liq
uid
Ass
ets
16.8
251
.12
Use
of B
road
Mea
sure
of L
iqui
d A
sset
s45
.96
57.2
564
.48
19.3
4S
ensi
tivity
to M
arke
t Ris
ks:
Net
Ope
n P
ositi
on in
For
ex to
Cap
ital
(I12)
2.33
7.96
0.48
1.37
Use
of T
otal
Cap
ital &
Res
erve
s0.
481.
37 U
se o
f Tot
al R
egul
ator
y C
apita
l2.
33 U
se o
f Tie
r 1 C
apita
l7.
96
Sou
rce:
CC
E.
1/ In
par
enth
esis
is th
e in
dica
tor n
umbe
r.
DC
Dom
estic
con
solid
atio
n ba
sis.
DC
CB
D
omes
tical
ly c
ontro
lled,
cro
ss b
orde
r con
solid
atio
n ba
sis.
DC
CB
S
D
omes
tical
ly c
ontro
lled,
cro
ss b
orde
r, cr
oss
sect
or c
onso
lidat
ion
basi
s.
Tabl
e 3.
b. C
ore
FSIs
for C
ount
ries
Usi
ng th
e D
C C
onso
lidat
ion
Bas
isw
ith F
ull A
dopt
ion
of th
e In
tern
atio
nal F
inan
cial
Rep
ortin
g St
anda
rd (I
FRS)
(In p
erce
nt)
OTH
ER
refe
rs to
con
solid
atio
n ba
ses
othe
r tha
n C
BC
SD
I, D
C, D
CC
B, o
r DC
CB
S.
OTH
ER
als
o in
clud
es th
e co
nsol
idat
ion
basi
s of
a F
SI c
ompi
led
with
the
unde
rlyin
g da
ta c
alcu
late
d us
ing
mor
e th
an o
ne c
onso
lidat
ion
basi
s.
DC
CB
CS
DI
C
ross
bor
der a
nd c
ross
sec
tor c
onso
lidat
ion
basi
s fo
r all
dom
estic
ally
inco
rpor
ated
ent
ities
.
OTH
ER
Oth
er c
onso
lidat
ion
base
s.
45

CO
UN
TRIE
S
IND
ICA
TOR
S 1/
Mal
taM
exic
oSp
ain
Sout
h A
fric
aA
vera
ge
Cap
ital A
dequ
acy:
Reg
ulat
ory
Cap
ital t
o R
isk
Wei
ghte
d A
sset
s (I
1)20
.36
12.7
216
.13
Reg
ulat
ory
Tier
1 C
apita
l to
Ris
k W
eigh
ted
Ass
ets
(I2)
17.6
08.
4513
.76
Non
-per
form
ing
Loan
s N
et o
f Pro
visi
ons
to C
apita
l (I3
)20
.24
-11.
856.
4213
.05
Use
of T
otal
Cap
ital &
Res
erve
s-1
1.85
10.9
2 U
se o
f Tot
al R
egul
ator
y C
apita
l20
.24
6.42
14.5
7 U
se o
f Tie
r 1 C
apita
l17
.60
Ass
et Q
ualit
y:N
on-p
erfo
rmin
g Lo
ans
to T
otal
Gro
ss L
oans
(I4
)3.
922.
080.
651.
493.
81E
arni
ngs
and
Pro
fitab
ility
:R
etur
n on
Ass
ets
(I6)
1.42
2.68
0.71
1.55
1.49
Use
of N
et In
com
e B
efor
e Ta
xes
1.42
2.68
1.45
Use
of N
et In
com
e A
fter T
axes
0.71
1.55
1.56
Ret
urn
on E
quity
(I7
)20
.82
24.4
311
.85
20.0
918
.43
Use
of N
et In
com
e B
efor
e Ta
xes
20.8
224
.43
18.3
5 U
se o
f Tot
al C
apita
l & R
eser
ves
24.4
319
.21
Use
of T
otal
Reg
ulat
ory
Cap
ital
20.8
220
.82
Use
of T
ier 1
Cap
ital
15.8
3 U
se o
f Net
Inco
me
Afte
r Tax
es11
.85
20.0
918
.55
Use
of T
otal
Cap
ital &
Res
erve
s21
.13
Use
of T
otal
Reg
ulat
ory
Cap
ital
20.0
920
.09
Use
of T
ier 1
Cap
ital
Use
of N
arro
w C
apita
l and
Res
erve
s11
.85
11.8
5In
tere
st M
argi
n to
Gro
ss In
com
e (I
8)44
.74
61.5
656
.65
38.1
854
.83
Non
-inte
rest
Exp
ense
s to
Gro
ss In
com
e (I
9)38
.42
58.6
652
.15
61.6
251
.80
Liqu
idity
:Li
quid
Ass
ets
to T
otal
Ass
ets
(I10
)13
.92
28.8
134
.86
4.84
25.2
7 U
se o
f Cor
e M
easu
re o
f Liq
uid
Ass
ets
22.7
8 U
se o
f Bro
ad M
easu
re o
f Liq
uid
Ass
ets
13.9
228
.81
34.8
64.
8425
.89
Liqu
id A
sset
s to
Sho
rt-Te
rm L
iabi
litie
s (I
11)
58.3
011
1.03
83.5
27.
0151
.48
Use
of C
ore
Mea
sure
of L
iqui
d A
sset
s33
.97
Use
of B
road
Mea
sure
of L
iqui
d A
sset
s58
.30
111.
0383
.52
7.01
55.8
6S
ensi
tivity
to M
arke
t Ris
ks:
Net
Ope
n P
ositi
on in
For
ex to
Cap
ital
(I12)
-1.6
0-0
.07
1.15
1.66
Use
of T
otal
Cap
ital &
Res
erve
s-0
.07
0.60
Use
of T
otal
Reg
ulat
ory
Cap
ital
-1.6
01.
150.
63 U
se o
f Tie
r 1 C
apita
l7.
96
Tabl
e 3.
b. C
ore
FSIs
for C
ount
ries
Usi
ng th
e D
C C
onso
lidat
ion
Bas
isw
ith F
ull A
dopt
ion
of th
e In
tern
atio
nal F
inan
cial
Rep
ortin
g St
anda
rd (I
FRS)
(C
oncl
.)(In
per
cent
)D
C
46

Tabl
e 3.
c. C
ore
FSIs
for C
ount
ries
Usi
ng th
e D
CC
BS
Con
solid
atio
n B
asis
w
ith F
ull A
dopt
ion
of th
e In
tern
atio
nal F
inan
cial
Rep
ortin
g St
anda
rd (I
FRS)
(In p
erce
nt)
CO
UN
TRIE
S
IND
ICA
TOR
S 1/
Icel
and
Port
ugal
Sing
apor
eSp
ain
Swed
enA
vera
ge
Cap
ital A
dequ
acy:
Reg
ulat
ory
Cap
ital t
o R
isk
Wei
ghte
d A
sset
s (I
1)12
.58
11.3
815
.82
12.4
310
.08
12.4
6R
egul
ator
y Ti
er 1
Cap
ital t
o R
isk
Wei
ghte
d A
sset
s (I
2)10
.31
6.89
11.3
58.
017.
048.
72N
on-p
erfo
rmin
g Lo
ans
Net
of P
rovi
sion
s to
Cap
ital
(I3)
2.64
12.3
60.
042.
404.
36 U
se o
f Tot
al C
apita
l & R
eser
ves
2.64
12.3
67.
50 U
se o
f Tot
al R
egul
ator
y C
apita
l0.
042.
401.
22 U
se o
f Tie
r 1 C
apita
lA
sset
Qua
lity:
Non
-per
form
ing
Loan
s to
Tot
al G
ross
Loa
ns (
I4)
0.27
2.92
0.79
0.17
1.04
Ear
ning
s an
d P
rofit
abili
ty:
Ret
urn
on A
sset
s (I
6)2.
830.
931.
430.
950.
981.
42 U
se o
f Net
Inco
me
Bef
ore
Taxe
s2.
830.
931.
430.
981.
54 U
se o
f Net
Inco
me
Afte
r Tax
es0.
950.
95R
etur
n on
Equ
ity (
I7)
36.4
615
.45
13.7
516
.93
18.9
320
.30
Use
of N
et In
com
e B
efor
e Ta
xes
36.4
615
.45
13.7
518
.93
21.1
5 U
se o
f Tot
al C
apita
l & R
eser
ves
36.4
615
.45
13.7
521
.89
Use
of T
otal
Reg
ulat
ory
Cap
ital
18.9
318
.93
Use
of T
ier 1
Cap
ital
Use
of N
et In
com
e A
fter T
axes
16.9
316
.93
Use
of T
otal
Cap
ital &
Res
erve
s U
se o
f Tot
al R
egul
ator
y C
apita
l U
se o
f Tie
r 1 C
apita
l U
se o
f Nar
row
Cap
ital a
nd R
eser
ves
16.9
316
.93
Inte
rest
Mar
gin
to G
ross
Inco
me
(I8)
38.4
850
.87
58.8
656
.16
54.6
251
.80
Non
-inte
rest
Exp
ense
s to
Gro
ss In
com
e (I
9)37
.24
59.9
241
.41
50.9
454
.34
48.7
7Li
quid
ity:
Liqu
id A
sset
s to
Tot
al A
sset
s (I
10)
1.34
14.0
64.
2332
.21
23.5
115
.07
Use
of C
ore
Mea
sure
of L
iqui
d A
sset
s1.
344.
2323
.51
9.70
Use
of B
road
Mea
sure
of L
iqui
d A
sset
s14
.06
32.2
123
.13
Liqu
id A
sset
s to
Sho
rt-Te
rm L
iabi
litie
s (I
11)
2.69
100.
4389
.05
97.8
951
.03
68.2
2 U
se o
f Cor
e M
easu
re o
f Liq
uid
Ass
ets
2.69
51.0
326
.86
Use
of B
road
Mea
sure
of L
iqui
d A
sset
s10
0.43
89.0
597
.89
95.7
9S
ensi
tivity
to M
arke
t Ris
ks:
Net
Ope
n P
ositi
on in
For
ex to
Cap
ital
(I12)
12.6
24.
930.
177.
442.
665.
56 U
se o
f Tot
al C
apita
l & R
eser
ves
12.6
20.
176.
40 U
se o
f Tot
al R
egul
ator
y C
apita
l4.
937.
442.
665.
01 U
se o
f Tie
r 1 C
apita
l
Sou
rce:
CC
E.
1/ In
par
enth
esis
is th
e in
dica
tor n
umbe
r.
DC
Dom
estic
con
solid
atio
n ba
sis.
DC
CB
D
omes
tical
ly c
ontro
lled,
cro
ss b
orde
r con
solid
atio
n ba
sis.
DC
CB
S
D
omes
tical
ly c
ontro
lled,
cro
ss b
orde
r, cr
oss
sect
or c
onso
lidat
ion
basi
s.
OTH
ER
refe
rs to
con
solid
atio
n ba
ses
othe
r tha
n C
BC
SD
I, D
C, D
CC
B, o
r DC
CB
S.
OTH
ER
als
o in
clud
es th
e co
nsol
idat
ion
basi
s of
a F
SI c
ompi
led
with
the
unde
rlyin
g da
ta c
alcu
late
d us
ing
mor
e th
an o
ne c
onso
lidat
ion
basi
s.
DC
CB
S
CB
CS
DI
C
ross
bor
der a
nd c
ross
sec
tor c
onso
lidat
ion
basi
s fo
r all
dom
estic
ally
inco
rpor
ated
ent
ities
.
OTH
ER
Oth
er c
onso
lidat
ion
base
s.
47

CO
UN
TRIE
S
IND
ICA
TOR
S 1/
Bra
zil
Cyp
rus
Fran
ceH
ong
Kon
g SA
RIta
lyJo
rdan
Lith
uani
a
Cap
ital A
dequ
acy:
Reg
ulat
ory
Cap
ital t
o R
isk
Wei
ghte
d A
sset
s (I
1)17
.89
13.3
911
.41
14.8
69.
9718
.46
9.82
Reg
ulat
ory
Tier
1 C
apita
l to
Ris
k W
eigh
ted
Ass
ets
(I2)
15.1
110
.15
8.25
13.3
07.
3216
.60
8.08
Non
-per
form
ing
Loan
s N
et o
f Pro
visi
ons
to C
apita
l (I3
)-8
.61
8.66
36.5
50.
57 U
se o
f Tot
al C
apita
l & R
eser
ves
-8.6
18.
660.
57 U
se o
f Tot
al R
egul
ator
y C
apita
l36
.55
Use
of T
ier 1
Cap
ital
Ass
et Q
ualit
y:N
on-p
erfo
rmin
g Lo
ans
to T
otal
Gro
ss L
oans
(I4
)4.
333.
547.
254.
78E
arni
ngs
and
Pro
fitab
ility
:R
etur
n on
Ass
ets
(I6)
2.45
0.50
0.74
2.07
1.30
Use
of N
et In
com
e B
efor
e Ta
xes
2.45
1.30
Use
of N
et In
com
e A
fter T
axes
0.50
0.74
2.07
Ret
urn
on E
quity
(I7
)27
.66
14.3
613
.99
17.1
515
.97
Use
of N
et In
com
e B
efor
e Ta
xes
27.6
615
.97
Use
of T
otal
Cap
ital &
Res
erve
s27
.66
15.9
7 U
se o
f Tot
al R
egul
ator
y C
apita
l U
se o
f Tie
r 1 C
apita
l U
se o
f Net
Inco
me
Afte
r Tax
es14
.36
13.9
917
.15
Use
of T
otal
Cap
ital &
Res
erve
s14
.36
17.1
5 U
se o
f Tot
al R
egul
ator
y C
apita
l U
se o
f Tie
r 1 C
apita
l U
se o
f Nar
row
Cap
ital a
nd R
eser
ves
13.9
9In
tere
st M
argi
n to
Gro
ss In
com
e (I
8)55
.32
32.3
949
.80
51.7
250
.92
Non
-inte
rest
Exp
ense
s to
Gro
ss In
com
e (I
9)46
.15
64.3
160
.52
45.1
768
.34
Liqu
idity
:Li
quid
Ass
ets
to T
otal
Ass
ets
(I10
)54
.55
20.9
34.
7623
.05
Use
of C
ore
Mea
sure
of L
iqui
d A
sset
s4.
7623
.05
Use
of B
road
Mea
sure
of L
iqui
d A
sset
s54
.55
20.9
3Li
quid
Ass
ets
to S
hort-
Term
Lia
bilit
ies
(I11
)99
.36
150.
209.
4229
.55
Use
of C
ore
Mea
sure
of L
iqui
d A
sset
s9.
4229
.55
Use
of B
road
Mea
sure
of L
iqui
d A
sset
s99
.36
150.
20S
ensi
tivity
to M
arke
t Ris
ks:
Net
Ope
n P
ositi
on in
For
ex to
Cap
ital
(I12)
-0.9
53.
913.
501.
91 U
se o
f Tot
al C
apita
l & R
eser
ves
-0.9
5 U
se o
f Tot
al R
egul
ator
y C
apita
l3.
501.
91 U
se o
f Tie
r 1 C
apita
l3.
91
Sou
rce:
CC
E.
1/ In
par
enth
esis
is th
e in
dica
tor n
umbe
r.
DC
Dom
estic
con
solid
atio
n ba
sis.
DC
CB
D
omes
tical
ly c
ontro
lled,
cro
ss b
orde
r con
solid
atio
n ba
sis.
DC
CB
S
D
omes
tical
ly c
ontro
lled,
cro
ss b
orde
r, cr
oss
sect
or c
onso
lidat
ion
basi
s.
Tabl
e 3.
d. C
ore
FSIs
for C
ount
ries
Usi
ng th
e C
BC
SDI C
onso
lidat
ion
Bas
is
with
Ful
l Ado
ptio
n of
the
Inte
rnat
iona
l Fin
anci
al R
epor
ting
Stan
dard
(IFR
S)(In
per
cent
)
OTH
ER
refe
rs to
con
solid
atio
n ba
ses
othe
r tha
n C
BC
SD
I, D
C, D
CC
B, o
r DC
CB
S.
OTH
ER
als
o in
clud
es th
e co
nsol
idat
ion
basi
s of
a F
SI c
ompi
led
with
the
unde
rlyin
g da
ta c
alcu
late
d us
ing
mor
e th
an
one
cons
olid
atio
n ba
sis.
CB
CS
DI
C
ross
bor
der a
nd c
ross
sec
tor c
onso
lidat
ion
basi
s fo
r all
dom
estic
ally
inco
rpor
ated
ent
ities
.
OTH
ER
Oth
er c
onso
lidat
ion
base
s.
CB
CSD
I
48
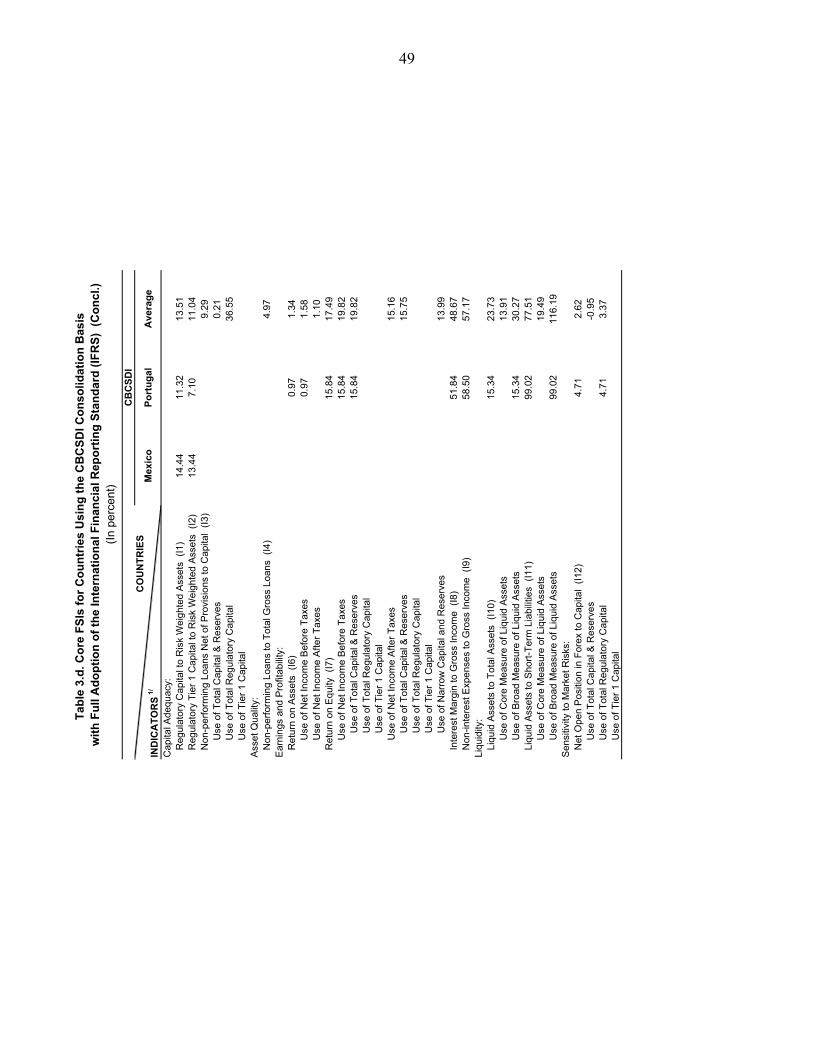
CO
UN
TRIE
S
IND
ICA
TOR
S 1/
Mex
ico
Port
ugal
Ave
rage
Cap
ital A
dequ
acy:
Reg
ulat
ory
Cap
ital t
o R
isk
Wei
ghte
d A
sset
s (I
1)14
.44
11.3
213
.51
Reg
ulat
ory
Tier
1 C
apita
l to
Ris
k W
eigh
ted
Ass
ets
(I2)
13.4
47.
1011
.04
Non
-per
form
ing
Loan
s N
et o
f Pro
visi
ons
to C
apita
l (I3
)9.
29 U
se o
f Tot
al C
apita
l & R
eser
ves
0.21
Use
of T
otal
Reg
ulat
ory
Cap
ital
36.5
5 U
se o
f Tie
r 1 C
apita
lA
sset
Qua
lity:
Non
-per
form
ing
Loan
s to
Tot
al G
ross
Loa
ns (
I4)
4.97
Ear
ning
s an
d P
rofit
abili
ty:
Ret
urn
on A
sset
s (I
6)0.
971.
34 U
se o
f Net
Inco
me
Bef
ore
Taxe
s0.
971.
58 U
se o
f Net
Inco
me
Afte
r Tax
es1.
10R
etur
n on
Equ
ity (
I7)
15.8
417
.49
Use
of N
et In
com
e B
efor
e Ta
xes
15.8
419
.82
Use
of T
otal
Cap
ital &
Res
erve
s15
.84
19.8
2 U
se o
f Tot
al R
egul
ator
y C
apita
l U
se o
f Tie
r 1 C
apita
l U
se o
f Net
Inco
me
Afte
r Tax
es15
.16
Use
of T
otal
Cap
ital &
Res
erve
s15
.75
Use
of T
otal
Reg
ulat
ory
Cap
ital
Use
of T
ier 1
Cap
ital
Use
of N
arro
w C
apita
l and
Res
erve
s13
.99
Inte
rest
Mar
gin
to G
ross
Inco
me
(I8)
51.8
448
.67
Non
-inte
rest
Exp
ense
s to
Gro
ss In
com
e (I
9)58
.50
57.1
7Li
quid
ity:
Liqu
id A
sset
s to
Tot
al A
sset
s (I
10)
15.3
423
.73
Use
of C
ore
Mea
sure
of L
iqui
d A
sset
s13
.91
Use
of B
road
Mea
sure
of L
iqui
d A
sset
s15
.34
30.2
7Li
quid
Ass
ets
to S
hort-
Term
Lia
bilit
ies
(I11
)99
.02
77.5
1 U
se o
f Cor
e M
easu
re o
f Liq
uid
Ass
ets
19.4
9 U
se o
f Bro
ad M
easu
re o
f Liq
uid
Ass
ets
99.0
211
6.19
Sen
sitiv
ity to
Mar
ket R
isks
:N
et O
pen
Pos
ition
in F
orex
to C
apita
l (I1
2)4.
712.
62 U
se o
f Tot
al C
apita
l & R
eser
ves
-0.9
5 U
se o
f Tot
al R
egul
ator
y C
apita
l4.
713.
37 U
se o
f Tie
r 1 C
apita
l
Tabl
e 3.
d. C
ore
FSIs
for C
ount
ries
Usi
ng th
e C
BC
SDI C
onso
lidat
ion
Bas
is
with
Ful
l Ado
ptio
n of
the
Inte
rnat
iona
l Fin
anci
al R
epor
ting
Stan
dard
(IFR
S) (
Con
cl.)
(In p
erce
nt)
CB
CSD
I
49

Tabl
e 4.
a. C
ore
FSIs
for C
ount
ries
Usi
ng th
e D
CC
B C
onso
lidat
ion
Bas
is
with
Ful
l Ado
ptio
n of
the
Inte
rnat
iona
l Fin
anci
al R
epor
ting
Stan
dard
(IFR
S) a
nd F
ull I
ntra
-Gro
up C
onso
lidat
ion
(In p
erce
nt)
CO
UN
TRIE
S
IND
ICA
TOR
S 1/
Cyp
rus
Mal
aysi
aM
alta
Ave
rage
Cap
ital A
dequ
acy:
Reg
ulat
ory
Cap
ital t
o R
isk
Wei
ghte
d A
sset
s (I
1)12
.36
13.7
317
.31
14.4
7R
egul
ator
y Ti
er 1
Cap
ital t
o R
isk
Wei
ghte
d A
sset
s (I
2)9.
9810
.83
14.1
211
.64
Non
-per
form
ing
Loan
s N
et o
f Pro
visi
ons
to C
apita
l (I3
)34
.82
49.3
742
.09
Use
of T
otal
Cap
ital &
Res
erve
s U
se o
f Tot
al R
egul
ator
y C
apita
l34
.82
49.3
742
.09
Use
of T
ier 1
Cap
ital
Ass
et Q
ualit
y:N
on-p
erfo
rmin
g Lo
ans
to T
otal
Gro
ss L
oans
(I4
)7.
0812
.01
9.55
Ear
ning
s an
d P
rofit
abili
ty:
Ret
urn
on A
sset
s (I
6)0.
761.
351.
06 U
se o
f Net
Inco
me
Bef
ore
Taxe
s0.
761.
351.
06 U
se o
f Net
Inco
me
Afte
r Tax
esR
etur
n on
Equ
ity (
I7)
14.1
416
.92
15.5
3 U
se o
f Net
Inco
me
Bef
ore
Taxe
s14
.14
16.9
215
.53
Use
of T
otal
Cap
ital &
Res
erve
s U
se o
f Tot
al R
egul
ator
y C
apita
l16
.92
16.9
2 U
se o
f Tie
r 1 C
apita
l14
.14
14.1
4 U
se o
f Net
Inco
me
Afte
r Tax
es U
se o
f Tot
al C
apita
l & R
eser
ves
Use
of T
otal
Reg
ulat
ory
Cap
ital
Use
of T
ier 1
Cap
ital
Use
of N
arro
w C
apita
l and
Res
erve
sIn
tere
st M
argi
n to
Gro
ss In
com
e (I
8)66
.21
68.1
067
.15
Non
-inte
rest
Exp
ense
s to
Gro
ss In
com
e (I
9)59
.06
45.9
152
.49
Liqu
idity
:Li
quid
Ass
ets
to T
otal
Ass
ets
(I10
)29
.48
26.7
728
.13
Use
of C
ore
Mea
sure
of L
iqui
d A
sset
s29
.48
29.4
8 U
se o
f Bro
ad M
easu
re o
f Liq
uid
Ass
ets
26.7
726
.77
Liqu
id A
sset
s to
Sho
rt-Te
rm L
iabi
litie
s (I
11)
34.8
954
.14
44.5
1 U
se o
f Cor
e M
easu
re o
f Liq
uid
Ass
ets
34.8
934
.89
Use
of B
road
Mea
sure
of L
iqui
d A
sset
s54
.14
54.1
4S
ensi
tivity
to M
arke
t Ris
ks:
Net
Ope
n P
ositi
on in
For
ex to
Cap
ital
(I12)
1.96
4.35
3.15
Use
of T
otal
Cap
ital &
Res
erve
s U
se o
f Tot
al R
egul
ator
y C
apita
l4.
354.
35 U
se o
f Tie
r 1 C
apita
l1.
961.
96
Sou
rce:
CC
E.
1/ In
par
enth
esis
is th
e in
dica
tor n
umbe
r.
DC
Dom
estic
con
solid
atio
n ba
sis.
DC
CB
Dom
estic
ally
con
trolle
d, c
ross
bor
der c
onso
lidat
ion
basi
s.D
CC
BS
D
omes
tical
ly c
ontro
lled,
cro
ss b
orde
r, cr
oss
sect
or c
onso
lidat
ion
basi
s.O
THE
R
Oth
er c
onso
lidat
ion
base
s.O
THE
R re
fers
to c
onso
lidat
ion
base
s ot
her t
han
CB
CS
DI,
DC
, DC
CB
, or D
CC
BS
. O
THE
R a
lso
incl
udes
th
e co
nsol
idat
ion
basi
s of
a F
SI c
ompi
led
with
the
unde
rlyin
g da
ta c
alcu
late
d us
ing
mor
e th
an o
ne
cons
olid
atio
n ba
sis.
DC
CB
CB
CS
DI
Cro
ss b
orde
r and
cro
ss s
ecto
r con
solid
atio
n ba
sis
for a
ll do
mes
tical
ly in
corp
orat
ed e
ntiti
es.
50

CO
UN
TRIE
S
IND
ICA
TOR
S 1/
Bul
garia
Cro
atia
Cyp
rus
Jord
anM
alay
sia
Mal
taM
exic
oSp
ain
Ave
rage
Cap
ital A
dequ
acy:
Reg
ulat
ory
Cap
ital t
o R
isk
Wei
ghte
d A
sset
s (I
1)15
.33
14.6
517
.60
20.3
616
.98
Reg
ulat
ory
Tier
1 C
apita
l to
Ris
k W
eigh
ted
Ass
ets
(I2)
12.5
317
.18
17.6
015
.77
Non
-per
form
ing
Loan
s N
et o
f Pro
visi
ons
to C
apita
l (I3
)2.
9228
.68
5.08
50.6
820
.24
-11.
8515
.96
Use
of T
otal
Cap
ital &
Res
erve
s5.
0850
.68
-11.
8514
.64
Use
of T
otal
Reg
ulat
ory
Cap
ital
2.92
28.6
820
.24
17.2
8 U
se o
f Tie
r 1 C
apita
lA
sset
Qua
lity:
Non
-per
form
ing
Loan
s to
Tot
al G
ross
Loa
ns (
I4)
2.23
7.51
6.56
9.40
3.92
2.08
0.65
4.62
Ear
ning
s an
d P
rofit
abili
ty:
Ret
urn
on A
sset
s (I
6)2.
010.
761.
951.
051.
422.
680.
711.
51 U
se o
f Net
Inco
me
Bef
ore
Taxe
s0.
761.
051.
422.
681.
48 U
se o
f Net
Inco
me
Afte
r Tax
es2.
011.
950.
711.
56R
etur
n on
Equ
ity (
I7)
21.3
911
.45
20.8
614
.12
20.8
224
.43
11.8
517
.85
Use
of N
et In
com
e B
efor
e Ta
xes
11.4
514
.12
20.8
224
.43
17.7
0 U
se o
f Tot
al C
apita
l & R
eser
ves
14.1
224
.43
19.2
8 U
se o
f Tot
al R
egul
ator
y C
apita
l20
.82
20.8
2 U
se o
f Tie
r 1 C
apita
l11
.45
11.4
5 U
se o
f Net
Inco
me
Afte
r Tax
es21
.39
20.8
611
.85
18.0
3 U
se o
f Tot
al C
apita
l & R
eser
ves
21.3
920
.86
21.1
3 U
se o
f Tot
al R
egul
ator
y C
apita
l U
se o
f Tie
r 1 C
apita
l U
se o
f Nar
row
Cap
ital a
nd R
eser
ves
11.8
511
.85
Inte
rest
Mar
gin
to G
ross
Inco
me
(I8)
68.3
662
.61
56.3
851
.40
44.7
461
.56
56.6
557
.38
Non
-inte
rest
Exp
ense
s to
Gro
ss In
com
e (I
9)55
.27
56.3
737
.57
45.2
838
.42
58.6
652
.15
49.1
0Li
quid
ity:
Liqu
id A
sset
s to
Tot
al A
sset
s (I
10)
28.6
534
.19
49.1
617
.90
13.9
228
.81
34.8
629
.64
Use
of C
ore
Mea
sure
of L
iqui
d A
sset
s34
.19
34.1
9 U
se o
f Bro
ad M
easu
re o
f Liq
uid
Ass
ets
28.6
549
.16
17.9
013
.92
28.8
134
.86
28.8
8Li
quid
Ass
ets
to S
hort-
Term
Lia
bilit
ies
(I11
)45
.96
51.1
264
.48
19.3
458
.30
111.
0383
.52
61.9
6 U
se o
f Cor
e M
easu
re o
f Liq
uid
Ass
ets
51.1
251
.12
Use
of B
road
Mea
sure
of L
iqui
d A
sset
s45
.96
64.4
819
.34
58.3
011
1.03
83.5
263
.77
Sen
sitiv
ity to
Mar
ket R
isks
:N
et O
pen
Pos
ition
in F
orex
to C
apita
l (I1
2)2.
330.
481.
37-1
.60
-0.0
70.
50 U
se o
f Tot
al C
apita
l & R
eser
ves
0.48
1.37
-0.0
70.
60 U
se o
f Tot
al R
egul
ator
y C
apita
l2.
33-1
.60
0.37
Use
of T
ier 1
Cap
ital
Sou
rce:
CC
E.
1/ In
par
enth
esis
is th
e in
dica
tor n
umbe
r.
DC
Dom
estic
con
solid
atio
n ba
sis.
DC
CB
Dom
estic
ally
con
trolle
d, c
ross
bor
der c
onso
lidat
ion
basi
s.D
CC
BS
D
omes
tical
ly c
ontro
lled,
cro
ss b
orde
r, cr
oss
sect
or c
onso
lidat
ion
basi
s.
Tabl
e 4.
b. C
ore
FSIs
for C
ount
ries
Usi
ng th
e D
C C
onso
lidat
ion
Bas
isw
ith F
ull A
dopt
ion
of th
e In
tern
atio
nal F
inan
cial
Rep
ortin
g St
anda
rd (I
FRS)
and
Ful
l Int
ra-G
roup
Con
solid
atio
n
DC
CB
CS
DI
Cro
ss b
orde
r and
cro
ss s
ecto
r con
solid
atio
n ba
sis
for a
ll do
mes
tical
ly in
corp
orat
ed e
ntiti
es.
OTH
ER
O
ther
con
solid
atio
n ba
ses.
(In p
erce
nt)
OTH
ER
refe
rs to
con
solid
atio
n ba
ses
othe
r tha
n C
BC
SD
I, D
C, D
CC
B, o
r DC
CB
S.
OTH
ER
als
o in
clud
es th
e co
nsol
idat
ion
basi
s of
a F
SI c
ompi
led
with
the
unde
rlyin
g da
ta c
alcu
late
d us
ing
mor
e th
an o
ne c
onso
lidat
ion
basi
s.
51

Tabl
e 4.
c. C
ore
FSIs
for C
ount
ries
Usi
ng th
e D
CC
BS
Con
solid
atio
n B
asis
with
Ful
l Ado
ptio
n of
the
Inte
rnat
iona
l Fin
anci
al R
epor
ting
Stan
dard
(IFR
S) a
nd F
ull I
ntra
-Gro
up C
onso
lidat
ion
(In p
erce
nt)
CO
UN
TRIE
S
IND
ICA
TOR
S 1/
Icel
and
Port
ugal
Sing
apor
eSp
ain
Swed
enA
vera
ge
Cap
ital A
dequ
acy:
Reg
ulat
ory
Cap
ital t
o R
isk
Wei
ghte
d A
sset
s (I
1)12
.58
11.3
815
.82
12.4
310
.08
12.4
6R
egul
ator
y Ti
er 1
Cap
ital t
o R
isk
Wei
ghte
d A
sset
s (I
2)10
.31
6.89
11.3
58.
017.
048.
72N
on-p
erfo
rmin
g Lo
ans
Net
of P
rovi
sion
s to
Cap
ital
(I3)
2.64
12.3
60.
042.
404.
36 U
se o
f Tot
al C
apita
l & R
eser
ves
2.64
12.3
67.
50 U
se o
f Tot
al R
egul
ator
y C
apita
l0.
042.
401.
22 U
se o
f Tie
r 1 C
apita
lA
sset
Qua
lity:
Non
-per
form
ing
Loan
s to
Tot
al G
ross
Loa
ns (
I4)
0.27
2.92
0.79
0.17
1.04
Ear
ning
s an
d P
rofit
abili
ty:
Ret
urn
on A
sset
s (I
6)2.
830.
931.
430.
950.
981.
42 U
se o
f Net
Inco
me
Bef
ore
Taxe
s2.
830.
931.
430.
981.
54 U
se o
f Net
Inco
me
Afte
r Tax
es0.
950.
95R
etur
n on
Equ
ity (
I7)
36.4
615
.45
13.7
516
.93
18.9
320
.30
Use
of N
et In
com
e B
efor
e Ta
xes
36.4
615
.45
13.7
518
.93
21.1
5 U
se o
f Tot
al C
apita
l & R
eser
ves
36.4
615
.45
13.7
521
.89
Use
of T
otal
Reg
ulat
ory
Cap
ital
18.9
318
.93
Use
of T
ier 1
Cap
ital
Use
of N
et In
com
e A
fter T
axes
16.9
316
.93
Use
of T
otal
Cap
ital &
Res
erve
s U
se o
f Tot
al R
egul
ator
y C
apita
l U
se o
f Tie
r 1 C
apita
l U
se o
f Nar
row
Cap
ital a
nd R
eser
ves
16.9
316
.93
Inte
rest
Mar
gin
to G
ross
Inco
me
(I8)
38.4
850
.87
58.8
656
.16
54.6
251
.80
Non
-inte
rest
Exp
ense
s to
Gro
ss In
com
e (I
9)37
.24
59.9
241
.41
50.9
454
.34
48.7
7Li
quid
ity:
Liqu
id A
sset
s to
Tot
al A
sset
s (I
10)
1.34
14.0
64.
2332
.21
23.5
115
.07
Use
of C
ore
Mea
sure
of L
iqui
d A
sset
s1.
344.
2323
.51
9.70
Use
of B
road
Mea
sure
of L
iqui
d A
sset
s14
.06
32.2
123
.13
Liqu
id A
sset
s to
Sho
rt-Te
rm L
iabi
litie
s (I
11)
2.69
100.
4389
.05
97.8
951
.03
68.2
2 U
se o
f Cor
e M
easu
re o
f Liq
uid
Ass
ets
2.69
51.0
326
.86
Use
of B
road
Mea
sure
of L
iqui
d A
sset
s10
0.43
89.0
597
.89
95.7
9S
ensi
tivity
to M
arke
t Ris
ks:
Net
Ope
n P
ositi
on in
For
ex to
Cap
ital
(I12 )
12.6
24.
930.
177.
442.
665.
56 U
se o
f Tot
al C
apita
l & R
eser
ves
12.6
20.
176.
40 U
se o
f Tot
al R
egul
ator
y C
apita
l4.
937.
442.
665.
01 U
se o
f Tie
r 1 C
apita
l
Sou
rce:
CC
E.
1/ In
par
enth
esis
is th
e in
dica
tor n
umbe
r.
DC
Dom
estic
con
solid
atio
n ba
sis.
DC
CB
Dom
estic
ally
con
trolle
d, c
ross
bor
der c
onso
lidat
ion
basi
s.D
CC
BS
D
omes
tical
ly c
ontro
lled,
cro
ss b
orde
r, cr
oss
sect
or c
onso
lidat
ion
basi
s.
DC
CB
S
CB
CS
DI
Cro
ss b
orde
r and
cro
ss s
ecto
r con
solid
atio
n ba
sis
for a
ll do
mes
tical
ly in
corp
orat
ed e
ntiti
es.
OTH
ER
O
ther
con
solid
atio
n ba
ses.
OTH
ER
refe
rs to
con
solid
atio
n ba
ses
othe
r tha
n C
BC
SD
I, D
C, D
CC
B, o
r DC
CB
S.
OTH
ER
als
o in
clud
es th
e co
nsol
idat
ion
basi
s of
a F
SI c
ompi
led
with
the
unde
rlyin
g da
ta c
alcu
late
d us
ing
mor
e th
an
one
cons
olid
atio
n ba
sis.
52

CO
UN
TRIE
S
IND
ICA
TOR
S 1/
Cyp
rus
Fran
ceH
ong
Kon
g SA
RIta
lyJo
rdan
Cap
ital A
dequ
acy:
Reg
ulat
ory
Cap
ital t
o R
isk
Wei
ghte
d A
sset
s (I
1)13
.39
11.4
114
.86
9.97
18.4
6R
egul
ator
y Ti
er 1
Cap
ital t
o R
isk
Wei
ghte
d A
sset
s (I
2)10
.15
8.25
13.3
07.
3216
.60
Non
-per
form
ing
Loan
s N
et o
f Pro
visi
ons
to C
apita
l (I3
)8.
6636
.55
0.57
Use
of T
otal
Cap
ital &
Res
erve
s8.
660.
57 U
se o
f Tot
al R
egul
ator
y C
apita
l36
.55
Use
of T
ier 1
Cap
ital
Ass
et Q
ualit
y:N
on-p
erfo
rmin
g Lo
ans
to T
otal
Gro
ss L
oans
(I4
)3.
547.
254.
78E
arni
ngs
and
Pro
fitab
ility
:R
etur
n on
Ass
ets
(I6)
0.50
0.74
2.07
Use
of N
et In
com
e B
efor
e Ta
xes
Use
of N
et In
com
e A
fter T
axes
0.50
0.74
2.07
Ret
urn
on E
quity
(I7
)14
.36
13.9
917
.15
Use
of N
et In
com
e B
efor
e Ta
xes
Use
of T
otal
Cap
ital &
Res
erve
s U
se o
f Tot
al R
egul
ator
y C
apita
l U
se o
f Tie
r 1 C
apita
l U
se o
f Net
Inco
me
Afte
r Tax
es14
.36
13.9
917
.15
Use
of T
otal
Cap
ital &
Res
erve
s14
.36
17.1
5 U
se o
f Tot
al R
egul
ator
y C
apita
l U
se o
f Tie
r 1 C
apita
l U
se o
f Nar
row
Cap
ital a
nd R
eser
ves
13.9
9In
tere
st M
argi
n to
Gro
ss In
com
e (I
8)32
.39
49.8
051
.72
Non
-inte
rest
Exp
ense
s to
Gro
ss In
com
e (I
9)64
.31
60.5
245
.17
Liqu
idity
:Li
quid
Ass
ets
to T
otal
Ass
ets
(I10
)20
.93
4.76
Use
of C
ore
Mea
sure
of L
iqui
d A
sset
s4.
76 U
se o
f Bro
ad M
easu
re o
f Liq
uid
Ass
ets
20.9
3Li
quid
Ass
ets
to S
hort-
Term
Lia
bilit
ies
(I11
)15
0.20
9.42
Use
of C
ore
Mea
sure
of L
iqui
d A
sset
s9.
42 U
se o
f Bro
ad M
easu
re o
f Liq
uid
Ass
ets
150.
20S
ensi
tivity
to M
arke
t Ris
ks:
Net
Ope
n P
ositi
on in
For
ex to
Cap
ital
(I12)
3.91
3.50
Use
of T
otal
Cap
ital &
Res
erve
s U
se o
f Tot
al R
egul
ator
y C
apita
l3.
50 U
se o
f Tie
r 1 C
apita
l3.
91
Sou
rce:
CC
E.
1/ In
par
enth
esis
is th
e in
dica
tor n
umbe
r.
DC
Dom
estic
con
solid
atio
n ba
sis.
DC
CB
Dom
estic
ally
con
trolle
d, c
ross
bor
der c
onso
lidat
ion
basi
s.D
CC
BS
D
omes
tical
ly c
ontro
lled,
cro
ss b
orde
r, cr
oss
sect
or c
onso
lidat
ion
basi
s.
CB
CS
DI
Cro
ss b
orde
r and
cro
ss s
ecto
r con
solid
atio
n ba
sis
for a
ll do
mes
tical
ly in
corp
orat
ed e
ntiti
es.
OTH
ER
O
ther
con
solid
atio
n ba
ses.
OTH
ER
refe
rs to
con
solid
atio
n ba
ses
othe
r tha
n C
BC
SD
I, D
C, D
CC
B, o
r DC
CB
S.
OTH
ER
als
o in
clud
es th
e co
nsol
idat
ion
basi
s of
a F
SI c
ompi
led
with
the
unde
rlyin
g da
ta c
alcu
late
d us
ing
mor
e th
an
one
cons
olid
atio
n ba
sis.
CB
CSD
I
Tabl
e 4.
d. C
ore
FSIs
for C
ount
ries
Usi
ng th
e C
BC
SDI C
onso
lidat
ion
Bas
isw
ith F
ull A
dopt
ion
of th
e In
tern
atio
nal F
inan
cial
Rep
ortin
g St
anda
rd (I
FRS)
and
Ful
l Int
ra-G
roup
Con
solid
atio
n(In
per
cent
)
53

CO
UN
TRIE
S
IND
ICA
TOR
S 1/
Lith
uani
aM
exic
oPo
rtug
alA
vera
ge
Cap
ital A
dequ
acy:
Reg
ulat
ory
Cap
ital t
o R
isk
Wei
ghte
d A
sset
s (I
1)9.
8214
.44
11.3
212
.96
Reg
ulat
ory
Tier
1 C
apita
l to
Ris
k W
eigh
ted
Ass
ets
(I2)
8.08
13.4
47.
1010
.53
Non
-per
form
ing
Loan
s N
et o
f Pro
visi
ons
to C
apita
l (I3
)15
.26
Use
of T
otal
Cap
ital &
Res
erve
s4.
62 U
se o
f Tot
al R
egul
ator
y C
apita
l36
.55
Use
of T
ier 1
Cap
ital
Ass
et Q
ualit
y:N
on-p
erfo
rmin
g Lo
ans
to T
otal
Gro
ss L
oans
(I4
)5.
19E
arni
ngs
and
Pro
fitab
ility
:R
etur
n on
Ass
ets
(I6)
1.30
0.97
1.12
Use
of N
et In
com
e B
efor
e Ta
xes
1.30
0.97
1.14
Use
of N
et In
com
e A
fter T
axes
1.10
Ret
urn
on E
quity
(I7
)15
.97
15.8
415
.46
Use
of N
et In
com
e B
efor
e Ta
xes
15.9
715
.84
15.9
1 U
se o
f Tot
al C
apita
l & R
eser
ves
15.9
715
.84
15.9
1 U
se o
f Tot
al R
egul
ator
y C
apita
l U
se o
f Tie
r 1 C
apita
l U
se o
f Net
Inco
me
Afte
r Tax
es15
.16
Use
of T
otal
Cap
ital &
Res
erve
s15
.75
Use
of T
otal
Reg
ulat
ory
Cap
ital
Use
of T
ier 1
Cap
ital
Use
of N
arro
w C
apita
l and
Res
erve
s13
.99
Inte
rest
Mar
gin
to G
ross
Inco
me
(I8)
50.9
251
.84
47.3
3N
on-in
tere
st E
xpen
ses
to G
ross
Inco
me
(I9)
68.3
458
.50
59.3
7Li
quid
ity:
Liqu
id A
sset
s to
Tot
al A
sset
s (I
10)
23.0
515
.34
16.0
2 U
se o
f Cor
e M
easu
re o
f Liq
uid
Ass
ets
23.0
513
.91
Use
of B
road
Mea
sure
of L
iqui
d A
sset
s15
.34
18.1
4Li
quid
Ass
ets
to S
hort-
Term
Lia
bilit
ies
(I11
)29
.55
99.0
272
.05
Use
of C
ore
Mea
sure
of L
iqui
d A
sset
s29
.55
19.4
9 U
se o
f Bro
ad M
easu
re o
f Liq
uid
Ass
ets
99.0
212
4.61
Sen
sitiv
ity to
Mar
ket R
isks
:N
et O
pen
Pos
ition
in F
orex
to C
apita
l (I1
2)1.
914.
713.
51 U
se o
f Tot
al C
apita
l & R
eser
ves
Use
of T
otal
Reg
ulat
ory
Cap
ital
1.91
4.71
3.37
Use
of T
ier 1
Cap
ital
3.91
CB
CSD
I
Tabl
e 4.
d. C
ore
FSIs
for C
ount
ries
Usi
ng th
e C
BC
SDI C
onso
lidat
ion
Bas
isw
ith F
ull A
dopt
ion
of th
e In
tern
atio
nal F
inan
cial
Rep
ortin
g St
anda
rd (I
FRS)
and
Ful
l Int
ra-G
roup
Con
solid
atio
n (
Con
cl.)
(In p
erce
nt)
54

Dep
osit
Take
rs:
Cor
e S
et N
umbe
r of I
ndic
ator
s69
717
4317
10
775
Per
cent
age
89.9
2.2
5.5
2.2
0.1
0.0
100
Enc
oura
ged
Set
Num
ber o
f Ind
icat
ors
470
2573
81
157
8 P
erce
ntag
e81
.34.
312
.61.
40.
20.
210
0E
ncou
rage
d FS
Is fo
r Oth
er F
inan
cial
Cor
pora
tions
: N
umbe
r of I
ndic
ator
s10
254
414
461
Per
cent
age
16.4
41.0
6.6
6.6
23.0
6.6
100
Enc
oura
ged
FSIs
for N
on-F
inan
cial
Cor
pora
tions
: N
umbe
r of I
ndic
ator
s0
2430
00
458
Per
cent
age
0.0
41.4
51.7
0.0
0.0
6.9
100
Tot
al N
umbe
r of I
ndic
ator
s 2/
1177
9115
029
169
1472
Perc
enta
ge80
.06.
210
.22.
01.
10.
610
0S
ourc
e: C
CE
.1/ S
: Sup
ervi
sory
dat
a; N
: Nat
iona
l Acc
ount
s da
ta; O
: Oth
er d
ata;
S/O
: Sup
ervi
sory
and
Oth
er d
ata;
S/N
: Sup
ervi
sory
and
Nat
iona
l Acc
ount
s da
ta;
N
/O: N
atio
nal A
ccou
nts
and
Oth
er d
ata.
2/ T
otal
num
ber o
f ind
icat
ors
subm
itted
by
all C
CE
par
ticip
atin
g co
untri
es th
at m
eet g
iven
crit
eria
.
Tabl
e 5.
a. D
ata
Sour
ces
by In
dica
tor
Dat
a So
urce
s 1/
Indi
cato
rs
SN
OS/
OS/
NN
/OTo
tal 2/
55

640
10
00
(98.
5)(0
.0)
(1.5
)(0
.0)
(0.0
)(0
.0)
630
10
00
(98.
4)(0
.0)
(1.6
)(0
.0)
(0.0
)(0
.0)
601
12
00
(93.
8)(1
.6)
(1.6
)(3
.1)
(0.0
)(0
.0)
611
12
00
(93.
8)(1
.5)
(1.5
)(3
.1)
(0.0
)(0
.0)
395
131
10
(66.
1)(8
.5)
(22.
0)(1
.7)
(1.7
)(0
.0)
611
51
00
(89.
7)(1
.5)
(7.4
)(1
.5)
(0.0
)(0
.0)
611
33
00
(89.
7)(1
.5)
(4.4
)(4
.4)
(0.0
)(0
.0)
611
51
00
(89.
7)(1
.5)
(7.4
)(1
.5)
(0.0
)(0
.0)
611
51
00
(89.
7)(1
.5)
(7.4
)(1
.5)
(0.0
)(0
.0)
572
33
00
(87.
7)(3
.1)
(4.6
)(4
.6)
(0.0
)(0
.0)
582
31
00
(90.
6)(3
.1)
(4.7
)(1
.6)
(0.0
)(0
.0)
512
22
00
(89.
5)(3
.5)
(3.5
)(3
.5)
(0.0
)(0
.0)
Tota
l Num
ber o
f Ind
icat
ors
3/69
717
4317
10
775
Perc
enta
ge89
.92.
25.
52.
20.
10.
010
0S
ourc
e: C
CE
.1/ S
: Sup
ervi
sory
dat
a; N
: Nat
iona
l Acc
ount
s da
ta; O
: Oth
er d
ata;
S/O
: Sup
ervi
sory
and
Oth
er d
ata;
S/N
: Sup
ervi
sory
and
Nat
iona
l Acc
ount
s da
ta; N
/O: N
atio
nal A
ccou
nts
and
Oth
er d
ata.
2/ In
par
enth
esis
is th
e in
dica
tor n
umbe
r.3/ A
giv
en F
SI m
ay b
e co
mpi
led
mor
e th
an o
nce
by a
giv
en c
ount
ry. T
otal
num
ber o
f ind
icat
ors
subm
itted
by
all C
CE
par
ticip
atin
g co
untri
es th
at m
eet a
giv
en c
riter
ia.
S/O
N/O
Tabl
e 5.
b. D
ata
Sour
ces
by In
dica
tor:
Cor
e FS
Is fo
r Dep
osit
Take
rs
Reg
ulat
ory
capi
tal t
o ris
k-w
eigh
ted
asse
ts (I
1)
(num
ber o
f ind
icat
ors
and,
in p
aren
thes
is, p
erce
nt)
Reg
ulat
ory
Tier
1 c
apita
l to
risk-
wei
ghte
d as
sets
(I2)
Non
-per
form
ing
loan
s ne
t of p
rovi
sion
s to
cap
ital
(I3)
Tota
l 3/
D
ata
Sour
ces
1/
Indi
cato
rs 2/
S
S/N
ON
65 64
Non
-per
form
ing
loan
s to
tota
l gro
ss lo
ans
(I4)
Sec
tora
l dis
tribu
tion
of lo
ans
to to
tal l
oans
(I5)
Ret
urn
on a
sset
s (I6
)
Ret
urn
on e
quity
(I7)
64 65 59 68 68 68In
tere
st m
argi
n to
gro
ss in
com
e (I8
)
68 65 57N
et o
pen
posi
tion
in fo
reig
n ex
chan
ge to
cap
ital (
I12)
Non
-inte
rest
exp
ense
s to
gro
ss in
com
e (I9
)
Liqu
id a
sset
s to
tota
l ass
ets
(I10)
Liqu
id a
sset
s to
sho
rt-te
rm li
abili
ties
(I11)
64
56

491
42
00
(87.
5)(1
.8)
(7.1
)(3
.6)
(0.0
)(0
.0)
470
01
00
(97.
9)(0
.0)
(0.0
)(2
.1)
(0.0
)(0
.0)
321
70
11
(76.
2)(2
.4)
(16.
7)(0
.0)
(2.4
)(2
.4)
322
21
00
(86.
5)(5
.4)
(5.4
)(2
.7)
(0.0
)(0
.0)
332
21
00
(86.
8)(5
.3)
(5.3
)(2
.6)
(0.0
)(0
.0)
461
31
00
(90.
2)(2
.0)
(5.9
)(2
.0)
(0.0
)(0
.0)
491
41
00
(89.
1)(1
.8)
(7.3
)(1
.8)
(0.0
)(0
.0)
185
180
00
(43.
9)(1
2.2)
(43.
9)(0
.0)
(0.0
)(0
.0)
82
150
00
(32.
0)(8
.0)
(60.
0)(0
.0)
(0.0
)(0
.0)
443
60
00
(83.
0)(5
.7)
(11.
3)(0
.0)
(0.0
)(0
.0)
423
60
00
(82.
4)(5
.9)
(11.
8)(0
.0)
(0.0
)(0
.0)
413
60
00
(82.
0)(6
.0)
(12.
0)(0
.0)
(0.0
)(0
.0)
291
01
00
(93.
5)(3
.2)
(0.0
)(3
.2)
(0.0
)(0
.0)
Tota
l Num
ber o
f Ind
icat
ors
3/47
025
738
11
578
Perc
enta
ge81
.34.
312
.61.
40.
20.
210
0
Sou
rce:
CC
E.
1/ S
: Sup
ervi
sory
dat
a; N
: Nat
iona
l Acc
ount
s da
ta; O
: Oth
er d
ata;
S/O
: Sup
ervi
sory
and
Oth
er d
ata;
S/N
: Sup
ervi
sory
and
Nat
iona
l Acc
ount
s da
ta; N
/O: N
atio
nal A
ccou
nts
and
Oth
er d
ata.
2/ In
par
enth
esis
is th
e in
dica
tor n
umbe
r.3/
A g
iven
FS
I may
be
com
pile
d m
ore
than
onc
e by
a g
iven
cou
ntry
. Tot
al n
umbe
r of i
ndic
ator
s su
bmitt
ed b
y al
l CC
E p
artic
ipat
ing
coun
tries
that
mee
t giv
en c
riter
ia.
(num
ber o
f ind
icat
ors
and,
in p
aren
thes
is, p
erce
nt)
Net
ope
n po
sitio
n in
equ
ities
to c
apita
l (I2
5)
Spr
ead
betw
een
high
est a
nd lo
wes
t int
erba
nk ra
tes
(I21
)
Tabl
e 5.
c. D
ata
Sour
ces
by In
dica
tor:
Enc
oura
ged
FSIs
for D
epos
it Ta
kers
Cap
ital t
o as
sets
(I13
)
Larg
e ex
posu
res
to c
apita
l (I1
4)
Geo
grap
hica
l dis
tribu
tion
of lo
ans
to to
tal l
oans
(I1
5)
Cus
tom
er d
epos
its to
tota
l (no
n-in
terb
ank)
loan
s (I2
2)
Fore
ign-
curr
ency
-den
omin
ated
loan
s to
tota
l loa
ns (I
23)
Fore
ign-
curr
ency
-den
omin
ated
liab
ilitie
s to
tota
l lia
bilit
ies
(I24)
Gro
ss li
abili
ty p
ositi
on in
fina
ncia
l der
ivat
ives
to c
apita
l (I1
7)
Trad
ing
inco
me
to to
tal i
ncom
e (I1
8)
Per
sonn
el e
xpen
ses
to n
on-in
tere
st e
xpen
ses
(I19)
Spr
ead
betw
een
refe
renc
e le
ndin
g an
d de
posi
t rat
es (
I20)
N/O
Gro
ss a
sset
pos
ition
in fi
nanc
ial d
eriv
ativ
es to
cap
ital (
I16)
Tota
l 3/
D
ata
Sour
ces
1/
Indi
cato
rs 2/
S
NO
S/O
S/N
56 48 383742 51 55 41 25 53 51 50 31
57

1013
33
11
(32.
3)(4
1.9)
(9.7
)(9
.7)
(3.2
)(3
.2)
012
11
133
(0.0
)(4
0.0)
(3.3
)(3
.3)
(43.
3)(1
0.0)
Tota
l Num
ber o
f Ind
icat
ors
3/10
254
414
461
Perc
enta
ge16
.441
.06.
66.
623
.06.
610
0
Sou
rce:
CC
E.
1/ S
: Sup
ervi
sory
dat
a; N
: Nat
iona
l Acc
ount
s da
ta; O
: Oth
er d
ata;
S/O
: Sup
ervi
sory
and
Oth
er d
ata;
S/N
: Sup
ervi
sory
and
Nat
iona
l Acc
ount
s da
ta; N
/O: N
atio
nal A
ccou
nts
and
Oth
er d
ata.
2/ In
par
enth
esis
is th
e in
dica
tor n
umbe
r.3/
A g
iven
FS
I may
be
com
pile
d m
ore
than
onc
e by
a g
iven
cou
ntry
. Tot
al n
umbe
r of i
ndic
ator
s su
bmitt
ed b
y al
l CC
E p
artic
ipat
ing
coun
tries
that
mee
t giv
en c
riter
ia.
011
80
01
(0.0
)(5
5.0)
(40.
0)(0
.0)
(0.0
)(5
.0)
09
70
01
(0.0
)(5
2.9)
(41.
2)(0
.0)
(0.0
)(5
.9)
04
20
01
(0.0
)(5
7.1)
(28.
6)(0
.0)
(0.0
)(1
4.3)
00
00
01
(0.0
)(0
.0)
(0.0
)(0
.0)
(0.0
)(1
00.0
)0
013
00
0(0
.0)
(0.0
)(1
00.0
)(0
.0)
(0.0
)(0
.0)
Tota
l Num
ber o
f Ind
icat
ors
3/0
2430
00
458
Perc
enta
ge0.
041
.451
.70.
00.
06.
910
0
Sou
rce:
CC
E.
1/ S
: Sup
ervi
sory
dat
a; N
: Nat
iona
l Acc
ount
s da
ta; O
: Oth
er d
ata;
S/O
: Sup
ervi
sory
and
Oth
er d
ata;
S/N
: Sup
ervi
sory
and
Nat
iona
l Acc
ount
s da
ta; N
/O: N
atio
nal A
ccou
nts
and
Oth
er d
ata.
2/ In
par
enth
esis
is th
e in
dica
tor n
umbe
r.3/
A g
iven
FS
I may
be
com
pile
d m
ore
than
onc
e by
a g
iven
cou
ntry
. Tot
al n
umbe
r of i
ndic
ator
s su
bmitt
ed b
y al
l CC
E p
artic
ipat
ing
coun
tries
that
mee
t giv
en c
riter
ia.
Num
ber o
f app
licat
ions
for p
rote
ctio
n fro
m c
redi
tors
(I32
)13
Ear
ning
s to
inte
rest
and
prin
cipa
l exp
ense
s (I3
0)7
Net
fore
ign
exch
ange
exp
osur
e to
equ
ity (I
31)
1
Tota
l deb
t to
equi
ty (I
28)
20
Ret
urn
on e
quity
(I29
)17
S/O
S/N
N/O
Tota
l 3/
D
ata
Sour
ces
1/
Indi
cato
rs 2/
S
NO
S/O
N/O
Tabl
e 5.
e. D
ata
Sour
ces
by In
dica
tor:
Enc
oura
ged
FSIs
for N
on-F
inan
cial
Cor
pora
tions
31 30A
sset
s to
Gro
ss D
omes
tic P
rodu
ct (G
DP
) (I2
7)
(num
ber o
f ind
icat
ors
and,
in p
aren
thes
is, p
erce
nt)
(num
ber o
f ind
icat
ors
and,
in p
aren
thes
is, p
erce
nt)
Tabl
e 5.
d. D
ata
Sour
ces
by In
dica
tor:
Enc
oura
ged
FSIs
for O
ther
Fin
anci
al C
orpo
ratio
ns
Ass
ets
to to
tal f
inan
cial
sys
tem
ass
ets
(I26)
Tota
l 3/
D
ata
Sour
ces
1/
Indi
cato
rs 2/
S
S/N
ON
58

Dep
osit
Take
rs:
Cor
e S
et N
umbe
r of I
ndic
ator
s70
202
304
012
084
078
0 P
erce
ntag
e9.
025
.939
.00.
015
.410
.80.
010
0E
ncou
rage
d S
et N
umbe
r of I
ndic
ator
s60
109
256
168
6323
580
Per
cent
age
10.3
18.8
44.1
0.2
11.7
10.9
4.0
100
Enc
oura
ged
Set
for O
ther
Fin
anci
al C
orpo
ratio
ns:
Num
ber o
f Ind
icat
ors
30
460
015
064
Per
cent
age
4.7
0.0
71.9
0.0
0.0
23.4
0.0
100
Enc
oura
ged
Set
for N
on-F
inan
cial
Cor
pora
tions
: N
umbe
r of I
ndic
ator
s6
148
00
30
58 P
erce
ntag
e10
.31.
782
.80.
00.
05.
20.
010
0 T
otal
Num
ber o
f Ind
icat
ors
2/13
931
265
41
188
165
2314
82Pe
rcen
tage
9.4
21.1
44.1
0.1
12.7
11.1
1.6
100
Sou
rce:
CC
E.
1/ C
onso
lidat
ion
basi
s is
not
app
licab
le fo
r ind
icat
or I2
1 (E
ncou
rage
d FS
Is fo
r Dep
osit
Take
rs).
2/ T
otal
num
ber o
f ind
icat
ors
subm
itted
by
all C
CE
par
ticip
atin
g co
untri
es th
at m
eet g
iven
crit
eria
.
DC
D
omes
tic c
onso
lidat
ion
basi
s.
DC
CB
Dom
estic
ally
con
trolle
d, c
ross
bor
der c
onso
lidat
ion
basi
s.D
CC
BS
D
omes
tical
ly c
ontro
lled,
cro
ss b
orde
r, cr
oss
sect
or c
onso
lidat
ion
basi
s.O
THE
R
Oth
er c
onso
lidat
ion
base
s.O
THE
R re
fers
to c
onso
lidat
ion
base
s ot
her t
han
CB
CS
DI,
CB
DI,
DC
, DC
CB
, or D
CC
BS
. O
THE
R a
lso
incl
udes
the
cons
olid
atio
n ba
sis
of a
FS
I com
pile
d w
ith th
e un
derly
ing
data
cal
cula
ted
usin
g m
ore
than
on
e co
nsol
idat
ion
basi
s.
CB
DI
Cro
ss b
orde
r con
solid
atio
n ba
sis
for a
ll do
mes
tical
ly in
corp
orat
ed e
ntiti
es.
CB
CS
DI
Cro
ss b
orde
r and
cro
ss s
ecto
r con
solid
atio
n ba
sis
for a
ll do
mes
tical
ly in
corp
orat
ed e
ntiti
es.
Tabl
e 6.
a. C
onso
lidat
ion
Bas
is b
y In
dica
tor
Con
solid
atio
n B
ases
In
dica
tors
D
CC
BD
CC
BS
DC
CB
DI
CB
CSD
IO
THER
Tota
l 2/N
A 1/
59

621
170
166
(9.1
)(3
1.8)
(25.
8)(0
.0)
(24.
2)(9
.1)
621
170
166
(9.1
)(3
1.8)
(25.
8)(0
.0)
(24.
2)(9
.1)
615
250
810
(9.4
)(2
3.4)
(39.
1)(0
.0)
(12.
5)(1
5.6)
615
260
810
(9.2
)(2
3.1)
(40.
0)(0
.0)
(12.
3)(1
5.4)
48
410
25
(6.7
)(1
3.3)
(68.
3)(0
.0)
(3.3
)(8
.3)
620
240
126
(8.8
)(2
9.4)
(35.
3)(0
.0)
(17.
6)(8
.8)
620
240
126
(8.8
)(2
9.4)
(35.
3)(0
.0)
(17.
6)(8
.8)
620
240
126
(8.8
)(2
9.4)
(35.
3)(0
.0)
(17.
6)(8
.8)
620
240
126
(8.8
)(2
9.4)
(35.
3)(0
.0)
(17.
6)(8
.8)
614
300
87
(9.2
)(2
1.5)
(46.
2)(0
.0)
(12.
3)(1
0.8)
614
300
87
65(9
.2)
(21.
5)(4
6.2)
(0.0
)(1
2.3)
(10.
8)6
1422
06
9(1
0.5)
(24.
6)(3
8.6)
(0.0
)(1
0.5)
(15.
8) T
otal
Num
ber o
f Ind
icat
ors
2/70
202
304
012
084
780
Perc
enta
ge9.
025
.939
.00.
015
.410
.810
0
Sou
rce:
CC
E.
1/ In
par
enth
esis
is th
e in
dica
tor n
umbe
r.2/ A
giv
en F
SI m
ay b
e co
mpi
led
mor
e th
an o
nce
by a
giv
en c
ount
ry u
sing
diff
eren
t con
solid
atio
n ba
ses.
Tot
al n
umbe
r of i
ndic
ator
s su
bmitt
ed b
y al
l CC
E p
artic
ipat
ing
coun
tries
th
at m
eet g
iven
crit
eria
.
DC
D
omes
tic c
onso
lidat
ion
basi
s.
DC
CB
Dom
estic
ally
con
trolle
d, c
ross
bor
der c
onso
lidat
ion
basi
s.D
CC
BS
D
omes
tical
ly c
ontro
lled,
cro
ss b
orde
r, cr
oss
sect
or c
onso
lidat
ion
basi
s.O
THE
R
Oth
er c
onso
lidat
ion
base
s.
68 65 57N
et o
pen
posi
tion
in fo
reig
n ex
chan
ge to
cap
ital
(I12)
Non
-inte
rest
exp
ense
s to
gro
ss in
com
e (I9
)
Liqu
id a
sset
s to
tota
l ass
ets
(I10)
Liqu
id a
sset
s to
sho
rt-te
rm li
abili
ties
(I11)
68 68 68In
tere
st m
argi
n to
gro
ss in
com
e (I8
)
Non
-per
form
ing
loan
s to
tota
l gro
ss lo
ans
(I4)
Sec
tora
l dis
tribu
tion
of lo
ans
to to
tal l
oans
(I5)
64 65 60
Tabl
e 6.
b. C
onso
lidat
ion
Bas
is b
y In
dica
tor:
Cor
e FS
Is fo
r Dep
osit
Take
rs
Reg
ulat
ory
capi
tal t
o ris
k-w
eigh
ted
asse
ts (I
1)
Reg
ulat
ory
Tier
1 c
apita
l to
risk-
wei
ghte
d as
sets
(I2)
Non
-per
form
ing
loan
s ne
t of p
rovi
sion
s to
cap
ital
(I3)
Tota
l 2/
C
onso
lidat
ion
Bas
es
Indi
cato
rs 1/
D
CC
BC
BC
SDI
DC
DC
CB
S
OTH
ER
refe
rs to
con
solid
atio
n ba
ses
othe
r tha
n C
BC
SD
I, C
BD
I, D
C, D
CC
B, o
r DC
CB
S.
OTH
ER
al
so in
clud
es th
e co
nsol
idat
ion
basi
s of
a F
SI c
ompi
led
with
the
unde
rlyin
g da
ta c
alcu
late
d us
ing
mor
e th
an o
ne c
onso
lidat
ion
basi
s.
(num
ber o
f ind
icat
ors
and,
in p
aren
thes
is, p
erce
nt)
CB
DI
Cro
ss b
orde
r con
solid
atio
n ba
sis
for a
ll do
mes
tical
ly in
corp
orat
ed e
ntiti
es.
CB
CS
DI
Cro
ss b
orde
r and
cro
ss s
ecto
r con
solid
atio
n ba
sis
for a
ll do
mes
tical
ly in
corp
orat
ed e
ntiti
es.
CB
DI
OTH
ER
Ret
urn
on a
sset
s (I6
)
Ret
urn
on e
quity
(I7)
66 66
60

612
220
106
0(1
0.7)
(21.
4)(3
9.3)
(0.0
)(1
7.9)
(10.
7)(0
.0)
610
200
75
0(1
2.5)
(20.
8)(4
1.7)
(0.0
)(1
4.6)
(10.
4)(0
.0)
48
201
36
0(9
.5)
(19.
0)(4
7.6)
(2.4
)(7
.1)
(14.
3)(0
.0)
511
150
54
0(1
2.5)
(27.
5)(3
7.5)
(0.0
)(1
2.5)
(10.
0)(0
.0)
511
150
54
0(1
2.5)
(27.
5)(3
7.5)
(0.0
)(1
2.5)
(10.
0)(0
.0)
513
170
97
0(9
.8)
(25.
5)(3
3.3)
(0.0
)(1
7.6)
(13.
7)(0
.0)
612
200
107
0(1
0.9)
(21.
8)(3
6.4)
(0.0
)(1
8.2)
(12.
7)(0
.0)
14
320
03
0(2
.5)
(10.
0)(8
0.0)
(0.0
)(0
.0)
(7.5
)(0
.0)
00
00
023
(0.0
)(0
.0)
(0.0
)(0
.0)
(0.0
)(0
.0)
(100
.0)
68
250
86
0(1
1.3)
(15.
1)(4
7.2)
(0.0
)(1
5.1)
(11.
3)(0
.0)
66
290
46
0(1
1.8)
(11.
8)(5
6.9)
(0.0
)(7
.8)
(11.
8)(0
.0)
66
290
36
0(1
2.0)
(12.
0)(5
8.0)
(0.0
)(6
.0)
(12.
0)(0
.0)
48
120
43
0(1
2.9)
(25.
8)(3
8.7)
(0.0
)(1
2.9)
(9.7
)(0
.0)
Tot
al N
umbe
r of I
ndic
ator
s 3/
6010
925
61
6863
2358
0Pe
rcen
tage
10.3
18.8
44.1
0.2
11.7
10.9
4.0
100
Sou
rce:
CC
E.
1/ In
par
enth
esis
is th
e in
dica
tor n
umbe
r.2/
Con
solid
atio
n B
asis
for i
ndic
ator
I21
is n
ot a
pplic
able
(NA
).3/
A g
iven
FS
I may
be
com
pile
d m
ore
than
onc
e by
a g
iven
cou
ntry
. Tot
al n
umbe
r of i
ndic
ator
s su
bmitt
ed b
y al
l CC
E p
artic
ipat
ing
coun
tries
that
mee
t giv
en c
riter
ia.
DC
D
omes
tic c
onso
lidat
ion
basi
s.
DC
CB
Dom
estic
ally
con
trolle
d, c
ross
bor
der c
onso
lidat
ion
basi
s.D
CC
BS
D
omes
tical
ly c
ontro
lled,
cro
ss b
orde
r, cr
oss
sect
or c
onso
lidat
ion
basi
s.O
THE
R
Oth
er c
onso
lidat
ion
base
s.
(num
ber o
f ind
icat
ors
and,
in p
aren
thes
is, p
erce
nt)
OTH
ER
refe
rs to
con
solid
atio
n ba
ses
othe
r tha
n C
BC
SD
I, C
BD
I, D
C, D
CC
B, o
r DC
CB
S.
OTH
ER
als
o in
clud
es
the
cons
olid
atio
n ba
sis
of a
FS
I com
pile
d w
ith th
e un
derly
ing
data
cal
cula
ted
usin
g m
ore
than
one
con
solid
atio
n ba
sis.
31
CB
DI
Cro
ss b
orde
r con
solid
atio
n ba
sis
for a
ll do
mes
tical
ly in
corp
orat
ed e
ntiti
es.
CB
CS
DI
Cro
ss b
orde
r and
cro
ss s
ecto
r con
solid
atio
n ba
sis
for a
ll do
mes
tical
ly in
corp
orat
ed e
ntiti
es.
23 53 51 50
Net
ope
n po
sitio
n in
equ
ities
to c
apita
l (I2
5)
Spr
ead
betw
een
high
est a
nd lo
wes
t int
erba
nk ra
tes
(I21
)
Cus
tom
er d
epos
its to
tota
l (no
n-in
terb
ank)
loan
s (I2
2)
40 51 55 4056 48 42 40
NA
2/
Gro
ss a
sset
pos
ition
in fi
nanc
ial d
eriv
ativ
es to
cap
ital (
I16)
Tota
l 3/
Con
solid
atio
n B
ases
In
dica
tors
1/
DC
CB
CB
DI
DC
CB
SD
CC
BC
SDI
OTH
ER
Fore
ign-
curr
ency
-den
omin
ated
loan
s to
tota
l loa
ns (I
23)
Fore
ign-
curr
ency
-den
omin
ated
liab
ilitie
s to
tota
l lia
bilit
ies
(I24)
Gro
ss li
abili
ty p
ositi
on in
fina
ncia
l der
ivat
ives
to c
apita
l (I1
7)
Tabl
e 6.
c. C
onso
lidat
ion
Bas
is b
y In
dica
tor:
Enc
oura
ged
FSIs
for D
epos
it Ta
kers
Cap
ital t
o as
sets
(I13
)
Larg
e ex
posu
res
to c
apita
l (I1
4)
Geo
grap
hica
l dis
tribu
tion
of lo
ans
to to
tal l
oans
(I1
5)
Trad
ing
inco
me
to to
tal i
ncom
e (I1
8)
Per
sonn
el e
xpen
ses
to n
on-in
tere
st e
xpen
ses
(I19)
Spr
ead
betw
een
refe
renc
e le
ndin
g an
d de
posi
t rat
es (
I20)
61

00
222
08
(0.0
)(0
.0)
(68.
8)(6
.3)
(0.0
)(2
5.0)
00
241
07
(0.0
)(0
.0)
(75.
0)(3
.1)
(0.0
)(2
1.9)
Tota
l Num
ber o
f Ind
icat
ors
2/0
046
30
1564
Perc
enta
ge0.
00.
071
.94.
70.
023
.410
0
Sou
rce:
CC
E.
1/ In
par
enth
esis
is th
e in
dica
tor n
umbe
r.2/ A
giv
en F
SI m
ay b
e co
mpi
led
mor
e th
an o
nce
by a
giv
en c
ount
ry u
sing
diff
eren
t con
solid
atio
n ba
ses.
Tot
al n
umbe
r of i
ndic
ator
s su
bmitt
ed b
y al
l CC
E p
artic
ipat
ing
coun
tries
th
at m
eet g
iven
crit
eria
.
00
182
00
(0.0
)(0
.0)
(90.
0)(1
0.0)
(0.0
)(0
.0)
00
142
01
(0.0
)(0
.0)
(82.
4)(1
1.8)
(0.0
)(5
.9)
00
61
00
(0.0
)(0
.0)
(85.
7)(1
4.3)
(0.0
)(0
.0)
00
00
01
(0.0
)(0
.0)
(0.0
)(0
.0)
(0.0
)(1
00.0
)1
010
10
1(7
.7)
(0.0
)(7
6.9)
(7.7
)(0
.0)
(7.7
)To
tal N
umbe
r of I
ndic
ator
s 2/
10
486
03
58Pe
rcen
tage
1.7
0.0
82.8
10.3
0.0
5.2
100
Sou
rce:
CC
E.
1/ In
par
enth
esis
is th
e in
dica
tor n
umbe
r.2/ A
giv
en F
SI m
ay b
e co
mpi
led
mor
e th
an o
nce
by a
giv
en c
ount
ry u
sing
diff
eren
t con
solid
atio
n ba
ses.
Tot
al n
umbe
r of i
ndic
ator
s su
bmitt
ed b
y al
l CC
E p
artic
ipat
ing
coun
tries
th
at m
eet g
iven
crit
eria
.
DC
D
omes
tic c
onso
lidat
ion
basi
s.
DC
CB
Dom
estic
ally
con
trolle
d, c
ross
bor
der c
onso
lidat
ion
basi
s.D
CC
BS
D
omes
tical
ly c
ontro
lled,
cro
ss b
orde
r, cr
oss
sect
or c
onso
lidat
ion
basi
s.O
THE
R
Oth
er c
onso
lidat
ion
base
s.
Tabl
e 6.
d. C
onso
lidat
ion
Bas
is b
y In
dica
tor:
Enc
oura
ged
FSIs
for O
ther
Fin
anci
al C
orpo
ratio
ns
Ass
ets
to to
tal f
inan
cial
sys
tem
ass
ets
(I26)
Tota
l 2/
Con
solid
atio
n B
ases
In
dica
tors
1/
DC
CB
SD
CC
BD
CC
BD
IO
THER
CB
CSD
I
Tabl
e 6.
e. C
onso
lidat
ion
Bas
is b
y In
dica
tor:
Enc
oura
ged
FSIs
for N
on-F
inan
cial
Cor
pora
tions
32 32A
sset
s to
Gro
ss D
omes
tic P
rodu
ct (G
DP
) (I2
7)
CB
DI
OTH
ERTo
tal 2/
C
onso
lidat
ion
Bas
es
Indi
cato
rs 1/
D
CC
BS
DC
DC
CB
CB
CSD
I
1
Tota
l deb
t to
equi
ty (I
28)
20
Ret
urn
on e
quity
(I29
)17
(num
ber o
f ind
icat
ors
and,
in p
aren
thes
is, p
erce
nt)
(num
ber o
f ind
icat
ors
and,
in p
aren
thes
is, p
erce
nt)
OTH
ER
refe
rs to
con
solid
atio
n ba
ses
othe
r tha
n C
BC
SD
I, C
BD
I, D
C, D
CC
B, o
r DC
CB
S.
OTH
ER
als
o in
clud
es th
e co
nsol
idat
ion
basi
s of
a F
SI c
ompi
led
with
the
unde
rlyin
g da
ta c
alcu
late
d us
ing
mor
e th
an o
ne c
onso
lidat
ion
basi
s.
Num
ber o
f app
licat
ions
for p
rote
ctio
n fro
m c
redi
tors
(I32
)13
CB
DI
Cro
ss b
orde
r con
solid
atio
n ba
sis
for a
ll do
mes
tical
ly in
corp
orat
ed e
ntiti
es.
CB
CS
DI
Cro
ss b
orde
r and
cro
ss s
ecto
r con
solid
atio
n ba
sis
for a
ll do
mes
tical
ly in
corp
orat
ed e
ntiti
es.
Ear
ning
s to
inte
rest
and
prin
cipa
l exp
ense
s (I3
0)7
Net
fore
ign
exch
ange
exp
osur
e to
equ
ity (I
31)
62

26 26 25(45.6) (54.2) (43.9)
2 2 2(3.5) (4.2) (3.5)12 14 12
(21.1) (29.2) (21.1)8 5 8
(14.0) (10.4) (14.0)1 2 0
(1.8) (4.2) (0.0)3 3 3
(5.3) (6.3) (5.3)20 14 21
(35.1) (29.2) (36.8)DC / DCCBS 1 2 1DCCBS / DC 4 2 4DC / CBCSDI 1 1 1CBCSDI / DC 5 4 5DC / DCCB 2 - 2DCCB / DC - 1 - DCCBS / OTHER 1 - - DCCB / DC / CBCSDI 1 - 1CBCSDI / DC / OTHER 2 - 2DCCBS / DC / OTHER 1 1 3CBCSDI / DC / CBDI - 1 1OTHER / DC 2 2 1
11 8 11(19.3) (16.7) (19.3)
DCCB + DC 1 2 1DCCB + DC/CBCSDI 1 - 1DC + CBCSDI 2 1 2DC + DCCB/DCCBS 1 1 1DCCBS + DC 3 2 3DCCBS + CBCSDI 1 - 1DCCBS + OTHER 1 1 1DCCBS/OTHER + CBCSDI/OTHER 4/ 1 1 1
Number of Countries Submission 57 48 57Percentage 5/ 100 100 100
Source: CCE.1/ "Set of indicators" does not necessarily mean that all indicators are compiled.2/ A given FSI is compiled on one consolidation basis. However, within the set of indicators, more than one consolidation basis are used.3/ A given FSI is compiled with two different consolidation bases (the first one is predominant), unless otherwise indicated.4/ A given FSI is compiled with two different consolidation bases. However, within the sets of indicators, some indicators are compiled using Other consolidation basis.5/ Percentage is the ratio of the number of countries using a certain type of consolidation basis to the number of country submissions.
DCCB Domestically controlled, cross border consolidation basisDCCBS Domestically controlled, cross border, cross sector consolidation basisOTHER Other consolidation bases
OTHER refer to the consolidation bases of a FSI compiled on a basis other than CBCSDI, CBDI, DC, DCCB, or DCCBS. OTHER also include the consolidation basis of a FSI compiled with the underlying data calculated on different consolidation bases.
Indicators Consolidation Bases
CBDI Cross border consolidation basis for all domestically incorporated entities
Two Sets of indicators with Different Consolidation Bases 1/ 3/
One Set of indicators with one Consolidation Basis 1/
One Set of indicators with Mix of Consolidation Bases 1/ 2/
DCCBS
CBCSDI
OTHER
CBCSDI Cross border and cross sector consolidation basis for all domestically incorporated entities
(number of indicators and, in parenthesis, percent)
DC Domestic consolidation basis
Table 7. FSIs for Deposit Takers: Consolidation Bases Used by Countries in the CCE
Core FSIs
DCCB
DC
Encouraged FSIs Core + Encouraged
63

Full
Intr
a Fu
ll In
tra
Part
ial I
ntra
Pa
rtia
l Int
ra
No
Intr
a Pa
rtia
l Int
erN
o In
ter
Part
ial I
nter
No
Inte
rN
o In
ter
Cor
e S
et:
Num
ber o
f Cou
ntrie
s1
215
254
157
Per
cent
age
1.8
36.8
8.8
43.9
7.0
1.8
100
Enc
oura
ged
Set
:N
umbe
r of C
ount
ries
15
199
95
48P
erce
ntag
e2.
110
.439
.618
.818
.810
.410
0
Sou
rce:
CC
E.
1/ In
tra-g
roup
con
solid
atio
n ad
just
men
ts (
intra
) inv
olve
con
solid
atio
n of
all
flow
s an
d po
sitio
ns a
mon
g un
its w
ithin
eac
h gr
oup
in th
e po
pula
tion.
In
ter-
grou
p co
nsol
idat
ion
adju
stm
ents
(int
er) i
nvol
ve th
e el
imin
atio
n of
som
e (b
ut n
ot a
ll) fl
ows
and
posi
tions
am
ong
grou
ps.
2/ F
ull d
enot
es th
at a
ll of
the
requ
ired
adju
stm
ents
are
mad
e. P
artia
l adj
ustm
ents
den
ote
eith
er p
artia
l adj
ustm
ents
are
mad
e to
bot
h un
derly
ing
data
ser
ies
of a
ratio
or a
djus
tmen
ts a
re m
ade
only
to
on
e un
derly
ing
data
ser
ies
in a
ratio
.
FC
Ful
l Con
solid
atio
n
(all
the
requ
ired
intra
-gro
up a
nd in
ter-
grou
p ad
just
men
ts a
re c
arrie
d ou
t)LF
C
Less
than
Ful
l Con
solid
atio
n
Tota
l
Tabl
e 8.
a. F
SIs
for D
epos
it Ta
kers
: Con
solid
atio
n A
djus
tmen
ts C
arrie
d O
ut b
y C
ount
ries
in th
e C
CE
Con
solid
atio
n A
djus
tmen
t 1/
Indi
cato
rs
LFC
2/
FC
64

Tabl
e 8.
b. F
SIs
for D
epos
it Ta
kers
: Con
solid
atio
n A
djus
tmen
ts b
y In
dica
tor (
Cor
e FS
Is)
(num
ber o
f ind
icat
ors
and,
in p
aren
thes
is, p
erce
nt)
Full
Intr
a Fu
ll In
tra
Part
ial I
ntra
Pa
rtia
l Int
ra
Part
ial I
ntra
N
o In
tra
N
o In
tra
Part
ial I
nter
No
Inte
rFu
ll In
ter
Part
ial I
nter
No
Inte
rPa
rtia
l Int
erN
o In
ter
1337
92
21
02
00
0(1
9.7)
(56.
1)(1
3.6)
(3.0
)(3
.0)
(1.5
)(0
.0)
(3.0
)(0
.0)
(0.0
)(0
.0)
1232
151
13
11
00
0(1
8.2)
(48.
5)(2
2.7)
(1.5
)(1
.5)
(4.5
)(1
.5)
(1.5
)(0
.0)
(0.0
)(0
.0)
712
231
79
32
00
0(1
0.9)
(18.
8)(3
5.9)
(1.6
)(1
0.9)
(14.
1)(4
.7)
(3.1
)(0
.0)
(0.0
)(0
.0)
00
00
00
00
425
18(0
.0)
(0.0
)(0
.0)
(0.0
)(0
.0)
(0.0
)(0
.0)
(0.0
)(6
4.6)
(7.7
)(2
7.7)
00
00
00
00
353
22(0
.0)
(0.0
)(0
.0)
(0.0
)(0
.0)
(0.0
)(0
.0)
(0.0
)(5
8.3)
(5.0
)(3
6.7)
54
400
44
011
00
0(7
.4)
(5.9
)(5
8.8)
(0.0
)(5
.9)
(5.9
)(0
.0)
(16.
2)(0
.0)
(0.0
)(0
.0)
311
350
512
02
00
0(4
.4)
(16.
2)(5
1.5)
(0.0
)(7
.4)
(17.
6)(0
.0)
(2.9
)(0
.0)
(0.0
)(0
.0)
56
380
214
03
00
0(7
.4)
(8.8
)(5
5.9)
(0.0
)(2
.9)
(20.
6)(0
.0)
(4.4
)(0
.0)
(0.0
)(0
.0)
55
390
213
04
00
0(7
.4)
(7.4
)(5
7.4)
(0.0
)(2
.9)
(19.
1)(0
.0)
(5.9
)(0
.0)
(0.0
)(0
.0)
1111
192
811
03
00
0(1
6.9)
(16.
9)(2
9.2)
(3.1
)(1
2.3)
(16.
9)(0
.0)
(4.6
)(0
.0)
(0.0
)(0
.0)
00
00
00
00
439
13(0
.0)
(0.0
)(0
.0)
(0.0
)(0
.0)
(0.0
)(0
.0)
(0.0
)(6
6.2)
(13.
8)(2
0.0)
822
81
101
52
00
0(1
4.0)
(38.
6)(1
4.0)
(1.8
)(1
7.5)
(1.8
)(8
.8)
(3.5
)(0
.0)
(0.0
)(0
.0)
Tota
l Num
ber o
f Ind
icat
ors
5/69
140
226
741
689
3012
017
5378
0 P
erce
nta g
e8.
817
.929
.00.
95.
38.
71.
23.
815
.42.
26.
810
0S
ourc
e: C
CE
.1/ In
tra-g
roup
con
solid
atio
n ad
just
men
ts (
intra
) inv
olve
con
solid
atio
n of
all
flow
s an
d po
sitio
ns a
mon
g un
its w
ithin
eac
h gr
oup
in th
e po
pula
tion.
In
ter-
grou
p co
nsol
idat
ion
adju
stm
ents
(int
er) i
nvol
ve th
e el
imin
atio
n of
som
e (b
ut n
ot a
ll) fl
ows
and
posi
tions
am
ong
grou
ps.
2/ In
par
enth
esis
is th
e in
dica
tor n
umbe
r.3/ F
ull d
enot
es th
at a
ll of
the
requ
ired
adju
stm
ents
are
mad
e. P
artia
l adj
ustm
ents
den
ote
eith
er p
artia
l adj
ustm
ents
are
mad
e to
bot
h un
derly
ing
data
ser
ies
of a
ratio
or a
djus
tmen
ts a
re m
ade
only
to o
ne
un
derly
ing
data
ser
ies
in a
ratio
.4/ In
ter-
grou
p ad
just
men
ts fo
r sel
ecte
d in
dica
tors
(I4,
I5, a
nd I1
1) a
re n
ot a
pplic
able
(NA
).5/ A
giv
en F
SI m
ay b
e co
mpi
led
mor
e th
an o
nce
by a
giv
en c
ount
ry. T
otal
num
ber o
f ind
icat
ors
subm
itted
by
all C
CE
par
ticip
atin
g co
untri
es th
at m
eet g
iven
crit
eria
.
FC
Ful
l Con
solid
atio
n
(all
the
requ
ired
intra
-gro
up a
nd in
ter-
grou
p ad
just
men
ts a
re c
arrie
d ou
t)LF
C
Less
than
Ful
l Con
solid
atio
n
Net
ope
n po
sitio
n in
fore
ign
exch
ange
to c
apita
l (I1
2)
Liqu
id a
sset
s to
sho
rt-te
rm li
abili
ties
(I11)
Liqu
id a
sset
s to
tota
l ass
ets
(I10)
68
Non
-inte
rest
exp
ense
s to
gro
ss in
com
e (I9
)68 65 65 57
Inte
rest
mar
gin
to g
ross
inco
me
(I8)
66 66 64 65 60 68 68
Reg
ulat
ory
capi
tal t
o ris
k-w
eigh
ted
asse
ts (I
1)
Reg
ulat
ory
Tier
1 c
apita
l to
risk-
wei
ghte
d as
sets
(I2)
Non
-per
form
ing
loan
s ne
t of p
rovi
sion
s to
cap
ital
(I3)
Non
-per
form
ing
loan
s to
tota
l gro
ss lo
ans
(I4)
Sec
tora
l dis
tribu
tion
of lo
ans
to to
tal l
oans
(I5)
Ret
urn
on a
sset
s (I6
)
Ret
urn
on e
quity
(I7)
Con
solid
atio
n A
djus
tmen
t 1/
Indi
cato
rs 2/
FCLF
C 3/
Tota
l 5/N
A In
ter 4/
Full
Intr
aPa
rtia
l Int
raN
o In
tra
65

Tabl
e 8.
c. F
SIs
for D
epos
it Ta
kers
: C
onso
lidat
ion
Adj
ustm
ents
by
Indi
cato
r (En
cour
aged
FSI
s)(n
umbe
r of i
ndic
ator
s an
d, in
par
enth
esis
, per
cent
)
Full
Intr
a Fu
ll In
tra
Part
ial
Part
ial
Part
ial
No
Intr
a
No
Part
ial
Inte
rN
o In
ter
Full
Inte
rPa
rtia
l In
ter
No
Inte
rPa
rtia
l In
ter
No
Inte
rFu
ll In
tra
Part
ial I
ntra
N
o In
tra
614
212
33
07
00
00
(10.
7)(2
5.0)
(37.
5)(3
.6)
(5.4
)(5
.4)
(0.0
)(1
2.5)
(0.0
)(0
.0)
(0.0
)(0
.0)
613
42
10
01
161
40
(12.
5)(2
7.1)
(8.3
)(4
.2)
(2.1
)(0
.0)
(0.0
)(2
.1)
(33.
3)(2
.1)
(8.3
)(0
.0)
00
00
00
00
263
130
(0.0
)(0
.0)
(0.0
)(0
.0)
(0.0
)(0
.0)
(0.0
)(0
.0)
(61.
9)(7
.1)
(31.
0)(0
.0)
515
91
10
72
00
00
(12.
5)(3
7.5)
(22.
5)(2
.5)
(2.5
)(0
.0)
(17.
5)(5
.0)
(0.0
)(0
.0)
(0.0
)(0
.0)
518
51
30
62
00
00
(12.
5)(4
5.0)
(12.
5)(2
.5)
(7.5
)(0
.0)
(15.
0)(5
.0)
(0.0
)(0
.0)
(0.0
)(0
.0)
54
260
25
09
00
00
(9.8
)(7
.8)
(51.
0)(0
.0)
(3.9
)(9
.8)
(0.0
)(1
7.6)
(0.0
)(0
.0)
(0.0
)(0
.0)
515
190
62
35
00
00
(9.1
)(2
7.3)
(34.
5)(0
.0)
(10.
9)(3
.6)
(5.5
)(9
.1)
(0.0
)(0
.0)
(0.0
)(0
.0)
00
00
00
00
261
130
(0.0
)(0
.0)
(0.0
)(0
.0)
(0.0
)(0
.0)
(0.0
)(0
.0)
(65.
0)(2
.5)
(32.
5)(0
.0)
00
00
00
00
00
023
(0.0
)(0
.0)
(0.0
)(0
.0)
(0.0
)(0
.0)
(0.0
)(0
.0)
(0.0
)(0
.0)
(0.0
)(1
00.0
)0
00
00
00
037
313
0(0
.0)
(0.0
)(0
.0)
(0.0
)(0
.0)
(0.0
)(0
.0)
(0.0
)(6
9.8)
(5.7
)(2
4.5)
(0.0
)0
00
00
00
032
316
0(0
.0)
(0.0
)(0
.0)
(0.0
)(0
.0)
(0.0
)(0
.0)
(0.0
)(6
2.7)
(5.9
)(3
1.4)
(0.0
)0
00
00
00
030
515
0(0
.0)
(0.0
)(0
.0)
(0.0
)(0
.0)
(0.0
)(0
.0)
(0.0
)(6
0.0)
(10.
0)(3
0.0)
(0.0
)4
128
01
10
50
00
0(1
2.9)
(38.
7)(2
5.8)
(0.0
)(3
.2)
(3.2
)(0
.0)
(16.
1)(0
.0)
(0.0
)(0
.0)
(0.0
)To
tal N
umbe
r of I
ndic
ator
s 6/
3691
926
1711
1631
167
1674
2358
0Pe
rcen
tage
6.2
15.7
15.9
1.0
2.9
1.9
2.8
5.3
28.8
2.8
12.8
4.0
100
Sou
rce:
CC
E.
1/ In
tra-g
roup
con
solid
atio
n ad
just
men
ts (
intra
) inv
olve
con
solid
atio
n of
all
flow
s an
d po
sitio
ns a
mon
g un
its w
ithin
eac
h gr
oup
in th
e po
pula
tion.
In
ter-
grou
p co
nsol
idat
ion
adju
stm
ents
(int
er) i
nvol
ve th
e el
imin
atio
n of
som
e (b
ut n
ot a
ll) fl
ows
and
posi
tions
am
ong
grou
ps.
2/ In
par
enth
esis
is th
e in
dica
tor n
umbe
r.3/ F
ull d
enot
es th
at a
ll of
the
requ
ired
adju
stm
ents
are
mad
e. P
artia
l adj
ustm
ents
den
ote
eith
er p
artia
l adj
ustm
ents
are
mad
e to
bot
h un
derly
ing
data
ser
ies
of a
ratio
or a
djus
tmen
ts a
re m
ade
only
to o
ne
un
derly
ing
data
ser
ies
in a
ratio
.4/ In
ter-
grou
p ad
just
men
ts fo
r sel
ecte
d in
dica
tors
(I15
, I20
, I22
, I23
, and
I24)
are
not a
pplic
able
(NA
).5/ In
tra-g
roup
and
Inte
r-gr
oup
adju
stm
ents
for i
ndic
ator
I21
are
not a
pplic
able
(NA
).6/ A
giv
en F
SI m
ay b
e co
mpi
led
mor
e th
an o
nce
by a
giv
en c
ount
ry. T
otal
num
ber o
f ind
icat
ors
subm
itted
by
all C
CE
par
ticip
atin
g co
untri
es th
at m
eet g
iven
crit
eria
.
FC
Ful
l Con
solid
atio
n
(all
the
requ
ired
intra
-gro
up a
nd in
ter-
grou
p ad
just
men
ts a
re c
arrie
d ou
t)LF
C
Less
than
Ful
l Con
solid
atio
n
56
NA
Inte
r 4/
NA
5/
Con
solid
atio
n A
djus
tmen
t 1/
Indi
cato
rs 2/
FC
LFC
3/
Tota
l 6/
40404248
Net
ope
n po
sitio
n in
equ
ities
to c
apita
l (I2
5)
Fore
ign-
curr
ency
-den
omin
ated
liab
ilitie
s to
tota
l lia
bilit
ies
(I24)
5551Tr
adin
g in
com
e to
tota
l inc
ome
(I18)
Gro
ss li
abili
ty p
ositi
on in
fina
ncia
l der
ivat
ives
to
capi
tal (
I17)
Gro
ss a
sset
pos
ition
in fi
nanc
ial d
eriv
ativ
es to
ca
pita
l (I1
6)
Fore
ign-
curr
ency
-den
omin
ated
loan
s to
tota
l lo
ans
(I23)
Cus
tom
er d
epos
its to
tota
l (no
nint
erba
nk) l
oans
(I2
2)
Spr
ead
betw
een
high
est a
nd lo
wes
t int
erba
nk
rate
s (I
21)
Spr
ead
betw
een
refe
renc
e le
ndin
g an
d de
posi
t ra
tes
(I20
)
Geo
grap
hica
l dis
tribu
tion
of lo
ans
to to
tal l
oans
(I1
5)
Larg
e ex
posu
res
to c
apita
l (I1
4)
Cap
ital t
o as
sets
(I13
)
315051532340
Per
sonn
el e
xpen
ses
to n
onin
tere
st e
xpen
ses
(I19)
66

Part
ial I
nter
No
Inte
r15
3912
0(2
2.7)
(59.
1)(1
8.2)
(0.0
)13
3419
0(1
9.7)
(51.
5)(2
8.8)
(0.0
)8
2234
0(1
2.5)
(34.
4)(5
3.1)
(0.0
)0
00
65(0
.0)
(0.0
)(0
.0)
(100
.0)
00
060
(0.0
)(0
.0)
(0.0
)(1
00.0
)5
855
0(7
.4)
(11.
8)(8
0.9)
(0.0
)3
1649
0(4
.4)
(23.
5)(7
2.1)
(0.0
)5
855
0(7
.4)
(11.
8)(8
0.9)
(0.0
)5
756
0(7
.4)
(10.
3)(8
2.4)
(0.0
)13
1933
0(2
0.0)
(29.
2)(5
0.8)
(0.0
)0
00
65(0
.0)
(0.0
)(0
.0)
(100
.0)
937
110
(15.
8)(6
4.9)
(19.
3)(0
.0)
Tota
l Num
ber o
f Ind
icat
ors
5/76
190
324
190
780
Perc
enta
ge9.
724
.441
.524
.410
0
Sou
rce:
CC
E.
1/ I
nter
-gro
up c
onso
lidat
ion
adju
stm
ents
(int
er) i
nvol
ve th
e el
imin
atio
n of
som
e (b
ut n
ot a
ll) fl
ows
and
posi
tions
am
ong
grou
ps.
2/ In
par
enth
esis
is th
e in
dica
tor n
umbe
r.3/
Par
tial a
djus
tmen
ts d
enot
e ei
ther
par
tial a
djus
tmen
ts a
re m
ade
to b
oth
unde
rlyin
g da
ta s
erie
s of
a ra
tio o
r adj
ustm
ents
are
mad
e on
ly to
one
und
erly
ing
data
ser
ies
in a
ratio
.4)
Inte
r-gr
oup
adju
stm
ents
for s
elec
ted
indi
cato
rs (I
4, I5
, and
I11)
are
not
app
licab
le (N
A).
5/ A
giv
en F
SI m
ay b
e co
mpi
led
mor
e th
an o
nce
by a
giv
en c
ount
ry. T
otal
num
ber o
f ind
icat
ors
subm
itted
by
all C
CE
par
ticip
atin
g co
untri
es th
at m
eet g
iven
crit
eria
.
FC
Ful
l Con
solid
atio
n
(all
the
requ
ired
intra
-gro
up a
nd in
ter-
grou
p ad
just
men
ts a
re c
arrie
d ou
t)LF
C
Less
than
Ful
l Con
solid
atio
n
LFC
3/N
A In
ter 4/
Tabl
e 8.
d. F
SIs
for D
epos
it Ta
kers
: Int
er-G
roup
Con
solid
atio
n A
djus
tmen
ts b
y In
dica
tor (
Cor
e FS
Is)
C
onso
lidat
ion
Adj
ustm
ent 1/
Indi
cato
rs 2/
FCTo
tal 5/
(num
ber o
f ind
icat
ors
and,
in p
aren
thes
is, p
erce
nt)
Reg
ulat
ory
capi
tal t
o ris
k-w
eigh
ted
asse
ts (I
1)
Reg
ulat
ory
Tier
1 c
apita
l to
risk-
wei
ghte
d as
sets
(I2)
Non
perfo
rmin
g lo
ans
net o
f pro
visi
ons
to c
apita
l (I3
)
Non
perfo
rmin
g lo
ans
to to
tal g
ross
loan
s (I4
)
Sec
tora
l dis
tribu
tion
of lo
ans
to to
tal l
oans
(I5)
Ret
urn
on a
sset
s (I6
)
Ret
urn
on e
quity
(I7)
Inte
rest
mar
gin
to g
ross
inco
me
(I8)
60 68 68 6866 66 64 65 65 65 57
Non
inte
rest
exp
ense
s to
gro
ss in
com
e (I9
)68
Net
ope
n po
sitio
n in
fore
ign
exch
ange
to c
apita
l (I1
2)
Liqu
id a
sset
s to
sho
rt-te
rm li
abili
ties
(I11)
Liqu
id a
sset
s to
tota
l ass
ets
(I10)
67

Part
ial I
nter
No
Inte
r8
1731
0(1
4.3)
(30.
4)(5
5.4)
(0.0
)8
145
21(1
6.7)
(29.
2)(1
0.4)
(43.
8)0
00
42(0
.0)
(0.0
)(0
.0)
(100
.0)
623
110
(15.
0)(5
7.5)
(27.
5)(0
.0)
627
70
(15.
0)(6
7.5)
(17.
5)(0
.0)
56
400
(9.8
)(1
1.8)
(78.
4)(0
.0)
524
260
(9.1
)(4
3.6)
(47.
3)(0
.0)
00
040
(0.0
)(0
.0)
(0.0
)(1
00.0
)0
00
23(0
.0)
(0.0
)(0
.0)
(100
.0)
00
053
(0.0
)(0
.0)
(0.0
)(1
00.0
)0
00
51(0
.0)
(0.0
)(0
.0)
(100
.0)
00
050
(0.0
)(0
.0)
(0.0
)(1
00.0
)4
1314
0(1
2.9)
(41.
9)(4
5.2)
(0.0
)To
tal N
umbe
r of I
ndic
ator
s 5/
4212
413
428
058
0Pe
rcen
tage
7.2
21.4
23.1
48.3
100
Sou
rce:
CC
E.
1/ I
nter
-gro
up c
onso
lidat
ion
adju
stm
ents
(int
er) i
nvol
ve th
e el
imin
atio
n of
som
e (b
ut n
ot a
ll) fl
ows
and
posi
tions
am
ong
grou
ps.
2/ In
par
enth
esis
is th
e in
dica
tor n
umbe
r.3/
Par
tial a
djus
tmen
ts d
enot
e ei
ther
par
tial a
djus
tmen
ts a
re m
ade
to b
oth
unde
rlyin
g da
ta s
erie
s of
a ra
tio o
r adj
ustm
ents
are
mad
e on
ly to
one
und
erly
ing
data
ser
ies
in a
ratio
.4/
Inte
r-gr
oup
adju
stm
ents
for s
elec
ted
indi
cato
rs (I
15, I
20, I
21, I
22, I
23, a
nd I2
4) a
re n
ot a
pplic
able
(NA
).5/
A g
iven
FS
I may
be
com
pile
d m
ore
than
onc
e by
a g
iven
cou
ntry
. Tot
al n
umbe
r of i
ndic
ator
s su
bmitt
ed b
y al
l CC
E p
artic
ipat
ing
coun
tries
that
mee
t giv
en c
riter
ia.
FC
Ful
l Con
solid
atio
n
(all
the
requ
ired
intra
-gro
up a
nd in
ter-
grou
p ad
just
men
ts a
re c
arrie
d ou
t)LF
C
Less
than
Ful
l Con
solid
atio
n
56
Tabl
e 8.
e. F
SIs
for D
epos
it Ta
kers
: Int
er-G
roup
Con
solid
atio
n A
djus
tmen
ts b
y In
dica
tor (
Enco
urag
ed F
SIs)
Con
solid
atio
n A
djus
tmen
t 1/
Indi
cato
rs 2/
FCTo
tal 5/
NA
Inte
r 4/LF
C 3/
(num
ber o
f ind
icat
ors
and,
in p
aren
thes
is, p
erce
nt)
40404248
Net
ope
n po
sitio
n in
equ
ities
to c
apita
l (I2
5)
Fore
ign-
curr
ency
-den
omin
ated
liab
ilitie
s to
tota
l lia
bilit
ies
(I24)
55
Trad
ing
inco
me
to to
tal i
ncom
e (I1
8)51
Gro
ss li
abili
ty p
ositi
on in
fina
ncia
l der
ivat
ives
to c
apita
l (I1
7)
Gro
ss a
sset
pos
ition
in fi
nanc
ial d
eriv
ativ
es to
cap
ital (
I16)
Fore
ign-
curr
ency
-den
omin
ated
loan
s to
tota
l loa
ns (I
23)
Cus
tom
er d
epos
its to
tota
l (no
nint
erba
nk) l
oans
(I22
)
Spr
ead
betw
een
high
est a
nd lo
wes
t int
erba
nk ra
tes
(I21
)
Spr
ead
betw
een
refe
renc
e le
ndin
g an
d de
posi
t rat
es (
I20)
Geo
grap
hica
l dis
tribu
tion
of lo
ans
to to
tal l
oans
(I1
5)
Larg
e ex
posu
res
to c
apita
l (I1
4)
Cap
ital t
o as
sets
(I13
)
315051532340
Per
sonn
el e
xpen
ses
to n
onin
tere
st e
xpen
ses
(I19)
68

Inte
r-gr
oup
Con
solid
atio
n A
djus
tmen
ts 1/
Num
ber o
f C
ount
ries
Perc
enta
ge
Adj
ustm
ents
in th
e In
com
e S
tate
men
t:
Pro
visi
ons
for a
ccru
ed in
tere
st o
n no
n-pe
rform
ing
loan
s (a
nd o
ther
cla
ims)
to o
ther
dep
osit-
take
rs8
14.0
Fees
and
com
mis
sion
s re
ceiv
able
and
pay
able
from
oth
er d
epos
it-ta
kers
in th
e re
porti
ng p
opul
atio
n6
10.5
Div
iden
ds re
ceiv
able
and
pay
able
from
oth
er d
epos
it-ta
kers
in th
e re
porti
ng p
opul
atio
n8
14.0
The
inve
stin
g de
posi
t-tak
er’s
pro
-rat
ed s
hare
of t
he e
arni
ngs
of a
ssoc
iate
dep
osit-
take
rs a
lso
in th
e re
porti
ng p
opul
atio
n7
12.3
Oth
er in
com
e re
ceiv
able
and
pay
able
from
oth
er d
epos
it-ta
kers
in th
e re
porti
ng p
opul
atio
n6
10.5
Gai
n an
d lo
sses
on
depo
sit-t
aker
s’ o
wne
rshi
p of
equ
ities
of o
ther
dep
osit-
take
rs in
the
repo
rting
po
pula
tion
58.
8
Pro
visi
ons
on lo
ans
to o
ther
dep
osit-
take
rs in
the
repo
rting
pop
ulat
ion
712
.3
Adj
ustm
ents
in th
e B
alan
ce S
heet
:In
vest
men
ts in
ass
ocia
tes
resi
dent
in th
e ec
onom
y13
22.8
The
mar
ket v
alue
of s
hare
s an
d ot
her e
quity
inve
stm
ents
in o
ther
dep
osit-
take
rs in
the
repo
rting
po
pula
tion
1424
.6
Spe
cific
pro
visi
ons
on lo
ans
to (a
nd o
ther
cla
ims
on) o
ther
dep
osit-
take
rs13
22.8
Sou
rce:
CC
E.
1/ I
nter
-gro
up c
onso
lidat
ion
adju
stm
ents
(int
er) i
nvol
ve th
e el
imin
atio
n of
som
e (b
ut n
ot a
ll) fl
ows
and
posi
tions
am
ong
grou
ps.
Tabl
e 9.
a. F
SIs
for D
epos
it Ta
kers
: Int
er-g
roup
Con
solid
atio
n A
djus
tmen
ts in
the
Fina
ncia
l Sta
tem
ents
69

Tabl
e 9.
b. F
SIs
for D
epos
it Ta
kers
: Int
er-g
roup
Con
solid
atio
n A
djus
tmen
ts in
the
Fina
ncia
l Sta
tem
ents
(by
Cou
ntry
)
Adj
ustm
ents
in th
e In
com
e St
atem
ent:
50
07
00
02
57
57
10
31
60
47P
rovi
sion
s fo
r acc
rued
inte
rest
on
nonp
erfo
rmin
g lo
ans
(and
oth
er c
laim
s)
to o
ther
dep
osit-
take
rs8
Fees
and
com
mis
sion
s re
ceiv
able
and
pa
yabl
e fro
m o
ther
dep
osit-
take
rs in
the
repo
rting
pop
ulat
ion
6
Div
iden
ds re
ceiv
able
and
pay
able
from
ot
her d
epos
it-ta
kers
in th
e re
porti
ng
popu
latio
n8
The
inve
stin
g de
posi
t-tak
er’s
pro
-rat
ed
shar
e of
the
earn
ings
of a
ssoc
iate
de
posi
t-tak
ers
also
in th
e re
porti
ng
popu
latio
n
7
Oth
er in
com
e re
ceiv
able
and
pay
able
fro
m o
ther
dep
osit-
take
rs in
the
repo
rting
pop
ulat
ion
6
Gai
n an
d lo
sses
on
depo
sit-t
aker
s’
owne
rshi
p of
equ
ities
of o
ther
dep
osit-
take
rs in
the
repo
rting
pop
ulat
ion
5
Pro
visi
ons
on lo
ans
to o
ther
dep
osit-
take
rs in
the
repo
rting
pop
ulat
ion
7
Adj
ustm
ents
in th
e B
alan
ce S
heet
:3
11
32
33
03
33
30
33
03
340
Inve
stm
ents
in a
ssoc
iate
s re
side
nt in
th
e ec
onom
y13
The
mar
ket v
alue
of s
hare
s an
d ot
her
equi
ty in
vest
men
ts in
oth
er d
epos
it-ta
kers
in th
e re
porti
ng p
opul
atio
n14
Spe
cific
pro
visi
ons
on lo
ans
to (a
nd
othe
r cla
ims
on) o
ther
dep
osit-
take
rs13
Sou
rce:
CC
E.
1/ I
nter
-gro
up c
onso
lidat
ion
adju
stm
ents
(int
er) i
nvol
ve th
e el
imin
atio
n of
som
e (b
ut n
ot a
ll) fl
ows
and
posi
tions
am
ong
grou
ps.
Cyp
rus
Ger
man
yC
anad
aIn
ter-
grou
p C
onso
lidat
ion
Adj
ustm
ents
1/A
rmen
iaA
ustr
alia
Indi
aIn
done
sia
Mal
aysi
aM
alta
Nor
way
Italy
Leba
non
Kor
eaTo
tal
Turk
eyU
krai
ne
de
note
s th
at th
e gi
ven
inte
r-gr
oup
cons
olid
atio
n ad
just
men
t is
carr
ied
out b
y th
e co
untry
.
Rus
sia
Mex
ico
Spai
n
70

Des
crip
tion
Num
ber o
f co
untr
ies
Perc
enta
ge
Type
of A
ccou
ntin
g st
anda
rds
1/
Full
adop
tion
of IF
RS
s by
all
depo
sit t
aker
s18
31.6
Full
adop
tion
of IF
RS
s by
som
e de
posi
t tak
ers;
oth
ers
use
loca
l sta
ndar
ds2
3.5
Par
tial a
dopt
ion
of IF
RS
s by
dep
osit
take
rs23
40.4
Full
adop
tion
of lo
cal s
tand
ards
by
all d
epos
it ta
kers
1322
.8Fu
ll ad
optio
n of
loca
l sta
ndar
ds b
y so
me
depo
sit t
aker
s; o
ther
s us
e U
S G
AA
P1
1.8
Tota
l 57
100.
0
Ado
ptio
n of
IFR
Ss fo
r the
follo
win
g is
sues
Prin
cipl
e fo
r rec
ogni
zing
ass
ets
and
liabi
litie
s31
54.4
Rec
ordi
ng o
f gai
ns a
nd lo
sses
on
avai
labl
e-fo
r-sa
le a
sset
s36
63.2
Rec
ordi
ng o
f fee
s an
d co
mm
issi
ons
dire
ctly
rela
ted
to lo
ans
3357
.9R
ecor
ding
of e
ffect
ive
porti
on o
f the
gai
n or
loss
on
a ca
sh fl
ow h
edge
or h
edge
of a
net
inve
stm
ent i
n a
fore
ign
oper
atio
n, a
nd p
oten
tially
on
a he
dge
for t
he fo
reig
n cu
rren
cy ri
sk o
f a fi
rm c
omm
itmen
t33
57.9
Val
uatio
n of
hel
d-to
-mat
urity
inst
rum
ents
4070
.2V
alua
tion
of n
ontra
dabl
e in
stru
men
ts25
43.9
Com
plia
nce
with
the
FSI G
uide
's re
com
men
datio
ns fo
r the
follo
win
g is
sues
Prin
cipl
e fo
r rec
ogni
zing
ass
ets
and
liabi
litie
s14
24.6
Rec
ordi
ng o
f gai
ns a
nd lo
sses
on
avai
labl
e-fo
r-sa
le a
sset
s8
14.0
Rec
ordi
ng o
f fee
s an
d co
mm
issi
ons
dire
ctly
rela
ted
to lo
ans
2340
.4R
ecor
ding
of e
ffect
ive
porti
on o
f the
gai
n or
loss
on
a ca
sh fl
ow h
edge
or h
edge
of a
net
inve
stm
ent i
n a
fore
ign
oper
atio
n, a
nd p
oten
tially
on
a he
dge
for t
he fo
reig
n cu
rren
cy ri
sk o
f a fi
rm c
omm
itmen
t8
14.0
Val
uatio
n of
hel
d-to
-mat
urity
inst
rum
ents
35.
3V
alua
tion
of n
ontra
dabl
e in
stru
men
ts6
10.5
Sou
rce:
CC
E.
1/ IF
RS
Int
erna
tiona
l Fin
anci
al R
epor
ting
Sta
ndar
d.
G
AA
P G
ener
ally
Acc
epte
d A
ccou
ntin
g P
rinci
ples
.
Tabl
e 10
. Acc
ount
ing
Stan
dard
s A
dopt
ed b
y th
e C
CE
Part
icip
atin
g C
ount
ries
71

General Methodological Practices FC LFC NA 1/ TotalInstitutional coverage & basis for consolidation 2 55 0 57Consolidation adjustments 2 55 0 57Accrual accounting 14 43 0 57Arrears 46 11 0 57Potential costs 15 42 0 57Asset boundary 38 19 0 57Identification of loan loss provisions 0 0 57 57Collateral and guarantees 0 0 57 57Valuation of impaired assets 5 52 0 57Valuation: market, fair, nominal value 3 54 0 57Investments in associates & unconsolidated subsidiaries 38 19 0 57Tax deductions 0 0 57 57Foreign-currency-denominated & exchange rates 16 41 0 57Maturity 46 11 0 57Recording of gains and losses on financial instruments 8 48 1 57
Total Number of Practices Identified by Countries 233 450 172 855Percentage 27.3 52.6 20.1 100
Source: CCE.1) Rating is not applicable (NA) for selected methodological practices for which the Guide does not provide a benchmark.
FC Fully Consistent with the Guide recommendationLFC Less than Fully Consistent with the Guide recommendation
General Methodological Practices FC LFC NA 1/ TotalInstitutional coverage & basis for consolidation 15 16 0 31Consolidation adjustments 3 28 0 31Accrual accounting 12 19 0 31Arrears 23 7 1 31Potential costs 7 24 0 31Asset boundary 16 15 0 31Valuation: market, fair, nominal value 6 25 0 31Investments in associates & unconsolidated subsidiaries 18 13 0 31Tax deductions 0 0 31 31Foreign-currency-denominated & exchange rates 10 21 0 31Maturity 28 3 0 31
Total Number of Practices Identified by Countries 138 171 32 341Percentage 40.5 50.1 9.4 100
Source: CCE.1) Rating is not applicable (NA) for selected methodological practices for which the Guide does not provide a benchmark.
FC Fully Consistent with the Guide recommendationLFC Less than Fully Consistent with the Guide recommendation
Table 11.a. FSIs for Deposit Takers - General Methodological Practices
Table 11.b. FSIs for Other Financial Corporations - General Methodological Practices
72

General Methodological Practices FC LFC NA 1/ TotalInstitutional coverage & basis for consolidation 12 8 0 20Consolidation adjustments 1 19 0 20Accrual accounting 9 11 0 20Arrears 14 6 0 20Potential costs 1 19 0 20Asset boundary 10 10 0 20Valuation: market, fair, nominal value 4 16 0 20Investments in associates & unconsolidated subsidiaries 15 5 0 20Tax deductions 0 0 20 20Foreign-currency-denominated & exchange rates 7 13 0 20Recording of gains and losses on financial instruments 2 18 0 20
Total Number of Practices Identified by Countries 75 125 20 220Percentage 34.1 56.8 9.1 100
Source: CCE.1) Rating is not applicable (NA) for selected methodological practices for which the Guide does not provide a benchmark.
FC Fully Consistent with the Guide recommendationLFC Less than Fully Consistent with the Guide recommendation
General Methodological Practices FC LFC NA 1/ TotalInstitutional coverage & basis for consolidation 25 1 0 26Accrual accounting 11 15 0 26Arrears 13 13 0 26Valuation: market, fair, nominal value 17 9 0 26Foreign-currency-denominated & exchange rates 12 14 0 26
Total Number of Practices Identified by Countries 78 52 0 130Percentage 60.0 40.0 0.0 100
Source: CCE.1) Rating is not applicable (NA) for selected methodological practices for which the Guide does not provide a benchmark.
FC Fully Consistent with the Guide recommendationLFC Less than Fully Consistent with the Guide recommendation
Table 11.c. FSIs for Non-Financial Corporations - General Methodological Practices
Table 11.d. FSIs for Households - General Methodological Practices
73

Des
crip
tion
Num
ber o
f co
untr
ies
Perc
enta
ge
Full
adop
tion
of B
asel
I by
all
depo
sit t
aker
s31
54.4
Ado
ptio
n of
Bas
el I
with
one
or m
ore
of th
e fo
llow
ing
devi
atio
ns25
43.9
G
oodw
ill n
ot d
educ
ted
from
cap
ital
23.
5
Tie
r 3 n
ot u
sed
2136
.8
Som
e in
nova
tive
inst
rum
ents
incl
uded
in c
apita
l2
3.5
O
ther
s4
7.0
Ado
ptio
n of
nat
iona
l sta
ndar
ds b
y al
l dep
osit
take
rs1
1.8
Con
solid
atio
n ba
sis
used
to c
ompi
le I1
and
I2
DC
CB
47.
0
DC
1221
.1
DC
CB
S16
28.1
C
BC
SD
I11
19.3
O
ther
58.
8
Use
of m
ultip
le c
onso
lidat
ion
base
s9
15.8
To
tal
5710
0.0
Full
inte
r-gr
oup
adju
stm
ents
wer
e ca
rrie
d ou
t12
21.1
Par
tial i
nter
-gro
up a
djus
tmen
ts w
ere
carr
ied
out
3154
.4
Sou
rce:
CC
E.
1/ I
ndic
ator
I1: R
egul
ator
y ca
pita
l to
risk-
wei
ghte
d as
sets
.
In
dica
tor I
2: R
egul
ator
y Ti
er 1
cap
ital t
o ris
k-w
eigh
ted
asse
ts.
CB
CS
DI
C
ross
bor
der a
nd c
ross
sec
tor c
onso
lidat
ion
basi
s fo
r all
dom
estic
ally
inco
rpor
ated
ent
ities
CB
DI
C
ross
bor
der c
onso
lidat
ion
basi
s fo
r all
dom
estic
ally
inco
rpor
ated
ent
ities
DC
D
omes
tic c
onso
lidat
ion
basi
s
DC
CB
D
omes
tical
ly c
ontro
lled,
cro
ss b
orde
r con
solid
atio
n ba
sis
DC
CB
S
D
omes
tical
ly c
ontro
lled,
cro
ss b
orde
r, cr
oss
sect
or c
onso
lidat
ion
basi
sO
THE
R
O
ther
con
solid
atio
n ba
ses
OTH
ER
refe
r to
the
cons
olid
atio
n ba
ses
of a
FS
I com
pile
d on
a b
asis
oth
er th
an C
BC
SD
I, C
BD
I, D
C, D
CC
B, o
r D
CC
BS
. O
THE
R a
lso
incl
ude
the
cons
olid
atio
n ba
sis
of a
FS
I com
pile
d w
ith th
e un
derly
ing
data
cal
cula
ted
on
diffe
rent
con
solid
atio
n ba
ses.
Tabl
e 12
. Sup
ervi
sory
Sta
ndar
ds U
sed
by th
e C
CE
Cou
ntrie
s to
Com
pile
FSI
s I1
and
I2 1/
74

1.(9
0.0)
(10.
0)2.
(46.
0)(2
0.0)
(34.
0)3.
(34.
7)(5
5.1)
(10.
2)4.
(76.
3)(1
5.8)
(7.9
)5.
(43.
1)(2
5.5)
(31.
4)
6.(3
3.3)
(29.
4)(3
7.3)
7.(3
9.2)
(39.
2)(2
1.6)
8.(6
7.4)
(30.
4)(2
.2)
9.(7
0.6)
(27.
5)(2
.0)
1.
2(3
.3)
14(2
3.0)
16(2
6.2)
17(2
7.9)
4(6
.6)
8(1
3.1)
2.(1
4.3)
(85.
7)
3.S
houl
d th
e G
uide
reco
mm
end
a si
ngle
con
solid
atio
n ba
sis?
(14.
3)(8
5.7)
4.
0(0
.0)
0(0
.0)
1(2
.2)
1(2
.2)
0(0
.0)
2(4
.3)
42(9
1.3)
5.(9
4.4)
(5.6
)
6.6
(10.
7)16
(28.
6)17
(30.
4)13
(23.
2)2
(3.6
)2
(3.6
)
7.(7
6.7)
(23.
3)
8.(9
1.8)
(8.2
)
No
422
2
No
CB
DI
7
Offe
r a
num
ber o
f
DC
CB
DC
Yes
N
o34
CB
CSD
I
Yes
N
o
II. F
SIs
and
com
pila
tion
met
hodo
logy
Oth
er
Yes
I.
Expe
rienc
e of
the
CC
E an
d th
e us
e of
FSI
s
DC
CB
SD
CC
BC
BC
SDI
Sho
uld
the
Gui
de re
tain
its
reco
mm
enda
tion
on th
e ne
ed to
hav
e in
tra-g
roup
co
nsol
idat
ed d
ata?
No
Ans
wer
CB
DI
Oth
er
CB
DI
5
31
Oth
er
15
CB
CSD
ID
CC
BYes
Par
tially
No
182
23 17 29 22 17 20 31 36
10 27 6 13 15 20 14 14
17 5 3 16 19 11 1 1
1 2 13 0 0 0 5 0
742
2
DC
DC
CB
S
DC
CB
S
Yes
108
454
2
33
DC
No
Ans
wer
No
Ans
wer
No
Ans
wer
No
Ans
wer
No
Ans
wer
No
Ans
wer
No
Ans
wer
29
5
1/ M
ore
than
one
con
solid
atio
n ba
ses
wer
e ch
osen
by
som
e co
untri
es.
2/ T
wen
ty n
ine
coun
tries
did
not
pro
vide
any
inpu
t on
whi
ch o
ptio
ns o
n co
nsol
idat
ion
basi
s sh
ould
be
offe
red
by th
e G
uide
. The
num
ber u
nder
eac
h co
nsol
idat
ion
basi
s re
pres
ents
the
num
ber o
f tim
es th
at th
is b
asis
was
cho
sen
by c
ount
ries
as a
n op
tion
that
sho
uld
Hav
e th
e be
nefit
s ou
twei
ghed
the
cost
s of
the
CC
E?
Did
the
CC
E m
eet i
ts a
im o
f dev
elop
ing
coun
try c
apac
ity to
com
pile
FS
Is?
Did
the
CC
E m
eet i
ts a
im to
pro
mot
e in
tern
atio
nal c
ompa
rabi
lity
of F
SIs
?H
ave
the
exte
nsiv
e FS
I met
adat
a be
en u
sefu
l in
this
are
a?
Do
you
find
the
Gui
de a
dequ
ate
in p
rovi
ding
gui
danc
e in
com
pilin
g th
e FS
Is?
Abs
tract
ing
from
cur
rent
dat
a av
aila
bilit
y, w
hich
con
solid
atio
n ba
sis
do y
ou
thin
k is
bes
t sui
ted
to a
sses
s th
e he
alth
and
sou
ndne
ss o
f the
fina
ncia
l s y
stem
in y
our c
ount
ry?
1/
Sho
uld
the
Gui
de k
eep
DC
CB
(dom
estic
ally
con
trolle
d cr
oss
bord
er) a
s th
e re
com
men
ded
cons
olid
atio
n ba
sis
for d
epos
it ta
kers
?
Hav
e th
e FS
Is c
ompi
led
for t
he C
CE
bee
n us
eful
in y
our e
fforts
tow
ards
m
eetin
g th
e da
ta n
eeds
for a
naly
sis
on y
our c
ount
ry’s
fina
ncia
l sys
tem
so
undn
ess?
Hav
e th
e FS
Is c
ompi
led
for t
he C
CE
bee
n us
ed in
the
asse
ssm
ent o
f the
he
alth
of y
our c
ount
ry’s
fina
ncia
l sys
tem
?W
ere
the
FSIs
repo
rted
in th
e C
CE
alre
ady
used
in th
e as
sess
men
t of t
he
heal
th o
f you
r cou
ntry
’s fi
nanc
ial s
yste
m b
efor
e th
e C
CE
?D
o th
e cu
rren
t des
ign
and
quer
y fa
cilit
ies
of th
e IM
F FS
I/CC
E w
ebsi
te
resp
ond
to u
sers
’ nee
ds?
Tabl
e 13
. Sur
vey
of th
e C
CE
Part
icip
atin
g C
ount
ry V
iew
s: S
elec
ted
Que
stio
ns(N
umbe
r of r
espo
nses
and
, in
pare
nthe
sis,
per
cent
of t
otal
resp
onse
s to
eac
h qu
estio
n)
b
e of
fere
d am
ong
othe
rs b
y th
e G
uide
.
If th
e G
uide
wer
e to
reco
mm
end
a si
ngle
con
solid
atio
n ba
sis,
whi
ch b
asis
sh
ould
that
be?
If th
e G
uide
wer
e to
offe
r a n
umbe
r of o
ptio
ns o
n co
nsol
idat
ion
basi
s, s
houl
d th
ey b
e lim
ited
in n
umbe
r?
If th
e G
uide
wer
e to
offe
r a n
umbe
r of o
ptio
ns o
n co
nsol
idat
ion
basi
s, w
hat
mig
ht th
ese
optio
ns b
e? 2/
Is it
impo
rtant
for f
inan
cial
sou
ndne
ss a
naly
sis
to re
tain
a n
atio
nal a
ccou
nts
type
of c
once
pt o
f the
sec
tor?
75

9.(6
1.7)
(38.
3)
10.
(38.
3)(6
1.7)
11.
(37.
8)(6
2.2)
12.
(46.
2)(5
3.8)
13.
(52.
4)(4
7.6)
14.
(41.
7)(5
8.3)
15.
(5.9
)(1
7.6)
(43.
1)(3
3.3)
16.
(5.9
)(1
7.6)
(41.
2)(3
5.3)
17.
(38.
1)(6
1.9)
18.
(85.
1)(1
4.9)
19
(62.
5)(3
7.5)
20(5
4.5)
(45.
5)
21.
(50.
0)(5
0.0)
22.
A.
(58.
1)(4
1.9)
B.
(93.
2)(6
.8)
C.
(93.
0)(7
.0)
D.
(95.
5)(4
.5)
E.
(95.
5)(4
.5)
F.(9
0.9)
(9.1
)
If in
ter-
grou
p ad
just
men
ts w
ere
to b
e m
ade,
wou
ld p
artia
l con
solid
atio
n ad
just
men
ts (i
.e. s
ome
adju
stm
ents
don
e an
d ot
hers
not
) be
mea
ning
ful?
Sho
uld
the
Gui
de re
tain
its
advi
ce o
n in
tra-s
ecto
r (in
ter-
grou
p) c
onso
lidat
ion
adju
stm
ents
?
Is fu
lly c
onso
lidat
ed F
SI d
ata
(with
bot
h in
tra-g
roup
and
inte
r-gr
oup
cons
olid
atio
n ad
just
men
ts) b
est s
uite
d fo
r sou
ndne
ss a
naly
sis
of fi
nanc
ial
sect
ors?
Ple
ase
prov
ide
an in
dica
tion
of th
e si
ze o
f the
inte
r-gr
oup
posi
tions
iden
tifie
d in
the
Gui
de in
you
r cou
ntry
Is it
ana
lytic
ally
nec
essa
ry to
elim
inat
e al
l inv
estm
ents
in e
quity
am
ong
unre
late
d de
posi
t tak
ers
(and
oth
er fi
nanc
ial i
nstit
utio
ns) i
n th
e re
porti
ng
popu
latio
n fro
m th
e se
ctor
-wid
e da
ta u
sed
to c
ompi
le to
tal r
egul
ator
y ca
pita
l, Ti
er 1
cap
ital,
and
risk
wei
ghte
d as
sets
?S
houl
d th
e G
uide
mak
e an
exp
licit
reco
mm
enda
tion
that
Bas
el I
or B
asel
II b
e us
ed to
com
pile
tota
l reg
ulat
ory
capi
tal,
Tier
1 c
apita
l, an
d ris
k-w
eigh
ted
asse
ts?
If th
e G
uide
wer
e to
mak
e an
exp
licit
reco
mm
enda
tion
that
Bas
el I
or B
asel
II
be u
sed
to c
ompi
le to
tal r
egul
ator
y ca
pita
l, Ti
er 1
cap
ital,
and
risk-
wei
ghte
d as
sets
, sho
uld
such
a re
com
men
datio
n in
clud
e th
e is
sue
of c
onso
lidat
ion
basi
s?U
nder
Bas
el II
, will
dat
a us
ed fo
r FS
Is o
n to
tal r
egul
ator
y ca
pita
l, Ti
er 1
ca
pita
l, an
d ris
k w
eigh
ted
asse
ts b
e m
ore
com
para
ble
acro
ss c
ount
ries?
Sho
uld
the
Gui
de re
com
men
d th
at b
oth
inte
r-gr
oup
cons
olid
ated
dat
a an
d ag
greg
ated
dat
a (i.
e. w
ith n
o in
ter-
grou
p ad
just
men
ts) b
e pr
ovid
ed to
incr
ease
cr
oss-
coun
try d
ata
com
para
bilit
y an
d ga
uge
the
sign
ifica
nce
of a
djus
tmen
ts?
If on
ly p
artia
l adj
ustm
ents
can
be
mad
e (e
.g. d
ue to
dat
a co
nstra
ints
), sh
ould
th
e G
uide
reco
mm
end
that
no
adju
stm
ents
be
mad
e at
all?
Is s
impl
y ag
greg
ated
FS
I dat
a (w
ith in
tra-g
roup
but
no
inte
r-gr
oup
cons
olid
atio
n ad
just
men
ts) b
est s
uite
d fo
r sou
ndne
ss a
naly
sis
of fi
nanc
ial
sect
ors?
Ple
ase
prov
ide
an in
dica
tion
of th
e si
ze o
f the
inte
r-gr
oup
flow
s id
entif
ied
in
the
Gui
de in
you
r cou
ntry
42
47
152918
4
1829
4
1728
6
1821
12 9
2028
3
2220
Sig
nific
ant
Som
ewha
t Sig
nific
ant
Not
Sig
nific
ant
Unk
now
n
Yes
N
o
22 21
3 3
9 9
9
407
4
1626
27
1815
18
9
1916
16
8
413
7
27
40
8
422
7
403
2518
No
Ans
wer
Yes
N
o A
nsw
erN
o
0 0
17 18
No
Ans
wer
Und
er B
asel
II, w
ill d
ata
used
for F
SIs
on
tota
l reg
ulat
ory
capi
tal,
Tier
1
capi
tal,
and
risk
wei
ghte
d as
sets
be
mor
e co
mpa
rabl
e ac
ross
ban
ks w
ithin
a
Sho
uld
the
Gui
de fo
llow
IFR
S g
uida
nce
in th
e ex
istin
g ar
eas
of d
iver
genc
e be
twee
n th
e G
uide
and
IFR
S in
dica
ted
belo
w?
cons
olid
atio
n ba
sis
reco
rdin
g of
gai
ns a
nd lo
sses
on
avai
labl
e fo
r sal
e fin
anci
al
inst
rum
ents
reco
rdin
g of
the
effe
ctiv
e po
rtion
of a
gai
n/lo
ss o
n a
cash
flow
hed
ge
or h
edge
of a
net
inve
stm
ent i
n a
fore
ign
oper
atio
n, a
nd p
oten
tially
on
a h
edge
for t
he fo
reig
n cu
rren
cy ri
sk o
f a fi
rm c
omm
itmen
ttre
atm
ent o
f fee
s an
d co
mm
issi
ons
rece
ivab
le/p
ayab
lepr
inci
ple
used
in d
eter
min
ing
whe
ther
ass
ets
and
liabi
litie
s ex
ist a
nd
are
outs
tand
ing
valu
atio
n of
non
trada
ble
finan
cial
inst
rum
ents
and
hel
d-to
-mat
urity
as
sets
Tabl
e 13
. Sur
vey
of th
e C
CE
Part
icip
atin
g C
ount
ry V
iew
s: S
elec
ted
Que
stio
ns (
Con
t.)(N
umbe
r of r
espo
nses
and
, in
pare
nthe
sis,
per
cent
of t
otal
resp
onse
s to
eac
h qu
estio
n)
76

FSI
FSI
FSI
I1I2
I3I4
I5(2
.1)
I6I7
I8I9
I10
I11
I12
(6.3
)I1
3I1
4(2
5.0)
I15
(2.1
)I1
6(4
.2)
I17
(4.2
)I1
8I1
9I2
0I2
1I2
2I2
3I2
4I2
5(8
.3)
I26
I27
I28
I29
I30
I31
(4.2
)I3
2(4
.2)
I33
I34
I35
I36
I37
I38
I39
(39.
6)
24.
(61.
7)(3
8.3)
25(8
3.3)
(16.
7)
26
I1(1
.5)
I2(1
.5)
I3(1
.5)
S1
(1.5
)S
3(1
.5)
S5
(1.5
)S
2(1
.5)
S4
S6
(1.5
)I4
I5I6
(3.0
)S
7(1
.5)
S9
(1.5
)S
11(4
.5)
S8
S10
S12
I7(3
.0)
I8I9
S13
(4.5
)S
15(1
.5)
S17
(1.5
)S
14S
16(1
.5)
S18
(1.5
)I1
0I1
1I1
2(3
.0)
S19
(4.5
)S
21(4
.5)
S23
S20
(1.5
)S
22(1
.5)
S24
(3.0
)I1
3I1
4(7
.6)
I15
(1.5
)S
25S
27S
29S
26S
28(1
.5)
S30
I16
(1.5
)I1
7(1
.5)
I18
S31
S33
S35
S32
S34
(1.5
)S
36
No
No
Ans
wer
2212
Yes
23. W
hat a
re th
e FS
Is in
clud
ed in
the
Gui
de th
at y
ou w
ould
reco
mm
end
dele
ting
from
the
list? 20
427
184
293 1
FSI a
nd U
nder
lyin
g Se
ries
FSI a
nd U
nder
lyin
g Se
ries
FSI a
nd U
nder
lyin
g Se
ries
1 1 1 1 2 3 3 1 1
1 1 1 1 1 3 1 5 1 1 1
3 1 1 2 21 1 1 2 1
19N
one
shou
ld b
e de
lete
d
1
Ple
ase
indi
cate
whe
ther
any
of t
he F
SIs
and
und
erly
ing
data
ser
ies
in th
e G
uide
nee
d to
be
rede
fined
?
Wou
ld y
our c
ount
ry b
e ab
le to
pro
vide
mea
sure
s of
dis
pers
ion?
Sho
uld
a m
easu
re o
f dis
pers
ion
(how
dat
a is
dis
pers
ed a
roun
d a
mea
n va
lue)
be
add
ed to
som
e of
the
aggr
egat
e FS
Is to
mak
e th
em m
ore
usef
ul to
fin
anci
al s
ound
ness
ana
lysi
s ?
4 22Ta
ble
13. S
urve
y of
the
CC
E Pa
rtic
ipat
ing
Cou
ntry
Vie
ws:
Sel
ecte
d Q
uest
ions
(C
ont.)
(Num
ber o
f res
pons
es a
nd, i
n pa
rent
hesi
s, p
erce
nt o
f tot
al re
spon
ses
to e
ach
ques
tion)
77

I19
I20
(3.0
)I2
1(1
.5)
S37
S38
I22
I23
(1.5
)I2
4(1
.5)
S39
S41
S43
S40
S42
S44
I25
(1.5
)I2
6I2
7S
45S
47S
49S
46(1
.5)
S48
S50
I28
I29
I30
(1.5
)S
51S
53S
55S
52S
54S
56I3
1I3
2(1
.5)
I33
S57
S59
S58
S60
I34
(1.5
)I3
5I3
6S
61S
62I3
7 (i)
(1.5
)I3
8(1
.5)
I39
(1.5
)I3
7 (ii
)S
63S
65S
64S
66(1
0.6)
1.(1
00.0
)(0
.0)
2.(6
9.0)
(31.
0)
3.(9
.5)
(90.
5)
4.(2
1.4)
(78.
6)
5.(9
6.1)
(3.9
)
6.(9
5.8)
(4.2
)
7.(7
5.0)
(25.
0)
8.(6
1.7)
(38.
3)
9.(3
2.0)
(68.
0)10
.(5
8.0)
(42.
0)11
.(6
4.0)
(36.
0)12
.(6
6.0)
(34.
0)
13.
(54.
2)(4
5.8)
1
Sho
uld
the
IMF
also
requ
est o
ther
mem
ber c
ount
ries
to p
repa
re a
nd re
port
the
FSI d
ata
and
met
adat
a fo
r dis
sem
inat
ion
on th
e IM
F w
ebsi
te?
Are
ther
e an
y ot
her r
oles
the
IMF
shou
ld p
lay
(inst
ead
or in
add
ition
to
colle
ctin
g an
d di
ssem
inat
ing
FSIs
) in
prom
otin
g th
e co
mpi
latio
n an
d di
ssem
inat
ion
of F
SIs
?W
ill y
our c
ount
ry b
e ab
le a
nd w
illin
g to
com
pile
and
sub
mit
quar
terly
FS
Is to
th
e IM
F?S
houl
d al
l FS
Is b
e co
mpi
led
quar
terly
?
Sho
uld
som
e FS
Is b
e co
mpi
led
with
diff
eren
t per
iodi
city
? S
houl
d th
e pe
riodi
city
of F
SIs
sub
mitt
ed to
the
IMF
be fl
exib
le?
III. W
ay fo
rwar
d w
ith F
SIs
Non
e sh
ould
be
rede
fined
Is y
our c
ount
ry w
illin
g to
com
pile
on
a re
gula
r bas
is th
e FS
Is th
at th
e co
untry
co
mpi
led
for t
he C
CE
?
FSI a
nd U
nder
lyin
g Se
ries
1 1 1
2FS
I and
Und
erly
ing
Serie
s
1 1 1
1FS
I and
Und
erly
ing
Serie
s
1 1 1
7
Yes
N
oN
o A
nsw
er
470
4
2913
9
438
9
933
9
492
0
462
3
3311
7
2918
4
1634
121
132
181
Sho
uld
all F
SIs
be
diss
emin
ated
with
the
sam
e tim
elin
ess?
3116
4
2622
3
29
If yo
ur c
ount
ry w
ere
will
ing
to c
ompi
le o
n a
regu
lar b
asis
the
FSIs
, wou
ld it
co
mpi
le fe
wer
indi
cato
rs th
an it
com
pile
d fo
r the
CC
E?
Sho
uld
the
IMF
cont
inue
to c
olle
ct a
nd d
isse
min
ate
the
FSI d
ata
and
met
adat
a of
the
CC
E c
ount
ries?
Will
you
r cou
ntry
be
able
and
will
ing
to c
ompi
le a
nd s
ubm
it FS
Is to
the
IMF
with
a o
ne-q
uarte
r lag
?
Tabl
e 13
. Sur
vey
of th
e C
CE
Part
icip
atin
g C
ount
ry V
iew
s: S
elec
ted
Que
stio
ns (
Con
t.)(N
umbe
r of r
espo
nses
and
, in
pare
nthe
sis,
per
cent
of t
otal
resp
onse
s to
eac
h qu
estio
n)
If yo
ur c
ount
ry w
ere
will
ing
to c
ompi
le o
n a
regu
lar b
asis
the
FSIs
, wou
ld it
co
mpi
le th
e sa
me
num
ber o
f ind
icat
ors
that
it c
ompi
led
for t
he C
CE
? If
your
cou
ntry
wer
e w
illin
g to
com
pile
on
a re
gula
r bas
is th
e FS
Is, w
ould
it
com
pile
a g
reat
er n
umbe
r of i
ndic
ator
s th
an it
com
pile
d fo
r the
CC
E?
78

14.
(31.
9)(6
8.1)
15.
(91.
1)(8
.9)
16.
(88.
9)(1
1.1)
17.
(53.
7)(4
6.3)
18.
(89.
4)(1
0.6)
19.
(42.
2)(5
7.8)
20.
(6.7
)(9
3.3)
21.
(93.
3)(6
.7)
22.
(95.
7)(4
.3)
Sho
uld
sect
oral
fina
ncia
l sta
tem
ents
, fro
m w
hich
man
y FS
Is a
re d
eriv
ed,
cont
inue
to a
ccom
pany
the
diss
emin
atio
n of
FS
Is?
Sho
uld
sect
oral
fina
ncia
l sta
tem
ents
, fro
m w
hich
man
y FS
Is a
re d
eriv
ed, b
e on
ly a
n en
cour
aged
par
t of a
ny F
SI s
ubm
issi
on to
the
IMF?
Yes
1532
4
No
Ans
wer
No
414
6
405
6
2219
10
425
4
1926
6 361
14
141
36
442
5S
houl
d th
e IM
F pr
ovid
e pe
riodi
c re
gion
al tr
aini
ng (e
ither
for n
ew c
ount
ries
or
for c
ount
ries
that
par
ticip
ated
in th
e C
CE
)?
If FS
Is w
ere
to b
e ad
ded
to th
e IM
F's
SD
DS
, sho
uld
only
the
core
FS
Is b
e in
clud
ed?
Will
you
r cou
ntry
be
able
to c
ompi
le s
ecto
ral f
inan
cial
sta
tem
ents
? S
houl
d FS
Is b
e ad
ded
as a
dat
a ca
tego
ry in
the
IMF'
s S
peci
al D
ata
Dis
sem
inat
ion
Sta
ndar
d (S
DD
S)?
If
FSIs
wer
e to
be
adde
d to
the
IMF'
s S
DD
S, s
houl
d al
l FS
Is b
e in
clud
ed?
Sho
uld
the
curr
ent a
lloca
tion
betw
een
core
(req
uire
d) a
nd e
ncou
rage
d in
dica
tors
be
revi
site
d?A
re th
e se
ctor
al fi
nanc
ial s
tate
men
ts fr
om w
hich
man
y FS
Is a
re d
eriv
ed
usef
ul?
Tabl
e 13
. Sur
vey
of th
e C
CE
Part
icip
atin
g C
ount
ry V
iew
s: S
elec
ted
Que
stio
ns (
Con
cl.)
(Num
ber o
f res
pons
es a
nd, i
n pa
rent
hesi
s, p
erce
nt o
f tot
al re
spon
ses
to e
ach
ques
tion)
79
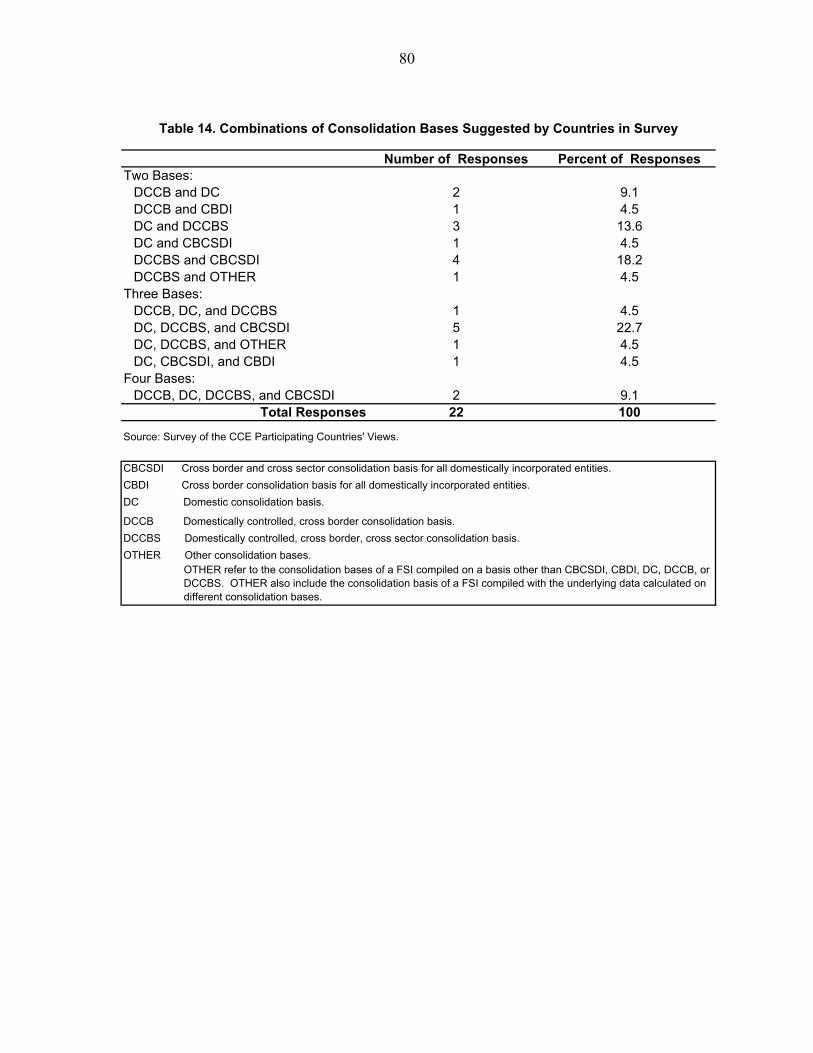
Number of Responses Percent of ResponsesTwo Bases:
DCCB and DC 2 9.1DCCB and CBDI 1 4.5DC and DCCBS 3 13.6DC and CBCSDI 1 4.5DCCBS and CBCSDI 4 18.2DCCBS and OTHER 1 4.5
Three Bases:DCCB, DC, and DCCBS 1 4.5DC, DCCBS, and CBCSDI 5 22.7DC, DCCBS, and OTHER 1 4.5DC, CBCSDI, and CBDI 1 4.5
Four Bases:DCCB, DC, DCCBS, and CBCSDI 2 9.1
Total Responses 22 100
Source: Survey of the CCE Participating Countries' Views.
Table 14. Combinations of Consolidation Bases Suggested by Countries in Survey
CBCSDI Cross border and cross sector consolidation basis for all domestically incorporated entities.
DC Domestic consolidation basis.CBDI Cross border consolidation basis for all domestically incorporated entities.
DCCB Domestically controlled, cross border consolidation basis.DCCBS Domestically controlled, cross border, cross sector consolidation basis.OTHER Other consolidation bases.
OTHER refer to the consolidation bases of a FSI compiled on a basis other than CBCSDI, CBDI, DC, DCCB, or DCCBS. OTHER also include the consolidation basis of a FSI compiled with the underlying data calculated on different consolidation bases.
80