Embed Size (px)
Citation preview

© 2004 International Monetary Fund November 2004
IMF Country Report No. 04/363
Republic of Kazakhstan: Statistical Appendix
This Statistical Appendix for the Republic of Kazakhstan was prepared by a staff team of the International Monetary Fund as background documentation for the periodic consultation with the member country. It is based on the information available at the time it was completed on July 6, 2004. The views expressed in this document are those of the staff team and do not necessarily reflect the views of the government of the Republic of Kazakhstan or the Executive Board of the IMF. The policy of publication of staff reports and other documents by the IMF allows for the deletion of market-sensitive information.
To assist the IMF in evaluating the publication policy, reader comments are invited and may be sent by e-mail to [email protected].
Copies of this report are available to the public from
International Monetary Fund ● Publication Services 700 19th Street, N.W. ● Washington, D.C. 20431
Telephone: (202) 623 7430 ● Telefax: (202) 623 7201 E-mail: [email protected] ● Internet: http://www.imf.org
Price: $15.00 a copy
International Monetary Fund
Washington, D.C.

INTERNATIONAL MONETARY FUND
REPUBLIC OF KAZAKHSTAN
Statistical Appendix Prepared by a staff team consisting of Julian Berengaut, Katrin Elborgh-Woytek, Turgut
Kisinbay, Peter Lohmus (all MCD), and Yongzheng Yang (PDR)
Approved by Middle East and Central Asia Department
July 6, 2004
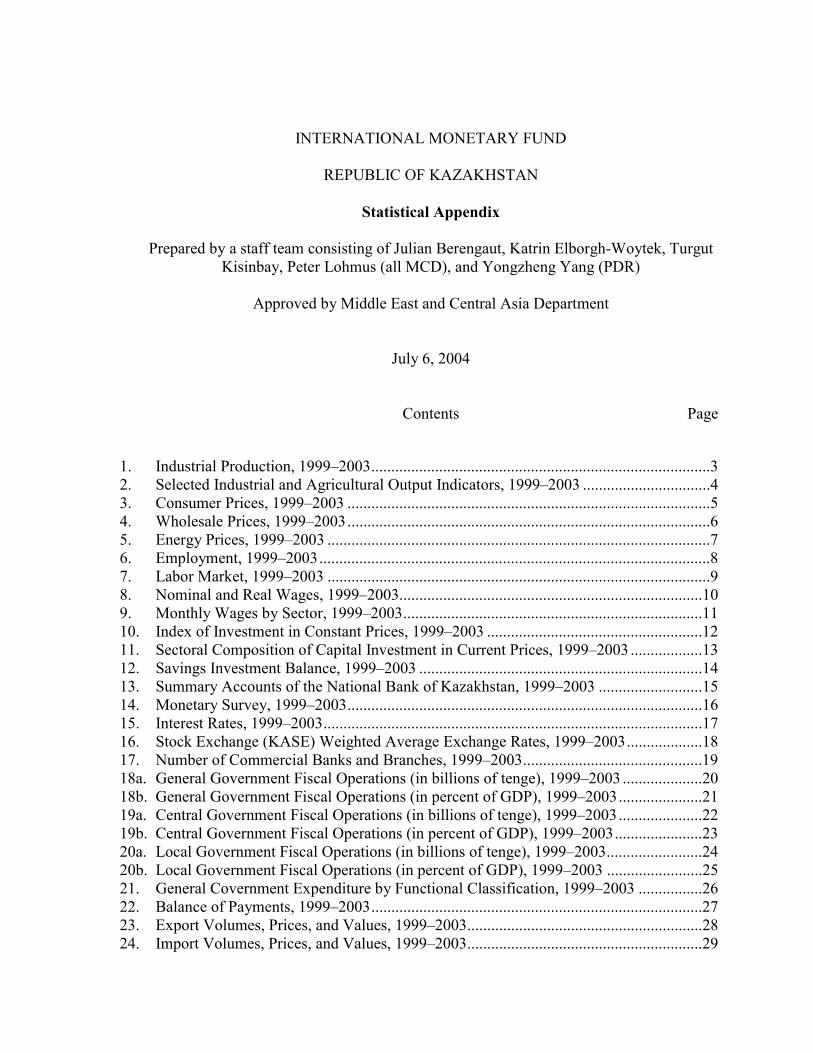
Contents Page
1. Industrial Production, 1999–2003.....................................................................................3 2. Selected Industrial and Agricultural Output Indicators, 1999–2003 ................................4 3. Consumer Prices, 1999–2003 ...........................................................................................5 4. Wholesale Prices, 1999–2003...........................................................................................6 5. Energy Prices, 1999–2003 ................................................................................................7 6. Employment, 1999–2003..................................................................................................8 7. Labor Market, 1999–2003 ................................................................................................9 8. Nominal and Real Wages, 1999–2003............................................................................10 9. Monthly Wages by Sector, 1999–2003...........................................................................11 10. Index of Investment in Constant Prices, 1999–2003 ......................................................12 11. Sectoral Composition of Capital Investment in Current Prices, 1999–2003 ..................13 12. Savings Investment Balance, 1999–2003 .......................................................................14 13. Summary Accounts of the National Bank of Kazakhstan, 1999–2003 ..........................15 14. Monetary Survey, 1999–2003.........................................................................................16 15. Interest Rates, 1999–2003...............................................................................................17 16. Stock Exchange (KASE) Weighted Average Exchange Rates, 1999–2003...................18 17. Number of Commercial Banks and Branches, 1999–2003.............................................19 18a. General Government Fiscal Operations (in billions of tenge), 1999–2003 ....................20 18b. General Government Fiscal Operations (in percent of GDP), 1999–2003.....................21 19a. Central Government Fiscal Operations (in billions of tenge), 1999–2003.....................22 19b. Central Government Fiscal Operations (in percent of GDP), 1999–2003......................23 20a. Local Government Fiscal Operations (in billions of tenge), 1999–2003........................24 20b. Local Government Fiscal Operations (in percent of GDP), 1999–2003 ........................25 21. General Covernment Expenditure by Functional Classification, 1999–2003 ................26 22. Balance of Payments, 1999–2003...................................................................................27 23. Export Volumes, Prices, and Values, 1999–2003...........................................................28 24. Import Volumes, Prices, and Values, 1999–2003...........................................................29

- 2 -
25. Geographical Distribution of Exports, 1999–2003.........................................................30 26. Geographical Distribution of Imports, 1999–2003.........................................................31 27. Geographical Distribution of Exports of Energy Products to the Baltics, Russia, and
Other States of the Former Soviet Union, 1999–2003....................................................32 28. Breakdown of Foreign Direct Investment by Country of Origin, 1999–2003................33 29. Breakdown of Foreign Direct Investment by Industry, 1999–2003 ...............................34 30. Stock of External Debt, 1999–2003 ...............................................................................35

- 3 -
1999 2000 2001 2002 2003Preliminary
Gross output 1,143 1,798 2,000 2,337 2,794
Manufacturing 578 836 937 1,011 1,208Processing of agricultural products 181 239 277 251 319Textile and clothing industry 18 36 40 40 49Manufacturing of coke, refined petroleum products and nuclear fuel 55 70 86 92 128
of which: manufacturing of refined petroleum products 46 60 78 85 123Chemical industry 13 18 24 31 38Production of rubber and plastic products 2 4 7 9 12Manufacture of other non-metal mineral products 9 14 24 31 43Metallurgy and metal working 256 377 374 414 482
of which: metallurgy 250 366 358 397 459Machine building 26 46 67 72 89Other 17 32 38 71 48
Mining 413 800 887 1,120 1,360Mining of coal and lignite 22 27 34 33 40Extraction of crude petroleum and condensate gas 333 683 721 923 1,133Extraction of natural gas 7 9 13 9 13Mining of metal ores 37 55 66 82 99Other mining 15 26 52 73 75
Production and distribution of electricity, gas, and water 152 162 177 205 226
TotalManufacturing 50.6 46.5 46.9 43.3 43.2
Processing of agricultural products 15.8 13.3 13.9 10.7 11.4Textile and clothing industry 1.6 2.0 2.0 1.7 1.8Manufacturing of coke, refined petroleum products and nuclear fuel 4.8 3.9 4.3 3.9 4.6
of which: manufacturing of refined petroleum products 4.0 3.3 3.9 3.6 4.4Chemical industry 1.2 1.0 1.2 1.3 1.4Production of rubber and plastic products 0.2 0.2 0.3 0.4 0.4Manufacture of other non-metal mineral products 0.8 0.8 1.2 1.3 1.5Metallurgy and metal working 22.4 20.9 18.7 17.7 17.3
of which: metallurgy 21.8 20.3 17.9 17.0 16.4Machine building 2.2 2.5 3.4 3.1 3.2Other 1.5 1.8 1.9 3.0 1.7
Mining 36.1 44.5 44.3 47.9 48.7Mining of coal and lignite 1.9 1.5 1.7 1.4 1.4Extraction of crude petroleum and condensate gas 29.1 38.0 36.1 39.5 40.6Extraction of natural gas 0.6 0.5 0.6 0.4 0.5Mining of metal ores 3.2 3.0 3.3 3.5 3.5Other mining 1.3 1.5 2.6 3.1 2.7
Production and distribution of electricity, gas, and water 13.3 9.0 8.8 8.8 8.1
Source: National Statistical Agency. 1/ The values do not include intrafactory turnover.
Table 1. Kazakhstan: Industrial Production, 1999–2003 1/
(In billions of tenge)
(In percent of total)

- 4 -
1999 2000 2001 2002 2003Preliminary
Industry
Production volumesCrude oil (in thousands of metric tons) 1/ 30,130 35,317 40,091 47,271 51,390Coal (in thousands of metric tons) 58,378 74,872 79,135 73,731 84,717Natural gas (in millions of cubic meters) 9,946 11,542 11,610 14,109 16,221Iron ore (in thousands of metric tons) 9,617 16,157 15,886 17,675 19,365Electricity (in millions of kwh) 47,497 51,635 55,384 58,331 63,667
Production volume growthCrude oil (in thousands of metric tons) 1/ 16.1 17.2 13.5 17.9 8.7Coal (in thousands of metric tons) -16.3 28.3 5.7 -6.8 14.9Natural gas (in millions of cubic meters) 25.1 16.0 0.6 21.5 15.0Iron ore (in thousands of metric tons) 3.0 68.0 -1.7 11.3 9.6Electricity (in millions of kwh) -3.4 8.7 7.3 5.3 9.1
Agriculture
Production volumesMeat (in thousands of metric tons) 1,182 1,140 1,155 1,191 1,241Cereals (in thousands of metric tons) 14,264 11,565 15,897 15,960 14,777 of which: Wheat 11,242 9,073 12,707 12,700 11,537
Production volume growthProcessed meat (in thousands of tons) -13.5 -14.4 -3.8 -9.4 19.4Milk products (in thousands of tons) -18.9 22.2 -1.0 12.9 14.7Cereals 123.0 -19.0 37.5 0.4 -7.4 of which: Wheat 136.9 -19.3 40.1 -0.1 -9.2Potatoes 34.2 0.2 29.1 3.8 1.7Tobacco -8.3 102.0 -8.8 7.5 0.4Vegetables 19.3 19.9 15.4 4.2 4.4Meat -2.5 -3.6 1.3 3.1 4.2Milk 5.1 5.5 5.2 4.8 5.2Eggs 8.4 11.9 9.6 13.3 8.5Wool -11.7 2.9 3.1 5.1 8.5
Production value Plant growing 177.7 223.5 325.8 325.3 348.6 of which:
Cereals 85.8 111.5 187.4 165.9 175.5of which: Wheat 67.9 89.0 143.9 123.0 139.2
Potatoes 26.3 31.2 36.0 35.6 41.9Vegetables 25.2 26.9 41.6 43.2 36.7
Animal husbandry 157.3 178.5 207.9 232.1 258.1
Share of agricultural production by private farmsMeat 91.4 93.7 93.9 94.0 94.0Milk 94.8 95.0 95.4 95.5 95.6Eggs 47.6 49.8 50.0 46.8 46.3Wool 87.3 89.1 91.1 91.6 92.7Potatoes 94.9 95.8 96.0 96.9 96.7Vegetables 88.6 94.0 93.6 96.2 96.5
Source: National Statistical Agency. 1/ Includes gas condensate.
Table 2. Kazakhstan: Selected Industrial and Agricultural Output Indicators, 1999–2003
(In billions of tenge)
(In percent of total production)
(Percentage change over previous year)
(Percentage change over previous year)

- 5 -
Jan. Feb. Mar. Apr. May Jun. Jul. Aug. Sep. Oct. Nov. Dec.
1999 Total 0.9 -0.2 -0.2 4.6 1.4 4.8 1.1 -0.3 0.7 0.7 1.7 1.7Food 1.0 -0.3 -0.3 5.7 1.7 6.6 0.6 -1.2 0.3 0.6 2.1 2.7Clothing and footwear 0.2 0.1 0.0 3.5 0.6 2.0 0.6 0.6 1.5 1.5 1.3 0.9Rent, water, and power 2.1 -0.1 -0.1 0.3 1.2 0.7 1.6 0.4 -0.2 0.0 1.0 0.3Household goods 0.0 -0.1 -0.3 9.9 1.7 3.7 0.9 0.5 0.6 1.8 0.7 0.6Medical care -0.5 -1.2 -0.9 6.4 -0.2 0.9 0.4 0.2 0.6 1.1 0.7 0.5Transport and communication 0.0 -0.8 -0.5 3.5 2.4 8.6 4.3 1.8 3.0 0.0 2.0 0.3Recreation, education, and culture 0.3 1.2 0.4 6.6 0.7 2.8 1.1 0.9 1.8 1.2 0.7 0.7Personal care 0.1 0.3 0.4 11.7 2.5 3.1 1.7 0.6 0.6 1.4 1.0 0.7
2000 Total 2.6 0.1 0.0 0.4 0.7 0.7 0.4 0.2 0.5 1.2 1.5 1.3Food 3.5 0.2 -0.1 0.3 1.1 1.0 0.1 0.0 0.2 1.6 2.1 2.0Clothing and footwear 0.6 0.4 0.3 0.4 0.5 0.4 0.6 0.4 0.5 1.0 1.0 0.7Rent, water, and power 3.8 -0.6 0.1 0.1 0.1 0.1 0.2 0.2 1.7 1.1 0.7 0.2Household goods 0.4 0.1 -0.3 -0.1 0.5 0.3 0.2 0.2 0.2 0.2 0.5 0.6Medical care 0.7 0.5 0.9 0.7 0.2 0.4 0.3 0.1 0.2 0.1 0.4 0.2Transport and communication -0.1 -0.1 -0.9 1.4 0.6 0.7 2.5 1.1 0.2 0.7 0.9 0.3Recreation, education, and culture 0.7 0.3 0.4 0.2 0.1 0.1 0.4 0.2 0.3 0.4 0.4 0.7Personal care 0.7 0.4 0.1 0.2 0.4 0.7 0.3 0.3 0.2 0.8 0.4 0.2
2001 Total 1.1 0.7 0.7 0.7 0.4 0.1 -0.1 0.0 0.2 0.7 0.9 1.0Food 1.2 1.4 1.3 1.2 0.7 0.0 -0.4 -0.6 0.1 0.6 1.3 1.7Clothing and footwear 0.4 0.4 0.6 0.5 0.5 0.4 0.3 0.3 0.6 1.1 1.2 0.8Rent, water, and power 2.0 -0.6 0.1 0.1 0.1 0.0 -0.4 0.8 0.1 1.0 0.3 0.3Household goods 0.4 0.6 0.3 0.3 0.4 0.2 0.4 0.2 0.3 0.2 0.9 0.5Medical care 0.6 0.3 0.1 -0.1 -0.1 0.2 0.2 0.3 -0.2 0.2 0.1 0.2Transport and communication 0.0 -0.6 -0.6 -0.3 -0.3 0.3 1.0 1.0 0.5 0.2 -0.5 -1.3Recreation, education, and culture 0.3 0.5 0.4 0.3 0.1 0.1 0.3 0.2 0.3 0.4 0.5 0.4Personal care 0.4 0.3 0.3 0.5 0.2 0.4 0.4 0.3 0.4 0.5 0.6 0.5
2002 Total 0.7 0.3 0.2 0.5 0.9 0.5 0.6 -0.3 0.1 0.6 1.0 1.4Food 1.1 0.5 0.2 0.4 0.7 0.2 0.6 -0.6 -0.1 0.3 1.2 2.3Clothing and footwear 0.3 0.3 0.5 0.6 0.6 0.4 0.3 0.5 0.7 1.2 1.1 1.0Rent, water, and power 1.1 0.6 0.2 0.9 0.0 0.3 1.1 -0.1 0.2 1.0 0.6 0.3Household goods 0.2 0.5 0.4 0.4 0.3 0.4 0.4 0.2 0.3 0.4 0.5 0.4Medical care 0.2 1.0 0.4 0.6 0.4 0.5 0.6 0.5 0.2 0.6 0.5 0.4Transport -2.2 -2.8 -2.0 0.1 7.8 3.7 0.0 -0.5 -1.1 0.7 0.6 0.7Communication 0.1 0.1 0.1 1.0 0.0 0.0 0.0 0.0 0.0 0.0 0.0 0.0Rest, recreation, and culture 0.3 0.7 0.4 0.4 0.3 0.1 0.2 0.3 0.5 0.5 0.5 0.6Education 0.2 0.6 0.8 0.2 0.2 0.1 0.3 0.1 3.0 1.2 1.4 0.3Restaurants and hotels 0.3 0.7 0.6 0.3 0.6 0.1 0.1 0.2 0.3 0.3 0.6 0.8Other goods and services 0.5 0.6 0.4 0.5 0.4 0.5 0.4 0.4 0.5 0.4 0.3 0.3
2003 Total 1.0 0.5 0.3 0.4 0.1 0.1 0.0 0.2 0.4 1.3 1.6 0.9Food 1.4 0.8 0.2 0.4 0.1 0.0 -0.5 -0.5 0.0 1.7 1.9 1.5Clothing and footwear 0.7 0.6 0.5 0.5 0.6 0.4 0.3 0.4 0.5 0.6 0.7 0.7Rent, water, and power 0.6 0.1 0.2 0.9 0.0 0.0 0.0 0.2 0.1 1.8 0.7 0.3Household goods 0.4 0.5 0.4 0.4 0.2 0.4 0.2 0.3 0.3 0.3 0.3 0.4Medical care 0.5 0.6 0.3 0.1 0.3 0.6 0.1 0.1 0.1 0.0 0.2 0.4Transport 0.0 -1.0 0.3 -0.7 -1.4 -0.2 2.5 4.7 2.9 1.0 4.3 -0.3Communication 0.2 0.0 0.0 0.9 0.0 0.0 0.0 0.0 0.0 0.1 0.0 0.0Rest, recreation, and culture 0.7 0.5 0.4 0.2 0.1 0.1 0.1 0.2 0.3 0.3 0.4 0.4Education 0.4 0.2 0.3 0.2 0.1 0.2 0.2 0.2 4.6 1.5 0.6 0.2Restaurants and hotels 0.6 0.5 0.6 0.2 0.3 0.3 0.4 0.5 0.2 0.5 1.3 0.7Other goods and services 0.7 0.4 0.4 0.1 0.4 0.4 0.4 0.5 0.4 0.2 0.5 0.3
Memorandum items:Total 1999 1.0 -0.3 -1.2 2.8 3.9 9.8 11.2 11.9 12.8 14.3 16.3 17.8Total 2000 19.8 20.2 20.4 15.6 14.7 10.2 9.5 10.0 9.8 10.4 10.2 9.8Total 2001 8.2 8.8 9.6 10.0 9.7 9.0 8.5 8.3 8.0 7.4 6.8 6.4Total 2002 6.0 5.7 5.0 4.8 5.4 5.8 6.5 6.2 6.1 6.0 6.1 6.6Total 2003 6.9 7.0 7.2 7.0 6.1 5.7 5.1 5.6 5.9 6.7 7.3 6.8
Source: National Statistical Agency.
(Percentage change over previous month)
(Percentage change over previous year)
Table 3. Kazakhstan: Consumer Prices, 1999–2003

- 6 -
Jan. Feb. Mar. Apr. May Jun. Jul. Aug. Sep. Oct. Nov. Dec.
1999 TotalMining and extraction industry -1.7 -2.9 1.2 9.7 10.9 13.0 2.2 8.1 6.9 13.5 4.1 5.4Extraction of crude oil and natural gas -3.2 -6.8 3.1 17.9 11.7 21.4 2.9 11.8 11.6 19.6 6.1 8.5Processing industry -0.9 -1.1 -1.2 9.4 9.2 7.1 4.3 2.6 3.2 7.5 3.7 4.1Processing of agricultural products -0.3 -1.0 0.2 3.9 3.1 3.7 4.5 -0.1 2.6 1.0 1.0 0.3Textile and sewing industry -0.1 -0.3 -2.3 1.4 0.6 0.5 0.3 0.6 2.3 0.0 2.9 0.0Coal production, oil refinery -0.7 0.1 -9.5 9.4 3.3 0.9 7.1 10.3 12.9 29.0 12.7 10.5Chemical industry 0.2 0.3 -1.0 6.4 3.4 0.3 4.3 0.2 -2.4 -1.6 -1.5 -0.1Manufacturing of rubber and plastic products 0.0 0.0 0.0 0.5 0.1 0.2 0.0 0.0 0.1 0.1 0.0 0.0Metallurgical industry and metal working -1.9 -2.3 1.3 16.0 18.1 13.0 4.1 2.3 1.3 5.2 1.8 3.7Manufacturing of machinery and equipment 0.3 0.9 0.6 4.3 -0.1 1.4 0.0 -0.2 0.1 0.2 0.5 0.4Electricity, gas, and water supply -0.1 0.2 0.3 0.0 0.9 0.6 1.3 0.3 -0.1 0.1 0.1 0.0
2000 Total 0.9 2.0 2.2 -1.2 -2.2 3.1 1.7 1.8 3.9 2.2 0.9 2.7Mining and extraction industry 1.7 5.5 5.8 -2.8 -9.0 11.2 3.8 1.1 10.0 4.8 2.3 5.1Extraction of crude oil and natural gas 1.7 6.2 7.8 -3.4 -11.1 14.8 4.8 1.2 12.9 5.6 2.6 5.7Processing industry 1.0 0.4 0.5 -0.6 1.7 -0.8 0.8 3.0 1.1 0.7 0.0 1.6Processing of agricultural products 0.1 0.0 -0.1 -0.1 3.6 1.4 1.0 -0.5 0.8 1.0 0.7 1.1Textile and sewing industry 0.5 0.2 0.2 0.2 0.8 0.3 0.1 0.7 0.4 0.0 0.5 1.0Coal production, oil refinery -1.8 -6.2 -2.9 0.0 2.5 0.1 1.7 20.8 3.0 5.1 5.6 4.6Chemical industry 3.1 1.4 -0.9 1.9 3.7 0.4 -0.7 -2.4 0.2 0.0 0.7 -0.7Manufacturing of rubber and plastic products 0.0 4.9 6.1 0.0 -4.6 0.0 0.3 0.1 0.0 0.0 0.1 0.2Metallurgical industry and metal working 2.3 2.4 1.8 -1.4 0.9 -2.5 0.7 1.7 0.9 -0.6 -2.4 1.5Manufacturing of machinery and equipment 0.8 0.2 -0.8 1.0 -0.2 -0.4 0.0 -0.3 0.5 -0.2 1.9 0.1Electricity, gas, and water supply -0.5 0.2 0.0 0.4 0.0 0.0 0.3 0.1 0.0 1.0 0.1 0.0
2001 Total -8.5 2.0 1.3 -3.7 0.0 1.1 -0.3 -2.0 0.5 0.1 -1.6 -3.4Mining and extraction industry -18.0 5.4 3.0 -7.8 2.4 3.5 -1.9 -2.8 1.9 -1.0 -3.3 -5.9Extraction of crude oil and natural gas -20.4 5.9 3.5 -9.0 2.5 4.2 -2.2 -3.4 1.8 -1.7 -4.1 -7.1Processing industry -1.2 -0.3 0.0 -1.0 -2.0 -0.7 0.4 -1.9 -0.6 0.9 -0.8 -2.2Processing of agricultural products 0.4 0.8 1.1 0.3 0.5 1.0 0.5 -0.1 -0.2 0.0 0.6 -0.1Textile and sewing industry 0.3 0.2 0.2 0.2 0.0 0.4 0.3 0.0 0.2 1.7 0.3 0.1Coal production, oil refinery -1.8 -3.6 -4.3 -4.5 -2.5 -0.2 8.1 0.2 1.1 2.8 -0.8 -16.2Chemical industry 0.6 -0.8 1.2 2.0 -0.8 -1.2 1.3 1.5 1.2 0.3 -0.3 0.1Manufacturing of rubber and plastic products 0.1 0.3 0.1 0.1 0.1 1.3 0.4 0.1 0.2 0.1 0.1 0.3Metallurgical industry and metal working -1.9 0.1 0.6 -0.9 -3.2 -1.7 -1.7 -4.0 -1.6 0.8 -1.7 0.7Manufacturing of machinery and equipment -0.1 0.6 0.7 -0.8 0.9 0.4 1.3 0.1 -0.3 0.1 0.0 -0.1Electricity, gas, and water supply 1.0 -0.1 0.0 0.6 0.0 0.0 2.7 0.0 0.1 0.5 0.9 0.3
2002 Total -4.6 0.6 2.1 3.9 3.5 0.2 2.5 1.7 2.1 2.4 -1.6 -1.1Mining and extraction industry -9.2 1.1 2.2 8.2 6.5 0.1 3.7 3.3 4.8 4.8 -2.8 -3.0Extraction of crude oil and natural gas -11.0 1.0 2.3 9.1 7.3 0.4 4.1 3.6 5.9 5.6 -3.2 -3.5Processing industry -1.7 0.3 2.5 0.5 1.1 0.4 1.5 0.3 -0.4 0.0 -0.5 1.0Processing of agricultural products 0.3 0.4 -0.3 -0.1 -0.5 -0.5 -0.3 -0.2 -0.1 -0.3 -0.3 0.1Textile and sewing industry 0.9 2.1 2.1 0.0 0.1 -0.1 0.0 0.0 0.4 0.4 2.1 0.0Coal production, oil refinery -3.4 -5.7 0.0 -0.3 -0.2 0.8 -0.1 2.1 0.6 0.4 -0.2 -0.1Chemical industry 0.8 0.6 -1.0 1.2 1.6 -1.0 0.4 0.5 0.4 -0.3 -0.2 0.3Manufacturing of rubber and plastic products 0.2 0.7 0.7 0.7 0.1 0.5 0.0 -0.2 0.2 0.0 -0.1 2.2Metallurgical industry and metal working -2.5 1.8 4.6 1.1 2.2 0.7 2.8 0.1 -0.9 0.0 -0.8 1.8Manufacturing of machinery and equipment 0.3 0.5 0.2 -1.4 0.3 0.1 -0.1 0.0 -0.2 0.0 0.1 -0.3Electricity, gas, and water supply 2.2 0.4 0.3 0.6 0.4 0.1 1.5 0.0 0.0 0.4 0.1 0.0
2003 TotalMining and extraction industry 5.6 2.8 3.0 -6.7 -5.5 -4.6 2.9 2.8 2.9 -1.2 2.5 -0.8Extraction of crude oil and natural gas 7.3 3.2 3.6 -8.6 -6.9 -5.9 3.6 3.3 3.3 -1.9 2.8 -0.9Processing industry 2.1 1.4 0.3 1.9 -1.0 -1.5 0.8 0.7 0.5 1.7 1.5 1.3Processing of agricultural products 0.1 -0.5 -0.1 -0.1 0.4 0.5 0.5 0.3 0.7 1.4 1.5 1.3Textile and sewing industry 0.1 0.1 0.2 0.0 0.2 0.0 0.0 0.2 0.1 0.4 16.6 0.0Coal production, oil refinery 1.5 2.2 -0.3 -0.8 -1.5 0.0 -0.4 0.5 -0.2 -0.6 1.0 -0.2Chemical industry 0.2 -0.4 -0.6 -0.4 0.3 1.2 -0.2 -0.1 0.4 0.4 0.6 -0.3Manufacturing of rubber and plastic products 0.2 0.0 0.6 1.1 0.0 0.0 0.0 -0.8 -0.2 0.2 0.4 0.2Metallurgical industry and metal working 4.1 2.8 0.7 4.0 -2.2 -3.5 1.5 1.2 0.9 2.9 1.1 2.0Manufacturing of machinery and equipment 0.0 -0.3 0.0 1.9 0.0 0.0 -0.2 0.0 -1.6 0.4 1.0 1.4Electricity, gas, and water supply 0.9 0.3 0.0 0.7 0.0 -0.3 -0.9 0.1 0.0 1.8 0.4 0.0
Memorandum items:Total 1999 -6.5 -8.5 -8.4 -1.3 7.2 16.4 20.9 26.9 32.8 44.5 51.2 57.2Total 2000 60.2 65.5 69.3 56.0 41.4 35.5 33.7 31.0 31.1 23.7 20.9 19.4Total 2001 8.3 8.3 7.3 4.6 6.9 4.9 2.8 -1.1 -4.3 -6.4 -8.7 -14.1
Total 2002 -10.4 -11.6 -10.9 -3.9 -0.6 -1.5 1.3 5.1 6.8 9.3 9.3 11.9Total 2003 21.5 23.1 22.5 15.1 8.0 4.8 3.8 3.7 3.1 1.1 4.6 5.9
Source: National Statistical Agency.
(Percentage change over previous year)
(Percentage change over previous month)
Table 4. Kazakhstan: Wholesale Prices, 1999–2003

- 7 -
Jan. Feb. Mar. Apr. May Jun. Jul. Aug. Sep. Oct. Nov. Dec.
1999 Crude oil 3,756 3,538 3,697 4,770 5,629 7,020 7,691 8,845 10,163 12,409 13,290 14,553Natural gas 818 821 828 649 656 660 677 676 683 691 726 751Electricity 2,380 2,380 2,390 2,390 2,400 2,410 2,430 2,430 2,430 2,440 2,440 2,440Coal 468 489 484 485 518 517 516 530 518 512 512 514Gasoline 12,584 12,648 10,000 12,221 12,840 12,840 16,602 19,098 22,949 27,385 29,583 31,186Diesel 9,398 9,492 8,932 10,049 10,310 10,516 9,948 11,089 11,921 14,639 16,293 20,497Mazuth 3,086 3,095 3,080 3,182 3,235 3,235 2,984 3,293 4,102 6,254 7,512 7,579Heating (Gcal) 1,138 1,138 1,139 1,134 1,138 1,142 1,160 1,163 1,163 1,161 1,159 1,159Liquid petroleum gas (mt) 4,117 3,592 3,494 3,891 3,945 4,502 3,928 3,134 3,335 3,409 4,688 4,796
2000 Crude oil 14,862 15,268 16,327 15,729 13,642 15,941 16,763 16,552 18,778 19,715 20,289 20,401Natural gas 620 653 799 646 667 698 701 777 779 835 909 957Electricity 2,460 2,400 2,400 2,410 2,410 2,410 2,410 2,410 2,400 2,410 2,410 2,410Coal 579 576 563 552 550 542 537 535 526 525 525 516Gasoline 30,643 26,900 24,451 24,429 26,305 26,322 26,403 32,214 31,427 31,790 33,790 34,505Diesel 19,716 18,473 18,683 18,621 19,590 19,601 20,344 24,671 26,846 28,276 30,057 31,767Mazuth 7,978 7,843 7,914 7,913 7,067 7,071 7,075 9,399 9,790 10,841 10,597 11,109Heating (Gcal) 1,234 1,235 1,234 1,236 1,236 1,236 1,238 1,238 1,238 1,272 1,271 1,271Liquid petroleum gas (mt) 7,199 7,769 7,404 7,294 7,224 7,230 7,236 9,075 10,919 10,918 12,163 12,515
2001 Crude oil 15,179 16,150 16,727 15,171 15,603 16,221 15,795 15,229 15,501 15,206 14,546 13,567Natural gas 1,111 1,157 1,200 1,214 1,208 1,207 1,207 1,213 1,212 1,209 1,331 1,265Electricity 2,630 2,630 2,630 2,640 2,640 2,640 2,640 2,640 2,640 2,642 2,654 2,660Coal 425 440 460 458 475 477 456 464 496 544 562 594Gasoline 35,400 33,782 31,419 27,755 29,515 30,508 33,742 33,837 34,915 34,979 35,127 27,937Diesel 32,057 31,080 30,313 29,124 24,946 23,363 26,276 26,333 26,494 28,487 27,088 21,402Mazuth 9,890 8,634 7,674 7,671 7,146 7,186 8,754 8,776 8,882 9,838 9,867 5,450Heating (Gcal) 1,423 1,423 1,423 1,421 1,421 1,421 1,427 1,427 1,427 1,427 1,427 1,427Liquid petroleum gas (mt) 13,301 13,319 12,121 12,129 12,175 13,425 15,176 15,222 15,279 15,310 15,367 14,215
2002 Crude oil 11,910 12,012 12,446 13,763 14,642 14,510 15,145 15,761 16,606 17,554 16,818 15,791Natural gas 1,288 1,440 1,441 1,443 1,444 1,445 1,447 1,449 1,358 1,356 1,336 1,341Electricity 2,774 2,787 2,802 2,831 2,861 2,861 2,897 2,900 2,900 2,900 2,903 2,903Coal 603 599 592 590 592 592 591 590 586 588 584 579Gasoline 26,720 23,437 22,294 22,200 22,062 22,209 22,050 22,991 23,361 23,589 23,523 23,147Diesel 19,786 18,362 18,141 18,044 17,853 18,534 18,534 18,463 18,557 18,186 18,128 18,012Mazuth 5,447 5,499 5,417 5,270 5,355 5,312 5,312 5,875 5,875 6,054 6,054 6,054Heating (Gcal) 1,354 1,352 1,359 1,361 1,360 1,361 1,361 1,361 1,361 1,376 1,376 1,376Liquid petroleum gas (mt) 13,038 13,182 13,182 13,182 13,184 13,039 13,039 13,196 13,196 13,196 13,196 13,196
2003 Crude oil 17,232 17,880 17,821 16,236 15,287 14,319 14,866 15,258 15,715 15,452 15,766 15,605Natural gas 1,504 1,581 1,569 1,576 1,573 1,558 1,546 1,547 1,580 1,581 1,564 1,568Electricity 2,902 2,905 2,905 2,915 2,921 2,918 2,895 2,897 2,897 3,002 3,014 2,997Coal 578 574 561 570 571 562 563 562 570 577 576 592Gasoline 23,311 23,440 23,254 22,938 22,696 22,667 22,466 22,418 22,419 22,256 23,039 23,037Diesel 18,319 18,841 18,770 18,553 18,553 18,420 18,286 18,547 18,599 18,316 18,245 18,245Mazuth 5,989 5,989 5,989 5,989 5,989 5,989 5,989 5,989 5,989 5,989 5,989 5,989Heating (Gcal) 1,369 1,564 1,559 1,654 1,403 1,404 1,355 1,357 1,279 1,369 1,359 1,359Liquid petroleum gas (mt) 13,200 13,200 13,200 13,200 13,200 13,200 13,200 13,200 13,200 13,200 13,200 13,200
Source: National Statistical Agency.1/ Producers' ex-factory prices. Average prices for all customers.
Table 5. Kazakhstan: Energy Prices, 1999–2003 1/

- 8 -
1999 2000 2001 2002 2003Preliminary
Total 6,105 6,201 6,699 6,709 6,968Agriculture and forestry 1,335 1,941 2,366 2,367 2,494Fishing 7 8 13 14 17Total industry 905 855 830 824 847
of which: Mining 129 137 167 167 187Manufacturing 628 573 514 504 492Electricity, gas, and water: production and distribution 148 146 150 153 169
Construction 211 226 264 268 339Trade, repair of cars and household goods 1,398 971 1,006 1,007 990Hotels and restaurants 70 61 54 57 71Transport and communication 576 550 506 504 506Financial sector 36 40 46 50 55Real estate 211 226 214 203 164Public administration 344 314 281 280 325Education 513 531 576 589 629Health and social services 320 292 287 293 296Community, social, and personal service activities 172 181 183 186 193Services to households 8 6 71 67 43
Total 100.0 100.0 100.0 100.0 100.0Agriculture and forestry 21.9 31.3 35.3 35.3 35.8Fishing 0.1 0.1 0.2 0.2 0.2Total industry 14.8 13.8 12.4 12.3 12.2
of which:Mining 2.1 2.2 2.5 2.5 2.7Manufacturing 10.3 9.2 7.7 7.5 7.0Electricity, gas, and water: production and distribution 2.4 2.4 2.2 2.3 2.4
Construction 3.4 3.6 3.9 4.0 4.9Trade, repair of cars and household goods 22.9 15.7 15.0 15.0 14.2Hotels and restaurants 1.1 1.0 0.8 0.8 1.0Transport and communication 9.4 8.9 7.6 7.5 7.3Financial sector 0.6 0.6 0.7 0.7 0.8Real estate 3.5 3.6 3.2 3.0 2.4Public administration 5.6 5.1 4.2 4.2 4.7Education 8.4 8.6 8.6 8.8 9.0Health and social services 5.2 4.7 4.3 4.4 4.2Community, social, and personal service activities 2.8 2.9 2.7 2.8 2.8Services to households 0.1 0.1 1.1 1.0 0.6
Source: National Statistical Agency. 1/ Includes self-employment.
Table 6. Kazakhstan: Employment, 1999–2003 1/
(Thousands)
(In percent of total)
- 9 -
Q1
Q2
Q3
Q4
Q1
Q2
Q3
Q4
Q1
Q2
Q3
Q4
Q1
Q2
Q3
Q4
Q1
Q2
Q3
Q4
Ope
ratio
n of
em
ploy
men
t offi
ces
N
umbe
r of j
ob p
lace
men
t inq
uirie
s (th
ousa
nds)
35.7
26.1
28.4
30.6
41.2
30.4
25.2
25.9
30.2
30.1
25.7
24.9
44.4
33.5
23.5
19.5
25.0
23.8
22.0
27.7
N
umbe
r of p
eopl
e pl
aced
in jo
bs (t
hous
ands
)6.
54.
65.
67.
67.
311
.812
.011
.48.
914
.113
.411
.38.
914
.314
.511
.79.
515
.714
.911
.5
Num
ber o
f vac
anci
es (t
hous
ands
)6.
67.
08.
27.
88.
711
.012
.510
.78.
712
.913
.611
.59.
913
.914
.411
.911
.412
.611
.811
.3
Num
ber o
f re
gist
ered
une
mpl
oyed
(tho
usan
ds)
245.
123
7.1
239.
524
8.6
286.
627
8.5
256.
523
8.6
242.
123
4.5
222.
821
6.1
265.
725
6.1
220.
219
3.7
192.
317
2.0
153.
814
2.8
(in
perc
ent o
f eco
nom
ical
ly a
ctiv
e po
pula
tion)
3.8
3.7
3.8
3.9
4.5
4.3
4.0
3.7
3.4
3.1
2.9
2.9
3.6
3.6
2.9
2.6
2.6
2.4
2.0
1.8
Tota
l une
mpl
oym
ent (
thou
sand
s) 1
/…
……
950.
095
0.0
908.
089
0.2
877.
590
2.4
746.
471
5.1
757.
777
8.6
679.
662
5.1
679.
669
9.3
671.
864
1.9
669.
4
(in p
erce
nt o
f eco
nom
ical
ly a
ctiv
e po
pula
tion)
……
…13
.513
.713
.012
.412
.212
.79.
89.
210
.210
.89.
08.
39.
39.
78.
68.
28.
7
Sour
ces:
Nat
iona
l Sta
tistic
al A
genc
y; a
nd M
inis
try o
f Lab
or a
nd S
ocia
l Pro
tect
ion.
1/ In
clud
es e
stim
ates
for t
he u
nreg
iste
red
unem
ploy
ed. O
nly
annu
al n
umbe
rs a
re a
vaila
ble
for 1
999.
Tabl
e 7.
Kaz
akhs
tan:
Lab
or M
arke
t, 19
99–2
003
1999
2000
2001
2002
2003

- 10 -
Jan.
Feb.
Mar
.A
pr.
May
Jun.
Jul.
Aug
.Se
p.O
ct.
Nov
.D
ec.
1999 M
inim
um w
age
2,44
02,
440
2,44
02,
650
2,65
02,
650
2,65
02,
650
2,65
02,
680
2,68
02,
680
Ave
rage
wag
e
9,69
99,
802
10,5
8010
,712
10,8
9211
,450
11,9
1011
,661
12,1
8412
,648
12,7
8014
,430
Real
wag
e in
dex
in p
erce
nt o
f pre
viou
s mon
th86
101
108
9710
010
010
398
104
103
9911
1A
vera
ge w
age
(in U
.S. d
olla
rs)
124
123
109
104
8081
7573
8371
7191
2000 M
inim
um w
age
2,68
02,
680
2,68
02,
680
2,68
02,
680
2,68
02,
680
2,68
02,
680
2,68
02,
680
Ave
rage
wag
e
11,7
9612
,039
13,2
2313
,240
13,3
0013
,987
14,0
4014
,068
14,1
9914
,543
14,3
7816
,886
Real
wag
e in
dex
in p
erce
nt o
f pre
viou
s mon
th80
102
110
100
100
104
100
100
100
101
9711
6A
vera
ge w
age
(in U
.S. d
olla
rs)
8586
9494
9498
9899
100
102
100
117
2001 M
inim
um w
age
3,48
43,
484
3,48
43,
484
3,48
43,
484
3,48
43,
484
3,48
43,
484
3,48
43,
484
Ave
rage
wag
e
15,1
6915
,516
16,1
7016
,286
16,8
8117
,288
17,7
9117
,726
17,9
1818
,348
17,8
9221
,183
Real
wag
e in
dex
in p
erce
nt o
f pre
viou
s mon
th89
102
104
100
103
102
103
100
101
102
9711
7A
vera
ge w
age
(in U
.S. d
olla
rs)
105
107
111
112
116
118
121
121
122
124
121
142
2002 M
inim
um w
age
4,18
14,
181
4,18
14,
181
4,18
14,
181
4,18
14,
181
4,18
14,
181
4,18
14,
181
Ave
rage
wag
e
18,0
7818
,302
20,0
7019
,502
20,1
3920
,303
20,4
7920
,477
20,6
2021
,171
20,8
2724
,388
Real
wag
e in
dex
in p
erce
nt o
f pre
viou
s mon
th85
101
109
9710
210
010
010
010
110
297
116
Ave
rage
wag
e (in
U.S
. dol
lars
)12
012
113
212
813
213
313
313
313
413
713
515
7
2003 M
inim
um w
age
5,00
05,
000
5,00
05,
000
5,00
05,
000
5,00
05,
000
5,00
05,
000
5,00
05,
000
Ave
rage
wag
e20
,973
21,0
8522
,429
22,4
6722
,665
23,3
9423
,496
23,4
0123
,566
24,3
9323
,721
28,1
92Re
al w
age
inde
x in
per
cent
of p
revi
ous m
onth
8510
010
610
010
110
310
099
100
102
9611
8A
vera
ge w
age
(in U
.S. d
olla
rs)
135
137
148
148
150
157
160
160
159
165
161
194
Sour
ces:
Nat
iona
l Sta
tistic
al A
genc
y; a
nd F
und
staf
f est
imat
es.
Tabl
e 8.
Kaz
akhs
tan:
Nom
inal
and
Rea
l Wag
es, 1
999–
2003
(In
teng
e pe
r mon
th, u
nles
s oth
erw
ise in
dica
ted)

- 11 -
(In tenge)
1999 2000 2001 2002 2003
Total average 11,864 14,374 17,303 20,323 23,221
Agriculture and forestry 4,600 5,657 6,851 8,163 9,650Fishing 5,917 6,812 7,562 8,685 9,847Total industry 16,370 20,647 23,812 25,280 29,699
of which:Mining 24,659 32,059 36,625 40,045 45,707Manufacturing 13,821 17,717 19,982 22,130 24,918Electricity, gas and water: production and distribution 15,651 17,290 20,026 21,594 23,550
Construction 15,905 21,017 26,805 32,453 33,951Trade, car repair, and household goods 10,766 12,961 15,366 18,931 23,077Hotels and restaurants 13,736 15,979 21,511 32,743 39,840Transport and communication 14,696 18,788 24,412 28,969 34,421Financial sector 33,392 36,140 41,686 50,460 56,592Real estate 12,338 16,672 22,132 29,329 36,851Public administration 11,308 11,758 14,970 16,930 18,066Education 8,149 8,512 9,937 12,863 14,432Health and social services 6,821 7,267 8,288 10,863 12,198Other municipal, social, and personal services 10,097 12,857 16,873 21,078 24,383
Source: National Statistical Agency. 1/ Data are not comparable with monthly wages in Table 8, since only the annual data are revised when new information becomes available.
Table 9. Kazakhstan: Monthly Wages by Sector, 1999–2003 1/

- 12 -
19
9920
0020
01To
tal
Publ
icTo
tal
Publ
icTo
tal
Publ
icTo
tal
Publ
icTo
tal
Publ
ic
Tota
l inv
estm
ent
150
8828
114
440
623
155
830
750
733
8
Indu
stry
175
2536
840
413
155
490
4140
120
Agr
icul
ture
4050
380
5042
040
055
216
131
194
Tran
spor
t and
com
mun
icat
ion
6198
314
6445
927
259
012
764
924
Con
stru
ctio
n1,
044
143
2,01
794
33,
222
986
3,91
82,
107
4,00
83,
452
Trad
e an
d ca
terin
g51
248
31,
502
433
1,80
015
02,
904
183
945
1,26
2H
ousi
ng11
047
286
244
105
3515
562
238
135
So
urce
s: N
atio
nal S
tatis
tical
Age
ncy;
and
Fun
d st
aff e
stim
ates
.
1/ P
rices
def
late
d by
sect
oral
pric
e in
dice
s cal
cula
ted
by th
e N
atio
nal S
tatis
tical
Age
ncy.
Tabl
e 10
. Kaz
akhs
tan:
Inde
x of
Inve
stm
ent i
n C
onst
ant P
rices
, 199
9–20
03 1
/(1
997
= 10
0)
2003
2002

- 13 -
1999
2000
2001
2002
2003
Prel
imin
ary
Tota
l10
0.0
100.
010
0.0
100.
010
0.0
Agr
icul
ture
, hun
ting,
and
fore
stry
0.7
1.4
1.3
1.4
0.9
Min
ing
indu
str y
42.0
49.8
44.3
41.5
36.5
Man
ufac
turin
g in
dust
r y12
.212
.011
.19.
49.
4Pr
oduc
tion
and
dist
ribut
ion
of e
lect
ric p
ower
, gas
, and
wat
er5.
33.
02.
92.
52.
2C
onst
ruct
ion
3.7
3.6
4.3
4.6
5.2
Trad
e, c
ar re
pair,
and
hou
seho
ld g
oods
5.8
3.5
3.3
4.3
1.5
Hot
els a
nd re
stau
rant
s1.
30.
50.
20.
30.
1Tr
ansp
ort a
nd c
omm
unic
atio
n7.
59.
511
.111
.113
.4Fi
nanc
ial s
ecto
r1.
81.
61.
30.
90.
9Re
al e
stat
e8.
89.
711
.512
.614
.5Pu
blic
sect
or7.
53.
26.
79.
713
.9Ed
ucat
ion
0.3
0.7
0.8
0.7
0.7
Hea
lth a
nd so
cial
sect
ors
0.9
0.2
0.4
0.4
0.2
Oth
er m
unic
ipal
, soc
ial,
and
pers
onal
serv
ices
2.2
1.3
0.8
0.6
0.6
Sour
ce:
Nat
iona
l Sta
tistic
al A
genc
y.
Tabl
e 11
. Kaz
akhs
tan:
Sec
tora
l Com
posit
ion
of C
apita
l Inv
estm
ent i
n C
urre
nt P
rices
, 199
9–20
03
(In
perc
ent o
f tot
al in
vest
men
t)

- 14 -
1999 2000 2001 2002 2003Preliminary
Consumption 80.7 73.3 73.3 71.3 67.4
Net exports 2.3 8.6 -0.9 0.9 6.2
Investment 17.1 18.1 27.6 27.8 26.4Public 1.7 2.0 3.1 3.4 4.6Private 13.8 15.3 21.3 21.1 19.0
Change in inventories 1.5 0.8 3.3 3.3 2.7
Savings 17.1 18.1 27.6 27.8 26.4Domestic savings 16.9 21.3 23.6 24.3 26.2
Public -2.7 1.5 6.5 5.4 9.0Private 19.5 19.8 17.0 19.0 17.1
Foreign savings 0.1 -3.2 4.0 3.5 0.2
Sources: Kazakhstani authorities; and Fund staff estimates.1/ Data for 2000-02 include adjustments to reflect revisions of the balance of payments by theNational Bank and the staff. 2003 values are staff estimates based on preliminary data for GDP byproduction, balance of payments, and investment from enterprise surveys.
(In percent of GDP by final use)
Table 12. Kazakhstan: Savings Investment Balance, 1999–2003 1/

- 15 -
19
9920
0020
01
Dec
Dec
Dec
Mar
Jun
Sep
Dec
Mar
Jun
Sep
Dec
Net
fore
ign
asse
ts21
1.5
302.
037
7.9
400.
043
4.0
483.
948
8.5
595.
366
4.5
733.
371
5.2
Net
dom
estic
ass
ets
-85.
2-1
67.4
-201
.6-2
44.2
-258
.0-2
98.4
-280
.2-3
88.9
-409
.0-4
36.0
-398
.3D
omes
tic c
redi
t24
.3-4
7.0
-71.
9-1
11.0
-115
.9-9
1.0
-113
.4-2
31.4
-264
.7-2
79.7
-245
.8N
et c
redi
t to
gove
rnm
ent
13.3
-14.
1-5
9.5
-91.
6-8
6.1
-56.
7-5
6.0
-120
.3-8
5.6
-74.
4-4
9.6
Cre
dit t
o ba
nks (
net)
-1.6
-38.
8-5
.4-4
.6-7
.8-1
1.4
-24.
6-6
2.3
-107
.7-9
9.8
-88.
5C
redi
t to
the
econ
omy
12.7
6.0
-7.0
-14.
8-2
2.0
-22.
9-3
2.7
-48.
9-7
1.5
-105
.5-1
07.7
Oth
er it
ems n
et
-109
.6-1
20.4
-129
.7-1
33.1
-142
.1-2
07.4
-166
.8-1
57.5
-144
.3-1
56.3
-152
.5
Rese
rve
mon
e y12
6.2
134.
717
6.3
155.
817
6.0
185.
520
8.3
206.
425
5.5
297.
231
7.0
Cur
renc
y ou
tsid
e N
B K11
0.4
116.
314
5.5
135.
914
6.9
155.
417
7.9
175.
820
6.1
238.
626
2.1
Com
mer
cial
ban
k de
posi
ts13
.314
.028
.317
.725
.926
.129
.428
.145
.653
.453
.2 D
eman
d, ti
me
and
ente
rpris
e de
posi
ts2.
54.
32.
62.
23.
14.
00.
92.
53.
95.
21.
7
Mem
oran
dum
item
s:
Tota
l res
erve
s1,
540.
22,
093.
73,
746.
63,
931.
84,
486.
64,
801.
55,
053.
05,
922.
37,
180.
27,
702.
78,
564.
3
Net
inte
rnat
iona
l res
erve
s1,
540.
22,
093.
72,
506.
22,
625.
42,
831.
03,
132.
03,
135.
73,
923.
34,
492.
54,
928.
84,
961.
2
Nat
iona
l Fun
d of
the
Repu
blic
of K
azak
hsta
n 1/
......
1,24
0.4
1,30
6.3
1,65
5.6
1,66
9.6
1,91
7.3
1,99
9.0
2,68
7.7
2,77
3.9
3,60
3.1
Rese
rve
mon
ey
P
erce
ntag
e ch
ange
from
end
of p
revi
ous q
uarte
r ...
...10
.8-1
1.6
12.9
5.4
12.2
-0.9
23.8
16.3
6.6
1
2-m
onth
per
cent
age
chan
ge56
.96.
730
.918
.622
.416
.718
.132
.545
.260
.252
.2
Sour
ce: N
atio
nal B
ank
of K
azak
hsta
n.1/
Tra
nsito
ry d
epos
its in
teng
e no
t inc
lude
d.
(In
mill
ions
of U
.S.d
olla
rs, e
.o.p
.)
Tabl
e 13
. Kaz
akhs
tan:
Sum
mar
y A
ccou
nts o
f the
Nat
iona
l Ban
k of
Kaz
akhs
tan,
199
9-20
03
(In
billi
ons o
f ten
ge; e
nd-p
erio
d st
ocks
unl
ess o
ther
wise
indi
cate
d)
2002
2003

- 16 -
1999
2000
2001
D
ecD
ecD
ecM
arJu
nSe
pD
ecM
arJu
nSe
pD
ec
Nat
iona
l Ban
k of
Kaz
akhs
tan
Net
fore
ign
asse
ts21
1.5
302.
037
7.9
400.
043
4.0
483.
948
9.2
595.
366
4.5
733.
371
5.2
Net
dom
estic
ass
ets
-8
5.2
-167
.4-2
01.6
-244
.2-2
58.0
-298
.3-2
80.9
-388
.9-4
09.0
-436
.0-3
98.3
Dom
estic
cre
dit
24
.3-4
7.0
-71.
9-1
11.0
-115
.9-9
1.0
-111
.4-2
31.4
-264
.7-2
79.7
-245
.8C
redi
t to
gove
rnm
ent
13.3
-14.
1-5
9.5
-91.
6-8
6.1
-56.
7-5
4.1
-120
.3-8
5.6
-74.
4-4
9.6
Cre
dit t
o ba
nks
0.4
-38.
8-5
.4-4
.6-7
.8-1
1.4
-24.
6-6
2.3
-107
.7-9
9.8
-88.
5C
redi
t to
the
rest
of t
he e
cono
my
10.7
6.0
-7.0
-14.
8-2
2.0
-22.
9-3
2.7
-48.
9-7
1.5
-105
.5-1
07.7
Oth
er it
ems (
net)
-109
.6-1
20.4
-129
.7-1
33.1
-142
.1-2
07.4
-169
.5-1
57.5
-144
.3-1
56.3
-152
.5
Rese
rve
mon
e y12
6.2
134.
717
6.3
155.
817
6.0
185.
520
8.3
206.
425
5.5
297.
231
7.0
Cur
renc
y ou
tsid
e N
BK11
0.4
116.
314
5.5
135.
914
6.9
155.
417
7.9
175.
820
6.1
238.
626
2.1
Dep
osits
15.8
18.3
30.8
19.9
29.1
30.1
30.4
30.6
49.4
58.6
54.9
Bank
ing
syst
emN
et fo
reig
n as
sets
251.
830
6.0
313.
833
2.8
346.
239
9.8
402.
847
6.7
480.
551
9.4
426.
2
Net
dom
estic
ass
ets
22.6
101.
126
7.1
243.
229
5.0
298.
339
8.9
369.
248
7.4
576.
665
7.7
D
omes
tic c
redi
t 20
7.9
346.
756
0.1
544.
961
6.8
692.
278
1.2
756.
487
6.9
1,01
7.0
1,13
3.4
Net
cre
dit t
o go
vern
men
t 37
.840
.68.
8-1
3.2
13.0
44.7
40.6
-15.
213
.049
.354
.7
C
redi
t to
the
econ
omy
170.
130
6.1
547.
655
2.2
599.
664
3.9
738.
876
7.2
858.
096
3.4
1,07
5.7
Cla
ims o
n lo
cal g
over
nmen
t...
...3.
86.
04.
33.
61.
84.
45.
94.
23.
0
Cap
ital a
ccou
nts a
nd o
ther
item
s net
-185
.3-2
45.6
-293
.0-3
01.7
-321
.8-3
93.9
-382
.3-3
87.2
-389
.5-4
40.4
-475
.7
Broa
d m
one y
272.
339
9.5
570.
455
7.7
615.
767
1.7
765.
079
3.0
892.
398
4.9
969.
9
Cur
renc
y in
circ
ulat
ion
103.
510
6.4
131.
212
3.9
135.
014
1.4
161.
715
9.2
190.
021
8.0
238.
7
Dep
osits
168.
929
3.0
439.
243
3.8
480.
753
0.4
603.
363
3.8
702.
376
6.9
731.
2
Teng
e de
posi
ts88
.614
3.6
173.
416
8.6
188.
322
3.8
241.
728
3.6
363.
738
7.3
386.
8
Fore
ign
exch
ange
dep
osits
80.3
149.
426
5.9
265.
229
2.4
306.
636
1.6
350.
133
8.6
379.
634
4.4
NBK
Not
es o
utsi
de th
e ba
nkin
g sy
stem
2.
07.
610
.618
.425
.526
.436
.853
.075
.511
1.2
114.
0
Mem
oran
dum
item
s:N
et in
tern
atio
nal r
eser
ves (
in m
illio
ns o
f U.S
. dol
lars
)1,
540.
22,
093.
72,
506.
22,
625.
42,
831.
03,
132.
03,
140.
23,
923.
34,
492.
54,
928.
84,
961.
2N
FRK
(in
mill
ions
of U
.S. d
olla
rs) 1
/...
...1,
269.
81,
306.
31,
655.
61,
669.
61,
917.
31,
999.
02,
687.
72,
773.
93,
603.
1
Ann
ual g
row
th ra
tes (
in p
erce
nt)
B
road
mon
ey84
.445
.642
.833
.231
.525
.834
.142
.244
.946
.626
.8
Cur
renc
y in
circ
ulat
ion
50.6
2.8
23.3
21.5
22.1
13.8
23.3
28.5
40.8
54.2
47.6
R
eser
ve m
oney
56.9
5.3
30.9
18.6
22.4
16.7
18.2
32.5
45.2
60.2
52.2
C
redi
t to
the
econ
omy
51.1
81.0
78.9
64.8
46.8
39.8
34.9
38.9
43.1
49.6
45.6
Sour
ce: N
atio
nal B
ank
of K
azak
hsta
n.
1/ T
rans
itory
dep
osits
in te
nge
not i
nclu
ded.
Tabl
e 14
. Kaz
akhs
tan:
Mon
etar
y Su
rvey
, 199
9-20
03(I
n bi
llion
s of t
enge
; end
-per
iod
stoc
ks u
nles
s oth
erw
ise in
dica
ted)
2003
2002

- 17 -
Inflation NBK Refinance Yield on 3-Month Commercial Bank Short- Commercial Bank Time Deposit Rates 2/12-Month Average Rate Treasury Bills 1/ Term Lending Rates 2/ Households Legal Entities
1999 January 1.0 25.0 26.3 18.3 17.2 10.7February -0.3 25.0 26.3 19.8 17.4 13.8March -1.2 25.0 26.3 22.5 18.8 15.2April 2.8 25.0 ... 24.7 13.3 12.0May 3.9 25.0 ... 24.2 13.1 9.1June 9.8 25.0 ... 25.1 14.1 9.7July 11.2 22.0 21.6 25.6 16.2 8.1August 11.9 20.0 21.6 24.9 16.5 5.6September 12.8 20.0 ... 26.7 25.6 8.7October 14.3 20.0 ... 28.1 18.7 9.4November 16.3 18.0 16.6 23.3 20.2 7.9December 17.8 18.0 16.6 21.4 13.4 7.9
2000 January 19.8 18.0 16.7 19.7 16.5 9.4February 20.2 18.0 16.4 21.9 16.7 10.1March 20.4 16.0 16.0 22.3 10.5 6.7April 15.6 16.0 15.6 22.0 17.6 6.4May 14.7 16.0 14.6 20.7 20.0 7.5June 10.2 14.0 13.1 20.3 16.5 7.8July 9.5 14.0 12.6 20.2 18.6 4.1August 10.0 14.0 9.9 19.4 18.0 4.4September 9.8 14.0 9.5 20.2 16.2 5.0October 10.4 14.0 7.6 20.6 15.5 6.2November 10.2 14.0 7.5 18.2 15.9 6.4December 9.8 14.0 6.8 19.9 15.6 6.1
2001 January 8.2 14.0 6.7 18.8 16.4 3.7February 8.8 12.5 6.6 18.6 14.7 7.6March 9.6 12.5 5.6 20.2 15.7 7.7April 9.2 12.5 5.4 19.8 14.6 6.5May 9.3 12.5 5.2 20.2 14.7 6.2June 9.2 12.0 5.0 18.1 13.9 6.4July 9.1 12.0 4.9 17.0 14.4 4.5August 9.0 12.0 4.8 18.2 14.4 5.8September 8.9 11.0 5.1 18.8 13.7 5.7October 8.7 11.0 5.4 18.1 13.8 5.1November 8.5 9.0 ... 17.1 13.6 5.5December 8.4 9.0 ... 16.4 12.8 5.6
2002 January 6.0 9.0 5.3 14.5 13.1 5.3February 5.8 9.0 ... 16.1 12.5 5.2March 5.6 8.0 ... 16.2 11.2 5.1April 5.4 8.0 5.3 15.7 11.5 5.0May 5.4 8.0 5.3 16.1 11.3 4.8June 5.5 8.0 ... 15.3 11.1 4.7July 5.6 8.0 ... 15.6 11.3 5.1August 5.7 8.0 ... 21.3 10.2 4.9September 5.7 8.0 ... 15.7 9.4 5.5October 5.8 8.0 ... 15.6 10.8 5.3November 5.8 7.5 ... 17.1 12.0 5.3December 5.9 7.5 ... 14.5 11.0 5.4
2003 January 6.9 7.5 ... 14.6 11.2 5.2February 7.0 7.5 ... 16.0 11.3 5.3March 7.0 7.5 ... 15.9 10.9 5.0April 7.0 7.5 ... 17.6 9.5 5.4May 6.9 7.5 ... 16.6 11.2 4.4June 6.7 7.5 ... 15.7 11.1 3.5July 6.4 7.0 ... 17.2 10.9 3.8August 6.3 7.0 ... 16.6 9.9 3.8September 6.3 7.0 6.0 16.9 10.5 3.7October 6.3 7.0 ... 15.5 10.0 2.8November 6.4 7.0 ... 15.7 10.0 3.0December 6.4 7.0 ... 15.5 10.9 3.5
Source: National Bank of Kazakhstan.1/ The absence of entry indicates that T-bills were not issued.2/ Rates on new credits and deposits in tenge.
Table 15. Kazakhstan: Interest Rates, 1999–2003(In percent; end-of-period)

- 18 -
Period Average End-of-Period Period Average End-of-Period Period Average End-of-Period
1999 January 84.57 85.12 ... ... ... ...February 85.71 86.45 ... ... ... ...March 87.42 88.10 ... ... ... ...April 113.80 114.80 62.16 62.10 ... ...May 119.14 129.03 67.44 69.31 ... ...June 131.88 132.31 70.08 70.30 ... ...July 132.45 131.91 69.96 72.40 ... ...August 131.81 132.26 71.61 71.08 ... ...September 135.78 140.11 73.16 76.40 ... ...October 141.21 140.22 77.43 75.65 ... ...November 139.16 137.90 73.64 71.41 ... ...December 138.19 138.25 71.77 71.50 ... ...
2000 January 139.06 139.38 72.15 70.78 ... ...February 139.90 140.44 70.77 71.20 ... ...March 141.42 141.95 70.24 70.30 ... ...April 142.21 142.01 69.47 66.78 ... ...May 142.29 142.30 66.63 65.90 ... ...June 142.65 142.86 68.70 68.70 ... ...July 142.79 142.71 69.32 69.50 ... ...August 142.60 142.52 65.92 65.75 ... ...September 142.69 142.58 63.28 62.44 ... ...October 142.57 142.58 63.81 62.50 ... ...November 144.01 144.15 ... ... ... ...December 144.98 145.40 65.40 65.30 ... ...
2001 January 145.38 145.11 ... ... ... ...February 145.33 145.28 ... ... 5.07 5.07March 145.48 145.42 68.25 68.25 5.08 5.06April 145.54 145.77 ... ... 5.04 5.05May 146.13 146.47 65.86 65.86 5.05 5.03June 146.59 146.80 ... ... 5.04 5.04July 146.76 147.07 ... ... 5.02 5.02August 147.17 147.30 ... ... 5.03 5.03September 147.70 147.80 ... ... 5.01 5.02October 148.03 148.13 132.85 132.85 5.01 5.01November 148.56 148.95 130.80 130.80 5.00 4.97December 150.32 150.94 ... ... 5.00 5.00
2002 January 151.62 151.87 ... ... 4.96 4.95February 152.02 152.12 ... ... 4.92 4.92March 152.22 152.44 133.03 133.55 4.90 4.90April 152.75 152.99 ... ... 4.90 4.91May 152.96 153.18 ... ... 4.91 4.91June 153.13 153.27 ... ... 4.87 4.86July 153.90 154.26 ... ... 4.88 4.88August 154.31 154.53 ... ... 4.89 4.89September 154.52 154.72 ... ... 4.88 4.89October 154.41 154.47 ... ... 4.87 4.89November 154.38 154.88 ... ... 4.86 4.86December 155.68 155.85 ... ... 4.89 4.90
2003 January 155.34 154.83 ... ... ... ...February 153.34 151.66 166.31 164.50 4.85 4.80March 151.52 152.10 161.55 161.55 4.81 4.81April 151.98 151.76 163.70 163.70 ... ...May 150.98 150.41 ... ... 4.90 4.90June 149.01 147.68 170.80 170.80 4.90 4.88July 146.96 146.76 ... ... ... ...August 146.72 147.47 ... ... ... ...September 148.00 148.97 166.51 166.63 ... ...October 147.82 147.77 174.51 175.22 ... ...November 146.99 146.63 174.86 174.86 ... ...December 144.70 143.33 178.49 178.84 4.90 4.90
Source: National Bank of Kazakhstan.1/ The absence of entry indicates that trade did not take place.2/ Tenge per Deutsche Mark up to May 2001.
Table 16. Kazakhstan: Stock Exchange (KASE) Weighted Average Exchange Rates, 1999–2003 1/(End-of-period)
Tenge per U.S. dollar Tenge per Euro 2/ Tenge per Russian ruble

- 19 -
BranchesState and Other Total 1/ Total
Interstate 1/ Total Subsidiaries
1999 2 22 12 31 55 426
2000 January 2 22 12 30 54 426 February 2 22 12 29 53 423 March 2 21 12 29 52 427 April 2 19 12 27 48 418 May 2 20 12 26 48 419 June 2 20 12 26 48 414 July 2 19 11 26 47 418 August 2 19 11 26 47 419 September 2 18 11 27 47 419 October 2 18 11 27 47 419 November 2 19 12 27 48 418 December 2 16 12 30 48 418
2001 January 2 16 12 29 47 420 February 2 16 12 29 47 422 March 2 16 12 28 46 422 April 2 16 12 29 47 424 May 2 16 12 26 44 425 June 2 16 12 26 44 425 July 2 16 12 26 44 422 August 2 15 12 27 44 422 September 2 16 12 27 45 423 October 3 16 12 27 46 423 November 3 16 12 27 46 419 December 3 16 11 25 44 400
2002 January 3 16 11 24 43 401 February 3 16 11 23 42 403 March 3 15 11 24 42 381 April 3 16 11 23 42 382 May 3 16 11 22 41 367 June 3 15 11 21 39 368 July 2 15 11 21 38 368 August 2 16 11 20 38 368 September 2 16 11 20 38 369 October 2 17 11 19 38 369 November 2 17 11 19 38 366 December 2 17 11 19 38 368
2003 January 2 16 10 20 38 368 February 2 15 9 21 38 369 March 2 15 9 21 38 367 April 2 16 10 18 36 368 May 2 15 10 18 35 367 June 2 16 10 17 35 366 July 2 16 10 17 35 358 August 2 16 10 17 35 358 September 3 16 10 17 36 358 October 3 16 10 17 36 359 November 3 16 10 17 36 359 December 3 16 10 17 36 355
Source: National Bank of Kazakhstan.1/ Including Development Bank, which does not take deposits from the public, and Eximbank which was
privatized in February 2004.
Table 17. Kazakhstan: Number of Commercial Banks and Branches, 1999–2003(End-of-period)
Commercial BanksWith Foreign Capital
- 20 -
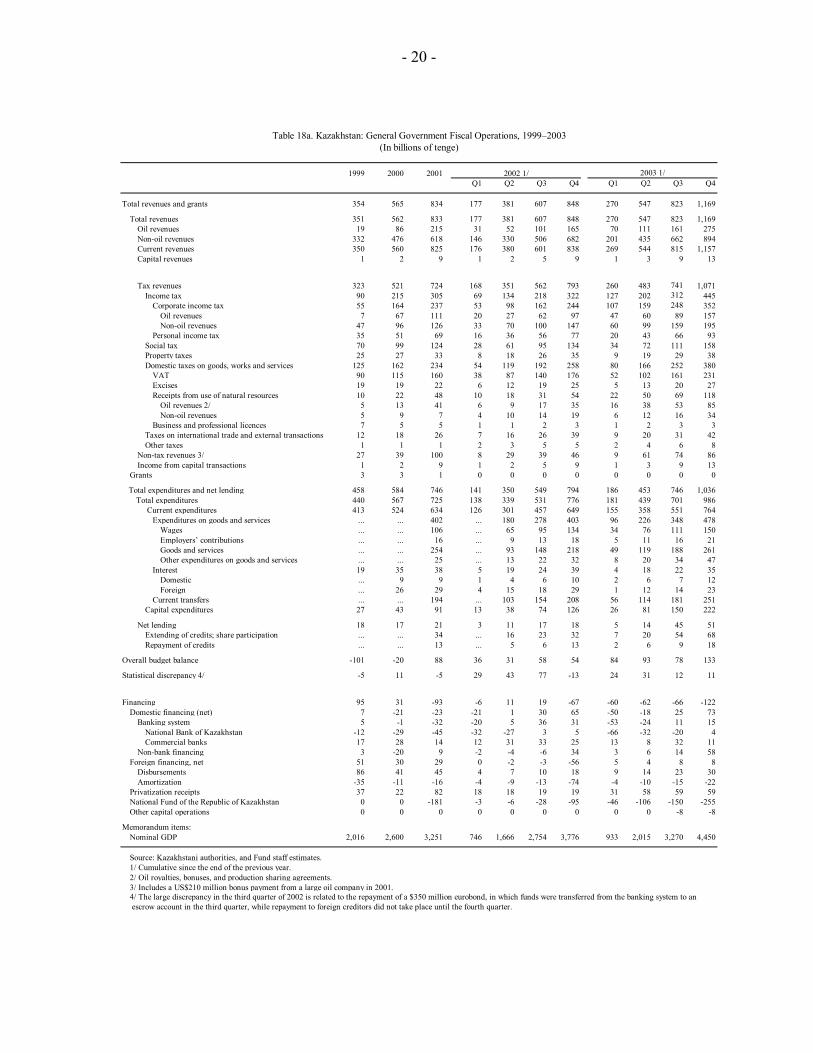
1999 2000 2001 2002 1/Q1 Q2 Q3 Q4 Q1 Q2 Q3 Q4
Total revenues and grants 354 565 834 177 381 607 848 270 547 823 1,169
Total revenues 351 562 833 177 381 607 848 270 547 823 1,169Oil revenues 19 86 215 31 52 101 165 70 111 161 275Non-oil revenues 332 476 618 146 330 506 682 201 435 662 894Current revenues 350 560 825 176 380 601 838 269 544 815 1,157Capital revenues 1 2 9 1 2 5 9 1 3 9 13
Tax revenues 323 521 724 168 351 562 793 260 483 741 1,071Income tax 90 215 305 69 134 218 322 127 202 312 445
Corporate income tax 55 164 237 53 98 162 244 107 159 248 352Oil revenues 7 67 111 20 27 62 97 47 60 89 157Non-oil revenues 47 96 126 33 70 100 147 60 99 159 195
Personal income tax 35 51 69 16 36 56 77 20 43 66 93Social tax 70 99 124 28 61 95 134 34 72 111 158Property taxes 25 27 33 8 18 26 35 9 19 29 38Domestic taxes on goods, works and services 125 162 234 54 119 192 258 80 166 252 380
VAT 90 115 160 38 87 140 176 52 102 161 231Excises 19 19 22 6 12 19 25 5 13 20 27Receipts from use of natural resources 10 22 48 10 18 31 54 22 50 69 118
Oil revenues 2/ 5 13 41 6 9 17 35 16 38 53 85Non-oil revenues 5 9 7 4 10 14 19 6 12 16 34
Business and professional licences 7 5 5 1 1 2 3 1 2 3 3Taxes on international trade and external transactions 12 18 26 7 16 26 39 9 20 31 42Other taxes 1 1 1 2 3 5 5 2 4 6 8
Non-tax revenues 3/ 27 39 100 8 29 39 46 9 61 74 86Income from capital transactions 1 2 9 1 2 5 9 1 3 9 13
Grants 3 3 1 0 0 0 0 0 0 0 0
Total expenditures and net lending 458 584 746 141 350 549 794 186 453 746 1,036 Total expenditures 440 567 725 138 339 531 776 181 439 701 986 Current expenditures 413 524 634 126 301 457 649 155 358 551 764
Expenditures on goods and services ... ... 402 ... 180 278 403 96 226 348 478Wages ... ... 106 ... 65 95 134 34 76 111 150Employers’ contributions ... ... 16 ... 9 13 18 5 11 16 21Goods and services ... ... 254 ... 93 148 218 49 119 188 261Other expenditures on goods and services ... ... 25 ... 13 22 32 8 20 34 47
Interest 19 35 38 5 19 24 39 4 18 22 35Domestic ... 9 9 1 4 6 10 2 6 7 12Foreign ... 26 29 4 15 18 29 1 12 14 23
Current transfers ... ... 194 ... 103 154 208 56 114 181 251Capital expenditures 27 43 91 13 38 74 126 26 81 150 222
Net lending 18 17 21 3 11 17 18 5 14 45 51Extending of credits; share participation ... ... 34 ... 16 23 32 7 20 54 68Repayment of credits ... ... 13 ... 5 6 13 2 6 9 18
Overall budget balance -101 -20 88 36 31 58 54 84 93 78 133
Statistical discrepancy 4/ -5 11 -5 29 43 77 -13 24 31 12 11
Financing 95 31 -93 -6 11 19 -67 -60 -62 -66 -122Domestic financing (net) 7 -21 -23 -21 1 30 65 -50 -18 25 73
Banking system 5 -1 -32 -20 5 36 31 -53 -24 11 15National Bank of Kazakhstan -12 -29 -45 -32 -27 3 5 -66 -32 -20 4Commercial banks 17 28 14 12 31 33 25 13 8 32 11
Non-bank financing 3 -20 9 -2 -4 -6 34 3 6 14 58Foreign financing, net 51 30 29 0 -2 -3 -56 5 4 8 8
Disbursements 86 41 45 4 7 10 18 9 14 23 30Amortization -35 -11 -16 -4 -9 -13 -74 -4 -10 -15 -22
Privatization receipts 37 22 82 18 18 19 19 31 58 59 59National Fund of the Republic of Kazakhstan 0 0 -181 -3 -6 -28 -95 -46 -106 -150 -255Other capital operations 0 0 0 0 0 0 0 0 0 -8 -8
Memorandum items:Nominal GDP 2,016 2,600 3,251 746 1,666 2,754 3,776 933 2,015 3,270 4,450
Source: Kazakhstani authorities, and Fund staff estimates.1/ Cumulative since the end of the previous year.2/ Oil royalties, bonuses, and production sharing agreements.3/ Includes a US$210 million bonus payment from a large oil company in 2001.4/ The large discrepancy in the third quarter of 2002 is related to the repayment of a $350 million eurobond, in which funds were transferred from the banking system to an escrow account in the third quarter, while repayment to foreign creditors did not take place until the fourth quarter.
2003 1/
Table 18a. Kazakhstan: General Government Fiscal Operations, 1999–2003(In billions of tenge)

- 21 -
1999 2000 2001 2002 1/Q1 Q2 Q3 Q4 Q1 Q2 Q3 Q4
Total revenues and grants 17.5 21.7 25.7 23.7 22.9 22.0 22.5 29.0 27.1 25.2 26.3
Total revenues 17.4 21.6 25.6 23.7 22.9 22.0 22.5 29.0 27.1 25.2 26.3Oil revenues 1.0 3.3 6.6 4.1 3.1 3.7 4.4 7.5 5.5 4.9 6.2Non-oil revenues 16.5 18.3 19.0 19.6 19.8 18.4 18.1 21.5 21.6 20.2 20.1Current revenues 17.4 21.5 25.4 23.6 22.8 21.8 22.2 28.9 27.0 24.9 26.0Capital revenues 0.0 0.1 0.3 0.1 0.1 0.2 0.3 0.1 0.1 0.3 0.3
Tax revenues 16.0 20.0 22.3 22.5 21.1 20.4 21.0 27.9 24.0 22.7 24.1Income tax 4.5 8.3 9.4 9.3 8.0 7.9 8.5 13.6 10.0 9.5 10.0
Corporate income tax 2.7 6.3 7.3 7.1 5.9 5.9 6.5 11.4 7.9 7.6 7.9Oil revenues 0.4 2.6 3.4 2.6 1.6 2.2 2.6 5.0 3.0 2.7 3.5Non-oil revenues 2.3 3.7 3.9 4.5 4.2 3.6 3.9 6.5 4.9 4.9 4.4
Personal income tax 1.8 2.0 2.1 2.2 2.2 2.0 2.0 2.2 2.1 2.0 2.1Social tax 3.5 3.8 3.8 3.7 3.7 3.5 3.5 3.6 3.6 3.4 3.5Property taxes 1.2 1.0 1.0 1.1 1.1 0.9 0.9 1.0 0.9 0.9 0.9Domestic taxes on goods, works and services 6.2 6.2 7.2 7.3 7.2 7.0 6.8 8.5 8.2 7.7 8.5
VAT 4.4 4.4 4.9 5.1 5.2 5.1 4.7 5.5 5.1 4.9 5.2Excises 0.9 0.7 0.7 0.8 0.7 0.7 0.7 0.6 0.6 0.6 0.6Receipts from use of natural resources 0.5 0.8 1.5 1.3 1.1 1.1 1.4 2.4 2.5 2.1 2.7
Oil revenues 2/ 0.2 0.5 1.3 0.7 0.5 0.6 0.9 1.7 1.9 1.6 1.9Non-oil revenues 0.3 0.4 0.2 0.5 0.6 0.5 0.5 0.7 0.6 0.5 0.8
Business and professional licences 0.3 0.2 0.1 0.1 0.1 0.1 0.1 0.1 0.1 0.1 0.1Taxes on international trade and external transactions 0.6 0.7 0.8 0.9 1.0 1.0 1.0 1.0 1.0 1.0 1.0Other taxes 0.1 0.0 0.0 0.2 0.2 0.2 0.1 0.2 0.2 0.2 0.2
Non-tax revenues 3/ 1.3 1.5 3.1 1.1 1.7 1.4 1.2 1.0 3.0 2.3 1.9Income from capital transactions 0.0 0.1 0.3 0.1 0.1 0.2 0.3 0.1 0.1 0.3 0.3
Grants 0.1 0.1 0.0 0.0 0.0 0.0 0.0 0.0 0.0 0.0 0.0
Total expenditure and net lending 22.7 22.5 23.0 18.9 21.0 19.9 21.0 19.9 22.5 22.8 23.3Total expenditures 21.8 21.8 22.3 18.6 20.4 19.3 20.5 19.4 21.8 21.4 22.2
Current expenditures 20.5 20.2 19.5 16.8 18.1 16.6 17.2 16.6 17.8 16.8 17.2Expenditures on goods and services ... ... 12.4 ... 10.8 10.1 10.7 10.3 11.2 10.7 10.7
Wages ... ... 3.3 ... 3.9 3.5 3.5 3.6 3.8 3.4 3.4Employers’ contributions ... ... 0.5 ... 0.6 0.5 0.5 0.5 0.5 0.5 0.5Goods and services ... ... 7.8 ... 5.6 5.4 5.8 5.2 5.9 5.8 5.9Other expenditures on goods and services ... ... 0.8 ... 0.8 0.8 0.9 0.9 1.0 1.0 1.0
Interest 1.0 1.4 1.2 0.7 1.1 0.9 1.0 0.4 0.9 0.7 0.8Domestic ... 0.4 0.3 0.2 0.3 0.2 0.3 0.2 0.3 0.2 0.3Foreign ... 1.0 0.9 0.5 0.9 0.7 0.8 0.2 0.6 0.4 0.5
Current transfers ... … 6.0 … 6.2 5.6 5.5 6.0 5.7 5.5 5.6Capital expenditures 1.4 1.6 2.8 1.7 2.3 2.7 3.3 2.8 4.0 4.6 5.0
Net lending 0.9 0.7 0.7 0.3 0.6 0.6 0.5 0.6 0.7 1.4 1.1Extending of credits; share participation ... ... 1.0 … 0.9 0.8 0.8 0.8 1.0 1.7 1.5Repayment of credits ... ... 0.4 … 0.3 0.2 0.4 0.2 0.3 0.3 0.4
Overall budget balance -5.0 -0.8 2.7 4.8 1.9 2.1 1.4 9.0 4.6 2.4 3.0
Statistical discrepancy 4/ -0.3 0.4 -0.2 3.4 2.0 2.9 -0.4 2.6 1.6 0.4 0.2
Financing 4.7 1.2 -2.9 -1.3 0.2 0.8 -1.8 -6.4 -3.1 -2.0 -2.7Domestic financing (net) 0.4 -0.8 -0.7 -2.9 0.1 1.1 1.7 -5.4 -0.9 0.8 1.6
Banking system 0.2 0.0 -1.0 -2.6 0.3 1.3 0.8 -5.7 -1.2 0.3 0.3National Bank of Kazakhstan -0.6 -1.1 -1.4 -4.3 -1.6 0.1 0.1 -7.1 -1.6 -0.6 0.1Commercial banks 0.8 1.1 0.4 1.7 1.9 1.2 0.7 1.4 0.4 1.0 0.2
Non-bank financing 0.1 -0.8 0.3 -0.2 -0.2 -0.2 0.9 0.3 0.3 0.4 1.3Foreign financing, net 2.6 1.2 0.9 0.0 -0.1 -0.1 -1.5 0.6 0.2 0.2 0.2
Disbursements 4.3 1.6 1.4 0.5 0.4 0.4 0.5 1.0 0.7 0.7 0.7Amortization -1.7 -0.4 -0.5 -0.5 -0.5 -0.5 -2.0 -0.4 -0.5 -0.5 -0.5
Privatization receipts 1.8 0.8 2.5 2.4 1.1 0.7 0.5 3.3 2.9 1.8 1.3National Fund of the Republic of Kazakhstan 0.0 0.0 -5.6 -0.9 -0.9 -0.9 -2.5 -4.9 -5.3 -4.6 -5.7
Other capital operations ... 0.0 0.0 0.0 0.0 0.0 0.0 0.0 0.0 -0.2 -0.2
Memorandum items:Nominal GDP (in billions of tenge) 2,016 2,600 3,251 746 1,666 2,754 3,776 933 2,015 3,270 4,450
Source: Kazakhstani authorities, Fund staff estimates.1/ Cumulative since the end of the previous year.2/ Oil royalties, bonuses, and production sharing agreements.3/ Includes a US$210 million bonus payment from a large oil company in 2001.4/ The large discrepancy in the third quarter of 2002 is related to the repayment of a $350 million eurobond, in which funds were transferred from the banking system to an escrow account in the third quarter, while repayment to foreign creditors did not take place until the fourth quarter.
2003 1/
Table 18b. Kazakhstan: General Government Fiscal Operations, 1999–2003(In percent of GDP)

- 22 -
1999 2000 2001 2002 1/Q1 Q2 Q3 Q4 Q1 Q2 Q3 Q4
Total revenues and grants 172 297 497 111 239 389 545 193 381 568 814
Total revenues 169 294 497 111 239 389 545 193 381 568 814Oil revenues 8 46 203 28 44 89 149 67 106 152 262Non-oil revenues 161 249 294 83 194 300 397 126 275 416 552Current revenues 168 292 491 111 238 386 540 193 380 563 807Capital revenues 1 2 6 0 0 3 6 0 1 4 6
Tax revenues 152 263 402 104 212 350 498 185 322 472 727Income tax 28 83 158 53 98 162 244 107 159 224 352
Corporate income tax 27 82 158 53 98 162 244 107 159 211 273Oil revenues 4 34 111 20 27 62 97 47 60 89 157Non-oil revenues 24 48 48 33 70 100 147 60 99 122 116
Personal income tax 1 1 0 0 0 0 0 0 0 0 0Social tax 2 20 0 0 0 0 0 0 0 0 0Property taxes 1 1 0 0 0 0 0 0 0 0 0Domestic taxes on goods, works and services 108 141 216 44 97 159 213 68 142 215 331
VAT 81 103 151 36 83 134 167 50 98 154 222Excises 15 15 18 1 1 3 4 1 3 4 6Receipts from the use of natural resources 9 21 47 7 12 22 42 17 41 56 102
Oil revenues 2/ 4 ... 41 6 9 17 35 16 38 47 79Non-oil revenues 5 ... 6 1 3 5 7 1 3 9 23
Business and professional licences 3 1 1 0 0 0 1 0 0 0 0Taxes on international trade and external transactions 11 18 26 7 16 26 39 9 20 31 42Other taxes 1 1 1 1 2 2 2 0 1 2 2
Non-tax revenues 3/ 16 29 89 7 26 36 42 8 58 91 80Income from capital transactions 1 2 6 0 0 3 6 0 1 4 6
Grants 2 3 0 0 0 0 0 0 0 0 0
Total expenditures and net lending and transfers 281 327 406 92 215 337 484 127 303 506 688Total expenditures and net lending 288 339 450 85 208 327 469 119 288 487 661
Total expenditures 266 322 435 79 197 311 453 112 275 442 610Current expenditures 249 310 376 ... 181 275 390 91 213 333 461
Expenditures on goods and services ... ... 180 ... 78 125 183 41 102 162 219Wages ... ... 36 ... 19 30 43 10 21 34 46Employers’ contributions ... ... 4 ... 2 3 4 1 2 3 4Goods and services ... ... 117 ... 46 72 107 24 60 94 126Other current expenditures ... ... 23 ... 12 20 30 5 15 23 31
Interest 21 35 37 ... 19 24 38 3 17 21 34Domestic ... ... 8 ... 4 5 9 2 5 7 11Foreign ... ... 29 ... 15 18 29 1 12 14 23
Current transfers ... ... 159 ... 84 126 169 46 94 150 208Capital expenditures 17 13 59 ... 16 36 63 21 62 109 149
of which : Capital transfers to other levels of government ... ... 8 ... 5 10 13 6 21 33 38
Net lending 21 17 15 6 11 16 16 8 13 45 51Extending of credits; share participation 27 8 15 20 27 10 19 52 66Repayment of credits 12 2 4 4 11 2 6 7 15
Net transfers to other levels of government -7 -12 -44 7 7 10 14 7 15 19 27Transfers from other levels of government 37 54 84 12 26 39 49 15 32 48 58Transfers to other levels of government 30 42 40 19 33 50 64 22 47 67 85Capital transfer from other levels of government ... ... ... ... 0 0 0 0 0 0 0
Overall budget balance (cash) -109 -30 92 19 24 52 62 67 78 62 139
Statistical discrepancy 4/ 0 0 -4 6 25 74 6 4 11 -8 14
Financing 109 30 -96 -13 2 22 -56 -63 -67 -69 -125Domestic financing (net) 24 -21 -23 -24 1 30 34 -53 -22 22 72
Banking system ... ... -32 -22 4 36 30 -56 -28 9 14National Bank of Kazakhstan ... ... -45 -32 -27 3 3 -66 -32 -20 4Commercial banks ... ... 14 10 31 33 26 10 4 29 10
Non-bank financing 9 -2 -4 -6 4 3 6 14 58Foreign financing, net 51 30 29 0 -2 -3 -56 5 4 8 8
Disbursements ... ... ... 4 7 10 18 9 14 23 …Amortization ... ... ... 4 9 13 74 4 10 15 …
Privatization receipts 34 21 81 18 18 18 18 31 57 58 58National Fund of the Republic of Kazakhstan (NFRK) 0 0 -182 -6 -15 -24 -53 -46 -106 -150 -255Other capital operations 0 0 0 0 0 0 0 0 0 -8 -8
Memorandum items:Nominal GDP 2,016 2,600 3,251 746 1,666 2,754 3,776 933 2,015 3,270 4,450
1/ Cumulative since the end of the previous year.2/ Oil royalties, bonuses, and production sharing agreements.3/ Includes a US$210 million bonus payment from a large oil company in 2001.4/ The large discrepancy in the third quarter of 2002 is related to the repayment of a $350 million eurobond, in which funds were transferred from the banking system to an escrow account in the third quarter, while repayment to foreign creditors did not take place until the fourth quarter.
Source: Kazakhstani authorities, Fund staff estimates.
2003 1/
Table 19a. Kazakhstan: Central Government Fiscal Operations, 1999–2003(In billions of tenge)
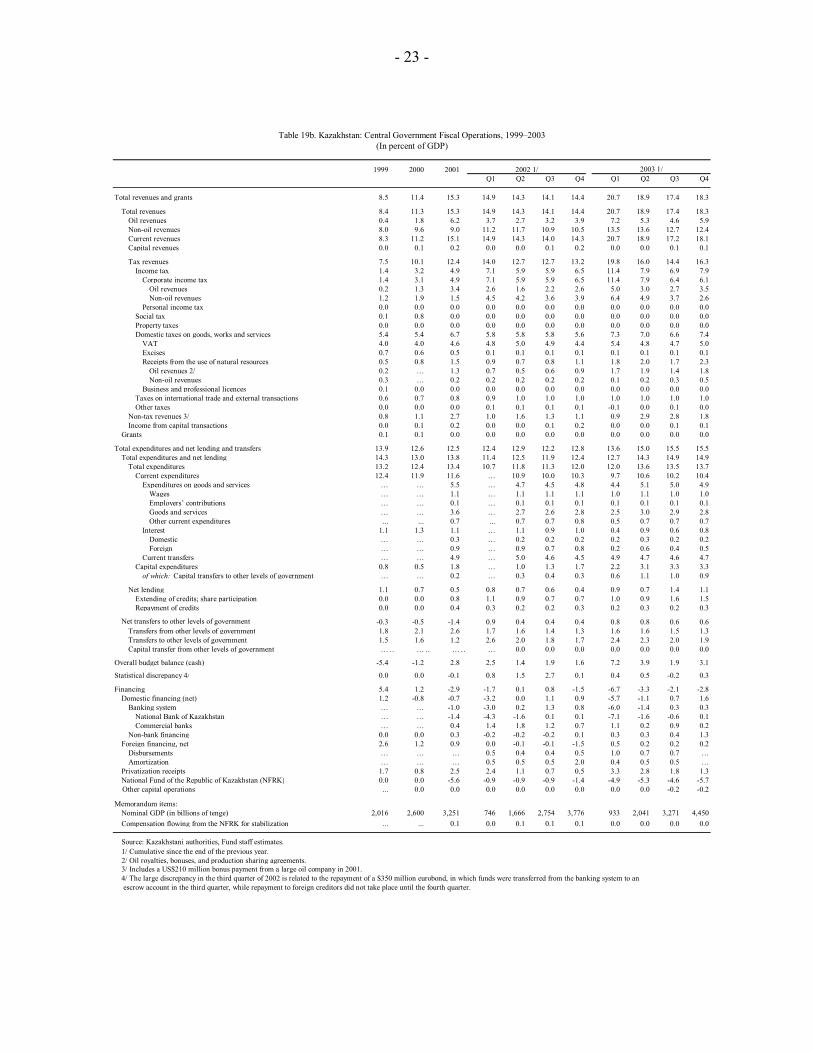
- 23 -
1999 2000 2001 2002 1/Q1 Q2 Q3 Q4 Q1 Q2 Q3 Q4
Total revenues and grants 8.5 11.4 15.3 14.9 14.3 14.1 14.4 20.7 18.9 17.4 18.3
Total revenues 8.4 11.3 15.3 14.9 14.3 14.1 14.4 20.7 18.9 17.4 18.3Oil revenues 0.4 1.8 6.2 3.7 2.7 3.2 3.9 7.2 5.3 4.6 5.9Non-oil revenues 8.0 9.6 9.0 11.2 11.7 10.9 10.5 13.5 13.6 12.7 12.4Current revenues 8.3 11.2 15.1 14.9 14.3 14.0 14.3 20.7 18.9 17.2 18.1Capital revenues 0.0 0.1 0.2 0.0 0.0 0.1 0.2 0.0 0.0 0.1 0.1
Tax revenues 7.5 10.1 12.4 14.0 12.7 12.7 13.2 19.8 16.0 14.4 16.3Income tax 1.4 3.2 4.9 7.1 5.9 5.9 6.5 11.4 7.9 6.9 7.9
Corporate income tax 1.4 3.1 4.9 7.1 5.9 5.9 6.5 11.4 7.9 6.4 6.1Oil revenues 0.2 1.3 3.4 2.6 1.6 2.2 2.6 5.0 3.0 2.7 3.5Non-oil revenues 1.2 1.9 1.5 4.5 4.2 3.6 3.9 6.4 4.9 3.7 2.6
Personal income tax 0.0 0.0 0.0 0.0 0.0 0.0 0.0 0.0 0.0 0.0 0.0Social tax 0.1 0.8 0.0 0.0 0.0 0.0 0.0 0.0 0.0 0.0 0.0Property taxes 0.0 0.0 0.0 0.0 0.0 0.0 0.0 0.0 0.0 0.0 0.0Domestic taxes on goods, works and services 5.4 5.4 6.7 5.8 5.8 5.8 5.6 7.3 7.0 6.6 7.4
VAT 4.0 4.0 4.6 4.8 5.0 4.9 4.4 5.4 4.8 4.7 5.0Excises 0.7 0.6 0.5 0.1 0.1 0.1 0.1 0.1 0.1 0.1 0.1Receipts from the use of natural resources 0.5 0.8 1.5 0.9 0.7 0.8 1.1 1.8 2.0 1.7 2.3
Oil revenues 2/ 0.2 … 1.3 0.7 0.5 0.6 0.9 1.7 1.9 1.4 1.8Non-oil revenues 0.3 … 0.2 0.2 0.2 0.2 0.2 0.1 0.2 0.3 0.5
Business and professional licences 0.1 0.0 0.0 0.0 0.0 0.0 0.0 0.0 0.0 0.0 0.0Taxes on international trade and external transactions 0.6 0.7 0.8 0.9 1.0 1.0 1.0 1.0 1.0 1.0 1.0Other taxes 0.0 0.0 0.0 0.1 0.1 0.1 0.1 -0.1 0.0 0.1 0.0
Non-tax revenues 3/ 0.8 1.1 2.7 1.0 1.6 1.3 1.1 0.9 2.9 2.8 1.8Income from capital transactions 0.0 0.1 0.2 0.0 0.0 0.1 0.2 0.0 0.0 0.1 0.1
Grants 0.1 0.1 0.0 0.0 0.0 0.0 0.0 0.0 0.0 0.0 0.0
Total expenditures and net lending and transfers 13.9 12.6 12.5 12.4 12.9 12.2 12.8 13.6 15.0 15.5 15.5Total expenditures and net lending 14.3 13.0 13.8 11.4 12.5 11.9 12.4 12.7 14.3 14.9 14.9
Total expenditures 13.2 12.4 13.4 10.7 11.8 11.3 12.0 12.0 13.6 13.5 13.7Current expenditures 12.4 11.9 11.6 … 10.9 10.0 10.3 9.7 10.6 10.2 10.4
Expenditures on goods and services … … 5.5 … 4.7 4.5 4.8 4.4 5.1 5.0 4.9Wages … … 1.1 … 1.1 1.1 1.1 1.0 1.1 1.0 1.0Employers’ contributions … … 0.1 … 0.1 0.1 0.1 0.1 0.1 0.1 0.1Goods and services … … 3.6 … 2.7 2.6 2.8 2.5 3.0 2.9 2.8Other current expenditures ... ... 0.7 ... 0.7 0.7 0.8 0.5 0.7 0.7 0.7
Interest 1.1 1.3 1.1 … 1.1 0.9 1.0 0.4 0.9 0.6 0.8Domestic … … 0.3 … 0.2 0.2 0.2 0.2 0.3 0.2 0.2Foreign … … 0.9 … 0.9 0.7 0.8 0.2 0.6 0.4 0.5
Current transfers … … 4.9 … 5.0 4.6 4.5 4.9 4.7 4.6 4.7Capital expenditures 0.8 0.5 1.8 … 1.0 1.3 1.7 2.2 3.1 3.3 3.3
of which: Capital transfers to other levels of government … … 0.2 … 0.3 0.4 0.3 0.6 1.1 1.0 0.9
Net lending 1.1 0.7 0.5 0.8 0.7 0.6 0.4 0.9 0.7 1.4 1.1Extending of credits; share participation 0.0 0.0 0.8 1.1 0.9 0.7 0.7 1.0 0.9 1.6 1.5Repayment of credits 0.0 0.0 0.4 0.3 0.2 0.2 0.3 0.2 0.3 0.2 0.3
Net transfers to other levels of government -0.3 -0.5 -1.4 0.9 0.4 0.4 0.4 0.8 0.8 0.6 0.6Transfers from other levels of government 1.8 2.1 2.6 1.7 1.6 1.4 1.3 1.6 1.6 1.5 1.3Transfers to other levels of government 1.5 1.6 1.2 2.6 2.0 1.8 1.7 2.4 2.3 2.0 1.9Capital transfer from other levels of government …… …… …… … 0.0 0.0 0.0 0.0 0.0 0.0 0.0
Overall budget balance (cash) -5.4 -1.2 2.8 2.5 1.4 1.9 1.6 7.2 3.9 1.9 3.1
Statistical discrepancy 4/ 0.0 0.0 -0.1 0.8 1.5 2.7 0.1 0.4 0.5 -0.2 0.3
Financing 5.4 1.2 -2.9 -1.7 0.1 0.8 -1.5 -6.7 -3.3 -2.1 -2.8Domestic financing (net) 1.2 -0.8 -0.7 -3.2 0.0 1.1 0.9 -5.7 -1.1 0.7 1.6
Banking system … … -1.0 -3.0 0.2 1.3 0.8 -6.0 -1.4 0.3 0.3National Bank of Kazakhstan … … -1.4 -4.3 -1.6 0.1 0.1 -7.1 -1.6 -0.6 0.1Commercial banks … … 0.4 1.4 1.8 1.2 0.7 1.1 0.2 0.9 0.2
Non-bank financing 0.0 0.0 0.3 -0.2 -0.2 -0.2 0.1 0.3 0.3 0.4 1.3Foreign financing, net 2.6 1.2 0.9 0.0 -0.1 -0.1 -1.5 0.5 0.2 0.2 0.2
Disbursements … … … 0.5 0.4 0.4 0.5 1.0 0.7 0.7 …Amortization … … … 0.5 0.5 0.5 2.0 0.4 0.5 0.5 …
Privatization receipts 1.7 0.8 2.5 2.4 1.1 0.7 0.5 3.3 2.8 1.8 1.3National Fund of the Republic of Kazakhstan (NFRK) 0.0 0.0 -5.6 -0.9 -0.9 -0.9 -1.4 -4.9 -5.3 -4.6 -5.7
Other capital operations ... 0.0 0.0 0.0 0.0 0.0 0.0 0.0 0.0 -0.2 -0.2
Memorandum items:Nominal GDP (in billions of tenge) 2,016 2,600 3,251 746 1,666 2,754 3,776 933 2,041 3,271 4,450Compensation flowing from the NFRK for stabilization ... ... 0.1 0.0 0.1 0.1 0.1 0.0 0.0 0.0 0.0
1/ Cumulative since the end of the previous year.2/ Oil royalties, bonuses, and production sharing agreements.3/ Includes a US$210 million bonus payment from a large oil company in 2001.4/ The large discrepancy in the third quarter of 2002 is related to the repayment of a $350 million eurobond, in which funds were transferred from the banking system to an escrow account in the third quarter, while repayment to foreign creditors did not take place until the fourth quarter.
Source: Kazakhstani authorities, Fund staff estimates.
Table 19b. Kazakhstan: Central Government Fiscal Operations, 1999–2003(In percent of GDP)
2003 1/

- 24 -
1999 2000 2001 2002 1/Q1 Q2 Q3 Q4 Q1 Q2 Q3 Q4
Total revenues and grants 180 268 337 65 143 218 302 77 166 256 356
Total revenues 182 268 336 65 143 218 302 77 166 256 356Oil revenues 11 40 12 3 7 12 16 3 6 9 13Non-oil revenues 171 227 324 63 135 206 286 74 160 247 343Current revenues 182 267 334 65 141 215 299 76 164 251 349Capital revenues 0 0 3 1 2 3 4 1 2 4 6
Tax revenues 171 258 322 64 139 212 295 76 161 247 344Income tax ... ... 147 16 36 56 77 20 43 66 93
Corporate income tax ... ... 78 0 0 0 0 0 0 0 0Oil revenues ... ... 0 0 0 0 0 0 0 0 0Non-oil revenues ... ... 78 0 0 0 0 0 0 0 0
Personal income tax ... ... 69 16 36 56 77 20 43 66 93Social tax ... ... 124 28 61 95 134 34 72 111 158Property taxes ... ... 33 8 18 26 35 9 19 29 38Domestic taxes on goods, works and services ... ... 18 11 23 33 45 11 24 37 49
VAT ... ... 9 2 5 6 10 2 4 7 9Excises ... ... 4 5 11 16 21 4 10 16 21Receipts from the use of natural resources ... ... 1 3 6 9 12 5 9 12 16
Oil revenues 2/ ... ... 0 0 0 0 0 0 0 0 0Non-oil revenues ... ... 1 3 6 9 12 5 9 12 16
Business and professional licences ... ... 4 0 1 2 2 1 1 2 3Taxes on international trade and external transactions ... ... 0 0 0 0 0 0 0 0 0Other taxes ... ... 0 1 2 2 3 1 3 4 5
Non-tax revenues 11 10 11 1 2 3 4 1 3 4 6Income from capital transactions 0 0 3 1 2 3 4 1 2 4 6
Grants -2 0 0 0 0 0 0 0 0 0 0
Total expenditures and net lending and transfers 171 257 340 68 139 216 310 63 151 244 354Total expenditures and net lending 165 245 304 ... 152 236 338 76 187 296 419
Total expenditures 169 245 298 ... 148 230 336 75 183 292 414Current expenditures 158 215 258 ... 121 183 259 64 145 218 302
Expenditures on goods and services ... ... 222 ... 102 153 219 54 124 186 259Wages ... ... 70 ... 46 65 91 24 54 77 104Employers’ contributions ... ... 13 ... 8 11 15 4 9 13 17Goods and services ... ... 137 ... 47 76 111 26 59 94 134Other current expenditures ... ... 3 ... 1 2 3 1 2 3 4
Interest 0 0 1 ... 0 1 1 0 0 1 1Domestic ... ... 1 ... 0 1 1 0 0 1 1Foreign ... ... 0 ... 0 0 0 0 0 0 0
Current transfers ... ... 35 ... 19 29 39 10 20 31 42Capital expenditures 11 30 41 ... 27 48 76 11 38 74 112
of which : Capital transfers to other levels of government ... ... ... ... 0 0 0
Net lending -4 0 6 ... 4 6 2 1 4 4 5Extending of credits; share participation ... ... 11 ... 5 8 9 2 6 7 7Repayment of credits ... ... 6 ... 1 2 7 1 1 3 2
Net transfers to other levels of government 7 12 36 ... -12 -20 -27 -13 -36 -52 -65Transfers from other levels of government 30 42 40 ... 33 50 64 22 47 67 85Transfers to other levels of government 37 54 84 ... 26 39 49 15 32 48 58Capital transfer from other levels of government ... ... 8 ... 5 10 13 6 21 33 38
Overall budget balance 9 11 -4 -3 3 2 -8 14 15 12 2
Statistical discrepancy 0 11 -3 ... 4 2 -9 17 20 16 2
Financing -9 1 1 3 1 0 -1 3 5 4 0Domestic financing (net) -11 0 0 2 1 0 -1 3 4 3 -1
Banking system ... ... 0 2 1 0 -1 3 4 3 1National Bank of Kazakhstan ... ... 0 0 0 0 0 0 0 0 0Commercial banks ... ... 0 2 1 0 -1 3 4 3 1
Non-bank financing ... ... 0 0 0 0 0 0 0 0 0Foreign financing, net 0 0 0 0 0 0 0 0 0 0 0
Disbursements ... ... ... ... ... ... ... … … … …Amortization ... ... ... ... ... ... ... … … … …
Privatization receipts 3 1 1 0 0 0 0 0 1 1 1National Fund of the Republic of Kazakhstan (NFRK) … … … … … … … .. .. .. ..
Memorandum items:Nominal GDP 2,016 2,600 3,251 746 1,666 2,754 3,776 933 2,041 3,271 4,450Compensation flowing from the NFRK for stabilization 2/ ... ... 2.8 0.0 0.0 0.0 0.0 0.0 0.0 0.0 0.0
1/ Cumulative since the end of the previous year.2/ Oil royalties, bonuses, and production sharing agreements.
Source: Kazakhstani authorities, Fund staff estimates.
Table 20a. Kazakhstan: Local Government Fiscal Operations, 1999–2003(In billions of tenge)
2003 1/

- 25 -
1999 2000 2001 2002 1/Q1 Q2 Q3 Q4
Total revenues and grants 8.9 10.3 10.4 8.8 8.6 7.9 8.0 8.2 8.1 7.8 8.0
Total revenues 9.0 10.3 10.3 8.8 8.6 7.9 8.0 8.2 8.1 7.8 8.0Oil revenues 0.5 1.5 0.4 0.4 0.4 0.4 0.4 0.3 0.3 0.3 0.3Non-oil revenues 8.5 8.7 10.0 8.4 8.1 7.5 7.6 7.9 7.9 7.6 7.7Current revenues 9.0 10.3 10.3 8.7 8.5 7.8 7.9 8.1 8.0 7.7 7.8Capital revenues 0.0 0.0 0.1 0.1 0.1 0.1 0.1 0.1 0.1 0.1 0.1
Tax revenues 8.5 9.9 9.9 8.5 8.3 7.7 7.8 8.1 7.9 7.6 7.7Income tax ... ... 4.5 2.2 2.2 2.0 2.0 2.1 2.1 2.0 2.1
Corporate income tax ... ... 2.4 0.0 0.0 0.0 0.0 0.0 0.0 0.0 0.0Oil revenues ... ... 0.0 0.0 0.0 0.0 0.0 0.0 0.0 0.0 0.0Non-oil revenues ... ... 2.4 0.0 0.0 0.0 0.0 0.0 0.0 0.0 0.0
Personal income tax ... ... 2.1 2.2 2.2 2.0 2.0 2.1 2.1 2.0 2.1Social tax ... ... 3.8 3.7 3.7 3.5 3.5 3.6 3.5 3.4 3.6Property taxes ... ... 1.0 1.1 1.1 0.9 0.9 1.0 0.9 0.9 0.9Domestic taxes on goods, works and services ... ... 0.6 1.4 1.4 1.2 1.2 1.2 1.2 1.1 1.1
VAT ... ... 0.3 0.3 0.3 0.2 0.3 0.2 0.2 0.2 0.2Excises ... ... 0.1 0.7 0.6 0.6 0.6 0.4 0.5 0.5 0.5Receipts from the use of natural resources ... ... 0.0 0.4 0.4 0.3 0.3 0.5 0.4 0.4 0.4
Oil revenues 2/ ... ... 0.0 0.0 0.0 0.0 0.0 0.0 0.0 0.0 0.0Non-oil revenues ... ... 0.0 0.4 0.4 0.3 0.3 0.5 0.4 0.4 0.4
Business and professional licences ... ... 0.1 0.1 0.1 0.1 0.1 0.1 0.0 0.1 0.1Taxes on international trade and external transactions ... ... 0.0 0.0 0.0 0.0 0.0 0.0 0.0 0.0 0.0Other taxes ... ... 0.0 0.1 0.1 0.1 0.1 0.1 0.1 0.1 0.1
Non-tax revenues 0.5 0.4 0.4 0.1 0.1 0.1 0.1 0.1 0.1 0.1 0.1Income from capital transactions 0.0 0.0 0.1 0.1 0.1 0.1 0.1 0.1 0.1 0.1 0.1
Grants -0.1 0.0 0.0 0.0 0.0 0.0 0.0 0.0 0.0 0.0 0.0
Total expenditure and net lending and transfers 8.5 9.9 10.5 9.1 8.4 7.8 8.2 6.8 7.4 7.4 8.0Total expenditures and net lending 8.2 9.4 9.4 … 9.1 8.6 8.9 8.1 9.2 9.0 9.4
Total expenditures 8.4 9.4 9.2 … 8.9 8.4 8.9 8.0 9.0 8.9 9.3Current expenditures 7.9 8.3 7.9 … 7.2 6.6 6.9 6.9 7.1 6.7 6.8
Expenditures on goods and services … … 6.8 … 6.1 5.6 5.8 5.8 6.1 5.7 5.8Wages … … 2.1 … 2.7 2.4 2.4 2.6 2.6 2.4 2.3Employers’ contributions … … 0.4 … 0.5 0.4 0.4 0.4 0.4 0.4 0.4Goods and services … … 4.2 … 2.8 2.7 2.9 2.8 2.9 2.9 3.0Other current expenditures … … 0.1 … 0.1 0.1 0.1 0.1 0.1 0.1 0.1
Interest 0.0 0.0 0.0 … 0.0 0.0 0.0 0.0 0.0 0.0 0.0Domestic .. .. 0.0 … 0.0 0.0 0.0 0.0 0.0 0.0 0.0Foreign .. .. 0.0 … 0.0 0.0 0.0 0.0 0.0 0.0 0.0
Current transfers .. .. 1.1 … 1.1 1.0 1.0 1.1 1.0 0.9 0.9Capital expenditures 0.5 1.1 1.2 … 1.6 1.7 2.0 1.2 1.9 2.3 2.5
of which: Capital transfers to other levels of government … … … … 0.0 0.0 0.0 0.0 0.0 0.0 0.0
Net lending -0.2 0.0 0.2 … 0.2 0.2 0.1 0.1 0.2 0.1 0.1Extending of credits; share participation … … 0.4 … 0.3 0.3 0.2 0.2 0.3 0.2 0.2Repayment of credits … … 0.2 … 0.1 0.1 0.2 0.1 0.0 0.1 0.0
Net transfers to other levels of government 0.3 0.5 1.1 … -0.7 -0.7 -0.7 -1.4 -1.8 -1.6 -1.5Transfers from other levels of government 1.5 1.6 1.2 … 2.0 1.8 1.7 2.4 2.3 2.0 1.9Transfers to other levels of government 1.8 2.1 2.6 … 1.6 1.4 1.3 1.6 1.6 1.5 1.3Capital transfer from other levels of government … … 0.2 … 0.3 0.4 0.3 0.6 1.0 1.0 0.9
Overall budget balance 0.4 0.4 -0.1 -0.3 0.2 0.1 -0.2 1.5 0.7 0.4 0.0
Statistical discrepancy 0.0 0.4 -0.1 … 0.3 0.1 -0.2 1.8 1.0 0.5 0.0
Financing -0.4 0.0 0.0 0.3 0.1 0.0 0.0 0.3 0.2 0.1 0.0Domestic financing (net) -0.6 0.0 0.0 0.3 0.0 0.0 0.0 0.3 0.2 0.1 0.0
Banking system … … 0.0 0.3 0.0 0.0 0.0 0.3 0.2 0.1 0.0National Bank of Kazakhstan … … 0.0 0.0 0.0 0.0 0.0 0.0 0.0 0.0 0.0Commercial banks … … 0.0 0.3 0.0 0.0 0.0 0.3 0.2 0.1 0.0
Non-bank financing … … 0.0 0.0 0.0 0.0 0.0 0.0 0.0 0.0 0.0Foreign financing, net 0.0 0.0 0.0 0.0 0.0 0.0 0.0 0.0 0.0 0.0 0.0
Disbursements .. .. … … … … … … … … …Amortization .. .. … … … … … … … … …
Privatization receipts 0.1 0.0 0.0 0.0 0.0 0.0 0.0 0.0 0.0 0.0 0.0National Fund of the Republic of Kazakhstan (NFRK) … … … … … … … … … … …
Memorandum items:Nominal GDP (in billions of tenge) 2,016 2,600 3,251 746 1,666 2,754 3,776 933 2,041 3,271 4,450
1/ Cumulative since the end of the previous year.2/ Oil royalties, bonuses, and production sharing agreements.
Source: Kazakhstani authorities, Fund staff estimates.
2003 1/
Table 20b. Kazakhstan: Local Government Fiscal Operations, 1999–2003(In percent of GDP)

- 26 -
1999 2000 2001 2002 1/Q1 Q2 Q3 Q4 Q1 Q2 Q3 Q4
Expenditure and net lending 458.3 584.2 746.2 141.0 350.2 548.7 794.0 186.0 453.0 745.5 1,036.0Expenditure 440.3 567.0 724.8 138.4 339.4 531.4 775.6 180.8 439.3 700.8 985.7
General government services 28.9 34.8 50.8 8.5 19.0 30.0 45.1 12.5 26.3 45.3 64.0Defense 17.2 20.5 32.5 5.1 13.5 22.4 37.7 7.1 18.4 31.5 47.5Public order and security 32.5 46.9 64.3 13.5 32.5 52.4 77.7 18.5 43.3 67.0 91.6Education 78.5 84.6 106.4 23.8 58.9 85.9 121.1 32.1 73.5 108.7 148.9Health 44.8 54.2 62.3 12.7 31.0 50.3 71.1 16.8 39.4 64.5 89.8Social insurance and social security 159.1 171.0 186.7 46.1 98.4 149.2 201.3 52.2 108.2 171.4 239.2Housing and public utilities 6.0 22.0 30.5 3.9 9.0 15.4 24.5 4.2 13.0 22.2 34.0Culture, sports, and information space 12.2 17.5 18.1 4.0 10.6 15.9 22.8 6.8 15.9 24.8 33.8Fuel and energy complex, and subsoil use 0.0 0.0 5.5 0.6 2.3 5.2 6.8 1.9 5.6 7.2 8.5Agriculture, water industry, forestry, and fishery 6.9 11.4 23.2 1.2 10.3 18.2 27.7 3.4 18.1 34.6 45.5Industry and construction 2.9 7.2 4.8 0.1 0.7 2.2 4.5 0.3 1.1 2.1 3.9Transportation and communications 12.9 33.3 44.2 3.3 12.3 28.5 49.6 13.6 38.9 64.2 81.2Other expenditure 19.1 28.1 58.0 10.3 22.0 31.2 46.6 7.7 19.6 35.4 62.5Debt servicing 19.4 35.4 37.7 5.1 19.0 24.5 39.0 3.8 18.0 21.8 35.4
Net lending 18.0 17.2 21.4 2.6 10.8 17.3 18.4 5.2 13.7 44.8 50.7Lending 21.0 25.7 34.1 5.2 15.6 23.3 31.7 7.1 20.1 54.0 68.3Repayments -3.0 -8.5 -12.7 -2.6 -4.8 -6.0 -13.3 1.8 6.4 9.2 17.7
Expenditure and net lending 22.7 22.5 23.0 18.3 21.0 19.9 21.2 19.9 22.2 22.8 23.3Expenditure 21.8 21.8 22.3 17.9 20.3 19.3 20.7 19.4 21.5 21.4 22.2
General government services 1.4 1.3 1.6 1.1 1.1 1.1 1.2 1.3 1.3 1.4 1.4Defense 0.9 0.8 1.0 0.7 0.8 0.8 1.0 0.8 0.9 1.0 1.1Public order and security 1.6 1.8 2.0 1.8 1.9 1.9 2.1 2.0 2.1 2.0 2.1Education 3.9 3.3 3.3 3.1 3.5 3.1 3.2 3.4 3.6 3.3 3.3Health 2.2 2.1 1.9 1.6 1.9 1.8 1.9 1.8 1.9 2.0 2.0Social insurance and social security 7.9 6.6 5.7 6.0 5.9 5.4 5.4 5.6 5.3 5.2 5.4Housing and public utilities 0.3 0.8 0.9 0.5 0.5 0.6 0.7 0.5 0.6 0.7 0.8Culture, sports, and information space 0.6 0.7 0.6 0.5 0.6 0.6 0.6 0.7 0.8 0.8 0.8Fuel and energy complex, and subsoil use 0.0 0.0 0.2 0.1 0.1 0.2 0.2 0.2 0.3 0.2 0.2Agriculture, water industry, forestry, and fishery 0.3 0.4 0.7 0.2 0.6 0.7 0.7 0.4 0.9 1.1 1.0Industry and construction 0.1 0.3 0.1 0.0 0.0 0.1 0.1 0.0 0.1 0.1 0.1Transport and communications 0.6 1.3 1.4 0.4 0.7 1.0 1.3 1.5 1.9 2.0 1.8Other expenditure 0.9 1.1 1.8 1.3 1.3 1.1 1.2 0.8 1.0 1.1 1.4Debt servicing 1.0 1.4 1.2 0.7 1.1 0.9 1.0 0.4 0.9 0.7 0.8
Net lending 0.9 0.7 0.7 0.3 0.6 0.6 0.5 0.6 0.7 1.4 1.1Lending 1.0 1.0 1.0 0.7 0.9 0.8 0.8 0.8 1.0 1.6 1.5Repayments -0.1 -0.3 -0.4 -0.3 -0.3 -0.2 -0.4 0.2 0.3 0.3 0.4
Expenditure and net lending 100.0 100.0 100.0 100.0 100.0 100.0 100.0 100.0 100.0 100.0 100.0Expenditure 96.1 97.1 97.1 98.2 96.9 96.9 97.7 97.2 97.0 94.0 95.1
General government services 6.3 6.0 6.8 6.0 5.4 5.5 5.7 6.7 5.8 6.1 6.2Defense 3.8 3.5 4.4 3.6 3.9 4.1 4.7 3.8 4.1 4.2 4.6Public order and security 7.1 8.0 8.6 9.6 9.3 9.6 9.8 9.9 9.6 9.0 8.8Education 17.1 14.5 14.3 16.9 16.8 15.7 15.3 17.2 16.2 14.6 14.4Health 9.8 9.3 8.4 9.0 8.8 9.2 9.0 9.0 8.7 8.7 8.7Social insurance and social security 34.7 29.3 25.0 32.7 28.1 27.2 25.4 28.0 23.9 23.0 23.1Housing and public utilities 1.3 3.8 4.1 2.8 2.6 2.8 3.1 2.3 2.9 3.0 3.3Culture, sports, and information space 2.7 3.0 2.4 2.8 3.0 2.9 2.9 3.6 3.5 3.3 3.3Fuel and energy complex, and subsoil use 0.0 0.0 0.7 0.5 0.7 1.0 0.9 1.0 1.2 1.0 0.8Agriculture, water industry, forestry, and fishery 1.5 2.0 3.1 0.9 2.9 3.3 3.5 1.8 4.0 4.6 4.4Industry and construction 0.6 1.2 0.6 0.1 0.2 0.4 0.6 0.2 0.3 0.3 0.4Transport and communications 2.8 5.7 5.9 2.4 3.5 5.2 6.2 7.3 8.6 8.6 7.8Other expenditure 4.2 4.8 7.8 7.3 6.3 5.7 5.9 4.2 4.3 4.8 6.0Debt servicing 4.2 6.1 5.0 3.6 5.4 4.5 4.9 2.0 4.0 2.9 3.4
Net lending 3.9 2.9 2.9 1.8 3.1 3.1 2.3 2.8 3.0 6.0 4.9Lending 4.6 4.4 4.6 3.7 4.4 4.2 4.0 3.8 4.4 7.2 6.6Repayments -0.7 -1.5 -1.7 -1.9 -1.4 -1.1 -1.7 1.0 1.4 1.2 1.7
Memorandum items:Nominal GDP (in billions of tenge) 2,016 2,600 3,251 746 1,666 2,754 3,776 933 2,041 3,271 4,450
Source: Kazakhstani authorities.1/ Cumulative since the end of the previous year.
2003 1/
Table 21. Kazakhstan: General Government Expenditure by Functional Classification, 1999–2003
(In billions of tenge)
(In percent of GDP)
(In percent of total)
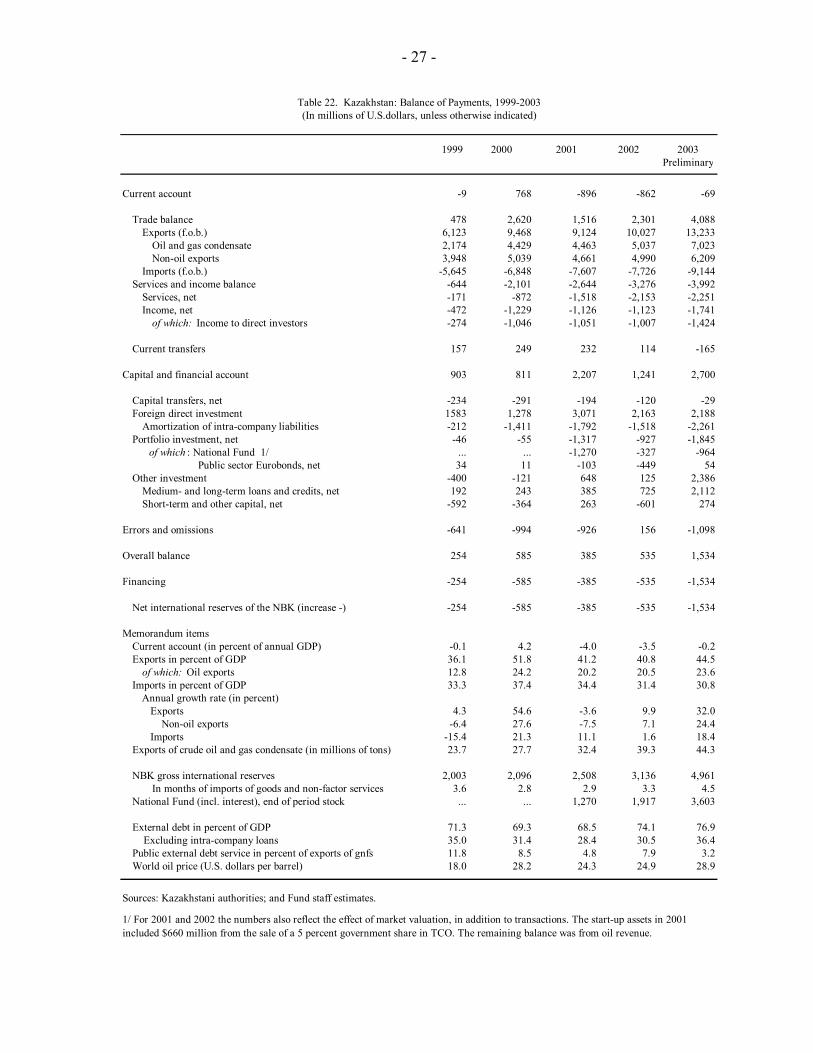
- 27 -
1999 2000 2001 2002 2003Preliminary
Current account -9 768 -896 -862 -69
Trade balance 478 2,620 1,516 2,301 4,088Exports (f.o.b.) 6,123 9,468 9,124 10,027 13,233
Oil and gas condensate 2,174 4,429 4,463 5,037 7,023Non-oil exports 3,948 5,039 4,661 4,990 6,209
Imports (f.o.b.) -5,645 -6,848 -7,607 -7,726 -9,144Services and income balance -644 -2,101 -2,644 -3,276 -3,992
Services, net -171 -872 -1,518 -2,153 -2,251Income, net -472 -1,229 -1,126 -1,123 -1,741
of which: Income to direct investors -274 -1,046 -1,051 -1,007 -1,424
Current transfers 157 249 232 114 -165
Capital and financial account 903 811 2,207 1,241 2,700
Capital transfers, net -234 -291 -194 -120 -29Foreign direct investment 1583 1,278 3,071 2,163 2,188
Amortization of intra-company liabilities -212 -1,411 -1,792 -1,518 -2,261Portfolio investment, net -46 -55 -1,317 -927 -1,845 of which : National Fund 1/ ... ... -1,270 -327 -964
Public sector Eurobonds, net 34 11 -103 -449 54Other investment -400 -121 648 125 2,386
Medium- and long-term loans and credits, net 192 243 385 725 2,112Short-term and other capital, net -592 -364 263 -601 274
Errors and omissions -641 -994 -926 156 -1,098
Overall balance 254 585 385 535 1,534
Financing -254 -585 -385 -535 -1,534
Net international reserves of the NBK (increase -) -254 -585 -385 -535 -1,534
Memorandum itemsCurrent account (in percent of annual GDP) -0.1 4.2 -4.0 -3.5 -0.2Exports in percent of GDP 36.1 51.8 41.2 40.8 44.5
of which: Oil exports 12.8 24.2 20.2 20.5 23.6Imports in percent of GDP 33.3 37.4 34.4 31.4 30.8
Annual growth rate (in percent) Exports 4.3 54.6 -3.6 9.9 32.0 Non-oil exports -6.4 27.6 -7.5 7.1 24.4 Imports -15.4 21.3 11.1 1.6 18.4
Exports of crude oil and gas condensate (in millions of tons) 23.7 27.7 32.4 39.3 44.3
NBK gross international reserves 2,003 2,096 2,508 3,136 4,961In months of imports of goods and non-factor services 3.6 2.8 2.9 3.3 4.5
National Fund (incl. interest), end of period stock ... ... 1,270 1,917 3,603
External debt in percent of GDP 71.3 69.3 68.5 74.1 76.9 Excluding intra-company loans 35.0 31.4 28.4 30.5 36.4Public external debt service in percent of exports of gnfs 11.8 8.5 4.8 7.9 3.2World oil price (U.S. dollars per barrel) 18.0 28.2 24.3 24.9 28.9
Sources: Kazakhstani authorities; and Fund staff estimates.
1/ For 2001 and 2002 the numbers also reflect the effect of market valuation, in addition to transactions. The start-up assets in 2001 included $660 million from the sale of a 5 percent government share in TCO. The remaining balance was from oil revenue.
Table 22. Kazakhstan: Balance of Payments, 1999-2003(In millions of U.S.dollars, unless otherwise indicated)

- 28 -
1999
2000
2001
2002
Vol
ume
Pric
e 1/
Val
ueV
olum
ePr
ice
1/V
alue
Vol
ume
Pric
e 1/
Val
ueV
olum
ePr
ice
1/V
alue
Vol
ume
Pric
e 1/
Val
ue(I
n m
illio
ns o
f(I
n m
illio
ns
(In
mill
ions
(I
n m
illio
ns
(In
mill
ions
U
.S. d
olla
rs)
U.S
. dol
lars
)U
.S. d
olla
rs)
U.S
. dol
lars
)U
.S. d
olla
rs)
Cus
tom
s exp
orts
5,72
78,
812
8,52
79,
333
12,9
00O
f whi
ch:
C
rude
oil
and
gas c
onde
nsat
e23
,674
922,
174
27,7
1316
04,
429
32,3
7813
84,
463
39,3
3412
85,
037
44,3
3915
87,
023
C
oal
16,8
439
156
25,1
577
165
28,5
158
232
22,6
648
172
26,9
059
250
P
etro
leum
pro
duct
s91
263
5899
210
110
01,
467
8913
01,
107
108
119
1,86
913
324
8
Alu
min
um1,
162
116
135
1,20
613
416
11,
194
151
180
1,37
112
617
31,
414
132
187
R
efin
ed c
oppe
r35
51,
486
528
391
1,70
266
639
81,
519
605
393
1,46
857
838
71,
598
619
U
nref
ined
zin
c21
179
316
721
284
718
023
766
515
825
959
515
423
262
714
5
Unr
efin
ed le
ad11
144
049
144
414
6013
441
856
132
403
5310
843
046
C
hrom
ium
ore
s and
con
cent
rate
s51
836
1955
739
2250
445
2348
347
2349
950
25
Iro
n or
es a
nd c
once
ntra
tes
3,46
111
386,
140
1060
7,34
312
869,
022
1211
010
,291
1717
9
Fer
roal
loys
774
291
225
794
354
281
823
383
315
951
358
341
1,02
844
045
2
Rol
led
ferr
ous m
etal
2,92
020
660
13,
262
234
764
3,17
718
257
73,
554
201
716
3,30
928
193
1
Yel
low
pho
spho
rus
101,
062
1013
911
1219
817
1631
907
2850
914
46
Gra
in3,
815
8231
15,
612
8849
63,
336
103
344
4,31
180
346
5,83
597
565
C
otto
n fib
er58
796
4690
946
8596
864
8313
876
310
512
61,
110
139
W
ool
1742
47
1145
05
954
35
861
85
1046
55
N
atur
al g
as (I
n m
illio
ns o
f cub
ic m
eter
s)4,
252
625
5,21
47
385,
539
1479
10,4
3721
215
11,0
0921
229
Ope
ratio
ns n
ot in
clud
ed in
cus
tom
s sta
tistic
s9
191
319
359
31Sh
uttle
exp
orts
388
465
278
334
301
Tota
l exp
orts
6,12
39,
468
9,12
410
,027
13,2
33
Sour
ces:
Kaz
akhs
tani
aut
horit
ies;
and
Fun
d st
aff e
stim
ates
.1/
U.S
. dol
lars
per
ton
exce
pt fo
r nat
ural
gas
, whi
ch is
in U
.S. d
olla
rs p
er th
ousa
nd c
ubic
met
ers.
2003
Tabl
e 23
. Kaz
akhs
tan:
Exp
ort V
olum
es, P
rices
, and
Val
ues,
1999
–200
3(V
olum
es in
thou
sand
s of t
ons)

- 29 -
1999
2000
2002
Vol
ume
Pric
e 1/
Val
ueV
olum
ePr
ice
1/V
alue
Vol
ume
Pric
e 1/
Val
ueV
olum
ePr
ice
1/V
alue
Vol
ume
Pric
e 1/
Val
ue(I
n m
illio
ns o
f(I
n m
illio
ns o
f(In
mill
ions
of
(In
mill
ions
of
(In
mill
ions
of
U.S
. dol
lars
)U
.S. d
olla
rs)
U.S
. dol
lars
)U
.S. d
olla
rs)
U.S
. dol
lars
)
Cus
tom
s im
ports
3,68
35,
040
6,76
16,
822
8,32
7O
f whi
ch:
C
rude
oil
and
gas c
onde
nsat
e (in
thou
sand
s of t
ons)
528
3016
1,01
079
802,
337
9923
22,
631
8823
12,
332
111
259
P
etro
leum
pro
duct
s (in
thou
sand
s of t
ons)
628
149
931,
152
217
250
1,29
022
629
11,
048
177
186
1,14
423
326
7
Ele
ctric
ity (i
n m
illio
ns o
f kilo
wat
t-hou
rs)
3,32
620
672,
842
1440
3,66
012
432,
390
1229
3,28
313
41
Nat
ural
gas
(in
mill
ions
of c
ubic
met
ers)
2,93
036
106
4,21
928
120
4,22
635
146
8,17
629
240
8,66
929
253
C
oal (
in th
ousa
nds o
f ton
s)1,
079
1719
663
1812
206
235
196
265
356
2910
R
olle
d fe
rrou
s met
als (
in th
ousa
nds o
f ton
s)44
386
1751
522
2673
478
3579
438
3510
348
851
E
lect
rical
equ
ipm
ent a
nd m
echa
nica
l too
ls...
...96
1...
...1,
402
......
1,85
2...
...1,
882
......
2,14
9
Foo
d ite
ms
......
282
......
236
......
325
......
......
......
N
onfo
od c
onsu
mer
goo
ds...
...41
1...
...42
8...
...46
8...
......
......
...
Veh
icle
s...
...62
0...
...56
3...
...62
5...
...80
3...
...1,
202
O
ther
s...
...1,
091
......
1,88
4...
...2,
739
......
......
......
Ope
ratio
ns n
ot in
clud
ed in
cus
tom
s sta
tistic
s and
cov
erag
e ad
just
men
ts17
613
9...
...11
4Sh
uttle
impo
rts2,
106
2,19
81,
503
1,61
31,
567
Oth
er c
orre
ctio
ns-3
20-5
29-6
57-7
09-8
63
Gra
nts
……
…...
...
Unb
alan
ced
barte
r84
-14
140
0
Frei
ght
-404
-514
-671
-709
-863
Tota
l im
ports
5,64
56,
848
7,60
77,
726
9,14
4
Sour
ces:
Kaz
akhs
tani
aut
horit
ies;
and
Fund
staf
f est
imat
es.
1/ U
.S. d
olla
rs p
er to
n ex
cept
for n
atur
al g
as w
hich
is in
U.S
. dol
lars
per
thou
sand
cub
ic m
eter
s and
ele
ctric
ity w
hich
is in
U.S
. dol
lars
per
thou
sand
kilo
wat
t-hou
rs.
2003
2001
Tabl
e 24
. Kaz
akhs
tan:
Impo
rt V
olum
es, P
rices
and
Val
ues,
1999
–200
3

- 30 -
1999 2000 2001 2002 2003
BRO Countries 29.4 27.6 31.4 23.4 24.4
Armenia 0.1 0.0 0.0 0.0 0.8Azerbaijan 0.5 0.5 0.8 1.2 0.9Belarus 0.2 0.2 0.1 0.1 0.1Estonia 1.9 0.1 0.1 0.1 0.1Georgia 0.1 0.1 0.0 0.1 0.1Kyrgyz Republic 1.0 0.7 1.0 1.1 1.2Latvia 0.4 0.8 0.5 0.6 0.6Lithuania 1.5 0.2 0.1 0.0 0.0Moldova 0.0 0.0 0.0 0.0 0.3Russia 19.5 19.9 20.4 15.5 15.2Tajikistan 0.7 0.6 0.7 0.5 0.6Turkmenistan 0.2 0.1 0.2 0.2 0.3Ukraine 2.2 2.9 5.7 3.0 3.2Uzbekistan 1.1 1.5 1.7 1.0 1.0
Non-BRO Countries 70.6 72.4 68.6 76.6 75.6
Austria 0.0 0.0 0.0 0.0 0.0Afghanistan 0.2 0.7 0.2 0.3 0.4Belgium 0.6 0.1 0.0 0.1 0.1China 8.0 7.6 7.6 10.6 12.8Czech Republic 0.1 0.1 0.0 0.2 0.2Finland 0.7 0.8 0.6 0.5 0.9Greece 0.0 0.0 0.1 0.3 0.1Germany 6.0 6.3 5.8 2.3 1.1Hungary 0.1 0.0 0.1 0.1 0.2Italy 7.3 10.4 11.1 9.4 7.9Japan 0.4 0.1 0.2 0.2 0.1Netherlands 2.8 2.6 1.7 1.3 1.4Oman 0.0 0.0 0.0 0.0 0.0Poland 1.6 0.6 1.9 3.3 1.6South Korea 0.6 0.4 0.5 0.5 0.4Switzerland 5.6 5.1 4.7 8.2 13.0Sweden 0.4 0.4 0.1 0.1 0.0Thailand 0.9 0.2 0.0 0.2 0.1Turkey 0.6 0.7 0.9 1.0 0.8United Kingdom 3.2 2.6 3.4 1.4 1.1United States 1.4 2.4 1.8 1.2 0.8Yugoslavia 0.0 0.0 0.0 0.0 0.0Other countries 30.1 31.3 27.9 35.4 32.6
Source: Kazakhstani authorities.
Table 25. Kazakhstan: Geographical Distribution of Exports, 1999–2003(In percent of total)

- 31 -
1999 2000 2001 2002 2003
BRO Countries 44.2 54.6 51.6 46.5 47.6
Armenia 0.0 0.0 0.0 0.0 0.0Azerbaijan 0.1 0.2 0.2 0.2 0.2Belarus 1.0 0.8 0.7 0.8 1.1Estonia 0.0 0.0 0.0 0.1 0.1Georgia 0.0 0.1 0.1 0.1 0.1Kyrgyz Republic 0.9 0.6 0.5 0.5 0.6Latvia 0.1 0.1 0.1 0.2 0.2Lithuania 0.2 0.2 0.1 0.1 0.2Moldova 0.1 0.1 0.1 0.1 0.1Russia 37.0 48.4 44.9 38.7 39.3Tajikistan 0.1 0.1 0.0 0.0 0.1Turkmenistan 0.5 0.9 1.2 1.1 0.6Ukraine 1.6 1.6 2.4 3.3 3.9Uzbekistan 2.5 1.4 1.3 1.3 1.1
Non-BRO Countries 55.9 45.5 48.5 53.5 52.4
Austria 0.5 0.4 0.5 0.7 1.0Canada 0.4 0.5 0.6 0.7 0.7China 2.2 3.0 2.7 4.8 6.0Cuba 0.5 0.6 0.1 0.3 0.2Czech Republic 0.7 0.7 0.7 0.8 0.5Finland 1.2 1.1 1.1 1.1 1.2Germany 7.7 6.7 7.6 8.9 8.9Hungary 1.0 0.5 0.5 0.6 0.5India 0.8 0.9 0.7 0.8 0.9Italy 2.9 3.1 4.2 3.3 2.9Japan 3.2 2.1 2.2 2.5 2.4Poland 1.7 1.2 1.0 1.1 1.4Switzerland 1.1 1.1 1.0 0.9 0.8Sweden 0.7 0.5 0.7 0.8 1.5United Kingdom 6.2 4.4 3.9 3.9 3.0United States 9.4 5.5 5.4 7.0 5.6Yugoslavia 0.0 0.0 0.0 0.0 0.0Other countries 15.7 13.2 15.5 15.3 14.9
Source: Kazakhstani authorities.
Table 26. Kazakhstan: Geographical Distribution of Imports, 1999–2003(In percent of total)
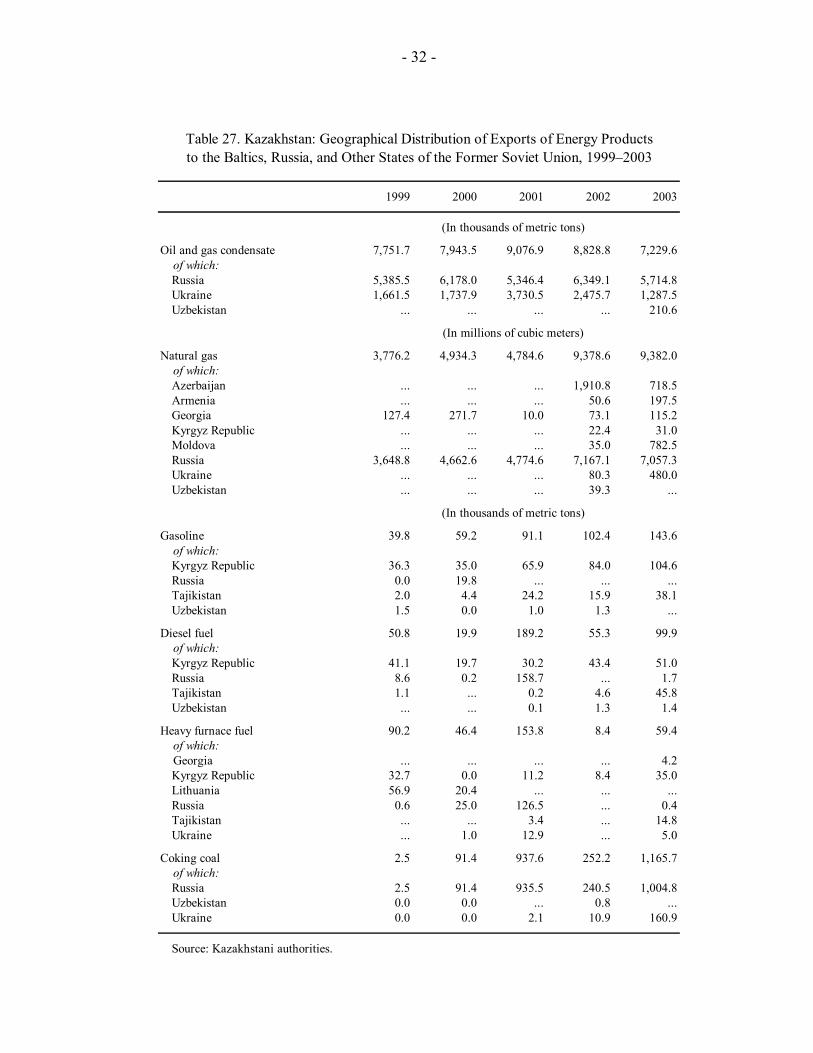
- 32 -
1999 2000 2001 2002 2003
Oil and gas condensate 7,751.7 7,943.5 9,076.9 8,828.8 7,229.6 of which:
Russia 5,385.5 6,178.0 5,346.4 6,349.1 5,714.8Ukraine 1,661.5 1,737.9 3,730.5 2,475.7 1,287.5Uzbekistan ... ... ... ... 210.6
Natural gas 3,776.2 4,934.3 4,784.6 9,378.6 9,382.0 of which:
Azerbaijan ... ... ... 1,910.8 718.5Armenia ... ... ... 50.6 197.5Georgia 127.4 271.7 10.0 73.1 115.2Kyrgyz Republic ... ... ... 22.4 31.0Moldova ... ... ... 35.0 782.5Russia 3,648.8 4,662.6 4,774.6 7,167.1 7,057.3Ukraine ... ... ... 80.3 480.0Uzbekistan ... ... ... 39.3 ...
Gasoline 39.8 59.2 91.1 102.4 143.6 of which:
Kyrgyz Republic 36.3 35.0 65.9 84.0 104.6Russia 0.0 19.8 ... ... ...Tajikistan 2.0 4.4 24.2 15.9 38.1Uzbekistan 1.5 0.0 1.0 1.3 ...
Diesel fuel 50.8 19.9 189.2 55.3 99.9 of which:
Kyrgyz Republic 41.1 19.7 30.2 43.4 51.0Russia 8.6 0.2 158.7 ... 1.7Tajikistan 1.1 ... 0.2 4.6 45.8Uzbekistan ... ... 0.1 1.3 1.4
Heavy furnace fuel 90.2 46.4 153.8 8.4 59.4 of which: Georgia ... ... ... ... 4.2
Kyrgyz Republic 32.7 0.0 11.2 8.4 35.0Lithuania 56.9 20.4 ... ... ...Russia 0.6 25.0 126.5 ... 0.4Tajikistan ... ... 3.4 ... 14.8Ukraine ... 1.0 12.9 ... 5.0
Coking coal 2.5 91.4 937.6 252.2 1,165.7 of which:
Russia 2.5 91.4 935.5 240.5 1,004.8Uzbekistan 0.0 0.0 ... 0.8 ...Ukraine 0.0 0.0 2.1 10.9 160.9
Source: Kazakhstani authorities.
(In thousands of metric tons)
Table 27. Kazakhstan: Geographical Distribution of Exports of Energy Productsto the Baltics, Russia, and Other States of the Former Soviet Union, 1999–2003
(In thousands of metric tons)
(In millions of cubic meters)

- 33 -
Country 1999 2000 2001 2002 2003
Canada 0.5 5.7 10.8 4.0 0.2China 2.7 3.2 4.7 1.6 5.4Germany 0.8 2.5 1.1 0.9 1.4Iceland 0.0 0.0 0.0 0.0 0.0Indonesia 0.0 2.4 1.0 0.0 0.0South Korea 1.6 2.0 1.5 1.1 1.8Switzerland 1.3 0.7 7.9 12.7 13.7Turkey 1.7 1.1 1.3 1.7 2.3United Kingdom 8.6 17.3 13.2 15.2 12.9United States 48.9 34.2 32.1 24.6 23.6Others 33.9 30.7 26.5 38.2 38.7
Total 100.0 100.0 100.0 100.0 100.0
Source: National Bank of Kazakhstan.
(In percent of total)
Table 28. Kazakhstan: Breakdown of Foreign Direct Investment by Country of Origin, 1999–2003

- 34 -
Sector 1999 2000 2001 2002 2003
Agriculture, Hunting, and Related Services 0.0 0.1 0.1 0.1 0.0Mining and Quarrying 75.7 73.2 67.8 51.7 47.6 of which:
Coal and lignite; extraction of peat 0.1 0.6 0.0 0.2 0.1Crude petroleum, natural gas, and related service activities 74.1 72.0 67.1 50.4 46.0Mining of uranium, metal, and thorium ores 1.6 0.3 0.5 1.0 1.0
Manufacturing 9.1 8.9 14.1 20.3 21.6 of which:
Farm products 4.2 1.5 2.0 1.6 0.8Coke, refined petroleum products, and nuclear fuel 0.9 1.1 1.4 2.6 4.3Chemicals and chemical products 0.3 0.3 0.2 0.5 0.1Basic metals and fabricated metal products, except machinery and equipment 1.9 3.6 8.5 14.0 13.6Office, accounting, and communication equipment; medical, precision, and
instruments; watches and clocks 1.5 1.7 1.5 1.1 1.5Electricity, gas, and water supply 1.2 1.5 0.7 0.5 1.5Construction 0.1 0.4 0.7 1.1 1.2Wholesale and retail trade, and repair of vehicles and household goods 1.3 1.7 1.4 2.5 3.6Hotels and restaurants 0.3 0.4 0.6 0.3 0.2Transport, storage, and communications 1.1 3.2 3.5 2.3 1.6 of which:
Land 0.8 2.7 2.8 1.4 1.0Air 0.0 0.1 0.2 0.1 0.1Post and telecommunications 0.2 0.1 0.3 0.1 0.1
Financial intermediation 2.1 1.1 1.0 0.3 1.1Real estate, renting, and business activities 8.8 9.3 10.0 20.6 21.5Public administration, education, health, and social work 0.1 0.2 0.1 0.3 0.1
Source: National Bank of Kazakhstan.
Table 29. Kazakhstan: Breakdown of Foreign Direct Investment by Industry, 1999–2003(In percent of total)
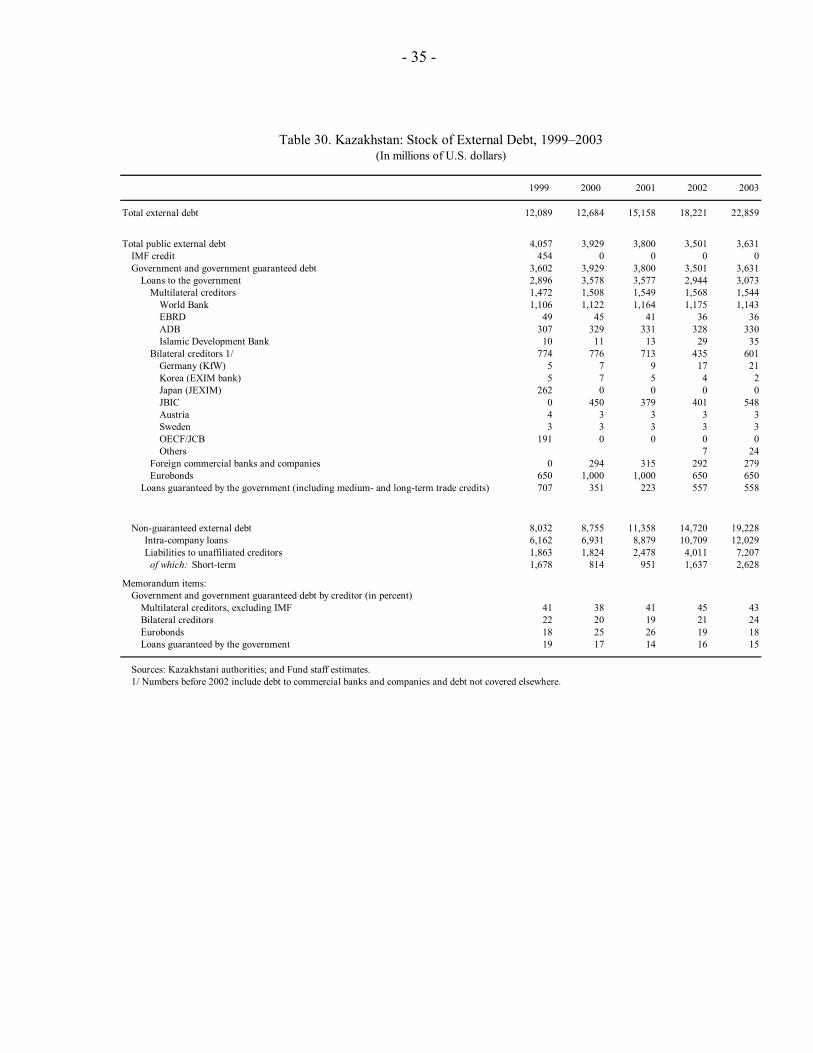
- 35 -
1999 2000 2001 2002 2003
Total external debt 12,089 12,684 15,158 18,221 22,859
Total public external debt 4,057 3,929 3,800 3,501 3,631IMF credit 454 0 0 0 0Government and government guaranteed debt 3,602 3,929 3,800 3,501 3,631
Loans to the government 2,896 3,578 3,577 2,944 3,073Multilateral creditors 1,472 1,508 1,549 1,568 1,544
World Bank 1,106 1,122 1,164 1,175 1,143EBRD 49 45 41 36 36ADB 307 329 331 328 330Islamic Development Bank 10 11 13 29 35
Bilateral creditors 1/ 774 776 713 435 601Germany (KfW) 5 7 9 17 21Korea (EXIM bank) 5 7 5 4 2Japan (JEXIM) 262 0 0 0 0JBIC 0 450 379 401 548Austria 4 3 3 3 3Sweden 3 3 3 3 3OECF/JCB 191 0 0 0 0Others 7 24
Foreign commercial banks and companies 0 294 315 292 279Eurobonds 650 1,000 1,000 650 650
Loans guaranteed by the government (including medium- and long-term trade credits) 707 351 223 557 558
Non-guaranteed external debt 8,032 8,755 11,358 14,720 19,228 Intra-company loans 6,162 6,931 8,879 10,709 12,029 Liabilities to unaffiliated creditors 1,863 1,824 2,478 4,011 7,207
of which: Short-term 1,678 814 951 1,637 2,628
Memorandum items:Government and government guaranteed debt by creditor (in percent)
Multilateral creditors, excluding IMF 41 38 41 45 43Bilateral creditors 22 20 19 21 24Eurobonds 18 25 26 19 18Loans guaranteed by the government 19 17 14 16 15
Sources: Kazakhstani authorities; and Fund staff estimates.1/ Numbers before 2002 include debt to commercial banks and companies and debt not covered elsewhere.
Table 30. Kazakhstan: Stock of External Debt, 1999–2003(In millions of U.S. dollars)