Embed Size (px)
Citation preview
© 2007 International Monetary Fund January 2007 IMF Country Report No. 07/4
November 30, 2006 January 29, 2001 January 29, 2001 January 29, 2001 January 29, 2001
People’s Republic of China—Hong Kong Special Administrative Region: Selected Issues
This Selected Issues paper on the People’s Republic of China—Hong Kong Special Administrative Region was prepared by a staff team of the International Monetary Fund as background documentation for the periodic consultation with the member country. It is based on the information available at the time it was completed on November 30, 2006. The views expressed in this document are those of the staff team and do not necessarily reflect the views of the government of People’s Republic of China—Hong Kong Special Administrative Region or the Executive Board of the IMF. The policy of publication of staff reports and other documents by the IMF allows for the deletion of market-sensitive information. To assist the IMF in evaluating the publication policy, reader comments are invited and may be sent by e-mail to [email protected].
Copies of this report are available to the public from
International Monetary Fund • Publication Services 700 19th Street, N.W. • Washington, D.C. 20431
Telephone: (202) 623-7430 • Telefax: (202) 623-7201 E-mail: [email protected] • Internet: http://www.imf.org
Price: $18.00 a copy
International Monetary Fund
Washington, D.C.


INTERNATIONAL MONETARY FUND
PEOPLE’S REPUBLIC OF CHINA— HONG KONG SPECIAL ADMINISTRATIVE REGION
Selected Issues
Prepared by Nathan Porter, Murtaza Syed, Paul Gruenwald (all APD),
and Cynthia Leung (IMF Resident Representative Sub-Office in Hong Kong SAR)
Approved by the Asia and Pacific Department
November 30, 2006
Contents
I. Medium-Term Fiscal Challenges and Policy—The Role of Fiscal Reserves ............................. 3
A. Introduction and Background ........................................................................................ 3 B. Anticipated Risks: Age-Related Fiscal Pressures .......................................................... 4 C. Unanticipated Risks: Revenue Volatility ....................................................................... 5 D. Can Policy Choices Limit the Need to Hold Large Reserves? .................................... 13 E. Do Other Countries Hold Fiscal Reserves?.................................................................. 16 Box 1: Theoretical Aspects of Fiscal Policy........................................................................7 Figure 1: Cumulative Fiscal Value at Risk Estimates .......................................................10 Figure 2: Fiscal Value at Risk Density Functions .............................................................11 Appendix: Methodological Issues .....................................................................................17 References..........................................................................................................................18
II. Competitiveness: Trends and Prospects................................................................................... 20
A. Introduction.................................................................................................................. 20 B. Trends and Patterns ...................................................................................................... 20 C. Key Challenges ............................................................................................................ 28
Figure 1: Tends in Price-Based Indicators of Competitiveness.........................................21 Figure 2: Sectoral Trends in Productivity and Unit Labor Costs ......................................23 Figure 3: Global Competitiveness Indices.........................................................................26 Figure 4: Potential Weakness in Business Environment ...................................................27 Table 1: Prices and Earnings Rankings .............................................................................22 Table 2: Growth Accounting: Sources of Growth in Labor Productivity..........................24 Table 3: Behind the Global Competitiveness Indices........................................................28 References..........................................................................................................................32

2
III. The Evolving Financial Integration with Mainland China ..................................................... 33 A. Recent Trends: Three Examples .................................................................................. 33 B. Challenges Facing Hong Kong SAR’s Position as a Financial Center........................ 38 C. Assessment and Prospects............................................................................................ 40
References..........................................................................................................................40

3
I. MEDIUM-TERM FISCAL CHALLENGES AND POLICY—THE ROLE OF FISCAL RESERVES1
A. Introduction and Background
1. Hong Kong SAR’s government faces the dual challenges of volatile revenue and medium term spending pressures arising from population aging. Reflecting these challenges, the government has commenced, and plans further, public discussions of how to reform the healthcare delivery and financing systems, and on ways to broaden the revenue base.2 Nonetheless, questions remain about the appropriate role of fiscal reserves in accommodating future spending pressures and revenue fluctuations. This chapter focuses on key considerations that need to be evaluated when formulating a medium-term reserves policy in the face of these fiscal challenges.
2. The broad conclusion of this chapter is that fiscal reserves will likely remain an important feature of future fiscal policy. Desired fiscal reserves should comprise two components: one anticipating future fiscal pressures, and a second acting as a prudential buffer against unanticipated fluctuations in revenue and spending.3 However, the appropriate level of reserves will change with tax and non-tax revenue policies, and the particular features (as well as impact) of the healthcare reforms. Based on these considerations, and in the absence of any policy change or reforms, reserves aimed at anticipating fiscal pressures could be up to 30 percent of GDP by 2030, while estimates of “prudential” reserves reflecting historical volatility could be around 30–50 percent of GDP. Much will depend on how the structure of revenue changes. For example, by limiting revenue volatility, smoother investment returns would reduce desired reserves. Similarly a broad-based consumption tax would limit desired reserves also through lower revenue volatility, as well as shore up the tax base as the aging population limits income tax revenue. In addition to changing policies and volatility, the estimates presented, of course, depend on the government’s risk tolerance: the more risk the government is willing to tolerate, the less its desired fiscal reserves.
1 Prepared by Nathan Porter.
2 See the public consultation documents: Building a Healthy Tomorrow - Discussion Paper on the Future Service Delivery (issued by the Health and Medical Development Advisory Committee in July 2005); and Broadening the Tax Base, Ensuring Our Future Prosperity: What's the Best Option for Hong Kong? (issued by the Hong Kong SAR government in July 2006).
3 Although unanticipated revenue fluctuations can be accommodated through borrowing, Hong Kong SAR’s currency board raises the cost (and risk) of such borrowing, especially if shocks initially thought transitory are longer-lived. Theoretical work on fiscal policy highlights the important role played by a government’s net asset position when the fiscal environment is volatile (Box 1).

4
B. Anticipated Risks: Age-Related Fiscal Pressures
3. Hong Kong SAR faces significant age-related fiscal pressures. Leigh (2006) investigated these, showing that rapidly increasing old-age dependency (which is expected to double by 2030) is likely to place pressure on fiscal accounts through slower growth in income-based taxes, and increases in age-related spending. However, the ultimate impact will depend upon the government’s policy choices about future health and welfare policy.
4. Given current policies, most of these pressures are likely to reflect health care spending. The government provides a relatively limited pension, with the Mandatory Provident Fund (MPF) providing an increasing source of retirement income over time. Although in the transition there could be pension-related spending, it is unlikely to cumulatively amount to more than 5 percent of GDP by 2030–2035, when it stabilizes and begins declining as the MPF becomes a growing source of retirement income. Consequently, holding reserves to cover transitional spending could require some temporary savings. However, as much of healthcare is publicly provided, the rise in these costs could place significant potential pressure on the fiscal accounts over coming decades.
5. Without any changes in the financing of healthcare, or other fiscal policies, Leigh (2006) finds that healthcare costs could result in cumulative deficits of almost 20 percent of GDP by 2030 and 50 percent of GDP by 2050. However, if these costs are mostly covered by individuals, possibly by raising the current contribution to the MPF by about 5 percentage points and earmarking it purely to finance the rise in healthcare due to aging, then the fiscal impact of the ageing population could be limited. Nonetheless, private savings (or voluntary insurance) alone cannot solve the problem as without some universal catastrophic coverage the least healthy could remain uninsured, exposing the government to remaining fiscal risks.4 Moreover, it is unlikely that these costs can be completely passed to private individuals, leaving potentially significant pressure on public finances. As an example, a 2½ percentage point rise in the MPF contribution rate could account for only half of these average age-related costs. Nonetheless, timely policy action can significantly reduce the consequences of an aging population for the tax burden faced by future generations, fiscal sustainability, and possibly the LERS.5
4 Hsiao, William, 2006, “What Should Macroeconomists Know About Health Care Policy? A Primer,” forthcoming IMF Working Paper (Revised 21 May, 2006).
5 Hong Kong SAR’s Basic Law, akin to its constitution, also places constraints on the extent to which future fiscal pressures can be anticipated through savings. It provides that the government “... strive to achieve a fiscal balance, ... and keep the budget commensurate with the growth rate of its gross domestic product.”

5
Revenue Volatility: 2000-2004 (Coefficient of Variation 1/)
0 5 10 15 20 25 30
Australia
Hong Kong SAR
India
Indonesia
Korea
Malaysia
New Zealand
Singapore
Thailand
Tax Revenue
Total Revenue
1/ Estimated after controlling for tax policy changes.
Revenue Volatility: 1981-2004 (Coefficient of Variation 1/)
0 5 10 15 20 25 30 35
Australia
Hong Kong SAR
India
Indonesia
Korea
Malaysia
New Zealand
Singapore
Thailand
Tax Revenue
Total Revenue
1/ Estimated after controlling for tax policy changes.
C. Unanticipated Risks: Revenue Volatility
How Volatile is Hong Kong SAR’s Revenue?
6. Hong Kong SAR has amongst the most volatile revenue bases in Asia. Since 1981, shares of Hong Kong SAR’s total and tax revenue in GDP have varied between 13½ percent and 20¾ percent, and 8½ percent and 12¼ percent, respectively. Measured by the coefficient of variation, the volatility of tax and total revenue (as shares of GDP) have each been around 11 percent of their average levels since 1981.6 However, this measure of volatility reflects, in part, changes in tax policy, including increases in tax rates following the SARS outbreak. Even after controlling for tax policies changes, thereby highlighting the underlying volatility in the revenue base, Hong Kong SAR still has considerably more volatile revenue than other Asian countries, even if volatility has fallen more recently.7
7. Hong Kong SAR’s revenue volatility principally reflects the importance of volatile non-tax revenue. When compared across the region, Hong Kong SAR (and Singapore) rely considerably more heavily on non-tax revenue, with non-tax revenue accounting for over 90 percent of the variance of the SAR’s total revenue since FY1981/82. Although the relative importance has fluctuated throughout the period, non-tax revenue has typically driven overall revenue volatility, even though the most volatile non-tax revenue 6 The coefficient of variation of a series is the ratio of its standard deviation to its mean.
7 Tax policy changes are proxied by changes in corporate and individual tax rates and the introduction of a VAT, and changes in the VAT rates.
Sources: IMF, Government Finance Statistics, CEIC Database, and author’s estimates.
6
Non-Tax Revenue, 1995-2004(In percent of revenue)
0 5 10 15 20 25 30 35 40 45 50
Australia
Hong Kong SAR
India
Indonesia
Korea
Malaysia
New Zealand
Singapore
Thailand
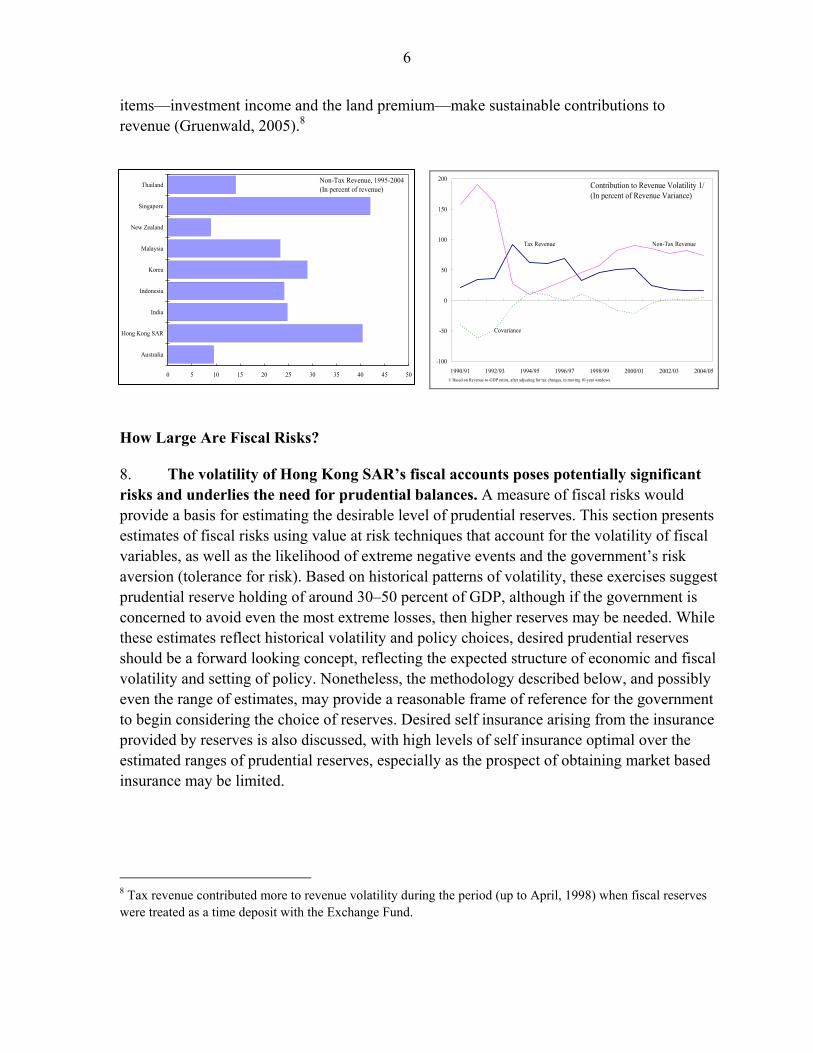
items—investment income and the land premium—make sustainable contributions to revenue (Gruenwald, 2005).8
Contribution to Revenue Volatility 1/(In percent of Revenue Variance)
-100
-50
0
50
100
150
200
1990/91 1992/93 1994/95 1996/97 1998/99 2000/01 2002/03 2004/05
Covariance
Tax Revenue Non-Tax Revenue
1/ Based on Revenue-to-GDP ratios, after adjusting for tax changes, in moving 10-year windows.
How Large Are Fiscal Risks?
8. The volatility of Hong Kong SAR’s fiscal accounts poses potentially significant risks and underlies the need for prudential balances. A measure of fiscal risks would provide a basis for estimating the desirable level of prudential reserves. This section presents estimates of fiscal risks using value at risk techniques that account for the volatility of fiscal variables, as well as the likelihood of extreme negative events and the government’s risk aversion (tolerance for risk). Based on historical patterns of volatility, these exercises suggest prudential reserve holding of around 30–50 percent of GDP, although if the government is concerned to avoid even the most extreme losses, then higher reserves may be needed. While these estimates reflect historical volatility and policy choices, desired prudential reserves should be a forward looking concept, reflecting the expected structure of economic and fiscal volatility and setting of policy. Nonetheless, the methodology described below, and possibly even the range of estimates, may provide a reasonable frame of reference for the government to begin considering the choice of reserves. Desired self insurance arising from the insurance provided by reserves is also discussed, with high levels of self insurance optimal over the estimated ranges of prudential reserves, especially as the prospect of obtaining market based insurance may be limited.
8 Tax revenue contributed more to revenue volatility during the period (up to April, 1998) when fiscal reserves were treated as a time deposit with the Exchange Fund.

7
Box 1: Theoretical Aspects of Fiscal Policy
Volatile economic and fiscal environments complicate fiscal policy. This box discusses some relevant theoretical aspects of fiscal policy in volatile environments. This first theoretical approach discussed is optimal fiscal policy when taxes are distortionary, spending pressures fluctuate, and markets are incomplete. The second approach takes revenue volatility as given and asks how an optimizing government would choose spending to “insure” the private sector. Each of these approaches suggest an important role for the government’s net asset position when the fiscal environment is volatile. Optimal Fiscal Policy Optimal fiscal policy seeks to minimize distortions over time in the face of economic and government spending shocks. When markets are complete and the government can finance any deficits through state contingent bonds, then distortions are minimized by keeping tax rates relatively stable and allowing net assets to fluctuate (Chari, et. al., 1994). When markets are incomplete—the government only issues risk free bonds as is done in most countries—then under some (relatively stringent) conditions, the government’s problem for setting taxes can be recast in the form of a permanent income problem (Aiyagari, et. al, 2002). The government will choose taxes to be less volatile than (the exogenous but volatile) spending, allowing (net) assets to fluctuate. If the government can accumulate assets up to its “natural” limit, then the government will accumulate assets to this limit and reduce taxes to zero, financing spending from the (fixed) return on assets.1 The intuition for this reflects that financing spending through (fixed) investment income is less distortionary than tax revenue. Although a conjecture, if asset income is sufficiently volatile, then it may be optimal to maintain low taxes. If assets cannot reach the “natural” limit, then distortionary taxes remain positive and net assets fluctuate. Government Spending and Insurance when Revenue is Volatile When asset markets are incomplete and the economy and revenue are volatile, then the government can play the role of a “tormented” insurer—maintaining relatively smooth spending and transfers for the private sector. Mendoza and Oviedo (2005) study such a situation with a model calibrated to Mexican data. They assume the government cannot hold net assets, and is constrained by the natural debt limit, meaning governments with more volatile revenue cannot borrow as much as those with more stable revenue. They find that government spending absorbs much of the volatility in the economy, with spending being more volatile than in the fully efficient (complete markets) equilibrium. In addition, they find the assumption that governments cannot hold net assets sometimes binding in the long-run, suggesting that holding net asset can be optimal. Finally, they argue a consumption tax should ease governmental borrowing constraints, by stabilizing revenues. __________________________ 1 To recast the optimal tax problem as a permanent income one it is necessary that agents be risk neutral. The “natural” asset limit is the one sufficient to finance government spending indefinitely, while the “natural” debt limit is such that debt can be repaid no matter how long exogenous spending remains high. Under more general preferences, if government spending can enter an absorbing state, then tax rates are likely to converge to a positive constant and the allocation reflects the complete markets case. Besides these special results, little can be said about the long-run efficient allocation when markets are incomplete (Aiyagari, et. al., 2002).

8
Value at Risk Estimates
9. Value at risk (VaR) measures the maximum expected loss over a target horizon for a given level of confidence (Jorion, 2001). Although this technique has traditionally been applied to financial portfolios, it provides a way to measure the potential downside risk associated with government fiscal accounts. Two recent papers have applied VaR techniques to fiscal sustainability issues, by looking at the VaR of the public sector balance sheet (Barnhill and Kopits, 2003) and public debt (Adrogué, 2005). In contrast, this paper uses VaR techniques to provide a probability based measure of the value of a series of weak fiscal outcomes, and therefore desired reserve holdings.
10. To calculate the VaR, simulation techniques—Monte Carlo and bootstrap—are applied to Hong Kong’s fiscal data.9 Simulation methods revalue the consolidated fiscal balance for a series of simulated realizations, possibly reflecting the realization of underlying risk factors. Based on a large number of these valuations, the probability distribution of fiscal outcomes can be estimated and the worst loss for a given confidence level calculated. The confidence level implicitly reflects the amount of risk the government is willing to accept when choosing desired reserves. Specifically, the confidence level reflects the likelihood that chosen reserves will be sufficient to cover the deficits arising from adverse shocks.10 Since both of these methods have their own strength and weaknesses, the results of each technique is compared. Monte Carlo methods rely on an underlying economic model, and so are subject to specification errors, but are more flexible to conduct counterfactual exercises. Although bootstrap methods are less flexible, they do not depend on specific modeling assumptions.
11. The measure of VaR (fiscal risks) discussed in this chapter is based on cumulative fiscal balances over a number of years.11 This measure reflects the persistence of deficits; the fiscal outcome for one year does not fully reflect the risk that the government may wish to maintain prudential reserves against. For example, Hong Kong SAR had five consecutive deficits from FY2000/01–FY2004/05, and only a small surplus in FY1999/00 following a deficit in FY1998/99. This suggest accumulated deficits over a 5–7 year period may be reasonable choices for estimating extreme outcomes, although results for 2–7 year periods are reported. The length of time over which balances are accumulated provides another dimension of risk aversion that the government may base its desired reserves decision on.
9 Data availability is limited to FY1981/82–FY2004/05. To check for robustness, two bootstrap methodologies designed for time series applications—moving block and stationary—are used in this paper.
10 For example, a 99 percent confidence interval implies the level of reserves that would be insufficient to cover fiscal outcomes one percent of the time.
11 More specifically, the measure reflects the sum of overall consolidated fiscal balances as a share of the final period GDP.

9
12. Based on cumulative balances, the bootstrap estimates suggest reserves within the range of 25–50 percent of GDP for consecutive balances over 5–7 years and confidence levels between 92.5 and 97.5 percent.12 Figure 1 shows this by displaying the VaR against two factors reflecting government risk aversion, the confidence level and the number of balances included in the measure of fiscal risk (T). The VaR—and desired reserves—increases with both the confidence level and T, and at an increasing rate. The Monte Carlo estimates are distinctly larger, varying between 40 and 80 percent of GDP over the same range of parameters, although the broad pattern is similar.
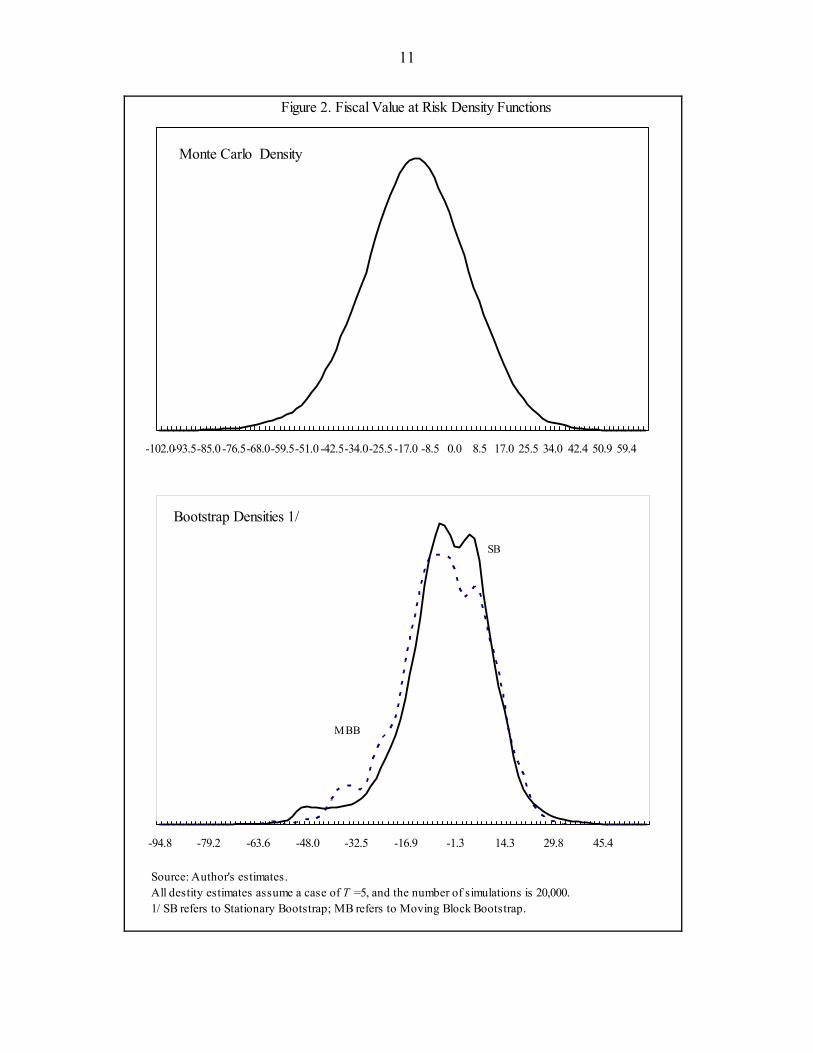
13. The Monte Carlo method produces larger VaR estimates because the large majority of cumulative balances are negative (see the density function in Figure 2). Consequently, it seem likely that the Brownian motion model of risk factors maybe too simple. The bootstrap estimates, on the other hand, do not involve model choice, reflecting only historical volatility.13
The Insurance Value of Fiscal Reserves
14. Hong Kong SAR’s fiscal reserves have clearly played an important self-insurance role. This section attempts to place an implicit market value on this insurance for two purposes: to provide an insight into the cost-effectiveness of current reserves; and to assess the desirable split between self- and market-based insurance (if available). The implicit market value of insurance is calculated by relying on the equivalence between the market value of insurance and the value of a put option designed to ensure the same outcome, and therefore assumes efficient market pricing.14 This equivalence was first exploited by
12 The VaR estimates are calculated for a variety of confidence levels from 90 to 99 percent, based on 20,000 simulations.
13 As discussed in the appendix, a generalized Brownian motion model is chosen for the Monte Carlo simulations as it is standard in the VaR literature and used in the previous fiscal VaR studies. The Monte Carlo exercise could be repeated with a richer model of economic shocks. However, since the bootstrap estimates are independent of model choice, this would be unlikely to significantly change the VaR estimates. If the growth in expenditure were half of its historical average, then the Monte Carlo method with this model produces results closer to the bootstrap techniques. Both estimates are affected by the limited historical fiscal data available.
14 The equivalence reflects the fact that a given cash flow can be guaranteed through a put option, just as it could by insurance. A put option guarantees a sales price of an asset with a volatile value. More specifically, suppose an asset has a payoff of tV against a desired liquidity of D , then insurance against a shortfall 0>− tVD is
equivalent to guaranteeing a sale price of D , through a put option, when tVD > . Consequently, the average
insurance value per unit of coverage can simply be estimated through the value of a put option with exercise price D . Technical details may be found in Lee (2004).

10
Figure 1. Cumulative Fiscal Value at Risk Estimates(In percent of GDP)
Source: Author's estimates.
2 3 4 5 6 70.9
0.950.99
3.0
23.0
43.0
63.0
83.0
103.0
T
CI
Monte Carlo Simulation
2 3 4 5 6 70.9
0.950.99
3.0
13.023.0
33.0
43.0
53.0
63.0
T
CI
Moving Block Bootstrap
2 3 4 5 6 70.9
0.950.99
3.0
13.023.0
33.0
43.0
53.0
63.0
73.0
T
CI
Stationary Bootstrap
11
Figure 2. Fiscal Value at Risk Density Functions
Monte Carlo Density
-102.0-93.5-85.0 -76.5-68.0-59.5-51.0 -42.5-34.0-25.5 -17.0 -8.5 0.0 8.5 17.0 25.5 34.0 42.4 50.9 59.4
Bootstrap Densities 1/
-94.8 -79.2 -63.6 -48.0 -32.5 -16.9 -1.3 14.3 29.8 45.4
SB
MBB
Source: Author's estimates.All destity estimates assume a case of T =5, and the number of simulations is 20,000. 1/ SB refers to Stationary Bootstrap; MB refers to Moving Block Bootstrap.
12
Average Unit Insurance Value of Reserves
Asset Value (V) 1/13.5 16.5 18.4 20.7
D = 23 0.381 0.250 0.168 0.081D = 20 0.296 0.148 0.070 0.017D = 15 0.084 0.006 0.001 0.000Source: Author's calculations based on Lee (2004).1/ The minimum, average, FY2004/05, and maximumrevenue-to-GDP ratios, FY1981/82-FY2004/05.
Merton (1971) to value deposit insurance and, more recently, was used by Lee (2004) to value the insurance provided by foreign reserve holdings.
Market Value and Cost Effectiveness
15. To exploit this equivalence, we make a number of simplifying assumptions. First, we take the “asset” value insured against to be annual revenue (as a share of GDP). Second, we assume that the European option pricing formula provides an approximate value of the equivalent option.15 Reflecting historical patterns of revenue-to-GDP, the per unit insurance value is calculated for desired insurance (D) based on various values for current revenue. Specifically, we take values of D equal to 15, 20, and 23 percent of GDP, reflecting current reserve holdings (around 23 percent of GDP) as well a alternative lower levels of coverage,16 and against various value of revenue ( tV ) (the minimum (13.5), average (16.5), and maximum (20.7) values, and the FY2004/05 outcome (18.4)).17
16. Based on revenue and reserve holdings in FY2004/05 the average annual implicit market price of insurance would be around 0.17, implying the cost of the insurance provided by fiscal reserves of 23 percent of GDP would be around 3¾ percent of GDP annually. Given the high rate of return historically made by the Exchange Fund (6.3 percent averaging over 1994–2005), it is unlikely that market insurance, even if available, would have been a cost effective alternative to self-insurance of the order held by Hong Kong SAR. However, average implicit insurance prices fall rapidly as desired insurance fall and revenue increases.
Self Insurance
17. This method for valuing the insurance value of reserves can be used to examine the optimal share of self insurance where, for a given level of desired insurance, the marginal benefit of additional reserves equals their marginal cost. The marginal cost of additional reserves reflects the lower return from holding more liquid assets, while the marginal benefit
15 Although this may not be the most appropriate assumption, it allows a simple indicative estimate of the insurance value; more sophisticated approaches could be taken up elsewhere.
16 For example, 20 percent of GDP was proposed as an expenditure target in the FY2003/04 budget.
17 This exercise assumes a risk free interest rate of 3 percent.

13
Share Optimally Self-Insured (In percent)
Liquidity Revenue Volatility 1/Premium 0.05 0.1 0.15 0.2
Desired Insurance/Revenue = 1.10.000 27.7 47.6 63.0 72.30.005 17.5 32.1 44.6 55.1
0.01 15.5 28.8 40.5 50.60.02 13.2 24.9 35.5 45.0
Desired Insurance/Revenue = 1.60.000 99.9 100.0 100.0 100.00.005 99.0 100.0 100.0 100.0
0.01 43.6 52.6 60.3 67.10.02 42.1 50.0 57.0 63.4
Desired Insurance/Revenue = 2.70.000 100.0 100.0 100.0 100.00.005 100.0 100.0 100.0 100.0
0.01 100.0 100.0 100.0 100.00.02 65.3 70.0 74.2 78.0
Source: Author's calculations based on Lee (2004).1/ Revenue reflects the FY2004/05 level and volatility overthe FY1981/82–FY2004/05 period is around 0.1 percent.
comes from the reduction in the (implicit) per unit market cost from purchasing less. Lee (2004) shows that the optimal share of self insurance decreases monotonically with the spread over of a less liquid portfolio over the reserves portfolio.
18. High levels of self insurance may be optimal. Given the high average rate of return earned by the Exchange Fund, it is unlikely that there is a significant liquidity premium applicable to these assets. Optimal self insurance is calculated (for a series of low liquidity premia) for desired insurance at around current levels (20 percent of GDP or slightly more than FY2004/05 revenue), 30 percent of GDP (1.6 times FY2004/05 revenue), and 50 percent of GDP (2.7 times FY2004/05 revenue). For desired reserves and volatility around current levels, these results suggest less than complete self insurance is optimal, although as revenue volatility increases so does the share self insured as the implicit price of market insurance rises. Nonetheless, if desired insurance increases in line with the estimates based on fiscal risks discussed above, then complete self-insurance quickly becomes optimal. Moreover, it is not clear how easy market insurance is to obtain, especially based on the “efficient” market price assumed in this exercise. Moreover, the assumption that the insurance value can be priced though an equivalent European option may understate the cost of obtaining the insurance even at “efficient” prices. Borrowing remains the likeliest avenue of obtaining a market buffer against shocks. However, even borrowing is not equivalent to insurance as its cost is not fixed ex ante, and is likely to be highest when it is needed most.
D. Can Policy Choices Limit the Need to Hold Large Reserves?
19. Yes, changes in either policy or the structure of the economy will change the extent of fiscal risks. The estimates of desired reserve holdings described above are based on historical patterns of economic and fiscal volatility, as well as the structure of the economy and policy. This section provides some preliminary assessment of the sensitivity of desired reserves to two changes: the introduction of a goods and services tax (GST); and a move to fixed returns on fiscal reserves. The results suggest that moving to a fixed rate of return on reserves could significantly reduce fiscal risks and desired reserves, but that the impact from

14
Relative Salaries and Consumption Tax Bases
100
105
110
115
120
125
130
135
140
145
150
2005 2010 2015 2020 2025 2030 2035 2040 2045 205045
50
55
60
65
70
Working Age-to-Total Population (RHS) Relative Tax Bases (LHS)
the introduction of a low-rate GST is likely to be more moderate. This is unsurprising given the highly volatile nature of investment returns, and the extent of revenue possible from a low-rate GST.
Introduction of a GST
20. The introduction of a GST should limit the need for fiscal reserves, by providing a more stable revenue base as the population ages and by limiting revenue volatility. The first of these channels is likely to become increasingly significant with both the size of the working population, as well as overall labor productivity growth, likely to fall with the aging of the population during coming decades. In addition, the more stable the revenue base, the less the need to hold reserves, which would also reduce the relative importance of volatile investment income. The consumption tax base could grow by 40 percent more than the salaries tax base as the aging population increasingly lives off previous savings, even assuming moderate and declining real per capita consumption grow and moderate real wage growth.18
21. A GST will reduce the volatility of the revenue base, although the extent will depend on how it is implemented. One way is reduce other taxes to offset the revenue from a new GST. Estimating the impact on revenue volatility of such a change in tax policy is fraught with difficulties. In particular, a different tax policy could change the underlying structure of the economy. However, to provide a first-order guide, one could consider the effect of replacing some historical revenue with an equal amount (on average) of revenue from a GST given a historical estimate of its base. Such an estimate suggests a revenue neutral move from historical indirect taxes (the most volatile tax revenue) to a GST could reduce the variance of indirect taxes-to-GDP by 60–83 percent at rates of 3–5 percent.19
18 Real per capita consumption growth is assumed to decline but average less than 1 percent per annum between 2005 and 2050, while real wages are assumed to grow at 1 percent during this period.
19 It is assumed that the GST is introduced from FY1981/82, and other indirect taxes are reduced so that indirect taxes make up the same average share of GDP over the FY1981/82-FY2004/05 period. The tax base is estimated from National Accounts data, where only household-related (including rent) spending are exempt, and there is a 25 percent leakage rate. Such a tax base would imply that each percentage point in GST rate would yield around ½ percent of GDP revenue in FY2004/05, with a rate of 8–9 percent being able to completely replace historical indirect tax revenue.

15
Revenue Neutral GST: Variance Reduction in Share of GDP 1/(In percent of historical variance)
0
20
40
60
80
100
120
0.01 0.02 0.03 0.04 0.05 0.06 0.07 0.08 0.090
1
2
3
4
5
6
7
8
9
Indirect Tax Revenue (LHS)
Total Revenue (RHS)
GST Rate1/ Based on a revenue neutral GST that is used to replace other indirect taxes.
The impact of such a change on overall revenue volatility would be more muted, with the variance of total revenue-to-GDP possibly falling by 6–8 percent. The impact of changes is considerably non-linear, with most of the variance reduction occurring at lower GST rates.
Tax Base Volatility(Coefficient of variation, moving 5-year window)
0
2
4
6
8
10
12
14
16
18
20
22
1993/94 1994/95 1995/96 1996/97 1997/98 1998/99 1999/00 2000/01 2001/02 2002/03 2003/04 2004/05
Estimated for proposed GST at 5 percent 1/
Salaries Tax 2/
Profits Tax 2/
1/ Fund staff estimates.2/ After adjusting for tax rate changes.
Indirect Tax
22. A low rate GST could bring about a modest reduction in fiscal risks, and thereby the desired level of prudential reserves. Using the Monte Carlo VaR method described above, a GST introduced at rates of 3–5 percent, and offsetting indirect tax revenue, could reduce desired reserves by around 2–4 percentage points of GDP depending on the length of consecutive deficits considered.20 The reduction in VaR is smaller than the direct impact on the variance of revenue, reflecting the interaction of risk factors with the GST base. Although the estimated reduction in risk is modest, this reduction in fiscal risks is a side-benefit of a policy worth pursuing for a more stable and broader tax base over the longer-run as well as the efficiency benefits of a GST.21
Fixed Investment Returns
23. Fixing investment returns should reduce revenue volatility but would also involve costs. During the period prior to 1998, when the government’s fiscal reserves received a fixed return, the volatility of overall revenue was much smaller, with the relative contribution of non-tax revenue to overall volatility at its smallest. Nonetheless, such a 20 Estimates are based on the Monte Carlo method as this method is more amenable to scenario analysis.
21 See Baylor (2005) and Botman (2006) for a discussion of the relative efficiency benefits of a GST.
VaR Reduction by GST (Percentage point of GDP reduction)
ConfidenceInterval GST Rate
(In Percent) 0.01 0.03 0.05T = 5 Years
95 0.11 1.41 2.4499 0.11 2.09 2.65
T = 7 Years95 0.10 2.17 3.8699 0.48 2.35 4.08

16
23
45
67
0.90.925
0.950.975
0.990
5
10
15
20
T
CI
VaR Reduction from Fixed Investment Return 1/(Percentage points)
1/ Assumes fixed investment return of 6.4 percent.
change in policy is unlikely to be costless. Fixing returns removes the possibility of very high investment income. Moreover, the party—probably the Exchange Fund—carrying the return risk would implicitly charge for this by offering a lower rate of return.
24. Nonetheless, moving to a fixed (or smoother) investment return could bring about a significant reduction in fiscal risks and desired reserves. To provide a preliminary assessment of the impact, the VaR is calculated for a fixed investment return, assuming investment income equals income from fiscal reserves earning a fixed annual return equal to the historical average.22 Such a change in policy could reduce reserves required to withstand a string of five deficits by around 7–10 percentage points of GDP, but by even as much as 20 percentage points over a 7 year horizon. The reduction in reserves increases significantly with the number of balance accumulated, but decreases with the confidence level. Other policies to smooth investment returns, such as a moving average of historical returns, should (given historical patterns of volatility) reduce the fiscal VaR by some fraction of the above fixed returns estimate.
E. Do Other Countries Hold Fiscal Reserves?
25. Hong Kong SAR’s looming fiscal challenges place it in a similar situation to many other countries. A number of countries maintain a stock of public savings, akin to Hong Kong SAR’s fiscal reserves, to anticipate fiscal pressures and to allow inter-temporal smoothing. Two common examples are reserves held to anticipate pension and other ageing related fiscal pressures (e.g., Australia, Canada, and New Zealand) (Li, 2005), and reserves against volatile nonrenewable resource (such as petroleum) revenue (Davis, et. al., 2001). Other countries maintain balances based on relevant country specific risk factors including revenue volatility, unexpected expenditures and rollover risks (e.g., Singapore, Bulgaria, and Brazil).
22 As with the GST exercise, this counter-factual is undertaken using the Monte Carlo model.

17
APPENDIX: METHODOLOGICAL ISSUES
This appendix discusses methodological issues associated with the VaR estimates discussed in the paper. VaR estimates are used to provide a probability based measure of potential financing needs associated with a series of weak fiscal balance outcomes. With VaR techniques being dependent on modeling assumptions, and having their own advantages and disadvantages, this paper presented estimates from two commonly used full-valuation VaR techniques:23 • Monte Carlo simulations rely on model-based assumptions about the behavior of the
valuation of fiscal variables, and underlying risk factors. Specifically, in this exercise the risk factors assumed to affect fiscal outcome include direct revenue and expenditure risks, interest rates, Hong Kong’s GDP and private consumption, CPI inflation, and equity and residential property prices in Hong Kong. For the purpose of this note, the Monte Carlo simulations assume that interest rates follow a mean-reverting process, and that other economic and financial risk factors follow geometric Brownian motion processes. Although this is a very simple model, it captures the correlation structure of risk factors, and is the same as used in previous fiscal VaR applications (Barnhill and Kopits, 2003; Adrogué, 2005). Realizations of the various financial and economic risk factors impact directly on the simulation outcome. Although Monte Carlo techniques are relatively flexible, their biggest weakness is their dependence on the structure of the assumed model.
• Bootstrapping estimates the VaR based on many alternative histories built by directly resampling from observed historical data. Two bootstrap approaches are used: the moving block bootstrap (MBB) that captures persistence in time series data (Li and Maddala, 1996); and the stationary bootstrap (SB) that prevents any nonstationary issues flowing from applying the bootstrap to time series data (Li and Maddala, 1996; Politis and Romano, 1994). A large number of new realizations of fiscal outcomes are then calculated based on this these sampling realizations. Although simple and free of modeling assumptions, it is less amenable to sensitivity analysis that Monte Carlo methods. Moreover, bootstrapping reflects the extent of available data—with only 24 independent values of fiscal outcomes available. However, the method accounts for data with non-Gaussian properties.
23 Further details can be found in Jorion (2001).

18
REFERENCES
Adrogué, Ricardo, 2005, “Fiscal Sustainability: A Value at Risk Approach,” in Central America: Global Integration and Regional Cooperation, IMF Occasional Paper No. 243, ed. by Rodlauer and Schipke (Washington: International Monetary Fund).
Aiyagari, S. R., A. Marcet, T. J. Sargent, and J. Seppälä, 2002, “Optimal Taxation without
State-Contingent Debt,” Journal of Political Economy, Vol. 110, No. 6, pp. 1220–54. Barnhill, Theodore M., and George Kopits, 2003, “Assessing Fiscal Sustainability Under
Uncertainty,” IMF Working Paper 03/79 (Washington: International Monetary Fund). Baylor, Maximilian., 2005, “Ranking Tax Distortions in Dynamic Equilibrium Models:
A Survey,” Working Paper 2005–06 (Ottawa: Department of Finance). Botman, Dennis., 2006, “Efficiency Gains from Reducing the GST Versus Personal Income
Taxation in Canada,” IMF Country Report No. 06/229 (Washington: International Monetary Fund).
Chari, V. V., L. J. Christiano, and P. J. Kehoe, 1994, “Optimal Fiscal Policy in a Business
Cycle Model,” Journal of Political Economy, Vol. 102, No. 4, pp. 617–52. Davis, Jeffrey, and others, 2001, Stabilization and Savings Funds for Nonrenewable
Resources, IMF Occasional Paper No. 205 (Washington: International Monetary Fund).
Goldsworthy, Brenton, 2006, “The Residential Property Market in Hong Kong SAR,” in
“People’s Republic of China—Hong Kong Special Administrative Region,” IMF Country Report No. 06/51 (Washington: International Monetary Fund).
Gruenwald, Paul, 2005, “Hong Kong SAR: A Note on the Sustainability of Volatile Revenue
Items,” in “People’s Republic of China—Hong Kong Special Administrative Region,” IMF Country Report No. 06/51 (Washington: International Monetary Fund).
Jorion, Philippe, 2001, Value at Risk: The New Benchmark for Managing Financial Risk
(New York: McGraw-Hill, 2nd ed.) Lee, Jaewoo, 2004, “Insurance Value of International Reserves: An Option Pricing
Approach,” IMF Working Paper 04/175 (Washington: International Monetary Fund).
19
Leigh, Lamin, 2006, “Hong Kong Special Administrative Region: Macroeconomic Impact of an Aging Population in a Highly Open Economy,” IMF Working Paper 06/87 (Washington: International Monetary Fund).
Li, Cui, 2005, “The Proposed Future Fund: An International Comparison,” in “Australia—
Selected Issues,” IMF Country Report No. 05/330 (Washington: International Monetary Fund).
Li, Hongyi, and G. S. Maddala, 1996, “Bootstrapping Time Series Models,” Econometric
Reviews, Vol. 15, No. 2, pp. 115–158. Mendoza, E. and P. M. Oviedo, 2005, “Fiscal Policy and Macroeconomic Uncertainty in
Emerging Markets: The Tale of the Tormented Insurer” (unpublished; Ames, Iowa: Iowa State University).
Politis D. N., and J. P. Romano, 1994, “The Stationary Bootstrap,” Journal of the American
Statistical Association, Vol. 89, No. 428, pp. 1303–1313.

20
II. COMPETITIVENESS: TRENDS AND PROSPECTS24
A. Introduction
1. After deteriorating markedly in the lead up to the Asian crisis, competitiveness has, by most measures, rebounded over the last few years. Strong productivity growth and downward adjustments in factor and asset prices have contributed, supported by the economy’s traditional strengths—notably free and flexible markets, sound financial systems, and well-developed infrastructure. In turn, this has strengthened Hong Kong SAR’s status as the premier financial center in East Asia, attracting global investors and businesses.
2. While price competitiveness has improved, further steps are likely to be needed with regard to some non-price dimensions of competitiveness. Since the latter half of the 1990s, Hong Kong SAR’s rankings have deteriorated on a number of global competitiveness indices assessing the attractiveness of the business environment. Such assessments highlight a few potential areas for improvement such as labor force skill levels, the regulatory framework, domestic competition and living conditions. In addition, with Hong Kong SAR facing a steep rise in the old age dependency ratio, demographics could adversely affect competitiveness over the medium-term, while competition from other regional financial centers is also likely to intensify.
3. At the same time, given the importance of financial services in the economy, much will depend on how well financial integration with the Mainland is managed and advanced. Chapter III discusses these specific challenges and the outlook for Hong Kong SAR’s financial center in more detail. This chapter focuses on more general aspects of the economy’s competitiveness.
B. Trends and Patterns
The Fall and Rise of Price Competitiveness
4. The real effective exchange rate, a common measure of competitiveness, has returned to early 1990 levels. Hong Kong SAR’s real effective exchange rate rose sharply in the lead up to the Asian crisis (Figure 1), appreciating by more than 50 percent between 1990 and 1998. This largely reflected the persistence of higher consumer price inflation than in trading partner countries, with rapid wage growth and property price inflation also fueling cost pressures. Since the crisis, however, the real effective exchange rate has been on a steep downward trend and is now almost back to the level observed in 1990, some 30 percent
24 Prepared by Murtaza Syed.

21
Figure 1. Trends in Price-Based Indicators of Competitiveness
Sources: CEIC, Hong Kong SAR authorities and staff estimates.
Trends in REER, 1990-2005(Index, 1990=100)
50
70
90
110
130
150
1990 1992 1994 1996 1998 2000 2002 200450
70
90
110
130
150
Hong Kong (SAR) SingaporeTaiwan (POC) ChinaKorea
Consumer Prices(Index, 1990=100)
70
80
90
100
110
120
130
140
Jan-90 Jan-93 Jan-96 Jan-99 Jan-02 Jan-0570
80
90
100
110
120
130
140
CPI relative to trading partners
Residential Property Prices(Index, 1995=100)
0
50
100
150
200
250
300
Mar-90 Mar-93 Mar-96 Mar-99 Mar-02 Mar-050
50
100
150
200
250
300
Tokyo * Sydney Hong KongSingapore Seoul Shanghai
* Residential land prices
-10
-5
0
5
10
15
1990 1992 1994 1996 1998 2000 2002 2004
Nominal Wages and Labor Productivity(year-on-year percent change)
Nominal wages
Productivity
Unit Labor Cost(Index, 1992=100)
50
75
100
125
150
175
200
1990 1992 1994 1996 1998 2000 2002 200450
75
10
12
15
17
20
Korea ChinaSingapore Hong Kong SARTaiwan POC
Sharp falls in domestic factor and asset prices have helped to reduce business costs and strengthen Hong Kong SAR's business center.
After appreciating markedly in the lead up to the Asian crisis, the real exchange rate has returned to early 1990 levels...
…reflecting a long period of deflation that helped equalize relative prices...
…and a sharp fall in property prices.
In the labor market, robust producivity growth and falling nominal wages...
…have helped to reduce unit labor costs significantly since the late 1990s.

22
2003 2/ 2006 3/ 2003 2/ 2006 3/
Tokyo 3 5 12 18New York 4 7 6 5Seoul 22 24 32 35Hong Kong SAR 2 27 34 40Singapore 29 32 36 38Taipei 28 40 33 36Shanghai 31 60 46 59
Source: UBS: Prices and Earnings: 2003 and 2006 editions.
1/ Includes rent.2/ Out of 70 cities.3/ Out of 71 cities.
Prices 1/ Wage Levels
Table 1. Prices and Earnings Rankings
below its 1998 peak. Therefore, on this measure, it appears that Hong Kong SAR has regained any price competitiveness that it may have lost during the period preceding the Asian crisis.
5. Underlying this recovery in competitiveness was a prolonged period of generalized deflation. Under the linked exchange rate system, domestic factor and asset prices shouldered much of the burden of adjustment following the Asian crisis. Reflecting the highly flexible nature of these markets, consumer and property prices fell sharply and helped to bring domestic prices back in line with those in trading partners. Driven by six years of deflation and the recent weakness of the US dollar, Hong Kong SAR’s indicators of price competitiveness have improved significantly in the last few years. In turn, this has helped to reduce business costs and strengthen Hong Kong’s attractiveness as a financial center (Table 1).
6. A similar adjustment took place in the labor market, where nominal wages fell. In recent years, productivity growth has also been high in the trade and tourism, transport and financial services sectors (Figure 2). By contrast, productivity growth in manufacturing and the non-tradable personal services sector has generally been more subdued. However, with nominal wages generally falling over the last five years, unit labor costs have declined significantly across all sectors. These trends have also led to an improvement in cost competitiveness relative to other regional economies across all sectors, especially in financial services.
7. The increased price competitiveness has also been associated with rising economic efficiency (Table 2). Indeed, factor accumulation (both physical and human capital) has contributed less to the recent turnaround than during previous time periods. The same is true when Hong Kong SAR’s recent growth experience is compared against other newly industrialized economies (NIEs). Rapid TFP growth accounts for much of the strong rebound in labor productivity over the last five years. During the initial phase of its restructuring from manufacturing to services in the 1980s and early 1990s, Hong Kong SAR experienced similar periods of strong TFP growth. After detracting from growth during the Asian crisis, TFP has again contributed more than 1½ percentage points to growth over the last five years. This trend is positive, as growth is more likely to be sustainable when it reflects increased productivity through technological progress as opposed to pure factor accumulation. As Hong Kong SAR matures into a higher value-added service economy, productivity growth should be supported by further efficiency gains.

23
Sources: CEIC and staff calculations.
Figure 2. Sectoral Trends in Productivity and Unit Labor Costs(2000=100)
Labor productivity Unit Labor Costs
80
85
90
95
100
105
110
115
2000 2001 2002 2003 2004 2005
Hong Kong SAR Korea Singapore US Taiwan POC
80
90
100
110
120
130
140
2000 2001 2002 2003 2004 2005
Hong Kong SAR Korea Singapore US Taiwan POC
70
80
90
100
110
120
130
140
150
2000 2001 2002 2003 2004 2005
90
95
100
105
110
115
120
125
130
2000 2001 2002 2003 2004 2005
80
90
100
110
120
130
140
150
2000 2001 2002 2003 2004 200590
95
100
105
110
115
120
125
2000 2001 2002 2003 2004 2005
70
80
90
100
110
120
2000 2001 2002 2003 2004 200585
90
95
100
105
110
115
120
125
130
135
140
2000 2001 2002 2003 2004 2005
Manufacturing
Trade and Tourism
Financial Services
Transport and Storage

24
Table 2. Growth Accounting: Sources of growth in labor productivity (Annual percent changes)
Contributions to labor productivity growthTFP
Labor productivity 2/
Physical capital per worker Human Capital
With human capital adjustment
Without human capital
adjustment
1981-1985 average
Hong Kong SAR 3.1 2.2 0.5 0.4 0.9
Other NIEs 1/ 4.1 2.6 0.7 0.8 1.5Korea 5.6 2.8 0.8 2.0 2.8Singapore 3.1 3.0 0.5 -0.5 0.0Taiwan POC 3.6 2.0 … … 1.7
Japan 1.9 1.4 0.4 0.2 0.6US 1.7 0.4 0.3 1.1 1.4
1986-90 average
Hong Kong SAR 6.0 2.0 0.5 3.5 4.0
Other NIEs 1/ 5.9 2.0 0.7 2.8 3.9Korea 6.2 2.8 0.8 2.6 3.4Singapore 4.5 1.1 0.5 2.9 3.4Taiwan POC 6.9 2.1 … … 4.8
Japan 3.3 1.4 0.4 1.4 1.8US 1.8 0.6 0.3 0.9 1.2
1991-95 average
Hong Kong SAR 4.0 2.1 0.5 1.4 1.9
Other NIEs 1/ 5.5 2.7 0.7 2.4 2.8Korea 5.3 3.6 0.6 1.1 1.7Singapore 6.1 1.8 0.7 3.6 4.3Taiwan POC 5.2 2.8 … … 2.4
Japan 0.6 1.3 0.3 -1.0 -0.7US 1.2 0.7 0.3 0.2 0.5
1996-2000 average
Hong Kong SAR 1.4 1.6 0.3 -0.5 -0.2
Other NIEs 1/ 3.5 2.2 0.4 0.6 1.3Korea 3.1 2.3 0.5 0.3 0.8Singapore 3.0 1.8 0.3 0.8 1.1Taiwan POC 4.4 2.5 … … 1.9
Japan 1.0 1.1 0.3 -0.4 -0.1US 2.6 1.1 0.3 1.2 1.5
2001-2005 average
Hong Kong SAR 2.8 0.9 0.3 1.6 1.9
Other NIEs 1/ 2.4 1.2 0.4 1.0 1.1Korea 2.9 1.4 0.5 1.0 1.5Singapore 2.2 1.0 0.3 0.9 1.2Taiwan POC 2.0 1.3 … … 0.7
Japan 1.5 0.8 0.3 0.4 0.7US 1.6 1.1 0.3 0.2 0.5
Hong Kong SAR 3.7 1.7 0.4 1.3 1.7
Other NIEs 1/ 4.2 2.2 0.6 1.4 2.0Korea 4.3 2.6 0.7 1.1 1.8Singapore 3.8 1.8 0.5 1.6 2.1Taiwan POC 4.5 2.2 … … 2.2
Japan 1.7 1.2 0.4 0.1 0.5US 1.8 0.8 0.3 0.7 1.0
Sources: Barro and Lee (2000), Fajnzylber and Lederman (1999), IMF (2006b), Nehru and Dhareshwar (1993), CEIC and Fund staff calculations.
1/ Output per worker.2/ Simple average.
1981-2005 average
25
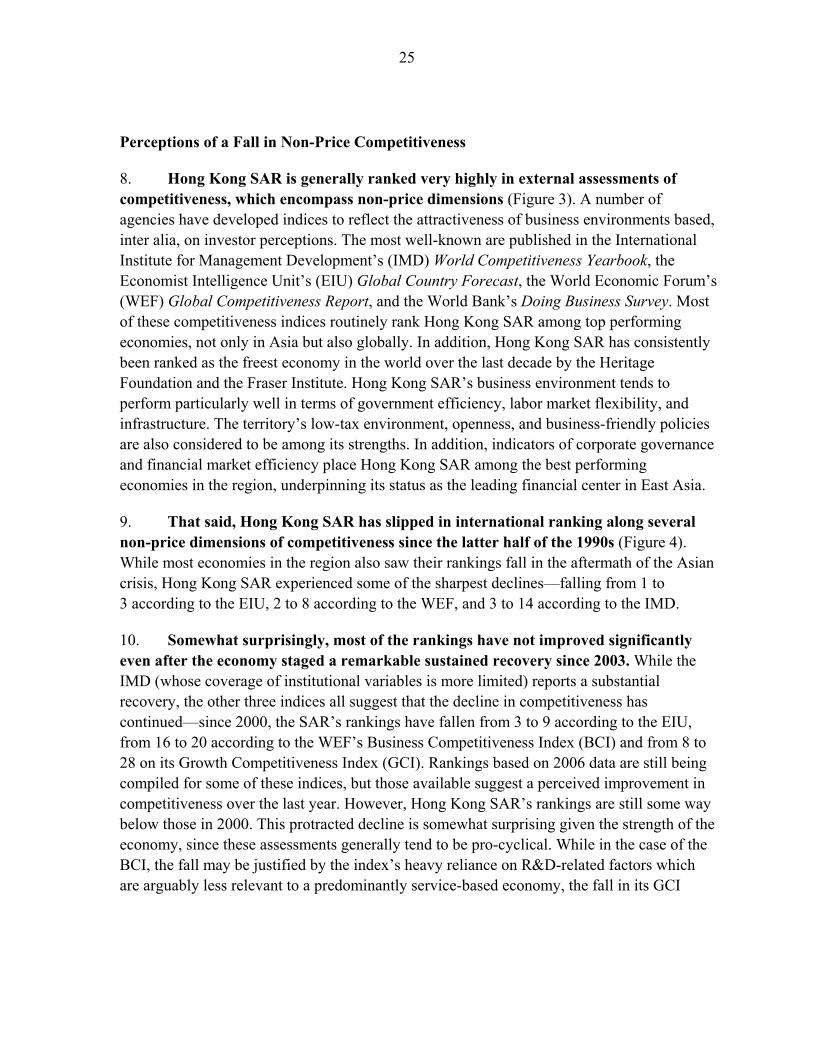
Perceptions of a Fall in Non-Price Competitiveness
8. Hong Kong SAR is generally ranked very highly in external assessments of competitiveness, which encompass non-price dimensions (Figure 3). A number of agencies have developed indices to reflect the attractiveness of business environments based, inter alia, on investor perceptions. The most well-known are published in the International Institute for Management Development’s (IMD) World Competitiveness Yearbook, the Economist Intelligence Unit’s (EIU) Global Country Forecast, the World Economic Forum’s (WEF) Global Competitiveness Report, and the World Bank’s Doing Business Survey. Most of these competitiveness indices routinely rank Hong Kong SAR among top performing economies, not only in Asia but also globally. In addition, Hong Kong SAR has consistently been ranked as the freest economy in the world over the last decade by the Heritage Foundation and the Fraser Institute. Hong Kong SAR’s business environment tends to perform particularly well in terms of government efficiency, labor market flexibility, and infrastructure. The territory’s low-tax environment, openness, and business-friendly policies are also considered to be among its strengths. In addition, indicators of corporate governance and financial market efficiency place Hong Kong SAR among the best performing economies in the region, underpinning its status as the leading financial center in East Asia.
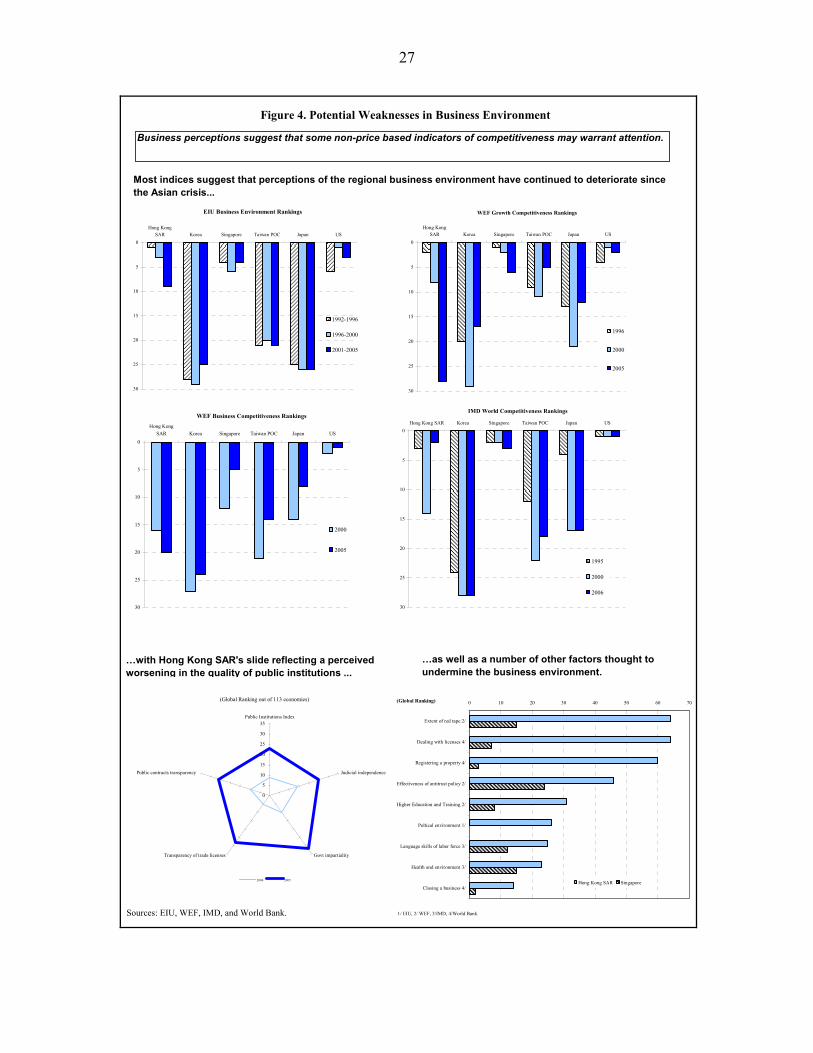
9. That said, Hong Kong SAR has slipped in international ranking along several non-price dimensions of competitiveness since the latter half of the 1990s (Figure 4). While most economies in the region also saw their rankings fall in the aftermath of the Asian crisis, Hong Kong SAR experienced some of the sharpest declines—falling from 1 to 3 according to the EIU, 2 to 8 according to the WEF, and 3 to 14 according to the IMD.
10. Somewhat surprisingly, most of the rankings have not improved significantly even after the economy staged a remarkable sustained recovery since 2003. While the IMD (whose coverage of institutional variables is more limited) reports a substantial recovery, the other three indices all suggest that the decline in competitiveness has continued—since 2000, the SAR’s rankings have fallen from 3 to 9 according to the EIU, from 16 to 20 according to the WEF’s Business Competitiveness Index (BCI) and from 8 to 28 on its Growth Competitiveness Index (GCI). Rankings based on 2006 data are still being compiled for some of these indices, but those available suggest a perceived improvement in competitiveness over the last year. However, Hong Kong SAR’s rankings are still some way below those in 2000. This protracted decline is somewhat surprising given the strength of the economy, since these assessments generally tend to be pro-cyclical. While in the case of the BCI, the fall may be justified by the index’s heavy reliance on R&D-related factors which are arguably less relevant to a predominantly service-based economy, the fall in its GCI

26
Figure 3. Global Competitiveness Indices
Sources: Credit Lyonnais, Economist Intelligence Unit, International Institute for Management Development, World Bank, and World Economic Forum.
Global Competitiveness Rankings 1/
0
5
10
15
20
25
30EIU
WEF (GCI)
WEF (BCI)IMD
World Bank
Hong Ko ng SAR Ko rea Singapo re Taiwan POC Japan US
1/ To tal numb er o f eco nomies : EIU (8 2 ), WEF (113); IMD (61); World Bank (175). Taiwan POC was ranked 4 8 acco rd ing to the Wo rld Bank.
Corporate Governance Q uality 3/
0 .0 2 .0 4 .0 6 .0 8 .0
Indo nes ia
China
Philip p ines
Thailand
Korea
Malays ia
Hong Kong SAR
Sing apore
3 / Sco res rang e fro m 1 (lowest) to 10 (hig hes t).
Government efficiency rankings
0
5
10
15
2 0
25
3 0
35
4 0
45
50
Hong Ko ngSAR
Singap ore Taiwan POC Jap an Ko rea
Efficiency of Equity Markets 2/
0 1 2 3 4 5 6 7
China
Jap an
Sing apo re
Hong Kong SAR
Korea
US
2/ Based on an ind icato r cap turing transaction cos ts and info rmation d isclosure quality.
Labor market rankings
0
5
10
15
20
25
30
35
40
45
50
Hong KongSAR
Sing apo re Taiwan POC Jap an Ko rea
Global competitiveness rankings highlight Hong Kong SAR's strong business environment.
Hong Kong SAR is ranked very highly by most global indices of competitiveness...
…underpinned by a strong network of financial institutions and markets...
…strong corporate governance...
…a non-interventionist public policy... …and flexible labor markets.
27
Figure 4. Potential Weaknesses in Business Environment
Sources: EIU, WEF, IMD, and World Bank.
Business perceptions suggest that some non-price based indicators of competitiveness may warrant attention.
Most indices suggest that perceptions of the regional business environment have continued to deteriorate since the Asian crisis...
…with Hong Kong SAR's slide reflecting a perceived worsening in the quality of public institutions ...
…as well as a number of other factors thought to undermine the business environment.
EIU Business Environment Rankings
0
5
10
15
20
25
30
Hong KongSAR Korea Singapore Taiwan POC Japan US
1992-1996
1996-2000
2001-2005
WEF Growth Competitiveness Rankings
0
5
10
15
20
25
30
Hong KongSAR Korea Singapore Taiwan POC Japan US
1996
2000
2005
WEF Business Competitiveness Rankings
0
5
10
15
20
25
30
Hong KongSAR Korea Singapore Taiwan POC Japan US
2000
2005
IMD World Competitiveness Rankings
0
5
10
15
20
25
30
Hong Kong SAR Korea Singapore Taiwan POC Japan US
1995
2000
2006
(Global Ranking out of 113 economies)
0
5
10
15
20
25
30
35Public Institutions Index
Judicial independence
Govt impartialityTransparency of trade licenses
Public contracts transparency
2004 2005
0 10 20 30 40 50 60 70
Extent of red tape 2/
Dealing with licenses 4/
Registering a property 4/
Effectiveness of antitrust policy 2/
Higher Education and Training 2/
Poltical environment 1/
Language skills of labor force 3/
Health and environment 3/
Closing a business 4/
(Global Ranking)
Hong Kong SAR Singapore
1/ EIU, 2/ WEF, 3/IMD, 4/World Bank.

28
ranking is more troubling—between 2004 and 2005 alone, it has fallen by 7 places, reflecting a decline in the rating of Hong Kong SAR’s public institutions.25
C. Key Challenges
11. While these rankings are subjective, they do serve a purpose in identifying areas where Hong Kong SAR is perceived to have lost its competitive edge. Given that Hong Kong SAR is essentially a business hub, investor perceptions perhaps matter more than in other economies (Table 3). A recent study identifies a number of factors critical to the
Hong Kong SAR Hong Kong SAR Japan Korea Singapore Taiwan POC
Macroeconomic environment 8 Public Institutions 23 14 42 4 26Contracts and law 22 21 41 5 33Corruption 26 8 52 3 24
Judicial independence 25 22 45 19 44Govt impartiality 32 19 26 3 17Transparency of trade licenses 28 5 51 3 20Transparency of public contracts 16 14 34 3 18
Infrastructure 6 Higher Education and Training 31 16 19 8 6
Market efficiency 3 Technology 26 8 7 10 3Innovation 32 5 8 13 3
Technological readiness 7 Effectiveness of antitrust policy 46 23 28 24 20
Extent of red tape 64 7 43 15 31
Government efficiency 1 Prices 52 56 57 10 33Business Legislation 1
Business Efficiency 1 Health and Environment 23 11 32 15 38Productivity and efficiency 1Labor market 1 Effectiveness of competition policy 32 26 29 9 35
Basic infrastructure 3 Education 24 23 42 13 19Language Skills of Labor Force 25 55 35 12 30
Starting a business 5 Dealing with Licenses 64 5 25 7 126
Getting credit 2 No. of procedures 22 11 14 11 32
Ease of hiring 1 Time (days) 160 96 52 129 206
Flexibility of hours 1 Registering a Property 60 6 64 3 3
Ease of firing 1 Time (days) 54 14 11 9 5
Protecting investors 3 Cost (% of property value) 5.0 4.1 6.3 2.8 6.2
Paying taxes 5 Closing a Business 14 1 13 2 5Time (years) 1.1 0.6 1.5 0.8 0.8Cost (% of estate) 9.0 3.5 3.5 1.0 3.5Recovery rate (cents on the dollar) 78.9 92.7 81.8 91.3 89.5
Labor market 2 Political environment 3/ 26 (7) … … … …Political stability 44 (9) … … … …
Policy towards foreign investment 9 Political effectiveness 17 (4) … … … …
Foreign trade and exchange controls 2
Taxes 1
Sources: EIU: Country Forecast (July, 2006); World Economic Forum: Global Competitiveness Report (2005/06), IMD: World Competitiveness Year Book (2006); World Bank: Doing Business Survey (2007).1/ Strengths (weaknesses) are classified as those factors where Hong Kong SAR ranks higher (lower) than its overall ranking under the respective global index.2/ To simplify the table, regional comparators (which Hong Kong SAR generally outperforms on these factors) are not shown.3/ Numbers in parentheses show rank out of 17 regional economies: Australia, Bangladesh, China, Hong Kong SAR, India, Indonesia, Japan, Malaysia, Pakistan, Philippines, Singapore, Korea, Sri Lanka, Taiwan POC, Thailand, and Vietnam.
IMD
World Bank
EIU
Table 3. Hong Kong SAR: Behind the Global Competitiveness Indices 1/
Strengths 2/ Weaknesses
WEF
(Rankings, unless otherwise indicated)
25 Hong Kong SAR’s ranking fell from 9 to 23 on the public institutions index, reflecting a deterioration on all its components—falling from 14 to 25 in terms of judicial independence, 3 to 15 on property rights and 15 to 32 on government impartiality. In addition, scores on irregular payments (corruption) also fell below Hong Kong SAR’s previous high performance. In a similar vein, the EIU has recently raised concerns about the business environment deteriorating “due to regulatory and political changes after the handover.”

29
success of financial centers (Corporation of London, 2005). While Hong Kong SAR performs well on most of these factors, some others—notably non-price features such as labor force skill levels, language, quality of life, and the regulatory environment—could present challenges going forward:
• Population aging. While demographic changes in Hong Kong SAR have supported economic growth over the last two decades, they could soon start to detract from it—indeed, it is estimated that, with the population set to age dramatically, such effects could set in within the next ten years (Leigh, 2006).
• Human capital. Public expenditure on education in Hong Kong SAR remains below that in the average OECD country, and higher education attainment lags behind. In particular, despite a large premium on higher education, enrollment in post-secondary education is much lower than in many Asian economies.26 The government estimates that by 2007, Hong Kong SAR will face a shortage of nearly 100,000 people with higher education.27 Such shortages of skilled labor tend to increase the economy’s reliance on overseas professionals, although there are concerns that the SAR’s attractiveness in this context may also be falling (see below).
• Living conditions. Concerns are emerging that rising pollution levels may be adversely affecting living conditions and deterring the inflow of overseas talent into Hong Kong SAR. Singapore is, by most measures, among the cleanest cities in Asia in terms of air quality, while Tokyo, Seoul and Taipei also enjoy better air quality.28 In a recent survey by the American Chamber of Commerce in Hong Kong SAR, nearly 80 percent of the executives polled felt Hong Kong SAR’s allure for foreign investors was falling based on environmental trends. The survey also found that a quarter of companies have experienced difficulties in recruiting professionals.29 The SAR’s deteriorating air quality
26 At just over 30 percent, tertiary enrolment rates are well below those in Japan and the other NIEs.
27 These concerns are echoed in investor perceptions. According to the WEF, for example, nearly a quarter of respondents to their Executive Opinion Survey identify an “inadequately educated workforce” as the most problematic factor for doing business in Hong Kong SAR, compared to less than 5 percent in Japan and the other NIEs. Similarly, the business community has expressed some concerns about the reduced use of English in secondary schools over the last decade.
28 According to the Civic Exchange (a local think tank), Hong Kong SAR is one of the most polluted cities in the world, with health damaging particulate levels worse than those in Paris, London and New York and more than 200 percent higher than WHO guidelines. 29 Hong Kong SAR’s ranking in the ECA International Location Ranking Survey for expatriate living conditions plummeted from 20 in 2005 to 32 in 2006, with worsening air quality blamed for the decline.
30
is largely blamed on factories in the Pearl River Delta (especially Guangdong province, many of which are Hong Kong SAR-owned), although local coal-fired power plants and diesel-powered buses, in addition to high population density, also contribute.
• Public institutions and regulatory burden. In addition to recent deteriorations in the perceived quality of public institutions discussed earlier, some specific weaknesses in the regulatory environment have also been identified by the World Bank’s Doing Business Survey. Notwithstanding some reservations about the appropriateness of the representative businesses chosen in the Survey, registering property, dealing with licenses and business closure is reportedly more cumbersome in Hong Kong SAR than in the region as a whole, taking 3 to 5 times as long as in Singapore. In addition to increasing the cost of doing business, such entry and exit barriers may, as discussed below, perpetuate existing market structures and undermine domestic competition.
• Domestic competition. While the external sector of the Hong Kong SAR economy operates under intense global competition, there are some concerns that domestic (particularly non-tradable service sectors) sectors may be more vulnerable to anti-competitive behavior.30 Insufficient competition in domestic sectors can feed into the cost structure of the tradable sector through inflated input prices: indeed, there is evidence that the degree of domestic competition can affect trade performance and external competitiveness (Sakakibara and Porter, 2001). Hong Kong SAR currently has a sectoral approach to competition, with different rules across sectors potentially distorting the allocation of resources. Other problems with the existing system that have been cited include the exclusion of structural issues, lack of enforcement authority, and conflicts of interest associated with a single agency acting as both regulator and enforcer of competition policy (see, e.g. Chen and Lin, 2002).31
D. Conclusion
12. To enhance Hong Kong SAR’s competitiveness in global markets and secure its position as the leading financial center in the region, a number of steps are likely to be needed. The authorities recognize these challenges and are taking some encouraging steps to
30 The WTO (2002) cautioned that “the absence of a comprehensive policy to address anti-competitive practices, and the entrenchment of a few dominant conglomerates in the domestic market, could constitute an obstacle to greater competition from foreign and domestic firms, especially in the provision of services, thereby possibly discouraging FDI.”
31 Critics argue that since the current competition policy focuses only on business conduct, such as anti-competitive practices and abuse of market power, it cannot deal effectively with structural issues, such as mergers and acquisitions.
31
address them. Over the medium-term, initiatives such as those discussed below should go a long way towards further strengthening the foundations of Hong Kong SAR’s economy, and enabling it to compete effectively in regional and global markets:
• Upgrading skill levels. Continuously upgrading the skill levels of its labor force will be key to facilitating Hong Kong SAR’s transition to a knowledge-based economy, especially as further integration with the Mainland increases the relative demand for skilled labor and returns to education. Government policies to promote higher education—e.g., providing loans for higher and continuing education, and investing in retraining programs—could help in this regard. Immigration schemes aimed at attracting skilled workers and professionals from overseas (including the Mainland) could also be worthwhile, while at the same time helping to alleviate some of the problems posed by population aging. In recent years, the government has undertaken a number of initiatives to address this issue, through education reforms designed to increase tertiary education take-up, schemes to promote skills upgrading, and targeted immigration policies.
• Tackling pollution. Dealing with pollution—inter alia, through tougher emissions regulations, greater co-operation with Guangdong authorities, and the use of market-based mechanisms—is likely to be important for preserving international investment and continuing to attract the best overseas talent. Reflecting an increasing recognition of the problems posed by worsening pollution, the government has begun monitoring air quality and is developing an environmental protection action plan in collaboration with Guangdong province.
• Lowering business costs. Reducing business costs, particularly by streamlining some regulations, improving English-language skills and preserving the quality of market institutions, will be key to maintaining Hong Kong SAR’s advantage as a regional financial center. Appropriately, this year’s budget reiterates the government’s commitment to lowering the costs of operating in the SAR by streamlining business regulations.
• Promoting domestic competition. There may be scope for increasing competition in selected (particularly non-tradable) sectors, possibly under the aegis of a general competition law. Encouragingly, the authorities have recently completed a review of existing competition policy which recommends a general competition law, and a public consultation has been launched.
At the same time, maintaining the SAR’s traditional strengths—flexible and open markets, commitment to market forces and sound financial systems—will remain crucial for the economy’s competitiveness.

32References
Barro, R. and J. Lee, 2000, “International Data on Educational Attainment: Updates and
Implications,” CID Working Paper No. 42 (Cambridge: Center for International Development at Harvard University).
Chen, K.Y. and Ping Lin, 2002, “Competition Policy under Laissez-Faireism: Market Power and its Treatment in Hong Kong,” Review of Industrial Organization, 21(2), pp. 145–66.
Corporation of London, 2005, “The Competitive Position of London as a Global Financial Center,” (November, 2005).
ECA, 2006, International Location Ranking Survey, Euan Barty Associates Ltd. (Hong Kong SAR).
EIU, Global Country Forecast (London: Economist Intelligence Unit) (various issues).
Fajnzylber, P. and D. Lederman, 1999, “Economic Reforms and Total Factor Productivity Growth in Latin America and the Caribbean ( 1950–95): An Empirical Note,” Policy Research Working Paper No. 24 (Washington: World Bank).
IMD, World Competitiveness Report (Lausanne: International Institute for Management Development) (various issues).
IMF, 2006, World Economic Outlook, September 2006 (Washington: International Monetary Fund).
Leigh, Lamin, 2006, “Hong Kong Special Administrative Region: Macroeconomic Impact of an Aging Population in a Highly Open Economy,” Working Paper No. 06/87 (Washington: International Monetary Fund).
Nehru, V. and A. Dhareshwar, 1993, “A New Database on Physical Capital Stock: Sources, Methodology and Results,” Revista de Análisis Económico, 8(1), pp. 37–59.
Sakakibara, M. and M. Porter, 2001, “Competing at Home to Win Abroad: Evidence from Japanese Industry,” Review of Economics and Statistics, 83(2), pp. 310–22.
UBS. Price and Earnings, (Zurich: UBS) (2003 and 2006 editions).
World Bank, 2007, Doing Business in 2007, (Washington: World Bank).
World Economic Forum, Global Competitiveness Report, by Porter M., J. Sachs, A. Warner, P. Cornelius, M. Levinson, and K. Schwab, (Oxford: Oxford University Press) (various issues).
WTO, 2002, Trade Policy Review: Hong Kong, China, report by the Secretariat (November, 2002) (World Trade Organization).

33
III. THE EVOLVING FINANCIAL INTEGRATION WITH MAINLAND CHINA32
1. Hong Kong SAR’s financial and capital markets continue to grow rapidly, albeit somewhat unevenly. In recent years, Hong Kong SAR has become a world-leading fundraising center, and its equity markets have broadened and deepened. Reflecting this development, as was discussed in last year’s Selected Issues paper (IMF Country Report No. 06/51), equity derivative markets have taken off as well. Conversely, consistent with the structure of capital markets and corporate finance across the region, the growth in fixed income products has been more modest, as has the growth in currency and associated derivatives trading.
2. Recent market growth increasingly reflects Hong Kong SAR’s financial integration with Mainland China. This chapter discusses three key aspects of this relationship in differing stages of development: the now-mature process of equity fundraising via initial public offerings (IPOs); the two-year old renminbi business; and the recently announced Qualified Domestic Institutional Investor (QDII) scheme. Taken together, these point to a more diversified mix of financial intermediation activities in the period ahead.
3. Rapid market development—and strengthening Hong Kong SAR’s role as a regional financial center—presents a number of challenges. The authorities are well aware of these and have, inter alia, recently proposed a financial development strategy to address the issue of deepening financial integration with the Mainland. Also, as discussed more fully in Chapter II, Hong Kong SAR faces competition from aspiring financial centers throughout the region, and must be mindful of an array of competitiveness factors.
4. While Hong Kong SAR’s medium-term role as an “off-shore” financial center for the Mainland seems secure, there are uncertainties about this role over the longer term. Much will depend on: (i) the pace at which the Mainland opens up its capital account; (ii) to what extent the Mainland will need an off-shore financial center as it modernizes its own financial sector; and (iii) whether Hong Kong SAR can move beyond its current Mainland-centric, equity-heavy model to become a full-fledged global financial center.
A. Recent Trends: Three Examples
Fundraising: IPOs
5. IPOs have taken off in recent years. Hong Kong SAR has become one of the top IPO fundraising centers in the world—and the largest in Asia. Since 2004, IPOs launched in Hong Kong SAR have raised a total of US$67 billion, about four times the total in the 32 Prepared by Paul Gruenwald (Resident Representative) and Cynthia Leung (Economist) of the Hong Kong SAR sub-office).

34
previous three years. In 2005, IPOs surpassed the record of the dot-com wave in 2000. Reflecting this, Hong Kong SAR’s stock market has overtaken Spain’s to become the world’s eighth largest, with market capitalization of US$1.5 trillion, up about 50 percent over a year earlier, equivalent to some 800 percent of GDP. More generally, overall market activity has also been buoyant in recent years and market turnover in Hong Kong SAR currently ranks fourth in Asia behind Tokyo, Seoul, and Australia, and fourteenth in the world.
6. The recent IPO wave has been spurred almost entirely by Mainland enterprises. Hong Kong SAR has been the main off-shore listing venue for all major Mainland enterprises since the early 1990s, and in 2005 over 80 percent of IPOs (by the amount of funds raised) were related to Mainland companies; in the first ten months of 2006, this percentage jumped to 90 percent. These listings not only allow the Mainland enterprises to tap international capital markets, but also present an opportunity for foreign investors to buy into one of the world’s fastest growing economies. Indeed, the new stock issuance of Mainland companies has received strong subscription demand from both retail and institutional investors. Mainland enterprises currently account for over 40 percent of total market capitalization in Hong Kong SAR equity markets and more than half of trading value over the first ten months of 2006.
IPO Fundraising
0
5
10
15
20
25
30
35
94 95 96 97 98 99 00 01 02 03 04 05 060
10
20
30
40
50
60
70
80
90
100
Total IPO funds raised (LHS)Share of Mainland enterprises (RHS)
(US$ Bn)
(Jan-Oct)
(% of total)
Share of Mainland Enterprises
0
10
20
30
40
50
60
94 95 96 97 98 99 00 01 02 03 04 05 06
Turnover Market capitalisation
(% of total)
(Jan-Oct)
7. Led by Mainland banks, Hong Kong SAR could have the largest amount of IPOs worldwide in 2006. The record US$11 billion offering of Bank of China was launched in May, followed by the US$21 billion IPO of Industrial and Commercial Bank of China (ICBC) in October. ICBC was the first company to list simultaneously in the Shanghai and Hong Kong bourses. For 2006 as a whole, IPO fundraising in Hong Kong SAR is expected to

35
reach a record about US$40 billion. The success of recent large offerings has sparked debate about whether Hong Kong SAR is overtaking New York as the main world IPO center.
Renminbi business in Hong Kong SAR33
8. The launch of renminbi business in February 2004 marked a milestone in the development of Hong Kong SAR’s financial system.34 Despite the increasing integration with the real economy of the Mainland since the late 1970s, transactions in renminbi in Hong Kong SAR were previously undertaken only through moneychangers. In addition, prior to the introduction of the individual visitor scheme in mid-2003, the renminbi was not widely accepted as a means of payment in local shops. Now, nearly all retail banks in Hong Kong SAR offer the following services in renminbi: (i) deposit taking; (ii) currency exchange; (iii) remittance; (iv) debit and credit cards; and (v) personal checks.
9. Renminbi deposits rose steadily for 1½ years after the reform, but leveled off at over RMB20 billion and constitute only a fraction of the local deposit base. Econometric work by the HKMA shows that the rise was driven by the interest rate differential between the renminbi and the Hong Kong dollar (which was positive until the Linked Exchange Rate System was modified in mid-2005) as well as speculation on a revaluation of the renminbi (which dissipated in the latter half of 2005). Renminbi deposits currently account for only ½ of 1 percent of all deposits in Hong Kong SAR. (The Hong Kong dollar accounts for roughly one-half and the U.S. dollar for one-third.) Currency exchange initially tracked closely the changes in renminbi deposits, although that relationship weakened in mid-2005, suggesting that Hong Kong SAR residents have shifted to banks for their renminbi payment needs.
33 This section closely follows Hong Kong Monetary Authority (2006c).
34 Banks in Macao SAR have been given similar privileges and the orders of magnitude for the various renminbi services are broadly similar to those reported below.

36
RMB Remittances
0
20
40
60
80
100
120
140
0.0
0.5
1.0
1.5
2.0
2.5
Total amount (LHS) Number of transactions (RHS)
(RMB Mn)
2004
('000)
2005 2006
Renminbi Deposits
0
10
20
30
40
50
60
0
50
100
150
200
250
300
350
400
450
500
Deposits (LHS)RMB deposit size per account (LHS, in RMB '000)Number of RMB deposit accounts (RHS)
(RMB Bn)
2004
('000)
2005 2006
Renminbi Currency Exchanges
0.0
0.5
1.0
1.5
2.0
2.5
3.0
3.5
RMB bought from individual customersRMB bought from merchantsRMB sold to individual customers
(RMB Bn)
2004 2005 2006
10. Renminbi remittances and card use have also risen steadily. As Hong Kong SAR residents have adapted to the use of remittances to transfer funds for use on the Mainland, this service has grown steadily to over RMB100 million per month by mid-2006; remittances in the opposite direction have been negligible. Fueled by tourists, the use of Mainland-issued credit cards in Hong Kong SAR has risen steadily to (and stabilized at) almost RMB1 billion per month. The use of Hong Kong-issued renminbi cards on the Mainland has also grown steadily, albeit on a much smaller scale.
11. Reflecting the favorable response to the reform, the scope of renminbi business in Hong Kong SAR has been widened, and the financial infrastructure improved. In late 2005, the types of merchants allowed to open renminbi accounts was expanded, the limits for currency exchange and remittances were raised, the cap on renminbi credit cards was removed and renminbi checks were introduced for use in neighboring Guangdong province by Hong Kong SAR residents. In order to facilitate the expanded renminbi business, in March 2006, a new Renminbi Settlement System was launched.
The Mainland’s QDII program

37
Quota Allocations
QDII Licensees US$ bn
Banks : Domestic 10.5 8Hong Kong-based 1.1 3Others 1.0 2
Fund managers : Domestic 0.5 1
Total (As of Nov 15, 2006) 13.1 14
Number
12. The much anticipated QDII program was launched in April 2006. The People’s Bank of China and the State Administration of Foreign Exchange (SAFE) announced a series of measures to further liberalize foreign exchange regulations: (i) commercial banks will be allowed to sell financial products denominated in renminbi to domestic customers, and pool the funds to buy foreign exchange and invest in offshore fixed income products; (ii) qualified securities agencies will be allowed to issue foreign currency investment products in the Mainland and use their clients’ foreign currency to invest in overseas securities (including equities); and (iii) insurance companies will be allowed to convert a limited amount of their own renminbi funds to buy foreign fixed income products and money market instruments.
13. Despite some market hype, the QDII quotas are likely to be small initially. While no formal allocation of QDII quotas has thus far been issued to Mainland insurers, SAFE has approved thirteen international and domestic banks to raise up to US$12.6 billion of funds in renminbi from individuals and companies, and one local fund management company to pool US$0.5 billion worth of foreign currency deposits from local residents and institutes to buy securities overseas (text table). Although the QDII scheme is slated to be the largest authorized outflow of Mainland portfolio investment in recent times and could help offset persistently large capital inflows, it remains small compared with US$1.9 trillion in household deposits, and over US$200 billion per annum in reserve accumulation since 2004.
14. Over the medium term, there is strong potential demand by Mainland investors to increase their exposure to off-shore assets and increase yield. However, the QDII scheme has received a lukewarm response so far, selling only 3 to 7 percent of quotas. This reflects strong domestic stock markets and expectations of a rising renminbi. Of note:
• There are 300,000 individuals on the Mainland with assets of over $1 million, who on average have very cash-heavy portfolios of 71 percent. Moreover, they hold only 1 percent of their wealth offshore; this compares with 10–20 percent for U.S. and Japanese investors, and 20–40 percent for small OECD and other Asian investors.
• Foreign assets account for only 5 percent of total assets of the insurance industry as against 40 percent in bank deposits and 35 percent in domestic bonds. In contrast, foreign insurers typically allocate 60 to 70 percent of their portfolio investments to bonds and 30 percent to equities and alternative investments.
• The Chinese National Social Security Fund (NSSF) and mutual funds would also constitute a natural source of demand for overseas assets as they seek to diversify their

38
portfolios. Compared with pension funds of OECD countries, the NSSF’s deposit share in total investments is relatively large (23 percent versus 5 percent).
15. The QDII scheme would help strengthen Hong Kong SAR’s role as a regional financial center, particularly in the asset management and banking industries. Hong Kong SAR is likely to be the preferred overseas market for Mainland investors, given its world-class infrastructure, efficient, well-regulated and transparent market, and proximity and cultural affinity with the Mainland. Analysts estimate that 10 to 20 percent of Mainland overseas investment would be placed in Hong Kong SAR.35 In addition, its H-shares and red chips have the advantage of being natural hedges against renminbi appreciation. The QDII program will help Hong Kong-based banks located on the Mainland to expand beyond the traditional banking business, enhance competitiveness in the midst of the opening up of the banking sector on the Mainland under WTO rules, enlarge their customer base, and earn non-interest income.
B. Challenges Facing Hong Kong SAR’s Position as a Financial Center
16. Hong Kong SAR’s main challenge is to maintain its role as the “middle man” between Mainland China and the rest of the world, while playing a greater role in direct financial intermediation in the Mainland. To this end, the authorities recently outlined a financial development strategy to enhance Hong Kong SAR’s role in the Mainland’s financial intermediation. The strategy builds on the notion that the relatively efficient financial system of Hong Kong SAR can be utilized to help improve the financial system on the Mainland (Yam, 2006). The objectives are to strengthen and continue to develop an efficient channel for foreign savings to meet the demand of Mainland fundraisers, provide investment tools for Mainland savers to invest abroad, and develop a low-risk platform for bringing together Mainland savers and investors.
17. At the supervisory level, it will be important to continue to deepen cooperation with Mainland counterparts. The framework for the relationship with the Mainland is a series of MOU’s in the banking, securities and insurance sectors. Hong Kong SAR regulators also provide extensive training to their Mainland counterparts. While there are some concerns that the quality of Hong Kong SAR’s supervisory apparatus may be compromised by deeper financial integration with the Mainland, these fears appear to be largely misplaced. Indeed, Mainland regulators and corporates reportedly want Hong Kong SAR’s standards to remain high in order to further spur Mainland reform and provide an imprimatur to foreign investors.
35 The HKMA (2006d) estimates that total outward portfolio investment of the Mainland could reach up to US$4,500 billion over the long run if the capital account is liberalized similar to an average OECD economy.

39
A comparison with New York City
0 50 100 150 200
Banking
Securities
Insurance
Banking
Securities
Insurance
0 50 100 150 200
Hong Kong New York City(US$ Bn)
('000 person)
Employment in 2003
Output in 2003
18. For a number of reasons, Hong Kong SAR’s financial development remains relatively unbalanced. In terms of country exposure, Hong Kong SAR is quite dependent on the Mainland. In terms of asset classes, Hong Kong SAR has a heavy concentration in equities and related derivative products. Fixed income and currency markets are relatively small. Regarding the types of financial activities, according to recent work by the HKMA (2006b), Hong Kong SAR compares favorably on employment and output measures with New York City in terms of banking, but lags behind in insurance and securities.
19. Competition amongst cities in the region aspiring to be financial centers will necessitate continued reform across a spectrum of issues. While Hong Kong SAR scores well on most competitiveness measures as a financial center (SFC, 2006b) the authorities remain quite cognizant of the need to continue to move forward. Hong Kong SAR currently

40
finishes at or near the top in the areas of availability of skilled personnel, regulatory environment, access to international capital, tax regime and business infrastructure, while there appears to be room for improvement in quality of life issues and the environment.
C. Assessment and Prospects
20. The authorities have been proactive in ensuring that Hong Kong SAR is well positioned to benefit from ongoing financial integration with the Mainland. This applies to both “hardware” and “software.” On the former, payment links with the Mainland have been progressively strengthened in recent years (HKMA, 2006a); moreover, the groundwork for introducing the renminbi into Hong Kong SAR’s real time gross settlement system has already been completed, and the mechanism for issuing renminbi bonds is also ready. On the latter, as noted above, the authorities have recently introduced a multi-pronged financial development strategy and continue to work with their Mainland supervisory counterparts on both policy and training issues whilst maintaining a commitment to preserve the integrity and international character of Hong Kong SAR’s financial system.
21. However, the pace and breadth of future financial integration with the Mainland—and the associated benefits—are largely exogenous to Hong Kong SAR. While there are no policy obstacles in Hong Kong SAR to implementing the proposed financial development strategy, the decision on whether and when to move forward with the various liberalization measures lies solely with the Mainland. Given this reality, the appropriate policy would appear to be the current one: be proactive and strive to anticipate (and, if possible, facilitate) any measures by the Mainland.
22. Broadening the types of financial activities undertaken in Hong Kong SAR is also needed. Given the current limited possibilities for gaining exposure to other countries’ assets,36 efforts could be made to further facilitate (i) the listing of companies outside of Greater China, which has recently attracted consideration from the authorities and (ii) the trading of a broad spectrum of claims on these countries in Hong Kong SAR’s markets. Regarding asset classes, the growth of fixed income products is likely to remain modest, although the HKMA has taken a leading role in designing and launching the Asian Bond Funds. At the same time, currency trading could pick up with progressive liberalization of the renminbi.
36 At present, the pre-approved jurisdictions for non-locally incorporated companies wishing to list in Hong Kong SAR are: China, the Cayman Islands, Bermuda, Australia and Canada (British Columbia). Applications from companies incorporated in other jurisdictions are considered on a case-by-case basis

41
REFERENCES
Corporation of London (2005), “The Competitive Position of London as a Global Financial Centre,” November.
Deutsche Bank (2006), “China’s QDII and Outlook for Overseas Investments,” April.
Hong Kong Monetary Authority (2006a), Annual Report 2005.
Hong Kong Monetary Authority (2006b), “Financial Sector Output and Employment in Hong Kong and New York City,” Hong Kong Monetary Authority Quarterly Bulletin, June, pp.22–29.
Hong Kong Monetary Authority (2006c), “Hong Kong’s Renminbi Business Two Years On,” Hong Kong Monetary Authority Quarterly Bulletin, June, pp.38–43.
Hong Kong Monetary Authority (2006d), “Outward Portfolio Investment from Mainland China : How Much Do We Expect and How Large a Share can Hong Kong Expect to Capture?,” Research Memorandum 13/2006, September.
Hong Kong Securities and Futures Commission (2006a), “Positioning of Hong Kong Amid Reforms in the Mainland Financial Markets,” Research Paper No. 30, June.
Hong Kong Securities and Futures Commission (2006b), “Hong Kong as a Leading Financial Centre in Asia,” Research Paper No. 33, August.
Merrill Lynch and Capgemini (2006), World Wealth Report (10th edition).
Yam, Joseph (2006), “A Financial Development Strategy for Hong Kong,” speech given to the Pan-Pearl River Delta Services Forum (original in Chinese), Hong Kong Monetary Authority Quarterly Bulletin, June, pp.27–33.