Embed Size (px)
Citation preview
International Niagara Board of Control
One Hundred Twenty First Semi-Annual Progress Report
to the
International Joint Commission
Covering the Period March 21 through September 19, 2013

EXECUTIVE SUMMARY
Lake Erie began the reporting period with a March mean level 15 cm (5.9 inches) below its
long-term average level for the month. While the lake’s level followed its usual seasonal
rise into June, above average rainfall and associated runoff caused the lake to continue to
rise into July, to such an extent that the mean level in July was 4 cm (1.6 inches) above
the monthly average. In August, the lake level was into its annual seasonal decline and
the August mean water level was 3 cm (1.2 inches) above the long-term average. Inflow
to Lake Erie from upstream, via the Detroit River, remained below average throughout the
reporting period (Section 2).
The level of the Chippawa-Grass Island Pool is regulated under the International
Niagara Board of Control’s 1993 Directive. The Power Entities—Ontario Power
Generation (OPG) and the New York Power Authority (NYPA)—were able to comply
with the Board's Directive at all times during the reporting period (Section 3).
Three Falls flow violations occurred during the reporting period. The first two, on
March 21 and April 17, 2013, were the result of control actions taken by the Niagara
River Control Centre’s operator on duty, under ice or changing river flow conditions, that
resulted in below Treaty requirement flows over Niagara Falls on these dates. The flow
over Niagara Falls was 44 m3/s (1,553 cfs) below the Treaty requirement for the hour of
4:00 a.m. on March 21, 2013, and 54 m3/s (1,907 cfs) below the Treaty requirement for
the hour of 8:00 a.m. on April 17, 2013, respectively. The third violation, on July 28,
2013, was the result of a Niagara Parks Police request that the morning transition from
nighttime to tourist season daytime Treaty flows be delayed in order to execute the
recovery of a body that was found in the lower Niagara River. The flow over Niagara
Falls was 275 m3/s (9,711 cfs) below the Treaty requirement of 2,832 m3/s
(100,000 cfs) for 8:00 a.m. (Section 5).

The Board has developed techniques utilizing a Geographic Information System to help
geo-reference and assess the extent of recent and future changes in the crest of the
Horseshoe Falls at Niagara. Based on the most recently available imagery, no
significant changes in the crestline were observed during the reporting period.
(Section 6).
OPG has completed construction of the Niagara Tunnel Project, which provides
increased water diversion capability for OPG’s Sir Adam Beck Complex. The tunnel
was watered up on March 2 and 3, 2013 and its official in-service date was March 9,
2013 (Section 9).
Removal of the Lake Erie – Niagara River Ice Boom began during the afternoon on
March 25, 2013 following a fixed-wing ice observation flight earlier that day. April 17,
2013 marked the end of the 2012-13 ice-boom season when the final spans of the ice
boom were pulled to and onto its Katherine Street, Buffalo, NY storage site (Section 10).
The Board held its annual public meeting on September 19, 2013 in Niagara-on-the-
Lake, ON. People were able to participate in person, by telephone or on-line by
webinar. This was the first time that the Board has offered the telephone or webinar
options as an extension of the face-to-face meeting. There were about 25 people at
the meeting, with nine members of the public attending in person and two people
participating on-line via webinar/teleconference. (Section 11).
Dr. Frank Seglenieks, Environment Canada, was appointed by Mr. Thompson to the
position of Canadian Co-Chair of the Board’s Working Committee on August 21, 2013,
replacing Mr. Jacob Bruxer in that role (Section 12).
i
COVER: View of a rainbow over Niagara Falls with the International Niagara Control
Works in the background (Photo courtesy of Dr. Frank Seglenieks, Environment Canada)
TABLE OF CONTENTS SECTION PAGE 1 GENERAL 1 2 BASIN CONDITIONS 2 3 OPERATION AND MAINTENANCE OF THE INTERNATIONAL NIAGARA CONTROL WORKS 9 4 GAUGING STATIONS 11 5 FLOWS OVER NIAGARA FALLS 12 6 FALLS RECESSION 14 7 DIVERSIONS AND FLOW AT QUEENSTON 15 8 FLOW MEASUREMENTS IN THE NIAGARA RIVER AND
THE WELLAND CANAL 17 9 NIAGARA TUNNEL PROJECT AND PLANT UPGRADES 20 10 ICE CONDITIONS AND ICE BOOM OPERATIONS 21 11 MEETING WITH THE PUBLIC 23 12 MEMBERSHIP OF THE BOARD AND ITS WORKING COMMITTEE 23 13 ATTENDANCE AT BOARD MEETINGS 24 TABLES PAGE 1 MONTHLY AVERAGE LAKE ERIE WATER LEVELS 5 2 MONTHLY AVERAGE PRECIPITATION ON THE LAKE ERIE BASIN 5 3 MONTHLY NIAGARA RIVER FLOWS AT QUEENSTON 16 4 MONTHLY MAXIMUM AND MINIMUM NIAGARA RIVER FLOWS AT QUEENSTON 17

ii
FIGURES PAGE 1 MONTHLY MEAN WATER LEVELS – LAKE ERIE 6 2 MONTHLY PRECIPITATION – LAKE ERIE BASIN 6 3 MONTHLY NET BASIN SUPPLIES – LAKE ERIE BASIN 7 4 MONTHLY MEAN WATER LEVELS – LAKES MICHIGAN-HURON 7 5 MONTHLY MEAN FLOWS – DETROIT RIVER 8 6 MONTHLY NET TOTAL SUPPLIES – LAKE ERIE BASIN 8 7 NIAGARA RIVER MONTHLY MEAN FLOWS – AT BUFFALO, NEW YORK 9 ENCLOSURES 1 MAP OF THE UPPER NIAGARA RIVER 2 NIAGARA RIVER DAILY MEAN LEVEL AT MATERIAL DOCK GAUGE 3 DAILY FLOW OVER NIAGARA FALLS 4 DAILY DIVERSIONS OF NIAGARA RIVER WATER FOR POWER PURPOSES
INTERNET SITES
International Joint Commission www.ijc.org/language/
International Niagara Board of Control
www.ijc.org/en_/inbc www.ijc.org/fr_/inbc
Lake Erie-Niagara River Ice Boom
www.iceboom.nypa.gov
1
INTERNATIONAL NIAGARA BOARD OF CONTROL
Burlington, Ontario September 19, 2013 Cincinnati, Ohio International Joint Commission Ottawa, Ontario Washington, D.C.
Commissioners:
1. GENERAL
The International Niagara Board of Control (Board) was established by the International
Joint Commission (IJC) in 1953. The Board provides advice to the IJC on matters related
to the IJC's responsibilities for water levels and flows in the Niagara River. The Board's
main duties are to oversee the operation of the International Niagara Control Works
(INCW) located at the outlet of the Chippawa-Grass Island Pool (CGIP) upstream of
Niagara Falls and the installation of the Lake Erie-Niagara River Ice Boom at the outlet of
Lake Erie. The Board also collaborates with the International Niagara Committee (INC), a
body created by the 1950 Niagara Treaty to determine the amount of water available for
Niagara Falls and hydroelectric power generation.
The Board is required to submit written reports to the IJC at its semi-annual meetings in
April and October of each year. In accordance with this requirement, the Board submits
its One Hundred Twenty First Semi-Annual Progress Report, covering the reporting
period March 21 through September 19, 2013.
All elevations in this report are referenced to the International Great Lakes Datum 1985
(IGLD 1985). Values provided are expressed in metric units, with approximate customary
units (in parentheses) for information purposes only. The monthly Lake Erie water levels
are based on a network of four gauges to better represent the average level of the lake.

2
2. BASIN CONDITIONS
The level of Lake Erie began the reporting period with a March mean level 15 cm
(5.9 inches) below its long-term average level for the month. The lake level was
continuing its usual seasonal rise, but initially at a rate slightly less than average. Above-
average rainfall and associated runoff in April, June and July caused the lake’s level to
continue to rise into July, and subsequently the July mean level was 4 cm (1.6 inches)
above the July long-term average level. The lake began its seasonal decline on a daily
basis in late July and the lake fell by an average amount on a monthly basis from July to
August. The August mean water level was 3 cm (1.2 inches) above the long-term
average for the month. Recorded monthly water levels for the period March through
August 2013 are shown in Table 1 and are depicted graphically in Figure 1. The following
paragraphs provide more detail on the main factors that led to the water level changes
observed on Lake Erie during the reporting period.
Lake Erie receives water from both its local drainage basin and from the upstream lakes.
The water supplied to a lake from its local drainage basin is referred to as its net basin
supply (NBS). A lake’s NBS is the sum of the amount of water the lake receives from
precipitation falling directly on its surface and runoff (including snow melt) from its
surrounding land area, minus the amount of water that evaporates from its surface.
Precipitation is a major contributor to NBS, both directly on the lake and through runoff.
Recent precipitation data and departures from the long-term averages are shown in
Table 2 and are depicted graphically in Figure 2. Precipitation on the Lake Erie basin was
above average during the months of April, June and July, and below average during
March, May and August. During the period March through August 2013, the basin
received about 53.8 cm (21.2 inches) of precipitation. This is approximately 10% above
average for the period.
3
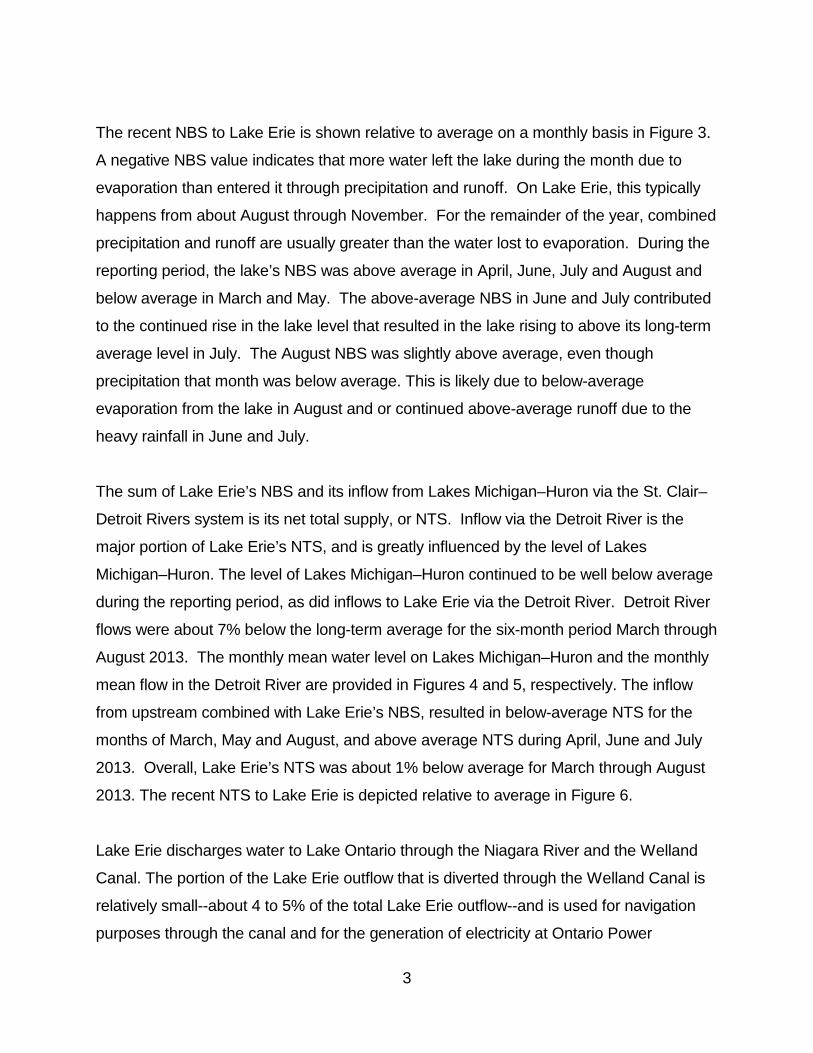
The recent NBS to Lake Erie is shown relative to average on a monthly basis in Figure 3.
A negative NBS value indicates that more water left the lake during the month due to
evaporation than entered it through precipitation and runoff. On Lake Erie, this typically
happens from about August through November. For the remainder of the year, combined
precipitation and runoff are usually greater than the water lost to evaporation. During the
reporting period, the lake’s NBS was above average in April, June, July and August and
below average in March and May. The above-average NBS in June and July contributed
to the continued rise in the lake level that resulted in the lake rising to above its long-term
average level in July. The August NBS was slightly above average, even though
precipitation that month was below average. This is likely due to below-average
evaporation from the lake in August and or continued above-average runoff due to the
heavy rainfall in June and July.
The sum of Lake Erie’s NBS and its inflow from Lakes Michigan–Huron via the St. Clair–
Detroit Rivers system is its net total supply, or NTS. Inflow via the Detroit River is the
major portion of Lake Erie’s NTS, and is greatly influenced by the level of Lakes
Michigan–Huron. The level of Lakes Michigan–Huron continued to be well below average
during the reporting period, as did inflows to Lake Erie via the Detroit River. Detroit River
flows were about 7% below the long-term average for the six-month period March through
August 2013. The monthly mean water level on Lakes Michigan–Huron and the monthly
mean flow in the Detroit River are provided in Figures 4 and 5, respectively. The inflow
from upstream combined with Lake Erie’s NBS, resulted in below-average NTS for the
months of March, May and August, and above average NTS during April, June and July
2013. Overall, Lake Erie’s NTS was about 1% below average for March through August
2013. The recent NTS to Lake Erie is depicted relative to average in Figure 6.
Lake Erie discharges water to Lake Ontario through the Niagara River and the Welland
Canal. The portion of the Lake Erie outflow that is diverted through the Welland Canal is
relatively small--about 4 to 5% of the total Lake Erie outflow--and is used for navigation
purposes through the canal and for the generation of electricity at Ontario Power
4
Generation’s DeCew Falls hydroelectric plants. The major portion of the outflow from
Lake Erie occurs through the Niagara River and depends on the level of the lake at its
outlet. Generally speaking, above-average lake levels result in above-average outflows
and below-average lake levels lead to below-average outflows. However, the lake’s
outflow through the Niagara River is affected by ice in the river during the winter and
aquatic plant growth in the river in the summer, both of which can reduce the flow.
Seasonal trends in prevailing winds over Lake Erie that on average raise levels at the
eastern end of the lake relative to levels at the western end and relative to the lake’s
average level also influence the lake’s outflow through the Niagara River. Recent monthly
outflows via the Niagara River are graphically depicted in Figure 7. Below-average water
level conditions on Lake Erie from March through June 2013 resulted in below-average
Niagara River flow during those months. Because Erie’s level continued to rise in July,
instead of falling as it has on average over the 1918–2012 period of record, the Niagara
River flow also continued to increase in July, although below its long-term average for that
month. In August, the Niagara River flow decreased, as the level of Lake Erie declined
and, as in July, remained below the average.
The combination of Lake Erie’s NTS and outflow resulted in the water level changes
experienced on the lake over the reporting period. While it is not possible to predict with
accuracy the water supplies to the lakes for the coming months, using historical supplies
and the current levels of each of the Great Lakes, it is possible to make some estimate of
water levels for a few months out. The six-month water level forecast prepared at the
beginning of September by the U.S. Army Corps of Engineers and Environment Canada
indicates that the level of Lake Erie is expected to fall back below average by October
unless well-above average water supply conditions are experienced.

5
TABLE 1 – MONTHLY AVERAGE LAKE ERIE WATER LEVELS
(Based on a network of 4 water level gauges)
International Great Lakes Datum (1985)
Metres Feet Month
Recorded* 2013
Average+ 1918–2012
Departure Recorded*
2013 Average+ 1918–2012
Departure
March 173.92 174.07 -0.15 570.60 571.10 -0.50
April 174.02 174.22 -0.20 570.93 571.59 -0.66
May 174.10 174.30 -0.20 571.19 571.85 -0.66
June 174.23 174.33 -0.10 571.62 571.95 -0.33
July 174.35 174.31 0.04 572.01 571.88 0.13
August 174.28 174.25 0.03 571.78 571.69 0.09
* Provisional + Period of record is 1918–2012
TABLE 2 – MONTHLY AVERAGE PRECEPITATION ON THE LAKE ERIE BASIN
Centimetres Inches Month
Recorded* 2013
Average+ 1900–2010
Departure Recorded*
2013 Average+
1900–2010
Departure Departure (in percent)
March 3.00 7.00 -4.00 1.18 2.76 -1.58 -57
April 11.96 8.04 3.92 4.71 3.17 1.54 49
May 6.53 8.53 -2.00 2.57 3.36 -0.79 -23
June 12.67 8.81 3.86 4.99 3.47 1.52 44
July 12.80 8.61 4.19 5.04 3.39 1.65 49
August 6.89 8.15 -1.26 2.71 3.21 -0.50 -15
* Provisional + Most recent period of record is 1900–2010

6
0
5
10
15
20
J 2012
F M A M J J A S O N D J 2013
F M A M J J A S O N D
Cen
timet
res
Months
Monthly PrecipitationLake Erie Basin
ActualAverageMaximumMinimum
Figure 2
173.0
173.5
174.0
174.5
175.0
175.5
J 2012
F M A M J J A S O N D J 2013
F M A M J J A S O N D
Elev
atio
n, m
etre
sIG
LD 1
985
Months
Monthly Mean Water LevelsLake Erie
ActualMaximumAverageMinimum
Figure 1

7
-1500
-1000
-500
0
500
1000
1500
2000
2500
3000
3500
4000
J 2012
F M A M J J A S O N D J 2013
F M A M J J A S O N D
Cub
ic M
etre
s pe
r Sec
ond
Months
Monthly Net Basin SuppliesLake Erie Basin
ActualAverage
Figure 3
175.0
175.5
176.0
176.5
177.0
177.5
178.0
J 2012
F M A M J J A S O N D J 2013
F M A M J J A S O N D
Elev
atio
n, m
etre
s IG
LD 1
985
Months
Monthly Mean Water Levels
ActualMaximumAverageMinimum
Lakes Michigan-Huron
Figure 4

8
0
1000
2000
3000
4000
5000
6000
7000
8000
9000
10000
J 2012
F M A M J J A S O N D J 2013
F M A M J J A S O N D
Cub
ic M
etre
s pe
r Sec
ond
Monthly Net Total SuppliesLake Erie Basin
ActualAverage
Months Figure 7
4000
4250
4500
4750
5000
5250
5500
5750
6000
J 2012
F M A M J J A S O N D J 2013
F M A M J J A S O N D
Cub
ic M
etre
s pe
r Sec
ond
Months
Monthly Mean FlowsDetroit River
Actual
Average
Figure 5
Figure 6

9
4750
5000
5250
5500
5750
6000
6250
6500
6750
J 2012
F M A M J J A S O N D J 2013
F M A M J J A S O N D
Cub
ic M
etre
s pe
r Sec
ond
Months
Niagara River Monthly Mean Flowsat Buffalo, New York
ActualAverage
Figure 6 3. OPERATION AND MAINTENANCE OF THE
INTERNATIONAL NIAGARA CONTROL WORKS
The water level in the CGIP is regulated in accordance with the Board's 1993 Directive.
The Directive requires that the Power Entities—Ontario Power Generation (OPG) and
the New York Power Authority (NYPA)—operate the INCW to ensure the maintenance of
an operational long-term average CGIP level of 171.16 m (561.55 feet) to ameliorate
adverse high or low water levels in the CGIP. The Directive also establishes tolerances
for the CGIP’s level as measured at the Material Dock gauge.
The Power Entities complied with the Board's Directive at all times during the reporting
period. The accumulated deviation of the CGIP’s level from March 1, 1973 through
August 31, 2013 was 0.50 metre-months (1.64 foot-months) above the long-term
operational average elevation. The maximum permissible accumulated deviation
is + 0.91 metre-months (+ 3.00 foot-months).
Figure 7

10
Tolerances for regulation of the CGIP level were suspended on March 21, 30, 31 and
April 1 to 3, 2013 due to ice conditions. Tolerances were also suspended on July 28,
2013 due to emergency conditions associated with a police action for the recovery of a
body from the lower Niagara River.
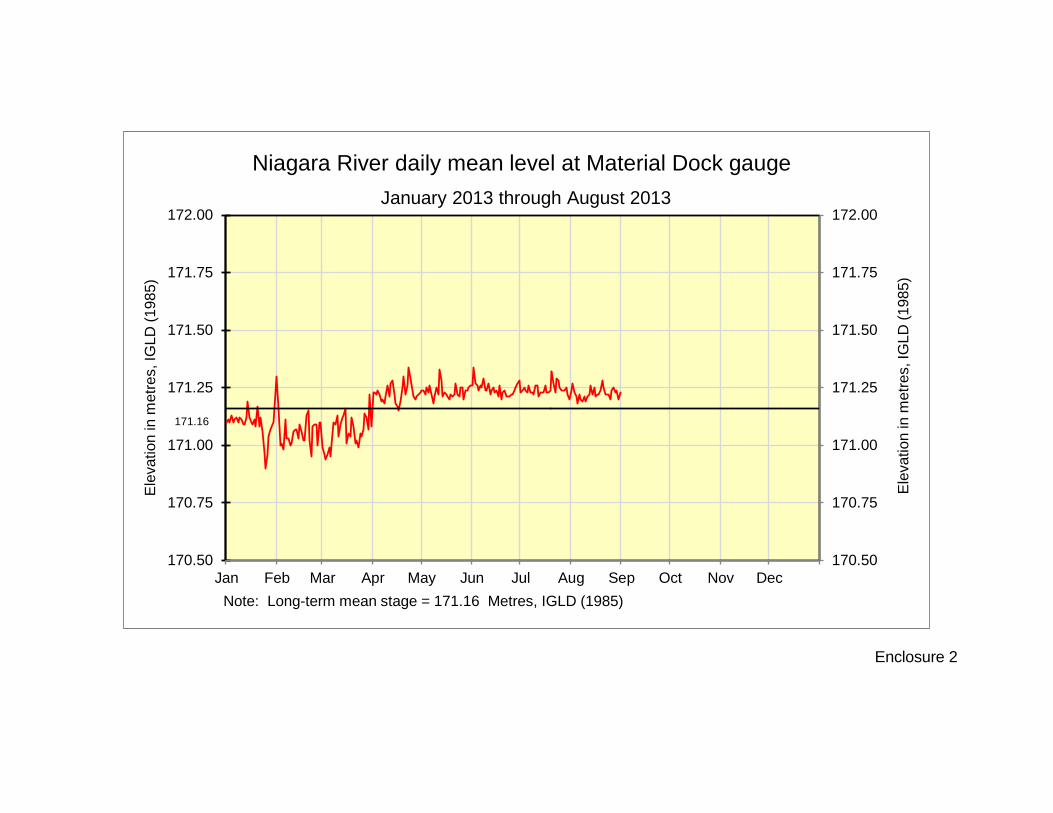
The locations of the water level gauges on the Niagara River are shown in Enclosure 1.
Recorded daily Material Dock water levels covering the period January through August
2013 are shown in Enclosure 2.
Gate 1 of the INCW remains out-of-service in anticipation of rehabilitation work following
the completion of the Niagara Tunnel Project. Work to repair hinges and replace seals
will be undertaken in the fall of 2013.
Following the failure and subsequent replacement of a flexible hydraulic hose associated
with the control system for Gate 13, OPG initiated a program to replace all similar
hydraulic hoses on the INCW. The piping and hose assemblies needed were fabricated
off site and their installation for all gates was completed between April 1 and May 17,
2013.
During a structural inspection of the INCW, carried out in November 2012, OPG identified
a potential issue with the concrete stability of its bridge supports. A load restriction has
been put into place for vehicles operating on the structure. Consulting engineering firms
have been commissioned to provide options for bridge strengthening. No final report is
available at the time of submission. Work to determine the most appropriate repair and
method of execution are on-going.
11
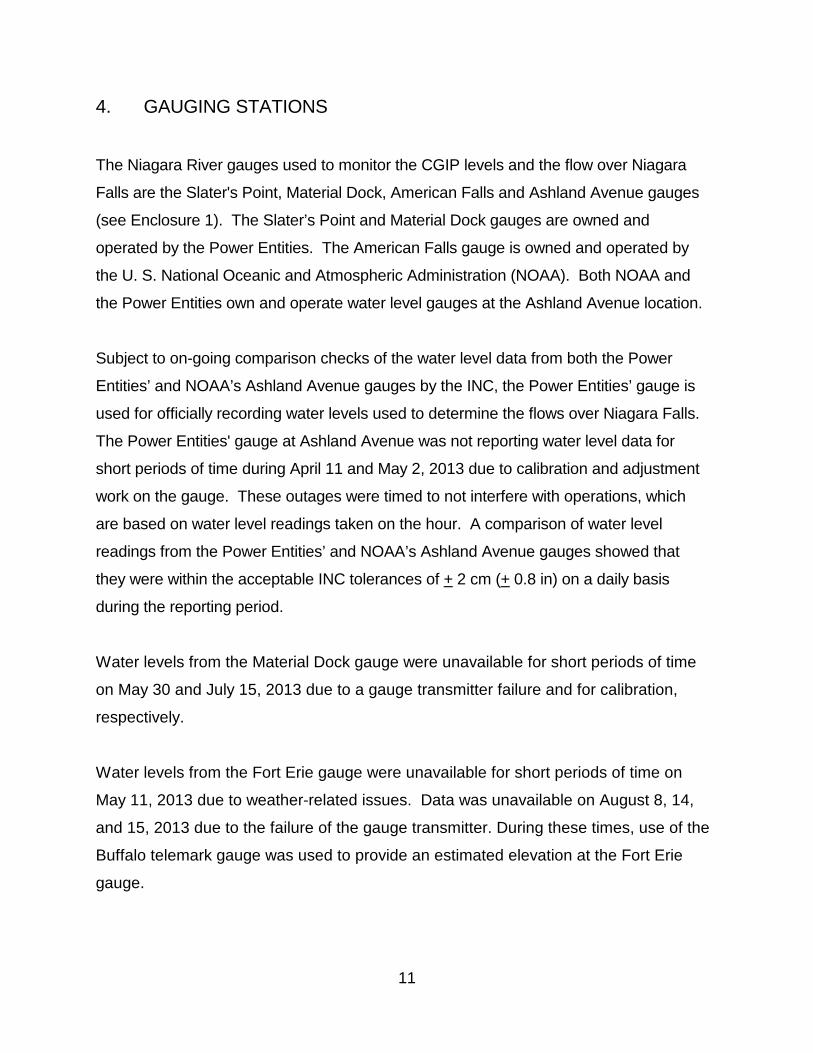
4. GAUGING STATIONS
The Niagara River gauges used to monitor the CGIP levels and the flow over Niagara
Falls are the Slater's Point, Material Dock, American Falls and Ashland Avenue gauges
(see Enclosure 1). The Slater’s Point and Material Dock gauges are owned and
operated by the Power Entities. The American Falls gauge is owned and operated by
the U. S. National Oceanic and Atmospheric Administration (NOAA). Both NOAA and
the Power Entities own and operate water level gauges at the Ashland Avenue location.
Subject to on-going comparison checks of the water level data from both the Power
Entities’ and NOAA’s Ashland Avenue gauges by the INC, the Power Entities’ gauge is
used for officially recording water levels used to determine the flows over Niagara Falls.
The Power Entities' gauge at Ashland Avenue was not reporting water level data for
short periods of time during April 11 and May 2, 2013 due to calibration and adjustment
work on the gauge. These outages were timed to not interfere with operations, which
are based on water level readings taken on the hour. A comparison of water level
readings from the Power Entities’ and NOAA’s Ashland Avenue gauges showed that
they were within the acceptable INC tolerances of + 2 cm (+ 0.8 in) on a daily basis
during the reporting period.
Water levels from the Material Dock gauge were unavailable for short periods of time
on May 30 and July 15, 2013 due to a gauge transmitter failure and for calibration,
respectively.
Water levels from the Fort Erie gauge were unavailable for short periods of time on
May 11, 2013 due to weather-related issues. Data was unavailable on August 8, 14,
and 15, 2013 due to the failure of the gauge transmitter. During these times, use of the
Buffalo telemark gauge was used to provide an estimated elevation at the Fort Erie
gauge.
12
All gauges required for the operation of the INCW were in operation during the
remainder of the reporting period.
Gates 2, 3 and 4 of the INCW were required to be out of service periodically from
February 23 to March 8, 2013 during the removal of the cofferdam associated with
OPG’s Niagara Tunnel Project. When the gates were in-service and conditions were
deemed safe, work to remove the cofferdam was undertaken. Gate 16 was unavailable
from May 3 to 29 and on July 17, 2013 due to oil seepage from the over pressure relief
system. Air was subsequently drained from the pressure system to alleviate the
problem. No oil was lost to the environment during this time.
A temporary water level datalogger was installed at the Maid of the Mist Steamship
Company dock by OPG on August 8, 2012. The datalogger was in place on a trial
basis and recorded water levels during the ice-free season of 2012. The datalogger
was reinstalled in April 19, 2013 following the ice season. Once sufficient data is
acquired and assessed, the case for installing a permanent water level gauge in the
vicinity of this location, to act as an alternative for the Ontario Power Generating Station
tailwater gauge and backup for the Ashland Avenue gauge, will be further investigated.
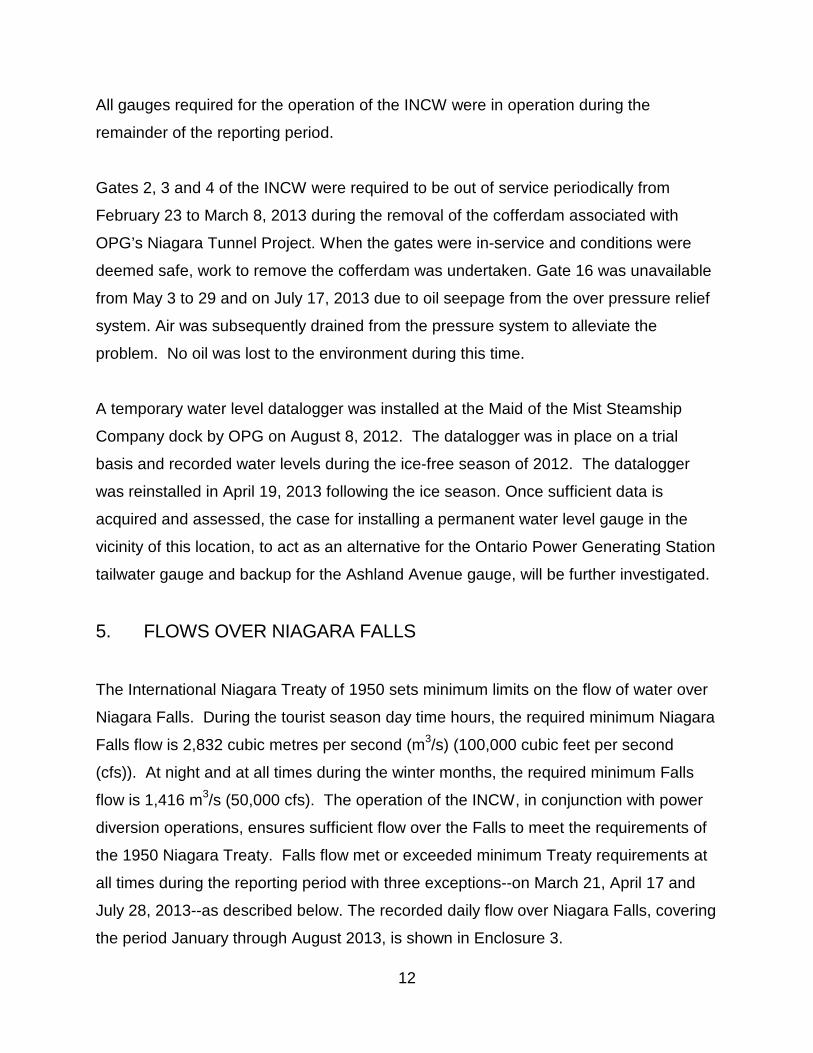
5. FLOWS OVER NIAGARA FALLS
The International Niagara Treaty of 1950 sets minimum limits on the flow of water over
Niagara Falls. During the tourist season day time hours, the required minimum Niagara
Falls flow is 2,832 cubic metres per second (m3/s) (100,000 cubic feet per second
(cfs)). At night and at all times during the winter months, the required minimum Falls
flow is 1,416 m3/s (50,000 cfs). The operation of the INCW, in conjunction with power
diversion operations, ensures sufficient flow over the Falls to meet the requirements of
the 1950 Niagara Treaty. Falls flow met or exceeded minimum Treaty requirements at
all times during the reporting period with three exceptions--on March 21, April 17 and
July 28, 2013--as described below. The recorded daily flow over Niagara Falls, covering
the period January through August 2013, is shown in Enclosure 3.

13
As a result of control actions to reduce the flow over Niagara Falls in excess of Treaty
minimum, the NRCC shift supervisor initiated small gate changes at 2:30 a.m. and
2:44 a.m. on March 21, 2013. Due to the presence of heavy lake ice in the
Maid-of-the-Mist Pool, combined with a pre-existing ice bridge, the elevation reflected at
the Ashland Avenue gauge fell below the minimum required prior to 4:00 am. In
response to the falling level, three control gates were fully opened to restore the
elevation as quickly as possible. However, the flow over Niagara Falls was 44 m3/s
(1,554 cfs) below the Treaty requirement for the hour of 4:00 a.m. on March 21, 2013.
In response to the resulting Treaty violation, Mr. Peter Kowalski, First Line Manager–
Operations NRCC, provided additional direction to NRCC Operating staff on the
requirements for forecasting the impact of control gate operations when ice is present in
the Maid-of-the-Mist Pool.
On April 17, 2013, while transitioning between the minimum Treaty flow requirement of
1,416 m3/s (50,000 cfs) and 2,832 m3/s (100,000 cfs), the NRCC shift operator failed to
take into consideration a declining Lake Erie level and did not account for changes in
river flow correction. Consequently, control gate openings were inadequate to meet the
minimum Treaty requirement. Corrective actions were undertaken, but with inadequate
time for them to be effective the flow over Niagara Falls was 54 m3/s (1907 cfs) below
the Treaty requirement for the hour of 8:00 a.m.
Given the circumstances and close timing of the March 21 and April 17, 2013 Treaty
violations, and in light of the similar Treaty violation on February 16, 2013, previously
reported in the Board’s 120th semi-annual report, the INC’s On-Site Representatives
requested that Mr. Kowalski organize and hold a formal Treaty compliance training
session for NRCC staff. In addition, the On-Site Representatives asked that members
and associates of the INC and the Board be able to attend to highlight the importance
of complying with the Treaty and to gain a fuller understanding of NRCC operations. In
response, Mr. Kowalski organized and held a training session on May 9, 2013. During
the session, which was attended by NRCC staff and six associates of the INC and the

14
Board, including Mr. Thompson the Canadian INC Member and Board Co-Chair,
Mr. Kowalski provided a detailed forensic analysis of each of the three recent violations,
provided direction on how to prevent similar situations in the future, and clearly
explained the importance of meeting the Treaty requirements at all times.
On July 28, 2013, the Niagara Parks Police requested that the morning transition from
nighttime to tourist-season daytime Treaty flow be delayed in order to execute the
recovery of a body that was found in the lower Niagara River. Recovery operations
were completed at 7:25 a.m. and actions to increase the flow over Niagara Falls were
commenced. However, the flow over Niagara Falls was 275 m3/s (9,711 cfs) below the
Treaty requirement of 2,832 m3/s (100,000 cfs) for 8:00 a.m. Flow was restored to
normal for 9:00 a.m.
6. FALLS RECESSION
Clause 2 of the IJC’s August 19, 1953 Directive constituting the International Niagara
Board of Control called for the Board to review, approve and oversee the construction
of the remedial works recommended in the Commission’s 1953 report to the
Governments of Canada and the United States on the preservation and enhancement
of Niagara Falls. The remedial works included excavation and fills on both the US and
Canadian flanks of the Cascades immediately upstream of the Horseshoe Falls and the
construction of the INCW. With the construction of the remedial works, the Board is
required to exercise control over the maintenance and operation of the remedial works
in a manner to meet the scenic-beauty requirements of Article IV of the 1950 Niagara
Treaty, with the objective of ensuring a dependable and adequate flow over the
Horseshoe Falls to provide an unbroken crestline. Therefore, as part of its activities,
the Board monitors the Horseshoe Falls for changes in its crestline that might result in a
broken curtain of water along its crestline or suggest the formation of a notch in the
crestline. The formation of a notch could signal a period of rapid Falls recession that
has not been seen in more than a century.

15
Based on the most recently available imagery, no significant changes in the crestline
were observed during the reporting period.
The Board has now geo-referenced both orthographic and oblique air photos utilizing a
Geographic Information System. This system will help to detect and evaluate any
future changes in the crestline.
7. DIVERSIONS AND FLOW AT QUEENSTON
Diversion of water from the Niagara River for power purposes is governed by the terms
and conditions of the 1950 Niagara Treaty. The Treaty prohibits the diversion of
Niagara River water that would reduce the flow over Niagara Falls for scenic purposes
to below the amounts specified previously in Section 5 of this report.
The hydro power plants, OPG’s Sir Adam Beck (SAB) I and II in Canada and NYPA’s
Niagara Power Project in the United States, withdraw water from the CGIP above
Niagara Falls and discharge it into the lower Niagara River at Queenston, ON and
Lewiston, NY, respectively.
During the period of March through August 2013, diversion for the SAB I and II plants
averaged 1,634 m3/s (57,700 cfs) and diversion to the Robert Moses Niagara Power
Project averaged 1,731 m3/s (61,130 cfs).
The average flow from Lake Erie to the Welland Canal for the period March through
August 2013 was 196 m3/s (6,920 cfs). Diversion from the canal to OPG’s DeCew Falls
Generating Stations averaged 139 m3/s (4,910 cfs) for the period March through August
2013.

16
Records of diversions for power generation covering the period March through August
2013 are shown in Enclosure 4.
The monthly average Niagara River flows at Queenston, Ontario, for the period of
March through August 2013, and departures from the 1900–2012 long-term average
are shown in Table 3. Maximum and minimum monthly average flows for the 1900–
2012 period of record are shown in Table 4. During the period March through August
2013, the flow at Queenston averaged 5,653 m3/s (199,630 cfs), with the monthly
values ranging between 5,350 m3/s (188,920 cfs) and 5,923 m3/s (209,180 cfs). The
flow at Queenston for the same period in 2012 averaged 5,777 m3/s (204,600 cfs), with
the monthly values ranging between 5,315 m3/s (187,700 cfs) and 6,360 m3/s
(224,600 cfs).
TABLE 3 - MONTHLY NIAGARA RIVER FLOWS AT QUEENSTON
Cubic Metres per Second Cubic Feet per Second
Recorded Average Recorded Average2013 1900-2012 2013 1900-2012
March 5350 5648 -298 188,930 199,460 -10,530
April 5567 5901 -334 196,600 208,390 -11,790
May 5612 6099 -487 198,190 215,380 -17,190
June 5620 6077 -457 198,470 214,610 -16,140
July 5923 5976 -53 209,170 211,040 -1,870
August 5847 5860 -13 206,480 206,940 -460
Average 5653 5927 -274 199,630 209,310 -9,680
Month Departure Departure

17
TABLE 4 - MONTHLY MAXIMUM AND MINIMUM NIAGARA RIVER FLOWS AT QUEENSTON
Cubic Metres per Second Cubic Feet per Second
Month Maximum Year Minimum Year Maximum Minimum
March 7320 1974 4130 1934 258,500 145,850
April 7550 1974 4380 1935 266,630 154,680
May 7560 1974 4530 1934 266,980 159,980
June 7610 1986 4470 1934 268,740 157,860
July 7510 1986 4360 1934 265,210 153,970
August 7190 1986 4370 1934 253,910 154,330
8. FLOW MEASUREMENTS IN THE NIAGARA RIVER AND THE WELLAND CANAL
Discharge measurements are regularly scheduled in the Niagara River and Welland
Canal as part of a program to verify the gauge ratings used to determine flow in these
channels for water management purposes. Measurements are obtained through joint
efforts of the United States Army Corps of Engineers (USACE) and Environment Canada.
Measurement programs require boats, equipment and personnel from both agencies to
ensure safety, quality assurance checks between equipment and methods, and bi-
national acceptance of the data collected. The USACE and Environment Canada
continue efforts to standardize measurement equipment and techniques. Historically,
measurements are made at several locations as described below. No regularly
scheduled measurements were made during the reporting period; however additional
discharge measurements were conducted in the Welland Supply Canal during the first
week in September 2013 and regularly scheduled measurements are planned in the
lower Niagara River (near the old Cableway section) in the fall of 2013.
International Railway Bridge: Regularly scheduled measurements are taken near the
International Railway Bridge on a 3-year cycle to provide information for evaluating stage-
discharge relationships for flow entering the Niagara River from Lake Erie. The most
recent regularly scheduled discharge measurements near the International Railway

18
Bridge were taken in May 2012. Low Lake Erie water levels in the fall provided an
opportunity to obtain measurements at lower flows, so an additional set of measurements
were made in November 2012. All of the 2012 measured flows were higher than those
computed using both the 2001 Buffalo stage-discharge and the Buffalo–Material Dock
stage-fall-discharge rating equations. As a result of reviewing previous discharge
measurements made near the International Railway Bridge, a revision of the 2001 Buffalo
rating equation is being proposed and is under review by the International Niagara Board
of Control’s Working Committee. The proposed Buffalo equation is closer to the 2012
measured flows than either of the two older equations, particularly the May 2012
measurements which averaged to be nearly the same as the proposed equation. The
Buffalo rating equation is used in Great Lakes water supply routing models to estimate
the flow in the Niagara River and to verify other Niagara River flow estimates.
Environment Canada is also taking continuous measurements of water levels at a new
International Gauging Station (water levels and flow monitoring) located near the
International Bridge section. Flow measurements were taken during the summer to
observe the impact of aquatic plant growth on flows, and Environment Canada hopes to
use acoustic velocity measurement data to assist with assessing flow conditions under ice
this winter. Continuous daily discharge data is targeted to be published at this location,
with the recent installation of an Acoustic Doppler Velocity Meter (ADVM) device providing
assistance during backwater conditions due to ice and aquatic vegetation.
Cableway Section: Discharge measurements are made on a 3-year cycle at the
Cableway section, located just upstream of the OPG and NYPA hydroelectric generating
stations at Queenston–Lewiston, to verify the 2009 Ashland Avenue gauge rating of the
outflow from the Maid-of-the-Mist Pool below the Falls. The Ashland Avenue gauge
rating is used to determine the flow over Niagara Falls for purposes of the 1950 Niagara
Treaty. In the spring of 2007, Acoustic Doppler Current Profiler (ADCP) technology
replaced the use of conventional current meter measurements at the Cableway section.
Measurements have been made using only ADCP technology since that time. Discharge
measurements were last conducted near the Cableway section in October 2010 and,

19
following the regular measurement schedule for this site, are planned again for
October 29 through November 1, 2013. During this measurement session, additional
measurements will be made downstream of the OPG and NYPA hydroelectric generating
stations at Queenston–Lewiston during run-of-river conditions to measure the total flow in
the lower Niagara River. The total flows measured will be compared to the sum of the
outflow from the Maid-of-the-Mist Pool (flow over Niagara Falls) and the discharges from
the hydroelectric generating stations.
American Falls: Discharge measurements are made in the American Falls Channel on a
5-year cycle to verify the rating equation used to determine the amount of flow in the
American Falls channel and to demonstrate that a dependable and adequate flow of
water is maintained over the American Falls and in the vicinity of Three Sisters Islands.
Since American Falls flow is directly related to the operation of the CGIP, the Board
monitors this relationship. Historically, measurements were made from the pedestrian
bridges between Goat Island, Green Island and the U.S. mainland, using conventional
measurement methods. In May 2007, measurements were successfully made using an
ADCP mounted on a tethered boat at a new section located near the American Falls
Gauge site. The measurements made at this section matched the rating equation very
well. In May 2012, as part of the regular 5-year measurement cycle, discharge
measurements were again made at this section using an ADCP mounted on a remote
control boat. On average, there was no difference between the 2012 measured flows
and flows computed using the present American Falls rating equation. Following the 5-
year cycle, the next scheduled measurements at this location are expected to be made in
the spring of 2017.
Welland Canal: Discharge measurements are made on a 3-year cycle in the Welland
Supply Canal above Weir 8 to verify the Weir 8 rating, which is used in the determination
of flow through the Welland Canal. Regularly scheduled measurements were last made
in the Welland Supply Canal in May 2010. However, due to the St. Lawrence Seaway
Management Corporation’s inability to provide water level data for the time of the 2010
measurements, these measurements could not be used to verify the rating. Therefore,
20
off-schedule measurements were made in the Welland Supply Canal in May 2012 to
address the lack of results from the 2010 measurements. The preliminary analysis of the
data from the 2012 measurements indicates that the measurements fit the current rating,
which is based on the 2007 and 2009 measurement series. It is anticipated that the next
regularly scheduled measurements in the Welland Supply Canal will take place in 2015.
The rated Weir 8 discharge is currently based on data provided by an ADVM and water
level gauging equipment installed by the St. Lawrence Seaway Management Corporation.
In order to provide redundancy for this installation, a second set of ADVM and water level
gauging equipment has been installed upstream of the existing ADVM by the Seaway
Corporation. Discharge measurements at the Weir 8 site were conducted during the first
week in September 2013 to develop a Weir 8 rating for the new installation. These
measurements were in addition to the regularly scheduled measurements in the Welland
Supply Canal.
9. NIAGARA TUNNEL PROJECT AND PLANT UPGRADES
OPG completed construction of the Niagara Tunnel Project prior to the beginning of the
reporting period. The tunnel was watered up on March 2 and 3, 2013 and was officially
declared to be in-service on March 9, 2013. Testing of the new tunnel’s performance
relative to its design capacity was carried out by OPG on July 23 and 24, 2013 and
confirmed the total tunnel capacity to be 500 m3/s (17,660 cfs) +2%. The increased
diversion capacity provided by the new tunnel will enable OPG’s SAB plants to more fully
utilize Canada’s diversion entitlement for power production. Increased diversion will not
affect the regulation of the CGIP, which is governed by the Board’s 1993 Directive.
OPG began a unit rehabilitation program in 2007 for a number of its Beck I units —
Units G3, G7, G9 and G10. G1 and G2, which are 25 Hz units, remain removed from
service at this time, and rehabilitation of G4, G5, G6 and G8 will be considered after
work is completed on the other units as they were more recently upgraded. The
upgrades of Units G7 and G9 were completed in March 2009/February 2012 (in two

21
parts) and December 2010, respectively. Work to replace the G3 runner and for a
generator re-wind began in April 2012 and was completed in July 2013. G10 is
expected to go out of service in June 2015 for rehabilitation.
The Beck I units were originally built with Johnson Valves at the bottom of the
penstocks that could be activated to stop water from entering the units. These valves
are being removed and their function replaced with headgates that can prevent water
from entering the penstocks. As the units are upgraded, sleeves will be installed where
the Johnson Valves were removed to improve flow through that portion of the penstock.
A sleeve was not installed when G7 was initially upgraded in 2009. The unit was taken
out of service again, from early March 2011 until late February 2012, to complete this
work. Although an Index Test for G7 was scheduled for May 2012, it was postponed
because of vibration problems with the unit. It was decided that a full Gibson Test would
be done when the vibration issues are resolved, and this test is now scheduled for some
time in November or December 2013. It is recognized that the rating tables currently
being used for G7 do not reflect the improvements in performance of the unit expected
with the installation of the Johnson Valve sleeve because the table was based on earlier
model tests, and that they may result in a slight over-reporting of the water used by the
unit. Similarly, G3 is being operated on an interim rating table until a Gibson test takes
place. The date of this test has not yet been confirmed.
10. ICE CONDITIONS AND ICE BOOM OPERATIONS
Lake Erie Ice conditions for the 2012–13 ice seasons were dictated by rising and falling
temperatures for the region. The ice season saw short, cold spells followed by
unseasonably warm temperatures. Ice cover maps produced jointly by the Canadian Ice
Service and the US National Ice Center based on RADARSAT (Radar Satellite)
information indicated a high percentage of ice cover on Lake Erie throughout the ice
season; however, the majority of this ice was defined as medium or skim ice. Although a
stable ice cover did form for a large area immediately behind the boom, inconsistent
weather did not allow a solid ice formation to occur on Lake Erie.

22
Towards the end of the 2012–13 ice season, members of the International Niagara
Working Committee agreed that the ice formed in the eastern basin of Lake Erie was very
thin and, therefore, unsafe for landing a helicopter on. As a result, the Working
Committee cancelled both helicopter flights that are typically carried out during the
season to measure ice thickness. A fixed-wing aircraft flight was performed over Lake
Erie during the morning of March 25, 2013 to determine the extent and condition of the
ice cover. The ice observation flight revealed less than 230 square kilometres (89
square miles) of ice remained on the eastern part of Lake Erie, and a limited amount of
ice buildup in the Maid-of-the-Mist Pool below Niagara Falls. Given the limited ice
cover, and the limited potential for significant new ice to form in either location,
preparations for the removal of the ice boom began immediately after the fixed wing
flight, and removal began during the afternoon of March 25, 2013.
Six spans were removed from the Canadian side and tied against the Buffalo break wall
on March 25, 2013. The ice boom crew continued Phase 1 of the removal process on
March 26, and removed 4 spans from between the break walls along the American side,
2 spans from the Canadian side, and opened 1 additional span leaving it trailing. During
the night of March 26, two pontoons were stripped off the trailing span during ice flow past
the boom. NYPA recovered one pontoon the following day; however, the second pontoon
has not been recovered. Only two spans were removed on March 27 and one was left
trailing, due to difficulties encountered with the ice field exerting tension on the spans.
The final 6 spans were removed and tied off to the break wall on March 28, completing
Phase 1 of the removal process.
Weather was not favourable for the ice boom crew to safely retrieve buoy barrels at the
beginning of Phase 2 of the removal process. For many days, high west winds and
continual ice accumulation persisted at the east section of the Buffalo harbour. Finally,
with favourable weather conditions, 12 out of 23 buoy barrels were removed from the
Canadian side on April 8. Phase 2 of the ice boom removal process was completed on
April 9, 2013 when the remaining 11 junction plate buoy barrels were removed.

23
Phase 3, the final phase, of the ice boom removal process began on April 10 when ice
boom crews began towing the 152-metre (500-foot) long ice boom spans to the boom’s
Katherine Street, Buffalo, NY storage site where they were pulled onto shore. Four spans
were towed and pulled onto shore on April 10 and 11. Three spans were towed from the
inner break to the ice boom storage facility on April 12. Another 5 spans were pulled to
shore on April 15. April 17, 2013 marked the end of another ice-boom season when the
final 3 spans were brought to and pulled onto the storage site.
The ice boom performed as designed during the 2012–13 ice season. The boom
experienced two span breaks during the 2012–13 ice season as a result of high winds
and strong ice pressure.
11. MEETING WITH THE PUBLIC
In accordance with the Commission’s requirements, the Board held its annual meeting
with the public during the evening of September 19, 2013 at the Niagara-on-the-Lake
Community Centre in Niagara-on-the-Lake, ON. Information on items including current
and projected Great Lakes levels, the operation of the Lake Erie–Niagara River Ice
Boom, OPG’s Niagara Tunnel Project, and the recession of Niagara Falls was
presented at the meeting. There were about 25 people at the meeting, with nine
members of the public attending in person and two people participating on-line via
webinar/teleconference. The 2013 annual meeting was the first time the Board has
offered telephone and on-line options as an extension of its face-to-face meeting.
12. MEMBERSHIP OF THE BOARD AND ITS WORKING COMMITEE
The membership of the Board is unchanged from the last report.
Dr. Frank Seglenieks, Environment Canada, was appointed by Mr. Thompson to the
position of Canadian Co-Chair of the Board’s Working Committee on August 21, 2013.

24
Dr. Seglenieks replaced Mr. Jacob Bruxer who, having accepted a new position within
Environment Canada’s Great Lakes–St. Lawrence Regulation Office in Cornwall, ON, is
no longer able to dedicate time to matters related to the Niagara Board and its Working
Committee.
13. ATTENDANCE AT BOARD MEETINGS
The Board met once during this reporting period. The meeting was held September 19,
2013, in Burlington, ON. Mr. Thompson, Canadian Section Chair, Colonel Peterson,
Alternate U.S. Section Chair, Ms. Keyes, Canadian Member, and Mr. Allerton, U.S.
Member, were in attendance.
Original Signed by Original Signed by -------------------------------------------------------------- ------------------------------------------------------- Mr. AARON F. THOMPSON BG MARGARET W. BURCHAM Chair, Canadian Section Chair, United States Section Original Signed by Original Signed by -------------------------------------------------------------- ------------------------------------------------------- Ms. JENNIFER L. KEYES Mr. WILLIAM H. ALLERTON Member, Canadian Section Member, United States Section

2
Enclosure 1
170.50
170.75
171.00
171.25
171.50
171.75
172.00
170.50
170.75
171.00
171.25
171.50
171.75
172.00
Jan Feb Mar Apr May Jun Jul Aug Sep Oct Nov Dec
Ele
vatio
n in
met
res,
IGLD
(198
5)
Ele
vatio
n in
met
res,
IGLD
(198
5)Niagara River daily mean level at Material Dock gauge
January 2013 through August 2013
171.16
Note: Long-term mean stage = 171.16 Metres, IGLD (1985)
Enclosure 2

1000
1500
2000
2500
3000
3500
4000
4500
5000
1000
1500
2000
2500
3000
3500
4000
4500
5000
Jan Feb Mar Apr May Jun Jul Aug Sep Oct Nov Dec
Flow
(m 3 /s
)
Flow
(m 3 /s
)Daily flow over Niagara Falls
Flow at Ashland Avenue gauge in cubic metres per second (m3/s)
28322832
Non-tourist season Non-tourist seasonTourist season - night schedule
Tourist season - day schedule
1416 1416
Minimum flows required by the Niagara treaty: 2832 m3/s during the tourist season - day schedule1416 m3/s at all other times
Tourist season - day schedule0800 TO 2200 Hours April 1 through September 150800 TO 2000 Hours September 16 through October 31
January 2013 through August 2013
Enclosure 3

0
500
1000
1500
2000
2500
3000
3500
4000
4500
5000
0
500
1000
1500
2000
2500
3000
3500
4000
4500
5000
Jan Feb Mar Apr May Jun Jul Aug Sep Oct Nov Dec
Flow
(m 3
/s)
Flow
(m 3
/s)
Daily diversion of Niagara River water* for power purposesJanuary 2013 through August 2013
United States
Total (United States and Canada)
Canada (Beck 1 and 2 + Decew)
* For purposes of the Niagara treaty, this includes the Niagara River and the Welland ship canal
Enclosure 4


![PHOTOGRAPHS OF NIAGARA, MARINETTE … of Niagara... · PHOTOGRAPHS OF NIAGARA, MARINETTE COUNTY, WISCONSIN [Compiled and Captioned by William John Cummings] 3 View of Niagara, Wisconsin,](https://img.pdfslide.net/doc/110x75/5b993acd09d3f207308b54bc/photographs-of-niagara-marinette-of-niagara-photographs-of-niagara-marinette.jpg)