Embed Size (px)
Citation preview

International Ocean Discovery ProgramExpedition 375 Preliminary Report
Hikurangi Subduction Margin Coring and Observatories
Unlocking the secrets of slow slip through drilling to sample and monitor the forearc and subducting plate
8 March–5 May 2018
Demian M. Saffer, Laura M. Wallace, Katerina Petronotis, and the Expedition 375 Scientists

Publisher’s notesCore samples and the wider set of data from the science program covered in this report are under
moratorium and accessible only to Science Party members until 5 May 2019.
This publication was prepared by the JOIDES Resolution Science Operator (JRSO) at Texas A&M University (TAMU) as an account of work performed under the International Ocean Discovery Program (IODP). Funding for IODP is provided by the following international partners:
National Science Foundation (NSF), United StatesMinistry of Education, Culture, Sports, Science and Technology (MEXT), JapanEuropean Consortium for Ocean Research Drilling (ECORD)Ministry of Science and Technology (MOST), People’s Republic of ChinaKorea Institute of Geoscience and Mineral Resources (KIGAM)Australia-New Zealand IODP Consortium (ANZIC)Ministry of Earth Sciences (MoES), IndiaCoordination for Improvement of Higher Education Personnel (CAPES), Brazil
Portions of this work may have been published in whole or in part in other IODP documents or publications.
DisclaimerAny opinions, findings, and conclusions or recommendations expressed in this publication are
those of the author(s) and do not necessarily reflect the views of the participating agencies, TAMU, or Texas A&M Research Foundation.
CopyrightExcept where otherwise noted, this work is licensed under the Creative Commons
Attribution 4.0 International (CC BY 4.0) license (https://creativecommons.org/ licenses/by/4.0/). Unrestricted use, distribution, and reproduction are permitted, provided the original author and source are credited.
CitationSaffer, D.M., Wallace, L.M., Petronotis, K., and the Expedition 375 Scientists, 2018. Expedition 375 Preliminary
Report: Hikurangi Subduction Margin Coring and Observatories. International Ocean Discovery Program. https://doi.org/10.14379/iodp.pr.375.2018
ISSNWorld Wide Web: 2372-9562
July 2018

D.M. Saffer et al. Expedition 375 Preliminary Report
Expedition 375 participants
Expedition 375 scientistsDemian M. SafferCo-Chief Scientist
Department of GeosciencesThe Pennsylvania State [email protected]
Laura M. WallaceCo-Chief Scientist
Tectonophysics DepartmentGNS ScienceNew [email protected]
Katerina E. PetronotisExpedition Project Manager/Staff Scientist
International Ocean Discovery ProgramTexas A&M [email protected]
Philip M. BarnesCore-Log-Seismic Integration Specialist
Ocean GeologyNational Institute of Water and Atmospheric Research (NIWA)New [email protected]
Rebecca E. BellCore-Log-Seismic Integration Specialist
Geology and GeophysicsImperial College LondonUnited [email protected]
Martin P. CrundwellMicropaleontologist (foraminifers)/Observer
Paleontology and Environmental Change SectionGNS ScienceNew [email protected]
Christie H.E. de OliveiraSedimentologist
Programa de Pós-Graduação em GeologiaUniversidade do Vale do Rio dos [email protected]
Ake FagerengStructural Geologist
School of Earth and Ocean SciencesCardiff UniversityUnited [email protected]
Patrick M. FultonPetrophysics (downhole measurements)/Observatory Specialist
Department of Geology and GeophysicsTexas A&M [email protected]
Annika GrevePaleomagnetist
R&D Center for Ocean Drilling Science (ODS)Japan Agency for Marine-Earth Science and Technology
(JAMSTEC)[email protected]
Robert N. HarrisPetrophysics (physical properties/downhole measurements)
SpecialistCollege of Earth, Ocean and Atmospheric SciencesOregon State [email protected]
Yoshitaka HashimotoSedimentologist
Department of Natural Environmental ScienceKochi [email protected]
Andre HüpersInorganic Geochemist
MARUMUniversity of [email protected]
Matt J. IkariPetrophysics (physical properties) Specialist
MARUMUniversity of [email protected]
Yoshihiro ItoPetrophysics (physical properties) Specialist
Disaster Prevention Research InstituteKyoto [email protected]
Hiroko KitajimaPetrophysics (physical properties) Specialist
Department of Geology and GeophysicsTexas A&M [email protected]
3

D.M. Saffer et al. Expedition 375 Preliminary Report
Steffen O. KutterolfSedimentologist
GEOMAR, Research Center for Marine GeosciencesChristian-Albrechts-Universitat zu Kiel (IFM)[email protected]
Hikweon LeePetrophysics (physical properties) Specialist
Climate Change Mitigation and SustainabilityKorea Institute of Geoscience and Mineral Resources (KIGAM)Republic of [email protected]
Xuesen LiPaleomagnetist
College of Earth ScienceGuilin University of [email protected]
Min LuoInorganic Geochemist
Hadal Science and Technology Research CenterCollege of Marine SciencesShanghai Ocean [email protected]
Pierre R. MalieOrganic Geochemist
Geosciences Montpellier LaboratoryUniversité [email protected]
Francesca MeneghiniSedimentologist
Dipartimento di Scienze della TerraUniversità degli Studi di [email protected]
Julia K. MorganStructural Geologist
Department of Earth ScienceRice [email protected]
Atsushi NodaSedimentologist
Research Institute of Geology and GeoinformationNational Institute of Advanced Industrial Science and
Technology (AIST)Geological Survey of [email protected]
Hannah S. RabinowitzSedimentologist
Lamont-Doherty Earth ObservatoryColumbia [email protected]
Heather M. SavageStructural Geologist
Lamont-Doherty Earth ObservatoryColumbia [email protected]
Claire L. ShepherdMicropaleontologist (nannofossils)
Paleontology and Environmental Change SectionGNS ScienceNew [email protected]
Srisharan ShreedharanPetrophysics (downhole measurements) Specialist
Department of GeosciencesThe Pennsylvania State [email protected]
Evan A. SolomonInorganic Geochemist/Observatory Specialist
School of OceanographyUniversity of [email protected]
Michael B. UnderwoodSedimentologist
Department of Earth and Environmental ScienceNew Mexico Institute of Mining and [email protected]
Maomao WangStructural Geologist
College of OceanographyHohai [email protected]
Adam D. WoodhouseMicropaleontologist (foraminifers)
School of Earth and EnvironmentUniversity of LeedsUnited [email protected]
Education and outreachThanos A. FatourosOutreach Officer
Aliki WeststrateOutreach Officer
4

D.M. Saffer et al. Expedition 375 Preliminary Report
Operational and technical staff
Siem Offshore AS officialsJacob C. RobinsonMaster of the Drilling Vessel
Mark RobinsonDrilling Supervisor
JRSO shipboard personnel and technical representativesSusan BoehmX-Ray Laboratory
Lisa BrandtChemistry Laboratory
Ty CobbPhysical Properties Laboratory
Lisa CrowderLaboratory Officer
Aaron de LoachAssistant Laboratory Officer
Ekanta DesaiPublications Specialist
Keith DupuisUnderway Geophysics Laboratory
Tim FultonSenior Imaging Specialist
Clayton FurmanLogging Engineer
Randy GjesvoldMarine Instrumentation Specialist
Kevin GrigarOperations Superintendent
Sandra HerrmannAssistant Laboratory Officer
Michael HodgeMarine Computer Specialist
Minh HuynhMarine Computer Specialist
Nicolette LawlerX-Ray Laboratory
Aaron MechlerChemistry Laboratory
Mike MeiringEngineer
Algie MorganApplication Developer
Beth NovakPaleomagnetism Laboratory
William RhinehartEngineer
Catherine SmithCuratorial Specialist
Larry TuttleCore Laboratory (temporary)
John Van HyfteEngineer
Garrick Van RensburgMarine Instrumentation Specialist
Hai (James) ZhaoApplication Developer
5

D.M. Saffer et al. Expedition 375 Preliminary Report
AbstractSlow slip events (SSEs) at the northern Hikurangi subduction
margin, New Zealand, are among the best-documented shallow SSEs on Earth. International Ocean Discovery Program Expedition 375 was undertaken to investigate the processes and in situ condi-tions that underlie subduction zone SSEs at the northern Hikurangi Trough by (1) coring at four sites, including an active fault near the deformation front, the upper plate above the high-slip SSE source region, and the incoming sedimentary succession in the Hikurangi Trough and atop the Tūranganui Knoll Seamount, and (2) installing borehole observatories in an active thrust near the deformation front and in the upper plate overlying the slow slip source region. Logging-while-drilling (LWD) data for this project were acquired as part of Expedition 372 (26 November 2017–4 January 2018; see the Expedition 372 Preliminary Report for further details on the LWD acquisition program).
Northern Hikurangi subduction margin SSEs recur every 1–2 years and thus provide an ideal opportunity to monitor deformation and associated changes in chemical and physical properties throughout the slow slip cycle. Sampling of material from the sedi-mentary section and oceanic basement of the subducting plate re-veals the rock properties, composition, lithology, and structural character of material that is transported downdip into the SSE source region. A recent seafloor geodetic experiment raises the pos-sibility that SSEs at northern Hikurangi may propagate all the way to the trench, indicating that the shallow thrust fault zone targeted during Expedition 375 may also lie in the SSE rupture area. Hence, sampling at this location provides insights into the composition, physical properties, and architecture of a shallow fault that may host slow slip.
Expedition 375 (together with the Hikurangi subduction LWD component of Expedition 372) was designed to address three funda-mental scientific objectives: (1) characterize the state and composi-tion of the incoming plate and shallow plate boundary fault near the trench, which comprise the protolith and initial conditions for fault zone rock at greater depth and which may itself host shallow slow slip; (2) characterize material properties, thermal regime, and stress conditions in the upper plate above the core of the SSE source re-gion; and (3) install observatories at an active thrust near the defor-mation front and in the upper plate above the SSE source to measure temporal variations in deformation, temperature, and fluid flow. The observatories will monitor volumetric strain (via pore pressure as a proxy) and the evolution of physical, hydrological, and chemical properties throughout the SSE cycle. Together, the coring, logging, and observatory data will test a suite of hypotheses about the fundamental mechanics and behavior of SSEs and their relation-ship to great earthquakes along the subduction interface.
IntroductionSlow slip events (SSEs) involve transient aseismic slip on a fault
(lasting weeks to years) at a slip velocity intermediate between plate tectonic rates and those required to generate seismic waves. Only since the advent of dense, plate boundary–scale geodetic networks in the last ~15 years has the importance of these events as a signifi-cant mode of fault slip been recognized. The observation of SSEs and associated seismic phenomena (e.g., tremor and low-frequency earthquakes) along subduction megathrusts worldwide (see review in Schwartz and Rokosky, 2007) has ignited one of the most dy-
namic fields of current research in seismology (e.g., Rubinstein et al., 2010; Peng and Gomberg, 2010; Wech and Creager, 2011). De-spite this intense interest, the physical mechanisms that underlie SSEs and the relationship of SSEs to destructive seismic slip on sub-duction thrusts are poorly known.
This deficiency in our understanding of SSEs is partly due to the fact that most well-studied subduction zone SSEs (e.g., Cascadia and southwest Japan) occur too deep for high-resolution imaging or direct sampling of the source region. A notable exception is the northern Hikurangi margin, New Zealand, where well-character-ized SSEs occur every 1–2 years over a period of 2–3 weeks at depths <2–15 km below the seafloor (Wallace and Beavan, 2010; Wallace et al., 2016) (Figure F1). The proximity of SSEs to the sea-floor makes it feasible to drill into and sample, collect downhole logs from, and conduct monitoring in the near field of the SSEs. The regularity and well-characterized short repeat interval of the SSEs allow monitoring over multiple SSE cycles, with the potential to document the spatial and temporal distribution of strain accumula-tion and release, as well as any associated hydrogeologic phenom-ena.
The scientific objectives of International Ocean Discovery Pro-gram (IODP) Expedition 375 (and allied IODP Expedition 372) were threefold:
• Document the physical, hydrogeological, and chemical proper-ties; lithology; geometry; microstructure; and thermal state of the subduction inputs and an active thrust fault near the trench located near (and possibly within) the shallowest reaches of SSE slip. The inputs include the sediment and upper igneous crust of the subducting Pacific plate, with an emphasis on intervals that host or will eventually host SSEs.
• Define the stress regime, thermal structure, porosity, permeabil-ity, lithology, pore fluid pressure state, fluid chemistry, flow pathways, and structural geology of the upper plate overlying the SSE source region.
• Install observatories in the upper plate and in an active thrust near the deformation front that span the SSE source region to monitor deformation and changes in temperature and hydroge-ology related to SSEs.
BackgroundGeological setting
In the region of the Expedition 375 drilling transect, the Pacific plate subducts westward beneath the North Island of New Zealand along the Hikurangi Trough at 4.5–5.5 cm/y (Wallace et al., 2004) (Figure F1). The subducting plate is composed of the Hikurangi Pla-teau, a Cretaceous large igneous province. The plateau sequence is overlain by a ~1 km thick Cenozoic to Mesozoic sedimentary se-quence (Figure F2) that increases to >5 km in thickness to the south (e.g., south of ~40°S). The northern part of the margin is currently largely nonaccretionary and locally exhibits frontal tectonic erosion associated with subducting seamounts (Lewis et al., 1998; Collot et al., 2001; Pedley et al., 2010). Where accretion does occur, the mar-gin is characterized by a narrow, steeply tapered (>10° taper angle) wedge (Barker et al., 2009). A number of seamounts are present on the Pacific plate approaching the deformation front (e.g., Tūran-ganui Knoll and Puke Seamounts). The subduction thrust is identi-fied as a décollement between a relatively less deformed subducting sequence below and a highly deformed imbricated thrust wedge above.
6
D.M. Saffer et al. Expedition 375 Preliminary Report
SSEs at the northern Hikurangi margin occur every 18–24 months and typically involve 1–3 cm of southeastward surface dis-placement at continuously operating GPS (cGPS) sites (Figure F1) along the coast. The portion of the subduction interface that under-goes slow slip is almost fully locked between the SSEs, and this slip deficit is mostly or completely recovered by the SSEs (Wallace and Beavan, 2010). The equivalent moment magnitudes of the largest SSEs are typically Mw 6.5–7.0, with average slip of ~7–20 cm on the plate interface. These larger SSEs are punctuated by more frequent smaller events (one or more per year) that are not as well character-ized (see GPS time series inset in Figure F1). SSE slip in this area is predominantly offshore, and the events appear to repeatedly rup-ture similar areas of the interface (Wallace and Beavan, 2010). A re-cent seafloor geodetic experiment has shown that slow slip occurs to within ≤2 km of the seafloor along the Expedition 375 drilling transect, and it is possible that slow slip continues all the way to the trench (Wallace et al., 2016).
Multichannel seismic data reveal that the source areas of some SSEs (between <5 and >10–16 km depth) correspond to the top of a thick high-amplitude reflectivity zone (HRZ) at the plate interface (Figures F1, F2) (Bell et al., 2010). The high-amplitude reflectivity has been hypothesized to result from undercompaction and high fluid pressures in sediments entrained between downgoing sea-mounts. Alternatively, the reflectors may represent lithologic pack-ages (e.g., altered basaltic lavas or volcaniclastic sediments). If the former interpretation is correct, then the inferred correlation be-tween the HRZ and a subset of the SSEs would support the idea that fluid pressure is associated with the generation of slow slip by re-ducing effective stress; if the latter interpretation is correct, the cor-relation would suggest a compositional control on fault slip behavior (e.g., Kodaira et al., 2004; Liu and Rice, 2007; Audet et al., 2009; Song et al., 2009; Saffer and Wallace, 2015).
Previous drilling in the regionNo previous scientific drilling has been undertaken at the Hiku-
rangi subduction margin. A total of 44 industry exploration wells have been drilled onshore, ranging in depth from <100 to 4352 m, and 3 have been drilled offshore the east coast of the North Island. These wells target the East Coast Basin, which overlies much of the inner Hikurangi forearc.
Previous drilling during Ocean Drilling Program Leg 181 tar-geted the eastern portion of the Hikurangi Plateau (Sites 1123 and 1124) ~900 and ~600 km (respectively) east of the coast of the North Island of New Zealand. Results of this drilling allow a prelim-inary correlation of seismic facies (Plaza-Faverola et al., 2012; Ghi-setti et al., 2016; Barnes et al., 2018) that suggests the following Hikurangi Plateau stratigraphy: (1) a basal sequence of high-velocity (>4 km/s) basaltic rocks; (2) an overlying 3 km thick Hikurangi Basement Sequence (HKB) interpreted to comprise 120 Ma volca-niclastics and/or chert or limestone; (3) a late stage (100–90 Ma) volcanic cone and seamount constructional sequence; (4) a 150–230 m thick sedimentary cover sequence comprising an upper sequence (70–32 Ma) of nannofossil chalks and mudstones and a possible lower sequence (100–70 Ma) of clastic sedimentary rocks; and (5) a 1000–1200 m thick trench-fill cover sequence of late Cenozoic tur-bidites, mudstones, and debris flows. At the deformation front be-neath Puke Ridge (Figure F2), the subduction décollement is developed at ~5 km below sea level and ~2 km below the seabed in the upper part of the HKB.
Scientific objectives (overall primary and secondary objectives)
Coring, downhole logging, and long-term observatories in-stalled at the Expedition 375 drill sites were planned to address a suite of hypotheses regarding slow slip and the mechanics of sub-duction megathrusts:
• SSEs propagate to the trench. They are not confined to a specific (narrow) pressure or temperature range.
• Pore fluid pressure is elevated in the source region of SSEs. The elevated pore pressures are driven by a combination of compac-tion disequilibrium and mineral dehydration reactions that oc-cur as sediments and altered igneous crust on the incoming plate are buried and heated during subduction.
• SSEs occur in regions of conditional frictional stability. A single fault patch can exhibit different slip modes (e.g., steady creep, episodic slow slip, or seismic slip) depending on in situ condi-tions and state.
• A continuum of duration and magnitude characteristics of SSEs and slow seismic behavior occurs along the shallowest reaches of the subduction megathrust.
• SSEs drive fluid flow and chemical transport along faults and throughout the upper plate.
Expeditions 372 and 375 undertook a coordinated program of logging while drilling (LWD), coring, and observatory installation framed around three primary scientific objectives designed to test these hypotheses. These scientific objectives are outlined here and addressed in further detail below:
• Document the in situ conditions, material properties, and com-position of the subduction inputs and the shallow plate bound-ary near the trench. These rocks comprise the protolith and re-veal the initial conditions for fault rocks that are transported into the SSE source zone at greater depth. In the case of the shal-low fault zone, these materials may host SSEs if the events prop-agate to the trench.
• Characterize the stress regime, temperatures, rock physical properties, lithologies, fluid pressures, fluid geochemistry, flow pathways, and structure of the upper plate above the SSE source.
• Monitor changes in hydrogeology, temperature, and deforma-tion related to SSEs via two multi-instrument borehole observa-tories.
1. Objective 1: characterize the compositional, thermal, hydrogeo-logical, frictional, geochemical, structural, and diagenetic condi-tions of the subducting material and frontal thrust that may host SSEs.Achieving this objective requires characterization of the incom-
ing stratigraphy and upper oceanic basement rocks, together with a shallow active strand of the frontal thrust system. This characteriza-tion involves a combination of coring, downhole measurements, and logging at originally proposed Sites HSM-05A (now Site U1520; sedimentary succession on subducting plate), HSM-08A (now Site U1526; seamount on subducting plate), and HSM-15A (now Site U1518; thrust fault near the deformation front) (Figure F3), fol-lowed by a strategy of coordinated postexpedition laboratory analy-ses. Site U1518 provides material from an active thrust in the updip region of the plate interface early in its evolution, at low tempera-
7

D.M. Saffer et al. Expedition 375 Preliminary Report
ture and low effective stress. If SSEs propagate onto splay faults near the deformation front, the fault zone sampled at Site U1518 may un-dergo slow slip; this possibility will be tested using data from the ob-servatories installed during the expedition. Site U1520 targeted the sediment package on top of the Hikurangi Plateau. Site U1526 tar-geted a representative section of the upper portion of the Tūran-ganui Knoll Seamount, which was thought to be composed of volcaniclastic sediment or altered basaltic basement.
LWD data acquired during Expedition 372 at Sites U1518 and U1520 documented sediment properties and structure and charac-terized stress orientations through analysis of wellbore failures at Site U1518 (Pecher et al., 2018). Coring during Expedition 375 aimed to collect key samples and data sets for sediment/rock physi-cal properties, pore fluid composition, and downhole temperature, with a focus on hydrogeology and fault mechanical processes. These data define the initial conditions and composition for both the subducting crust and interstitial pore fluids, and samples of the incoming materials will be used for laboratory experimental studies of rock physical and chemical properties to understand the in situ properties and their evolution with progressive subduction. These data and postexpedition studies will also yield critical information to refine depth conversion of existing 2-D and 3-D seismic data and thus to quantitatively extend knowledge of in situ properties and conditions (stress, fault zone properties, and pore pressure) from the boreholes to a broader region (e.g., Tobin and Saffer, 2009). Ulti-mately, samples and data acquired at Sites U1518, U1520, and U1526 will constrain (1) the composition and frictional properties of subduction inputs and the shallow plate interface, (2) the hydro-logic and thermal conditions of the incoming plate and shallow fault, and (3) the structural character, stress conditions, and me-chanical properties of the main active thrust and subduction inputs.
Downhole temperature measurements were planned to define temperature profiles and, in combination with measurements of thermal properties on core samples, provide information about shallow heat flow across the margin. These data will be used to con-strain thermal models of the margin that define margin temperature structure and thus the thermal, diagenetic, and metamorphic envi-ronment of SSEs and to identify potential advective signatures asso-ciated with active fluid flow (e.g., Saffer et al., 2008; Peacock, 2009; Saffer and Wallace, 2015).
2. Objective 2: characterize the properties and conditions in the up-per plate overlying the SSE source region.LWD resistivity-at-the-bit (RAB) imaging data acquired during
Expedition 372 at Site U1519 (see Pecher et al., 2018) provide key information about fracture and faulting patterns. The data also doc-ument borehole breakouts, providing information about the maxi-mum and minimum horizontal stress orientations. In combination with rock physical properties data acquired from cores during Ex-pedition 375, these data can be used to estimate horizontal stress magnitudes (e.g., Moos and Zoback, 1990; Zoback et al., 2007; Chang et al., 2010; Lin et al., 2013; Huffman and Saffer, 2016).
Core samples from Site U1519 will also enable measurements of rock elastic and physical properties needed to confidently interpret observatory data (e.g., Wang and Davis, 1996; Sawyer et al., 2008; Hammerschmidt et al., 2013), to assess the role of upper plate prop-erties in possible triggering of SSEs (e.g., Wallace et al., 2017), and to define realistic rock properties distributions to inform models of SSE slip (e.g., Williams and Wallace, 2015). Analysis of pore fluid chemistry allows identification of the source region of fluids in the hanging wall above and surrounding the SSE region to assess
whether fluids from depth flow upward and escape through the fractured and structurally disrupted hanging wall and to quantify flow pathways, rates, and driving forces (e.g., Kopf et al., 2003; Hensen et al., 2004; Ranero et al., 2008).
3. Objective 3: monitor deformation, hydrogeology, and chemistry via borehole observatories.Installation of borehole observatories was planned in an active
thrust (Site U1518) and in the hanging wall above the source area of large SSE slip (Site U1519) (Figures F2, F3). The observatory at Site U1518 includes multilevel pore fluid pressure sensing above, in, and below the fault zone, as well as distributed temperature sensing us-ing a string of 30 temperature sensing data loggers (Figures F4, F5). Time series of fluid flow rates and fluid geochemistry in the fault zone interval will be collected using OsmoSamplers and an Osmo-Flowmeter (Jannasch et al., 2004; Solomon et al., 2009). The obser-vatory at Site U1519 involves a simpler design (Figure F4) with two levels of formation pressure sensing and a distributed string of 15 temperature loggers. Both observatories incorporate pressure sens-ing at the wellhead to provide a seafloor reference for the downhole pressure sensors to allow removal of oceanographic signals; the wellhead sensors also provide data to resolve vertical deformation of the seafloor (e.g., Wallace et al., 2016).
The main goals of the observatories are as follows:
1. Monitor temporal variations in pore fluid pressure, tempera-ture, fluid geochemistry, and flow rate in the shallow fault zone, hanging wall, and footwall of an active thrust fault near the de-formation front (Site U1518), as well as pressure and tempera-ture in the hanging wall further landward (Site U1519), through several SSE cycles. These data will quantify ambient pore pres-sure, provide information about potential links between hydrau-lic and geochemical transients and SSEs, and constrain the source region of fluids associated with SSEs (e.g., Solomon et al., 2009; Davis et al., 2011).
2. Determine ambient temperatures to better constrain the ther-mal regime of slow slip.
3. Determine formation hydraulic and elastic properties using tidal and other oceanographic loading (e.g., Kinoshita et al., 2018).
4. Integrate pore pressure changes (as a direct proxy for volumetric strain) in a broader framework of deformation monitoring from an existing onshore cGPS network and seafloor sensors to con-strain the spatial and temporal distribution of slip during SSEs (e.g., Araki et al., 2017).
Site summariesSite U1518
Background and objectivesSite U1518 is located on the lower continental slope near the
trench and ~73 km from shore in ~2630 m water depth (Figures F2, F3; Table T1). This site is located on the forelimb of an anticline formed by an active thrust branching from the plate interface (Fig-ure F2). The thrust is thought to accommodate a component of plate motion in this portion of the Hikurangi margin, and it is possi-ble that it hosts SSEs. Expedition 372 collected LWD data in Holes U1518A and U1518B in December 2017 (Pecher et al., 2018). Cor-ing at Site U1518 during Expedition 375 was planned to extend through the active thrust near the deformation front, terminating 150–200 m into the footwall of the fault (Figure F2). Drilling was expected to encounter accreted Pleistocene trench-fill sediments
8
D.M. Saffer et al. Expedition 375 Preliminary Report
comprising sand and mud turbidites, ash, and mass transport de-posits (MTDs) in both the hanging wall and footwall. The primary objectives at this site were (1) coring to total depth with the highest priority of sampling the lower ~100 m of the hanging wall, the fault zone, and the footwall of the thrust (including additional possible deeper subsidiary faults suggested on the basis of seismic and LWD data) and (2) installing a subseafloor observatory to monitor changes throughout the slow slip cycle in and surrounding the fault zone.
The main scientific objectives of coring at Site U1518 were to define the structures and deformation, physical properties, litho-logy and composition, and interstitial fluid geochemistry of the ac-tive thrust fault and surrounding sediments. Coring results were used in combination with LWD data to define the depth interval for observatory pore pressure monitoring and geochemical sampling in the fault zone and to select optimal locations for pore pressure monitoring in the hanging wall and footwall. The observatory will monitor formation pore pressure changes (as a proxy for volumetric strain) (e.g., Wang, 2004; Davis et al., 2004, 2009; Araki et al., 2017) and the evolution of physical, hydrological, thermal, and chemical properties and conditions throughout the slow slip cycle using a string of temperature sensors and an OsmoSampler and Osmo-Flowmeter installed in the fault zone (e.g., Jannasch et al., 2003; Sol-omon et al., 2009).
Key foci for postexpedition studies on core samples include but are not limited to the following:
• Structural analyses to characterize deformation mechanisms and style, as well as fracture and fault orientations (e.g., Byrne et al., 2009);
• Laboratory measurements of fault and wall rock rheology and friction to test hypotheses linking fault constitutive properties to slip behavior (e.g., Saffer and Wallace, 2015; Leeman et al., 2016);
• Geomechanical and thermal properties measurements to define poroelastic, strength, and heat transport properties of the for-mation to guide interpretation of observatory data (e.g., Wang, 2004; Sawyer et al., 2008; Davis et al., 2009; Kinoshita et al., 2018); and
• Strength, permeability, and elastic moduli measurements to provide context for the interpretation of borehole failures as in-dicators of in situ stress magnitude, parameterization of defor-mation and hydrologic models, and core-log-seismic integra-tion.
OperationsTransit to Site U1518
The R/V JOIDES Resolution departed from Timaru (New Zea-land) at 0728 h (UTC + 13 h) on 11 March 2018 and arrived at Site U1518 (proposed Site HSM-15A) at 1900 h on 13 March.
Holes U1518C and U1518DHole U1518C (38°51.5692′S, 178°53.7616′E; 2631.7 meters be-
low sea level [mbsl]) was spudded at 0905 h on 14 March 2018 with an advanced piston corer/extended core barrel (APC/XCB) bottom-hole assembly (BHA). A full core barrel was retrieved following a partial stroke, and the hole was abandoned to attempt another mud-line core. The bit was raised 3 m, and Hole U1518D (38°51.5699′S, 178°53.7634′E; 2628.2 mbsl; 2638.9 meters below rig floor [mbrf ]) was spudded at 1020 h. Another full core barrel was retrieved, and this hole was also abandoned.
Hole U1518EThe vessel was offset 5 m north, the bit was raised another 3 m,
and Hole U1518E was spudded at 1125 h on 14 March 2018 (38°51.5669′S, 178°53.7618′E; 2626.1 mbsl). Cores 1H–32X pene-trated from 0 to 175.6 meters below seafloor (mbsf ) and recovered 160.96 m (92% recovery). Advanced piston corer temperature tool (APCT-3) formation temperature measurements were taken with Cores 4H, 6H, 8H, 10H, and 14F. The decision was made to switch to coring with the rotary core barrel (RCB) after discovering that the cutting shoe used with Core 31X had been destroyed after it took 80 min to advance 3.6 m while cutting Core 32X.
Hole U1518FThe vessel was offset 5 m south. Hole U1518F (38°51.5694′S,
178°53.7619′E; 2626.1 mbsl) was spudded at 0135 h on 17 March 2018 with an RCB BHA and was advanced without coring to 197.7 mbsf. Cores 2R–32R penetrated from 197.7 to 494.9 mbsf and re-covered 126.82 m (43% recovery). Coring was terminated so that observatory operations could start.
Hole U1518GIn preparation for installing the observatory, we predrilled Hole
U1518G. The vessel was offset 35 m north of Hole U1518F (and ~5 m south of Hole U1518B). A BHA with a 14¾ inch drill bit was low-ered to the seafloor, Hole U1518G (38°51.5505′S, 178°53.7617′E; 2629.8 mbsl) was spudded at 1050 h on 20 March 2018, and the hole was advanced without coring to 433 mbsf. Next, a reentry cone and mud skirt were released from the moonpool and allowed to free-fall down the drill string to the seafloor.
The first stage of the observatory installation consisted of de-ploying an ACORK. Between 2000 h on 22 March and 1700 h on 23 March, we assembled a 422 m long ACORK casing string consisting of 10¾ inch casing, three joints with pressure screens, and an um-bilical with three ¼ inch diameter tubes secured on the outside of the casing. The umbilical tubes were terminated at the three screens centered at 393, 323, and 218 mbsf to monitor pressure below, in, and above the fault zone, respectively. Next, we assembled a drilling assembly inside the ACORK casing composed of a 9⅞ inch drill bit, an underreamer with its arms set to 14¾ inches, and a mud motor to rotate the bit and underreamer in isolation from the casing. Fi-nally, the umbilical tubes were connected to the valves and loggers on the ACORK wellhead, and the entire ACORK assembly was low-ered to the seafloor on 24 March. During our attempt to reenter Hole U1518G, unexpected heave caused the drill bit to hit the reen-try cone at 1215 h, which resulted in the cone and its base being offset ~3–5 m from the hole, making reentry into the predrilled hole impossible.
Hole U1518H observatoryBecause the underreamer and drill bit were inside the ACORK
casing and the entire assembly was already at the seafloor, the deci-sion was made to drill in the ACORK assembly at the new location. Hole U1518H (38°51.5402′S, 178°53.7642′E; 2631.1 mbsl) was spud-ded at 1245 h on 24 March 2018 and reached a total depth of 426 mbsf. Once the ACORK landed in the reentry cone, we deployed a remotely operated vehicle (ROV) platform and a free-fall funnel on top of the ACORK body. The ACORK casing was reentered and cleaned of cuttings on 26 March before a bridge plug was installed on 27 March at 421 mbsf inside the ACORK casing to seal its inte-rior from the formation.
9
D.M. Saffer et al. Expedition 375 Preliminary Report
The second stage of the observatory installation consisted of de-ploying a CORK-II inside the ACORK, but operations were inter-rupted on 28 March while we waited for the R/V Tangaroa to deliver replacement seals. During this period we relocated to Site U1520 to drill in a reentry system in advance of coring there later during the expedition. We resumed operations in Hole U1518H on 31 March by assembling the 412 m long CORK-II casing string composed of 4½ inch drill pipe, two swellable packer joints, one “quadrant seal” joint carrying the seat for the OsmoSampler pack-age, drill collars, and a bullnose. The CORK-II wellhead was at-tached on 1 April, and the entire assembly was lowered to the seafloor until it reentered the ACORK funnel and the CORK-II wellhead reached ~17 m above the ACORK funnel.
The third stage of the observatory installation consisted of de-ploying the temperature sensors and OsmoSampler package inside the CORK-II casing string. On 1 April, we assembled the 407 m long instrument string consisting of 3 segments of Spectra rope carrying a total of 23 temperature sensing data loggers, the ~22 m long Os-moSampler package with an additional 7 temperature sensing data loggers inside, 3 weak links, 4 sinker bars, and a top plug. The in-strument string was deployed with the logging wireline. At 2105 h on 1 April, the OsmoSampler package landed in the CORK-II seat at 323 mbsf, followed by the top plug latching inside the CORK-II wellhead. Once the instrument string was released, the CORK-II landed inside the ACORK wellhead at 0020 h on 2 April, completing the observatory installation in Hole U1518H. The time spent at Site U1518 was 13.22 days.
Principal resultsLithostratigraphy
At Site U1518, we identified three lithostratigraphic units, two of which (Units I and III) were divided into two subunits (Figure F6). All three units are Quaternary in age. Sediment composition and texture are consistent throughout Holes U1518E and U1518F, with a background of silty clay(stone) or mud(stone) alternating with thin beds of silt(stone) to silty sand(stone). The distinctions among lithostratigraphic units are based largely on the character of coarser beds inferred to be turbidites and soft-sediment deforma-tion features that are inferred to be MTDs.
The uppermost 2.2 m of Core 375-U1518E-1H consists of un-consolidated Holocene mud. Subunit IA begins below this mud and extends to 197.7 mbsf. Sediment from Section 1H-CC has an age >0.54 Ma, and porosity is lower than expected for the current depth of burial (Figure F7). We therefore consider some of the original stratigraphic section to be missing due to submarine slides or other forms of mass wasting after frontal accretion. The normally graded beds range in grain size from sandy silt to silty sand and very fine sand. We surmise that relatively dilute turbidity currents were inter-spersed with background settling of suspended sediment on the trench floor of the Hikurangi Trough. Felsic ash layers also occur in the uppermost 44 m, and they were probably deposited by air fall. Subunit IB extends from 197.7 to 304.5 mbsf, is characterized by sparse and thinner (<10 cm) beds of normally graded siltstone, and its upper boundary is gradational. The position of the subunit boundary coincides with the bottom of the zone that was not cored.
Unit II extends from 304.5 to 370.4 mbsf, and its upper bound-ary matches a significant change in biostratigraphy defined by a thrust-related age inversion with older hanging wall (>0.54 Ma) over younger footwall (<0.54 Ma) sediments. We designated this mate-rial as a separate lithostratigraphic unit on the basis of a sharp re-
duction in the number of silty turbidites and a subtle change in color to lighter greenish gray mudstone. The mudstone in Unit II alternates with thin but sparse layers of siltstone, sandy siltstone, and mud-rich nannofossil ooze.
Unit III begins at 370.4 mbsf and extends to the base of Hole U1518F (492.4 mbsf). This unit is composed of mudstone with thin beds of normally graded siltstone and sandy siltstone and was de-posited by turbidity currents and hemipelagic settling in a trench-floor environment. The most distinctive characteristic of Unit III is soft-sediment deformation, similar in many respects to what has been described in MTDs from comparable depositional environ-ments elsewhere (e.g., the Nankai Trough). Subunits IIIA and IIIB are based on a change in the frequency of the MTD-type features at 475.7 mbsf. The amount of soft-sediment deformation decreases significantly in Subunit IIIB; intricate varieties of bioturbation be-come more widespread and diverse below the subunit boundary.
Broad facies-level comparisons (i.e., packets of beds at a 10+ m scale) can be made between the lithostratigraphy defined from core descriptions and the provisional log-based stratigraphy defined in Holes U1518A and U1518B (Pecher et al., 2018). Six logging units were defined for Site U1518 during Expedition 372. The logging unit designations were based on attributes that change in response to deformation structures and physical properties, in addition to lithology and bed thickness. Closely spaced oscillations in resistiv-ity, nuclear magnetic resonance (NMR), porosity, and gamma ray measurements from logging Units 2 and 3 are consistent with thinly bedded and uniformly fine grained sediments in lithostratigraphic Unit I. Lithostratigraphic Unit II (304.53–370.4 mbsf) likely rep-resents comparable lithologies to those in the lower parts of logging Subunit 3C (229–320.7 mbsf ) and logging Unit 4 (320.7–346 mbsf). The top boundary of lithostratigraphic Unit II is based largely on the inversion of biostratigraphy rather than a change in lithology, which cannot be detected by logging. In contrast, the lithostrati-graphic Unit III top and bottom boundaries do not match very closely to the boundaries for logging Units 5 and 6 or their subunits, likely because different sets of criteria were used to define subunits. Recognition of lithostratigraphic Unit III is based largely on an in-crease in syndepositional deformation in the form of contorted do-mains, which are interpreted to be MTD-type deposits. In contrast, the designations for logging units rely mainly on changes in physical properties, along with caliper records suggestive of washouts.
BiostratigraphyPlanktonic foraminifer and calcareous nannofossil biostrati-
graphy indicates that the sedimentary sequence recovered at Site U1518 is Holocene to early Pleistocene. Because of high sedimenta-tion rates (~3 m/ky), shipboard paleontological sampling achieved a temporal resolution of 1.5–3 ky from half-length APC (HLAPC) and full-length APC cores.
The base of the Holocene was identified between 2.02 and 2.33 mbsf. The underlying section to 297.0 mbsf is dated to the middle Pleistocene, whereas the sediments from 306.95 to 492.38 mbsf are dated to the middle Pleistocene or younger, and represent an age re-versal at the thrust fault, as described below (see Structural geol-ogy) (Figure F6).
Midbathyal benthic foraminifer markers occur throughout the sedimentary sequence, and very rare lower bathyal markers occur in a few samples below 306.95 mbsf. The absence of lower bathyal markers in most samples is unexpected, given that the site was drilled at a water depth of 2626 m, suggesting that the bulk of the
10
D.M. Saffer et al. Expedition 375 Preliminary Report
sedimentary sequence has been reworked downslope from mid-bathyal water depths or shallower. Downslope reworking is sup-ported by the presence of common inner to midshelf taxa in some samples.
PaleomagnetismRoutine paleomagnetic analysis included natural remanent
magnetization (NRM) measurement of archive-half sections prior to and following stepwise alternating field (AF) demagnetization to a peak field of 30 mT. Interpretation of the paleomagnetic results was compromised by the diagenesis of the primary magnetic min-eral phases and extensive tectonic deformation. Some cores also ex-perienced core disturbance that resulted in the complete destruction of any depositional remanence. All XCB cores were af-fected by significant drilling-induced overprints that could not be removed during routine demagnetization of the archive-half sec-tions. More extensive AF and thermal demagnetization experi-ments were conducted on discrete specimens to aid our interpretation.
Inclination records show that the entire sequence recovered at Site U1518 is most likely of normal polarity, despite an interval be-tween 220 and 270 mbsf in which the polarity remains unresolved. Based on biostratigraphic observations, we place the paleomagnetic record in the Brunhes Normal Chron (C1n).
Rock magnetic analyses included determination of the magnetic coercivity distribution based on AF demagnetization, isothermal re-manent magnetization acquisition, and magnetic susceptibility measurement. Inferences about the blocking temperature (Tb) dis-tribution of individual samples were drawn from the thermal de-magnetization behavior. We tentatively identified at least two magnetic mineral phases. The first is a low coercivity (≤50 mT) min-eral that we suggest is Ti-magnetite. During AF demagnetization experiments, the majority of our samples were affected by the growth of a gyroremanent magnetization at treatment steps higher than 50 mT that we attribute to the presence of secondary greigite.
Structural geologyCores from Hole U1518E are characterized by sediments with
gently to moderately dipping beds, although significant drilling-in-duced deformation in the APC and XCB cores prevents detailed structural observations. RCB cores from Hole U1518F preserve a suite of deformation structures that span a main thrust fault span-ning from 304.5 to 322.4 mbsf and a subsidiary fault that extends from 351.2 to 361.7 mbsf.
Gently to steeply dipping beds, locally overturned, were ob-served in the hanging wall. Bedding dip trends in the hanging wall (Figure F7) generally agree well with LWD-derived bedding dips. These beds are crosscut by moderately to steeply dipping fractures that increase in frequency with depth toward the fault zone. Normal faults with centimeter-scale displacements are also preserved at scattered locations throughout the sequence.
The main fault zone includes an upper, primarily brittle fault zone extending to 315.3 mbsf and a lower zone of dominantly duc-tile deformation below that extends to 322.4 mbsf. This interval is characterized by intense brecciation, discrete fractures, and the oc-currence of ductile deformation zones. Several of the apparently ductilely deformed zones are overprinted by brittle structures. De-formation intensity decreases gradually toward the base of the fault zone (Figure F7). The ductile deformation is likely a composite of tectonic, synsedimentary, and slope processes.
The footwall of the main fault zone is characterized by relatively undeformed hemipelagic sediments with modest and relatively con-stant dip angles and is cut by a few normal faults and fractures. This package hosts another zone of more intense deformation and brec-ciation, indicating a second (subsidiary) fault spanning from 351.2 to 361.7 mbsf. There is no clear change in lithology across the sec-ond fault. Below this zone, bedding dips are generally gentle and also in good agreement with LWD-derived bedding dips, and defor-mation structures are few.
Fractures and borehole breakouts can be observed at various depths in the Site U1518 LWD image logs acquired during Expedi-tion 372 (Pecher et al., 2018). Significant fracture clusters were ob-served between 170 and 230 mbsf, between 315 and 321 mbsf (at a comparable depth, although slightly deeper than those observed in the main fault zone in Hole U1518F; Figure F7), and between 436 and 444 mbsf. These clusters include a mix of conductive and resis-tive fractures, and overall they exhibit a preferred northwest–south-east strike. Borehole breakouts were observed at 536 and 550 mbsf and are oriented approximately north–south, indicating an east–west maximum horizontal principal stress (SHmax) direction.
GeochemistryWe collected 82 whole-round (WR) samples for pore water
chemical analyses at Site U1518. Samples were collected on the cat-walk at a frequency of six WR samples per core from the seafloor to 17.9 mbsf, three WR samples per core from 17.9 to 27 mbsf, and one to two WR samples per core from 27 to 494.9 mbsf. Each core col-lected deeper than 30 mbsf was scanned with an infrared (IR) cam-era to identify cold anomalies indicative of potential methane hydrate. The majority of WR samples for interstitial water analyses were located away from the IR anomalies to define background chemical profiles not impacted by methane hydrate dissociation during core recovery. A small subset of samples co-located with the IR cold anomalies were analyzed to quantify methane hydrate satu-rations based on the deviation of dissolved chloride concentrations from the background profile. Drilling fluid was also analyzed as part of the shipboard geochemical program to identify potential con-tamination; below the sulfate–methane transition zone (SMTZ), sulfate is depleted in the pore water and any sulfate present in a sample is interpreted to be the result of contamination. Based on SO4 concentrations below the SMTZ, we corrected all pore water species in each sample for drilling contamination.
The pore fluid chemical profiles at Site U1518 reflect the com-bined effects of microbially mediated organic matter degradation, authigenic carbonate precipitation, volcanic ash alteration, and sili-cate mineral diagenesis. Sulfate concentrations decrease approxi-mately linearly from 28.1 mM at 1.5 mbsf to below detection limit (0.1 mM) at ~8 mbsf. The SMTZ is marked by a concomitant in-crease in headspace methane concentrations from 51 to 5461 parts per million by volume (ppmv). The SMTZ is shallower at this site than at nearby IODP Site U1517 (drilled during Expedition 372 [Pecher et al., 2018]), which likely indicates a larger vertical meth-ane flux. Ethane was detected in some headspace samples shallower than 200 mbsf, but was not detected deeper. The methane is micro-bial in origin, with C1/C2 ratios >20,000.
Alkalinity, ammonium, bromide, and phosphate concentration profiles also reflect organic matter diagenesis with peaks in litho-stratigraphic Subunit IA, followed by a decrease in Subunit IB. The fault zone coincides with a repetition of the diagenetic sequence in the footwall with a second peak in alkalinity, ammonium, and phos-
11

D.M. Saffer et al. Expedition 375 Preliminary Report
phate concentrations in lithostratigraphic Unit III. Based on the de-viation of Cl concentrations from the background concentration profile, we identified the presence of methane hydrates in six WR samples.
Chloride, potassium, and sodium concentrations increase with depth and reach concentration maxima at ~60 mbsf in Subunit IA. Likewise, silica, lithium, and strontium concentrations steadily in-crease in Subunit IA and then decrease between the top of Subunit IB and the top of the fault zone at ~300 mbsf. Subunit IA sediments contain several volcanic ash layers and disseminated ash and have elevated K-feldspar concentrations. The increase in pore water Cl, alkali metal, and strontium concentrations in this unit likely reflects ongoing alteration of rhyolitic ash and K-feldspar to authigenic hy-drous aluminosilicate minerals. Similar to the geochemical tracers of organic matter diagenesis discussed above, a clear repetition of the ash/silicate mineral diagenetic sequence occurs at the fault zone.
Solid phase analyses yielded CaCO3 values ranging from 2.1 to 23.1 wt%. Total organic carbon (TOC) concentrations are generally low and range from 0.1 to 0.88 wt%. C/N ratios range from 0.85 to 15.80 (average = 6.84). Localized peaks in the C/N ratio occur in Unit II, suggesting some heterogeneity in organic matter sources in this depth interval.
Physical propertiesAn abrupt change in physical properties occurs between 0 and
50 mbsf in Hole U1518E, including a shift to lower porosity values, concomitant higher bulk densities, and higher P-wave velocities. Deeper than 50 mbsf, all physical properties remain nearly constant with depth, with a few distinct exceptions (Figure F7). The depth trends of bulk density, porosity, P-wave velocity, undrained shear strength, and natural gamma ray measured in the cores are gener-ally less pronounced than the trends in LWD bulk density, neutron porosity, P-wave velocity, and gamma ray data.
Porosity decreases from 65% to 50% in the top 50 m. Between 50 and 495 mbsf, porosity is nearly constant and ranges from 40% to 50% (Figure F7). P-wave velocity is ~1500 m/s near the seafloor and increases rapidly to 1600 m/s at 2 mbsf. Between 2 and 12 mbsf, P-wave velocity is approximately constant at 1600 m/s followed by a gradual increase to 1950 m/s at 150 mbsf. Deeper than 238 mbsf, P-wave velocity values are scattered and range from ~1500 to ~2000 m/s. Undrained shear strength increases with depth (albeit with sig-nificant scatter) to an average of 120–200 kPa at 200–280 mbsf and decreases to an average of 60–100 kPa by 300 mbsf. Deeper than 450 mbsf, the strength values increase again (with significant scat-ter) to values as high as 400–500 kPa.
Natural gamma radiation (NGR) values range from 6 to 63 counts/s, with an average of 42 counts/s. NGR values increase rap-idly from <25 counts/s at the seafloor to 40 counts/s at 2 mbsf and remain nearly constant with depth. Magnetic susceptibility values are correlated with the lithostratigraphic units. The interval be-tween 2 and 176 mbsf (in lithostratigraphic Subunit IA) is charac-terized by zones of low magnetic susceptibility values and little scatter with average values of 11 × 10−5 to 14 × 10−5 SI (at 2–12, 40–60, and 75–109 mbsf ) and intervening zones of high magnetic sus-ceptibility values and high scatter with average values of 22 × 10−5 to 25 × 10−5 SI (at 13–40, 60–75, and 109–176 mbsf ). Between 197.7 and 462 mbsf, from the top of Subunit IB to the bottom of Subunit IIIA, magnetic susceptibility values exhibit some scatter, ranging from 10 × 10−5 to 20 × 10−5 SI, but less than the scatter observed in Subunit IA. Susceptibility shifts to a lower average value of 13 × 10−5
SI at 466 mbsf and remains constant to 495 mbsf (in Subunit IIIB). Thermal conductivity is relatively constant with depth, with an av-erage value of 1.38 ± 0.10 W/(m·K).
Downhole measurementsFive formation temperature measurements were made with the
APCT-3 shoe in Hole U1518E with Cores 4H, 6H, 8H, 10H, and 14F. Although all five measurements are high quality, an offset occurs between the three measurements taken with one sensor and the two taken with another sensor. We estimate a thermal gradient of 0.035°C/m using three equilibrium temperatures from one of these tools. The vertical conductive heat flow computed as the product of the thermal gradient and thermal conductivity is 48 mW/m2. The temperature over the depth window corresponding to the main fault zone is estimated to be 12°–13°C.
Core-log-seismic integrationLWD data acquired during Expedition 372 in Holes U1518A and
U1518B were correlated with core-based observations and physical properties measurements from Holes U1518E and U1518F and with seismic reflection data across the holes drilled at Site U1518. These different data sets detect variations in physical properties, lithology, and structure at a range of scales. LWD P-wave velocity and density measurements were combined with density measurements from the cores to develop a synthetic seismic trace to correlate the LWD, core, and seismic data. The synthetic seismic trace using the LWD data correctly predicts moderate-amplitude reflections in the upper 80 mbsf, low-amplitude reflections to ~300 mbsf, and a package of high-amplitude reflections between 300 and 400 mbsf (Figure F7).
However, a significant reduction in LWD density and velocity around 322 mbsf (see Pecher et al., 2018) produced a high-ampli-tude reversed polarity reflection in our synthetics that is ~15–20 m too deep relative to the observed high-amplitude reversed polarity reflection in seismic Profile 05CM-04 at the Hole U1518F location. This high-amplitude reflection separates truncated dipping reflec-tions above from continuous parallel reflections below. Physical properties values from cores show a reduction in density around 300–315 mbsf, shallower than that observed in the LWD data (Fig-ure F7). Together, the core and seismic data suggest that the fault zone in the Hole U1518F cored section lies 15–26 m shallower than the same change in properties identified in the Hole U1518B LWD data. This suggestion is supported by a better matching synthetic seismic trace when the LWD reduction in density and velocity is shifted 15 m shallower (Figure F7). The difference in fault zone depth between Holes U1518F and U1518B (located ~40 m apart) is likely due to thrust fault geometry.
Site U1519Background and objectives
Site U1519 is located on the upper continental slope ~38 km from shore in ~1000 m water depth at the landward edge of a mid-slope sedimentary basin (Figures F2, F3; Table T1). On the basis of regional stratigraphic and seismic interpretations prior to drilling, we expected to intersect 260–270 m of horizontally layered late Quaternary basin fill comprising MTDs and layered sequences, in-cluding probable turbidites, underlain by a Plio–Pleistocene slope sequence of MTDs and layered sequences also about 260–270 m thick dipping to the southeast. The base of this sequence is marked by an apparent erosional unconformity identified in the seismic re-flection data at ~540 mbsf. Beneath the unconformity, we expected to penetrate Miocene sedimentary rocks (equivalent to the Tolaga
12

D.M. Saffer et al. Expedition 375 Preliminary Report
Group exposed onshore) in seismically reflective landward-dipping strata (Figure F2). LWD in Hole U1519A during Expedition 372 penetrated to 650 mbsf and documented a change in physical prop-erties at the interpreted depth of the unconformity (Pecher et al., 2018). A bottom-simulating reflector (BSR) was identified at ~570 mbsf.
The primary objective at Site U1519 was the installation of an observatory to monitor formation pressure changes as a proxy for volumetric strain and temperature changes throughout multiple SSE cycles. The observatory includes two levels of pressure sensing via hydraulic lines that terminate in screens at 124 and 264 mbsf. Temperature sensing is achieved by a string of 15 distributed tem-perature sensing data loggers. Drilling at Site U1519 during Expedi-tion 375 also included RCB coring in discrete intervals (108–163.6, 250–288.4, and 520–640 mbsf; Hole U1519C) and APC coring from the seafloor to 85.8 mbsf (Holes U1519D and U1519E). The main coring objective at this site was to provide information about rock physical properties, composition, and structural geology and defor-mation in the upper plate above the SSE source region. APCT-3 measurements of temperature in Holes U1519D and U1519E define a temperature gradient and provide key constraints on the thermal regime of the slow slip source region. Pore fluid geochemistry data provide insights into diagenetic processes and potential sources and flow pathways of fluid sampled in the hanging wall.
One key focus for postexpedition studies on core samples will be geomechanical measurements to define poroelastic and strength properties of the formation. These data will be essential for inter-pretation of observatory data, such as calibrating the use of pore pressure as a proxy for volumetric strain (e.g., Wang, 2004; Araki et al., 2017). Similarly, strength, permeability, and elastic moduli mea-surements will provide important context for the interpretation of borehole failures as indicators of in situ stress magnitude (e.g., Chang et al., 2010; Huffman and Saffer, 2016), parameterization of hydrological models, and core-log-seismic integration. Thermal properties measurements will be used in combination with observa-tory temperature data to define heat flow and to interpret thermal transients in the context of heat conduction and possible advection.
OperationsTransit to Site U1519
We arrived at Site U1519 (proposed Site HSM-01A) at 1810 h (UTC + 12 h) on 13 April 2018 after waiting on weather in the Bay of Plenty.
Hole U1519B observatoryIn preparation for installing the observatory, we predrilled the
observatory hole. A BHA with a 14¾ inch drill bit was lowered to the seafloor. Hole U1519B (38°43.6426′S, 178°36.8655′E; 1000.4 mbsl) was spudded at 0105 h on 14 April 2018 and advanced with-out coring to 283 mbsf. Next, a reentry cone and mud skirt were released from the moonpool and allowed to free-fall down the drill string to the seafloor.
The first stage of the observatory installation consisted of de-ploying an ACORK. Between 0115 and 1245 h on April 15, we as-sembled a 279 m long ACORK casing string consisting of 22 joints of 10¾ inch casing, two casing joints with 2 m long screens for pres-sure monitoring, and an umbilical with three ¼ inch diameter tubes (only two of which were used) secured on the outside of the casing. The umbilical tubes were terminated at the two screens centered at 264 and 124 mbsf. Next, we assembled a drilling assembly inside the ACORK casing composed of a 9⅞ inch drill bit, an underreamer
with its arms set to 14¾ inches, and a mud motor to rotate the bit and underreamer in isolation from the casing. Finally, the umbilical tubes were connected to the valves and loggers on the ACORK well-head, and the entire ACORK assembly was lowered to the seafloor at 2130 h on 15 April. Hole U1519B was reentered at 2310 h, and the ACORK wellhead landed in the reentry cone on the seafloor at 0635 h on 16 April. Once the ACORK was released, we deployed a free-fall funnel on top of the ACORK body. The ACORK casing was re-entered with a 9⅞ inch drill bit and cleaned of cuttings on 16 April before a bridge plug was installed on 17 April inside the ACORK casing at 277 mbsf to seal its interior from the formation below.
The second stage of the observatory installation consisted of de-ploying a CORK-II inside the ACORK. The 269 m long CORK-II casing string consisted of 20 full joints and four pup joints of 4½ inch casing, four 6¾ inch drill collars, and a bullnose. The CORK-II wellhead was attached, the entire assembly was lowered to the sea-floor, and it reentered the ACORK funnel at 0120 h on April 18. We lowered the CORK-II wellhead until it reached a position ~20 m above the ACORK funnel.
The third stage of the observatory installation consisted of de-ploying a string of temperature sensors inside the CORK-II casing. At 0230 h on 18 April, we started assembling the 268 m long instru-ment string consisting of a top plug, a single segment of Spectra rope with 15 temperature sensing data loggers, one weak link, and one sinker bar. The instrument string was deployed using the log-ging wireline, and the top plug latched inside the CORK-II wellhead at 0530 h on 18 April. Once the instrument string was released, the CORK-II landed inside the ACORK wellhead and was released at 0735 h on 18 April, completing the observatory installation in Hole U1519B.
Hole U1519CThe primary coring objective at Site U1519 was to sample sedi-
ment in the intervals surrounding the ACORK pressure screens, which are centered at 124 and 264 mbsf, and in the sedimentary sec-tion from ~520 to 640 mbsf. The vessel was offset 20 m from Hole U1519B at a heading of 122°, and Hole U1519C (38°43.6483′S, 178°36.8773′E; 1000.3 mbsl) was spudded at 1640 h on 18 April 2018. Drilling without coring continued to 108 mbsf until 0600 h on 19 April. RCB Cores 2R–7R, 9R–12R, and 14R–26R advanced from 108.0 to 640.0 mbsf and recovered 119.17 m (55% recovery). Inter-vals 163.6–250.0 and 288.4–518.4 mbsf were drilled without coring. The drill string was recovered at 0815 h on 21 April, and the RCB BHA was put away.
Hole U1519DThe final objective at Site U1519 was to core the shallow sedi-
mentary section and collect in situ temperature measurements with the APCT-3. The vessel was offset 10 m at a heading of 122°, and Hole U1519D (38°43.6516′S, 178°36.8831′E; 1000.4 mbsl) was spud-ded at 1505 h on 21 April 2018. APC Cores 1H–3H advanced from 0 to 23.2 mbsf and recovered 23.64 m (101% recovery). Nonmag-netic core barrels were used for all APC cores. Because coarse un-consolidated material made it difficult to collect in situ temperature measurements and resulted in a partial stroke and significant over-pull with Core 3H, we started a new hole.
Hole U1519EThe vessel was offset 20 m at a heading of 122°, and Hole
U1519E (38°43.6572′S, 178°36.8949′E; 1000.3 mbsl) was spudded at 1845 h on 21 April 2018. APC Cores 1H–8H and HLAPC Cores 9F–
13

D.M. Saffer et al. Expedition 375 Preliminary Report
13F advanced from 0 to 85.8 mbsf and recovered 88.75 m (103% re-covery). Nonmagnetic core barrels were used for all cores. Forma-tion temperature measurements were taken with the APCT-3 for Cores 4H–8H, 9F, 11F, and 13F. The time spent at Site U1519 was 8.79 days.
Principal resultsLithostratigraphy
We identified two lithostratigraphic units at Site U1519 (Figure F8). Detailed characterization of lithofacies was hampered by large coring gaps, poor recovery, and pervasive coring disturbance. Over-all, the sedimentary strata range in age from Holocene to early Pleis-tocene. Common lithologies include mud(stone), silt(stone), and sand(stone).
Coring started at the seafloor in Holes U1519D and U1519E and at 108 mbsf in Hole U1519C, in lithostratigraphic Unit I, which ex-tends to 282.66 mbsf. Cores from this depth range contain a back-ground of dark greenish gray mud and mudstone (silty clay to clayey silt) with variable levels of consolidation. Seismic reflection records and high-resolution bathymetry are indicative of shallow mass transport remobilization at Site U1519. However, APC cores from Holes U1519D and U1519E reveal no definitive indicators of grav-ity-driven, soft-sediment deformation in the hemipelagic mud.
The Unit I/II boundary at 282.66 mbsf displays a noticeable change in color from dark greenish gray above to light greenish gray below, the grain size coarsens somewhat to silt-rich mudstone, and there is a positive excursion in magnetic susceptibility. Below a 230 m gap in coring, mudstone is present with scattered thin interbeds of dark gray sandy siltstone to very fine sandstone. In Cores 375-U1519C-19R, 21R, and 22R, the mudstone displays clear evidence of soft-sediment deformation, including convolute laminae, meso-scale folds, dismembered bedding, and clasts of mudstone sup-ported by a mudstone matrix. We interpret the deformed zones to be intraformational MTDs. The remainder of Unit II consists of consolidated greenish gray mudstone interbedded with poorly in-durated sandy silt and sand, ranging up to coarse sand. Core 23R contains a distinctive matrix-supported conglomerate with widely dispersed clasts of mudstone and intact shells of what appear to be shallow-water fauna.
BiostratigraphyCalcareous nannofossil and planktonic foraminifer species indi-
cate that the sedimentary sequence recovered at Site U1519 is Holo-cene to Pleistocene (Figure F8). The base of the Holocene was identified between 4.5 and 14.10 mbsf ). The underlying section to 536.41 mbsf, is dated late to middle Pleistocene (0.009–0.62 Ma), in-dicating a sedimentation rate of ~0.84 m/ky. Deeper than 536.41 to the base of Hole U1519C, the age is poorly constrained but is likely early Pleistocene or younger (<1.73 Ma).
Highly variable planktonic foraminifer abundances in the upper part of the section (0–536.41 mbsf) fluctuate between outer neritic and oceanic values. This variability is attributed to downslope re-working, evident from the co-occurrence of inner shelf benthic taxa and shell fragments with midbathyal markers. In the lower part of the section (546.86–635.65 mbsf ), benthic markers indicate depo-sition in mid–lower bathyal or deeper water depths.
PaleomagnetismPaleomagnetic analyses at Site U1519 were compromised by se-
vere core disturbance that destroyed the depositional remanence in the majority of cores. We thus only analyzed RCB cores from deeper
than 525 mbsf in Hole U1519C and APC cores from Holes U1519D and U1519E. Cores 375-U1519C-14R through 26R were subjected to stepwise AF demagnetization to peak fields of 30 or 40 mT. Over-printing of the primary NRM, most likely by diagenetic alteration, and deformation in MTD intervals made it difficult to interpret the magnetostratigraphy.
Hole U1519D and U1519E cores were subjected to AF demag-netization to a peak field of 20 mT, which was sufficient to remove a small viscous overprint. The NRM directions usually have negative inclinations that agree with the directions expected for a normal po-larity field. However, the data have not been corrected for core dis-turbance, and many APC sections were affected by significant drilling-induced bed drag. As a result, downhole variations in NRM directions do not necessarily reflect temporal variations in the mag-netic field during sediment deposition.
Structural geologyIntense drilling disturbance and lack of recovery limited recog-
nition of structural features in cores. However, dip data from LWD measurements conducted during Expedition 372 provide useful context for observations of core structures (Figure F9) (Pecher et al., 2018). Much of the strata at Site U1519 are inclined, although bed dips rarely exceed 50° in the cored intervals. Steeper beds are re-corded in folded strata, which likely represent MTDs. We defined two structural domains based on structures in the core and LWD data. In Domain 1 (0–567.58 mbsf ), bedding dips are dominantly steep, and scattered, steep, dominantly conductive fractures are present in the LWD RAB images. Filled fractures are abundant in the lower recovered interval of Domain 1. Domain 2 (567.58–635.6 mbsf) coincides with the bottom of lithostratigraphic Unit II and is defined by a decrease in the number of filled fractures, a slight shal-lowing of bedding dips in core, and a change in regional dip azimuth from north-northeast toward the north-northwest.
GeochemistryA total of 100 WR samples were collected and squeezed for
shipboard and shore-based pore water geochemical analyses. We collected 31 samples from Hole U1519C RCB cores, 15 samples from Hole U1519D APC cores, and 54 samples from Hole U1519E. WR samples were collected on the catwalk at a frequency of 6 per core in the upper ~20 mbsf and ~1–4 per core deeper than 20 mbsf.
The geochemical profiles at Site U1519 reflect the combined ef-fects of organic matter diagenesis, authigenic carbonate precipita-tion, and silicate mineral/volcanic ash alteration in response to rapid sedimentation. The pore water sulfate, alkalinity, ammonium, bromide, and phosphate profiles in lithostratigraphic Unit I show changes with depth characteristic of organic matter degradation. The shallow pore water sulfate profiles in Holes U1519D and U1519E are S-shaped, indicating a recent period of rapid sedimen-tation that is also supported by the alkalinity profile between the seafloor and the SMTZ. This recent sedimentation event has pro-duced a deeper SMTZ than would be observed under steady-state conditions.
A sharp increase in ammonium, alkalinity, phosphate, and bro-mide concentrations occurs across the Unit I/II boundary, indicat-ing that a second concentration maxima occurs in Unit II. The exact depth of this second concentration maxima is unknown because of the coring gap between 285 and 520 mbsf. The concentrations of these species, which are related to organic matter diagenesis, re-main elevated in the interval from 520 to 635 mbsf but decrease with depth.
14

D.M. Saffer et al. Expedition 375 Preliminary Report
Dissolved calcium concentrations decrease sharply from 9.5 mM at 1.4 mbsf to 3.8 mM at the SMTZ. Below the SMTZ, calcium concentrations increase to 6.3 mM at 70 mbsf. The reversal in the Ca profile below the SMTZ suggests enhanced silicate mineral/vol-canic ash alteration in the zone of microbial methanogenesis, lead-ing to a net addition of Ca to the pore water despite concurrent removal in authigenic carbonates. Likewise, strontium concentra-tions increase below the SMTZ to 130 μM (50% higher than sea-water value), boron concentrations increase to ~750 μM (79% higher than seawater value), and potassium concentrations steadily decrease, consistent with silicate and/or volcanic ash weathering in the upper 100 m of Unit I. A second interval of enhanced silicate mineral/volcanic ash diagenesis occurs between 520 and 630 mbsf in Unit II.
Chloride concentrations are lower than average modern sea-water value (559 mM) in the upper portion of Unit I, increasing from 549 mM at 1.4 mbsf (2% lower than average seawater value) to 559 mM at 17 mbsf. Between 17 and 120 mbsf, Cl concentrations remain relatively constant at or near a seawater value. Chloride con-centrations decrease from 550–534 mM across the Unit I/II bound-ary to 440–546 mM between 520 and 630 mbsf. Discrete anomalies in the Cl profile at 520–630 mbsf are the result of methane hydrate dissociation during core recovery, marking zones of elevated meth-ane hydrate concentrations. However, background Cl concentra-tions are also lower at 520–630 mbsf.
Between the seafloor and 144.3 mbsf, headspace methane con-centrations range between 0.55 and 5172.48 ppmv. Deeper than 144.3 mbsf, methane concentrations decrease and remain between 212.28 and 1802.82 ppmv, with an average of 1011.35 ppmv. Ethane was detected in headspace samples deeper than 520.53 mbsf and ranges between 0.25 and 1.92 ppmv. Methane-to-ethane ratios are consistently >500, indicating a dominantly microbial methane source. Organic C values in Units I and II range from 0 to 1.2 wt% (average = 0.39 wt%). Inorganic C and total nitrogen concentrations increase slightly with depth in both lithostratigraphic units and range from 0.05 to 1.95 wt% (average = 1.1 wt%) and from 0.00 to 0.09 wt% (average = 0.05 wt%), respectively. C/N ratios range from 0.85 to 14.92.
Physical propertiesNGR, magnetic susceptibility, gamma ray attenuation (GRA)
bulk density, and P-wave velocity were measured using the Whole-Round Multisensor Logger (WRMSL) (Figure F9). Thermal con-ductivity was measured on WR core sections. Discrete P-wave ve-locity, moisture and density (MAD), and undrained shear strength were measured on working-half sections. MAD porosity values de-crease from 74% near the seafloor to ~40% at 85 mbsf. At 109–135 and 250–284 mbsf, porosity values are nearly constant at 41%–45% and 37%–43%, respectively. Between 520 and 635 mbsf, porosity values show a slight increase with depth and range between 34% and 48%. P-wave velocity values range from 1500 to 1600 m/s be-tween 0 and 10 mbsf, but the data are unreliable for the rest of the borehole.
Undrained shear strength values increase linearly from 0 to ~180 kPa with an average depth-dependent gradient of 2.5 kPa/m between 0 and 85 mbsf in Holes U1519D and U1519E. In Hole U1519C, shear strength remains mostly constant with average val-ues of ~62 kPa between 105 and 140 mbsf, 30–300 kPa between 250 and 290 mbsf, and 54–1104 kPa between 515 and 555 mbsf. NGR values range from ~0 to 70 counts/s in Hole U1519C and are rela-tively uniform through the cored intervals, with an average of 40
counts/s. Magnetic susceptibility values are nearly constant be-tween 0 and 150 mbsf and range from 10 × 10−5 to 30 × 10−5 SI, ex-cept for a few ash layers where magnetic susceptibility values reach as high as 300 × 10−5 SI. Between 250 and 283 mbsf, magnetic sus-ceptibility values range from 15 × 10−5 to 20 × 10−5 SI and increase to 40 × 10−5 to 50 × 10−5 SI at 283 mbsf, which corresponds to the litho-stratigraphic Unit I/II boundary. Thermal conductivity values range from 0.8 to 1.6 W/(m·K) between the seafloor and 80 mbsf. Between 109 and 135 mbsf, thermal conductivity values are uniform at ~1.3 W/(m·K). Deeper than 250 mbsf, thermal conductivity values in-crease to ~1.4 W/(m·K).
Downhole measurements Formation temperature measurements were taken with the
APCT-3 shoe with Cores 4H–8H, 9F, 11F, and 13F. The APCT-3 measurements yield in situ temperature values from 6.44°C at 31 mbsf to 7.91°C at 86 mbsf and define a thermal gradient of 24.3°C/km. Using a mean thermal conductivity value of 1.31 W/(m·K), the heat flow is estimated as ~33 mW/m2.
Core-log-seismic integrationLWD data acquired during Expedition 372 in Hole U1519A
were correlated with core-based observations and physical proper-ties measurements from Holes U1519C–U1519E and with seismic reflection data across the site in the North Tuaheni Basin. LWD P-wave velocity and density measurements (Pecher et al., 2018) were used to develop a synthetic seismic trace to correlate the LWD, core, and seismic data (Figure F9), which allowed us to assess the match between the seismic traces that would be predicted from the physi-cal properties in the boreholes with seismic sections acquired across Site U1519 prior to the expedition. Based on the new seismic tie, the precise boundaries of the three major seismic units (defined by the Expedition 372 scientists) were revised and compared with LWD data and lithostratigraphic units from Expedition 375.
The upper seismic unit is 281 m thick and comprises a horizon-tally layered basin-fill sequence, including at least two interpreted MTDs in the upper 141 mbsf and a thick underlying section of in-ferred highly reflective, presumably sandy sediments that were not cored. Cores from recovered intervals in this seismic unit comprise mudstones with minor sand and volcanic ash and are dated <0.54 Ma. Both observatory screens were deployed in silty mudstone in-tervals in this unit. The middle seismic unit is a seaward-dipping 265 m thick slope sequence partially buried by the upper seismic unit. This interval includes a mixture of layered sediments and MTDs interpreted in the seismic data. Only the upper 3.5 m and lower 27 m of this sequence were cored, and these intervals consist of predominantly fine grained mudstone. The lower seismic unit is a strongly reflective interval that dips landward, likely as a result of uplift and tilting by thrust faulting. Cores recovered from this unit to 635 mbsf consist of mudstone and MTDs containing coarser ma-terial, which have been dated at 0.54–1.73 Ma, younger than the ex-pected Miocene/Pliocene age that was inferred prior to drilling.
Site U1520Background and objectives
The primary objective at Site U1520 was to sample the sedimen-tary sequence on the subducting Pacific plate to provide insight into the lithologies and conditions expected deeper along the sub-duction interface and in the SSE source area. The site lies ~95 km from shore and 16 km east of the deformation front in ~3520 m wa-ter depth (Figure F3; Table T1). Site U1520 was expected to en-
15
D.M. Saffer et al. Expedition 375 Preliminary Report
counter sediments and rocks of late Quaternary to Cretaceous age based on regional seismic stratigraphic interpretation of the Hiku-rangi Plateau and Hikurangi Trough stratigraphy (Figure F2) (Barnes et al., 2010; Davy et al., 2008). The upper ~610–640 m of the section was expected to consist mainly of mud and sand turbidites, hemipelagic sediment, debris flow material, and minor ash of pre-dominantly Pliocene–Quaternary age. The package from ~640 to ~840 mbsf was expected to comprise Late Cretaceous, Paleogene, and Miocene sedimentary rocks of the Hikurangi Plateau cover se-quence, including nannofossil chalk, mudstone, tephra, and sand-stone, with possible unconformities. The strongly reflective sequence deeper than 840 mbsf was interpreted to include basalts, volcaniclastic sediments, and breccia, with intervals of pelagic chert and/or limestone (e.g., Davy et al., 2008).
The coring objective at Site U1520 was to sample the entire sed-imentary section on the Pacific plate, with a highest priority on re-covering the materials deeper than ~600 mbsf that represent the protolith for material transported into the SSE source region. To maximize the likelihood of successfully coring the deep portion of the section, we drilled in casing to 642 mbsf in Hole U1520C and undertook RCB coring below the casing to 1054.1 mbsf. Following coring in Hole U1520C, we conducted wireline logging in the open hole below the casing from 642 to 947 mbsf. We returned to Site U1520 later during the expedition to undertake APC/XCB coring in Hole U1520D to sample the upper 642 m of the section.
The scientific objectives at Site U1520 were to define the struc-tures and deformation, physical properties, lithology and composi-tion, and interstitial fluid geochemistry of the incoming material in its “presubduction” state. Coring data will also be used for core-log-seismic integration across the Hikurangi Trough. Priorities for post-expedition analysis include but are not limited to measurement of the mechanical, elastic, frictional, and hydrological properties of the incoming sediment and basement along with detailed composi-tional analyses.
OperationsTransit to Site U1520
We first occupied Site U1520 (proposed Site HSM-05A) while waiting for the Tangaroa to deliver replacement seals needed for the observatory installation at Site U1518. We arrived at Site U1520 at 0257 h (UTC + 12 h) on 28 March 2018.
Hole U1520CFirst, we fabricated the base of the reentry cone, assembled the
hydraulic release tool (HRT) needed to deploy the reentry system, assembled a casing string consisting of 54 joints of 10¾ inch casing and a casing shoe, and secured the casing string in the moonpool at 0130 h on 29 March 2018. Next, we put together the drilling assem-bly needed to drill in the reentry system. The drilling assembly was composed of a 9⅞ inch drill bit, an underreamer with its arms set to 14¾ inches, and a mud motor to rotate the bit and underreamer in isolation from the casing. The underreamer arms were tested, and the drilling assembly was completed and landed inside the casing at 0500 h on 29 March. The drilling assembly and HRT were con-nected to the casing and mud skirt, the reentry cone was assembled in the moonpool, and the reentry system was lowered to the sea-floor. While the reentry system was being lowered to the seafloor, the Tangaroa arrived at 1615 h to deliver the replacement seals needed for the CORK-II installation at Site U1518.
The subsea camera was deployed to monitor the reentry cone and base while drilling it into the seafloor. Hole U1520C
(38°58.1532′S, 179°7.9112′E; 3522.1 mbsl) was spudded at 1940 h on 29 March, and it took ~27 h for the bit to reach a total depth of 646 mbsf with the casing shoe at 642 mbsf. Once the drilling system was released from the reentry system, we recovered the subsea camera and then the drill string at 1120 h. With the reentry system com-pleted, we departed for Site U1518 at 1310 h on 31 March to com-plete the observatory installation there.
We returned to Site U1520 on 2 April following a ~10 h devia-tion to the Gisborne Pilot Station for a personnel transfer and reached Hole U1520C at 1848 h on 2 April. We assembled an RCB coring assembly and reentered Hole U1520C at 0525 h on 3 April. The next several hours were spent cleaning cuttings out of the in-side of the 642 m deep casing. RCB coring started at 1200 h on 3 April. Cores 2R–44R penetrated from 646.0 to 1054.1 mbsf and re-covered 235.81 m (58% recovery). Nonmagnetic core barrels were used for all cores. Coring was terminated so that Hole U1520C could be logged before the weather deteriorated.
To prepare Hole U1520C for logging, we circulated the cuttings out of the hole with mud and recovered the RCB BHA. The subsea camera was deployed to check the reentry cone, which appeared to have sediment inside, and the cone was flushed with seawater. Once the drill string was recovered, we made up a logging BHA and low-ered it to the seafloor. Hole U1520C was reentered at 0250 h on 9 April, and the drill pipe was set at 599 mbsf for logging, 42 m above the casing shoe. We deployed a modified triple combo tool string with the following tools from the bottom up: the Dipole Sonic Im-ager (DSI; sonic velocity), High-Resolution Laterolog Array (HRLA; resistivity), Hostile Environment Litho-Density Sonde (HLDS; cali-per only, without the density source), and Enhanced Digital Teleme-try Cartridge (EDTC; gamma ray and telemetry). We made two logging passes from 642 to 947 mbsf, where we encountered an ob-struction 107 m from the bottom of the hole. The tools were back on the rig floor at 1505 h on 9 April, and the drill string was recov-ered at 0010 h on 10 April, ending operations in Hole U1520C. The next objective for the expedition was to install an observatory at Site U1519 and core at Site U1526.
Hole U1520DAfter a ~6 h transit from Site U1526, we arrived at the specified
coordinates of Hole U1520D at 2305 h on 24 April 2018. Our objec-tive for Hole U1520D was to core the uppermost sediment (shal-lower than 646 mbsf) that we drilled without coring in Hole U1520C. After assembling an APC/XCB BHA, Hole U1520D (38°58.1475′S, 179°7.8991′E; 3520.3 mbsl) was spudded at 0850 h on 25 April. Cores 1H–67X advanced from 0 to 642.3 mbsf and recov-ered 318.38 m (62% recovery). In this interval, we drilled without coring from 189.3 to 220.0 mbsf and from 270.8 to 366.6 mbsf. Cor-ing was suspended from 1600 h on 29 April until 1315 h on 30 April while we waited on weather. Nonmagnetic core barrels were used with all APC cores. Formation temperature measurements were taken with the APCT-3 for Cores 4H, 7H, 10H, 13H, 16H, 19F, 23F, and 27F. The time spent at Site U1520 was 18.26 days.
Principal resultsLithostratigraphy
Six lithostratigraphic units were defined at Site U1520 (Figure F10). The sediments and sedimentary rocks range in age from Cre-taceous to Holocene. Thin tephra layers are scattered throughout most of the succession.
Lithostratigraphic Unit I begins at the seafloor and extends to 110.5 mbsf. This interval consists of greenish gray hemipelagic mud
16

D.M. Saffer et al. Expedition 375 Preliminary Report
punctuated by graded beds of dark gray silt and sand. We interpret the coarser beds to be products of deposition by turbidity currents on the floor of the Hikurangi Trough.
Unit II (110.5–222.0 mbsf ) consists of hemipelagic mud with silt interbeds. These turbidites are generally finer grained and thinner than those recovered in Unit I. Based on interpretations of seismic reflection data, Unit II is thought to represent the distal edges of the Ruatoria debris avalanche. However, mesoscopic evidence is lacking for the types of soft-sediment, gravity-driven deformation expected in a submarine slide or debris flow deposit (e.g., truncated and ro-tated laminae, irregular bedding dips, fragmentation of cohesive mud clasts, clasts-in-matrix fabrics, and flow banding).
Unit III (222.0–509.82 mbsf) is similar to Unit I but without thick sand beds. The turbidites are characterized by graded beds of fine sand to silt with planar- and cross-laminae. We interpret the depositional environment to be in the Hikurangi Trough during a period of time in which turbidity currents were less frequent, more dilute, and finer in grain size.
Unit IV begins at 509.82 mbsf in Hole U1520D and extends to 848.45 mbsf in Hole U1520C. Lithologies change markedly across the Unit III/IV boundary to a Miocene–Paleocene pelagic carbon-ate facies that includes light greenish gray marl, light brownish gray calcareous mudstone, and pale brown chalk. Secondary lithologies include matrix-supported gravity-flow deposits and volcanic tuff. The debris flow deposits display contorted to fragmented marl and chalk, together with angular to subrounded clasts of volcaniclastic sandstone and vesicular basalt.
Unit V (848.45–1016.24 mbsf ) is dominated by granule-sized volcaniclastic conglomerate. These Cretaceous deposits are charac-terized by subangular clasts of basalt that range in size from a few millimeters to 6 cm. The fabric ranges from clay matrix supported to clast supported, and the mechanisms of emplacement probably included grain and debris flow. Alteration of the basalt clasts to palagonite and clay minerals is pervasive. Zeolites and calcite are common cements.
Unit VI (1016.24–1045.75 mbsf) comprises a blend of rock types whose stratigraphic organization and thicknesses are not re-solvable. Much of the unit contains alternating volcaniclastic con-glomerate and mudstone with a distinctive dark bluish gray to greenish gray color. Additional lithologies include pyrite-rich silt-stone, organic-rich black mudstone, white limestone, reddish brown siltstone, and vesicular basalt with amygdules.
BiostratigraphyThe sedimentary sequence and upper portion of the Hikurangi
Plateau basement cored at Site U1520 represent a discontinuous Holocene to late Cretaceous succession comprising several hiatus-bounded packages. Planktonic foraminifers and calcareous nanno-fossils indicate that Holes U1520D and U1520C recovered Holo-cene sediment (<0.009 Ma) from 0 to 5.93 mbsf, Pleistocene (0.009–2.17 Ma) from 15.40 to 537.21 mbsf, Pliocene from 543.45 to 577.35 mbsf, a Pliocene/Miocene boundary sequence from 598.06 to 587.74 mbsf, Miocene from 635.65 to 746.89 mbsf, late Oligocene from 756.62 to 766.20 mbsf, middle to early Eocene from 775.17 to 825.53 mbsf, and middle to early Paleocene from 827.04 to 848.01 mbsf.
The underlying volcaniclastic sequence (849.96–1045.75 mbsf) spanning lithostratigraphic Units V and VI is largely unfossiliferous, except for 950.22–953.45 and 1016.69–1017.82 mbsf, where Late Cretaceous foraminifers were recovered. Organic-rich sediments from 1036.57 to 1037.21 mbsf also include poorly preserved radio-
larian faunas and siliceous branching tube-like fossils of unknown affinity. Minor reworking of planktonic foraminifers is evident throughout the cored sedimentary succession but is most notable at ~512 mbsf, where common, well-preserved middle to early Eocene, Miocene, and Pliocene taxa are present in a Pleistocene fauna, and at ~588 mbsf, where late Miocene (8.96–9.63 Ma) taxa dominate a Miocene/Pliocene boundary fauna.
PaleomagnetismPaleomagnetic investigations included NRM measurement of
archive-half sections prior to and following stepwise AF demagneti-zation to peak fields of 30 or 40 mT. In addition, 1–2 discrete sam-ples per core were subjected to more detailed AF or thermal demagnetization. The data quality and processing strategy differed somewhat for Holes U1520C and U1520D as a result of the different coring systems used, core disturbance, and recovery. With few ex-ceptions, characteristic remanent magnetization directions calcu-lated from data sets based on discrete samples were mostly coherent. A magnetostratigraphy was produced with confidence for APC and RCB cores (375-U1520D-1H through 30H and Core 375-U1520C-2R through Section 23R-6A) and tentatively for XCB cores (375-U1520D-31X through 66X). The volcaniclastic deposits of Units V and VI all yield steep negative inclinations, suggesting that the entire unit may have been remagnetized. The Brun-hes/Matuyama Chron boundary was identified at 413 mbsf, which is roughly consistent with biostratigraphic ages. Additional polarity horizons will be identified postexpedition.
Structural geologyThe rocks encountered at Site U1520 are generally undeformed.
Bedding dips gently (<30°) over the entire depth of the hole, with the exception of folded strata in debris flow deposits. The RAB image log shows some intervals of steeper dips that are not recognized in the cores. Discrete small displacement deformation features were observed throughout Hole U1520C (646–1036 mbsf ) but are largely absent shallower than 596.4 mbsf in Hole U1520D (Figure F11).
Distinct structural domains are mostly correlated with litho-stratigraphic units. Domain 1 (0–596.4 mbsf) is defined by sub-horizontal to gently dipping beds with no discrete deformation features. Deeper than 596.4 mbsf, faults (normal when sense of slip was determined) and dissolution features are present throughout Domain 2 (596.4–848.45 mbsf ), which consists of calcareous clay-rich sediments (Figure F11). Veins are more common in the volca-niclastic units that comprise Domain 3 (848.45–1016.24). Finally, Domain 4 (1016.24–1045.75) near the bottom of the hole coincides with lithostratigraphic Unit VI, where deformation is dominated by minor faults.
GeochemistryA total of 89 WR samples were collected and squeezed for ship-
board and shore-based pore water chemical analyses. Despite the high bulk density and cemented nature of the sediments recovered in Hole U1520C, pore water was recovered in all three lithostrati-graphic units. The geochemical profiles at Site U1520 are complex and likely reflect the combined effects of organic matter diagenesis, non-steady-state sedimentation, volcanic ash/silicate mineral dia-genesis, carbonate mineral diagenesis, solute diffusion, and poten-tial lateral fluid flow in the volcaniclastic sediments of lithostratigraphic Unit V.
Contemporary carbonate mineral recrystallization is manifested by elevated dissolved Sr concentrations in Unit IV shallower than
17

D.M. Saffer et al. Expedition 375 Preliminary Report
769 mbsf. Deeper than 769 mbsf, Sr concentrations decrease mono-tonically to near constant values in Unit V. The decrease in Sr con-centrations at the base of Unit IV suggests that carbonate recrystallization is minor and that present-day carbonate diagenesis is restricted to the top of Unit IV. Sulfate concentrations increase linearly through the lower part of Unit IV and remain elevated and nearly constant in Unit V. A similar pattern occurs in the Sr and Mg profiles. Maintaining this gradient likely requires lateral flow of a sulfate-enriched fluid in the volcaniclastic sediments, in a manner similar to off-axis hydrothermal flow systems in igneous ocean crust (i.e., Baker et al., 1989; Fisher and Wheat, 2010; Solomon and Kastner, 2012; Vannucchi et al., 2013).
Chloride concentrations increase linearly to a peak at 51.3 mbsf (Figure F11), decrease to 142 mbsf, and remain relatively constant to the base of Unit III. Collectively, these profiles suggest a zone of localized volcanic ash alteration/silicate mineral diagenesis and the precipitation of hydrous aluminosilicate minerals. Below this zone, in the lower portion of Unit IV and in Unit V, Cl concentrations are depleted relative to seawater and marked by several excursions to lower values over only 10 m to a few tens of meters, which may re-flect local addition of freshened water.
A total of 93 samples from Hole U1520C and 108 samples from Hole U1520D were taken for carbonate analyses. In lithostrati-graphic Units I–III, calcium carbonate (CaCO3) varies from 2.06 to 18.4 wt%. In lithostratigraphic Units IV–VI, CaCO3 varies from 0.35 to 96.9 wt%, reflecting variations in lithology. The CaCO3 profile mimics the total C and inorganic C profiles, with similar trends in all lithostratigraphic units. In the deepest part of Unit IV, CaCO3
values range from 90.0 wt% at 799.0 mbsf to 91.4 wt% at 844 mbsf. This high carbonate abundance reflects the presence of pelagic car-bonate. In Unit V, peaks in CaCO3 content generally reflect local-ized calcite cement. Organic C values are generally low (<1.19 wt%) throughout the section.
Physical propertiesPorosity values decrease with depth from 72% at the seafloor to
28%–38% at ~800 mbsf, with some lower values of ~40% between 40 and 106 mbsf that correspond to sand layers. Deeper than 800 mbsf, porosity increases to 56%. Deeper than 855 mbsf, porosity generally decreases with depth but with substantial scatter to the bottom of the hole. The scatter is associated with varying degrees of cementation (Figure F11).
P-wave velocities range from 1450 to 1800 m/s between the sea-floor and ~90 mbsf. Between 90 and 420 mbsf, P-wave velocity mea-surement was mostly unsuccessful due to gaps between cores and liners and expansion cracks. Between 420 and ~845 mbsf, velocities generally increase with depth, ranging from 1500 to 2700 m/s, with little scatter. Deeper than 845 mbsf in volcaniclastic Units V and VI, P-wave velocity exhibits significant scatter, ranging from 1800 to ~5000 m/s. Undrained shear strength increases with depth from 0–10 kPa at the seafloor to 100–150 kPa at 150 mbsf and remains con-stant to 400 mbsf, followed by a rapid increase with depth to ~600 kPa at 500 mbsf.
NGR values range from ~0 to 75 counts/s. Mean values are be-tween 30 and 50 counts/s in all units, except lithostratigraphic Unit IV where the mean NGR value is ~20 counts/s. Magnetic suscepti-bility values are nearly constant with depth in lithostratigraphic Units I–III and range from 20 × 10−5 to 40 × 10−5 SI. In lithostrati-graphic Unit IV, magnetic susceptibility values increase with depth from 10 × 10−5 at ~510 mbsf to 100 × 10−5 at ~700 mbsf and then decrease to ~4 × 10⁻⁵ SI at 800–849 mbsf. At the top of lithostrati-
graphic Unit V at ~849 mbsf, magnetic susceptibility values shift rapidly to ~100 × 10−5 SI and then gradually increase with depth to 300 × 10−5 SI at ~900 mbsf, followed by a gradual decrease with depth to 10 × 10−5 SI at ~1020 mbsf. At 1045 mbsf, magnetic suscep-tibility values rapidly increase to ~300 × 10−5 SI.
Thermal conductivity values increase with depth from 1.0 W/(m·K) at the seafloor to 1.3 W/(m·K) at ~20 mbsf and remain nearly constant to ~550 mbsf. Some higher thermal conductivity values of 1.6–1.9 W/(m·K) occur between 23 and 87 mbsf and cor-respond to sand layers. Measurements were not made between 550 and 646 mbsf because the sediments were too indurated for a nee-dle probe and too fragile and disturbed by coring for the half-space probe. Thermal conductivity values increase from ~1.2 W/(m·K) at 648 mbsf to 1.8 W/(m·K) at 700 mbsf and then remain relatively constant to ~850 mbsf. Deeper than 850 mbsf, thermal conductivity is nearly constant, with an average value of 1.2 W/(m·K).
Downhole measurementsFive APCT-3 equilibrium temperature measurements were
combined with thermal conductivity measurements and yielded a heat flow of 44 mW/m2 and a temperature gradient of 38°C/km. This heat flow value is consistent with heat flow measurements made using a 3.5 m thermal probe during R/V Roger Revelle Cruise RR1508 in the same location (Harris et al., 2016).
Hole U1520C was logged using a modified triple combo that in-cluded borehole diameter from a mechanical caliper (HLDS), gamma ray (EDTC-B), resistivity (HRLA), and DSI. The nuclear source was not mounted on the HLDS. Although some differences exist, wireline logs are generally consistent with LWD data collected during Expedition 372 (Figure F10) (Pecher et al., 2018). The caliper shows that the hole ranges in size from 8 inches (likely due to col-lapse or swelling of clays) to 17 inches. The hole is irregular with many washouts below 780 mbsf. In the uncased portion of Hole U1520C, gamma ray varies between ~20 and 80 gAPI, P-wave veloc-ity varies between ~1.6 and 2.9 m/s, and resistivity is relatively con-stant at ~2 Ωm, with the exception of strong peaks between 870 and 890 mbsf. In general, gamma ray and P-wave velocity are inversely correlated between 640 and 848 mbsf and positively correlated be-low 848 mbsf.
Core-log-seismic integrationThe P-wave velocity data from LWD and wireline logging were
integrated to develop a velocity model to 944 mbsf. Because density data were not recorded during Expedition 375 wireline logging, the density data from LWD were merged with whole-round track and discrete sample data to construct a density model. A synthetic seis-mic reflection trace was developed to tie the LWD, core, and seismic data (Figure F11). Considering the new seismic tie from this analy-sis, the precise boundaries of the nine seismic units defined by the Expedition 372 scientists were revised, and we compared these units with LWD data from Expedition 372, wireline data, and litho-stratigraphic units from Expedition 375.
Seismic Unit 1 is 106 m thick and comprises moderate- to low-amplitude, laterally continuous reflections. Cores show the se-quence to comprise mud, silt and fine-grained sandy turbidites, and hemipelagic sediments of Late Pleistocene to Holocene age. Seismic Unit 2 is 119 m thick and is characterized by moderate- to low-am-plitude, semicontinuous and chaotic reflections and has been inter-preted from seismic and LWD data to represent the Ruatoria avalanche MTD. In Hole U1520D, cores were only recovered from the upper 80 m of the unit, and the base of the unit was not sampled.
18
D.M. Saffer et al. Expedition 375 Preliminary Report
The lithofacies is composed mostly of thin-bedded horizontal silty turbidites with occasional mud intraclasts and erosional bases. The sequence appears largely undisturbed. Seismic Units 3–5 consist of variable amplitude, laterally continuous reflections that can be traced widely along and across the Hikurangi Trough. Coring re-veals that these units are composed of normally graded silty turbid-ites with thick volcanic ash layers near the top of the unit. Microfossil ages indicate that these are early to late Pleistocene in age.
Seismic Units 6–8 have a more irregular geometry than the overlying units and have moderate- to low-amplitude reflections, which are locally offset by small normal faults. The disrupted nature of the reflections in seismic Unit 6 could be interpreted to be one or more debris flows originating from the flanks of Tūranganui Knoll. Coring reveals that these units are composed of marl and calcareous mudstone with tuff and thin MTDs overlying chalk. Biostratigraphy indicates that these units are early Paleocene to early–middle Pleis-tocene in age. Seismic Unit 9 consists of high-amplitude reflections that are semicontinuous to discontinuous and corresponds to litho-stratigraphic Units V and VI, which are composed predominantly of mixed, variably cemented volcaniclastic lithologies and thin inter-vals of calcareous and black mudstone. The seismic units exhibit an overall progradational geometry toward the west, building outward into the basin away from the flank of Tūranganui Knoll. Microfossil ages indicate that seismic Unit 9 is late Early Cretaceous to Late Cretaceous in age.
Site U1526Background and objectives
The primary drilling objective at Site U1526 was to sample the thin sediment cover (~30 m) and ~100–150 m of underlying volca-niclastics or basement on the western flank of Tūranganui Knoll Seamount in 2908 m water depth (Figures F2, F3; Table T1). The scientific aim of coring was to characterize the seamount’s composi-tion, physical properties, extent of alteration and hydration, and structure and hydrogeology prior to transport into the SSE source region. Seismic imaging shows that subducted seamounts present in the source region of shallow SSEs along the drilling transect (Bell et al., 2010) are possible barriers to SSE propagation (Wallace et al., 2016; Figure F1) and that they may potentially be related to the loca-tion of historical tsunami earthquakes (Bell et al., 2014). Priorities for postexpedition core analysis include but are not limited to mea-surement of the mechanical, elastic, frictional, and hydrological properties of the incoming sediment and basement along with de-tailed analyses of composition and alteration.
OperationsTransit to Site U1526
The vessel arrived at Site U1526 (proposed Site HSM-08A) at 1700 h (UTC + 12) on 22 April 2018.
Hole U1526AAn RCB BHA was assembled, and the drill string was lowered to
the seafloor. Hole U1526A (39°1.3203′S, 179°14.7594′E; 2890.1 mbsl) was spudded at 0150 h on 23 April 2018. Cores 1R–14R ad-vanced from 0 to 83.6 mbsf and recovered 29.26 m (35% recovery). Nonmagnetic core barrels were used for all RCB cores. At the com-pletion of coring, the drill bit was partially raised from the seafloor, and the ship returned to nearby Site U1520.
Hole U1526BOn 2 May 2018, we returned to Site U1526 following an 8 h tran-
sit from Site U1520 in dynamic positioning mode. The ship was off-set 20 m west-northwest from Hole U1526A, and Hole U1526B (39°1.3146′S, 179°14.7481′E; 2888.4 mbsl) was spudded at 2015 h on 2 May. APC Cores 1H–4H and XCB Core 5X advanced from 0 to 33.5 mbsf and recovered 31.56 m (94% recovery). Nonmagnetic core barrels were used for all APC cores. The time spent at Site U1526 was 2.88 days.
The JOIDES Resolution started the transit to Auckland (New Zealand) at 1200 h on 3 May. Expedition 375 ended with the first line ashore at the Freyberg Wharf in Auckland at 0652 h on 5 May 2018.
Principal resultsLithostratigraphy
We identified two lithostratigraphic units at Site U1526 (Figure F12). Unit I is characterized by fine-grained mixed sediment (i.e., siliciclastic–calcareous) to biocalcareous sediment. Unit II com-prises volcaniclastics. Unit I extends from 0 to 30.23 mbsf and is composed of mud, calcareous mud, and nannofossil-rich ooze. The upper greenish gray mud contains foraminifer-rich silt and ash lay-ers. Between 26.91 and 30.23 mbsf, the lithology changes from greenish gray mud to light green calcareous mud with nannofossils and then to whitish brown nannofossil ooze. Unit I ranges in age from Holocene to Late Cretaceous.
The Unit I/II boundary at 30.23 mbsf is characterized by a 20 cm interval rich in manganese concretions. Unit II is Cretaceous in age. Below the manganese-rich layer, we observed a volcaniclastic sand-stone to conglomerate with variably altered basalt clasts in a sand-sized matrix composed of shell and basalt fragments (Figure F12). The top of the volcaniclastic conglomerate is characterized by abundant intact shells. Because of the sharp contact between the dramatically different lithofacies of Units I and II, the presence of the manganese crust at the top of Unit II, and the Cretaceous macrofossils found in the volcaniclastic conglomerate, we interpret this boundary to be an unconformity. Below the shell-rich layer, ba-salt clasts generally range from centimeter to decimeter scale, with some basalt intervals extending for 1–2 m.
BiostratigraphyThe sedimentary succession cored at Site U1526 ranges in age
from Holocene to Late Cretaceous (Figure F12). High foraminiferal abundances and good preservation were observed throughout the upper sedimentary cover (lithostratigraphic Unit I). Below this in-terval, in lithostratigraphic Unit II, volcaniclastic coarse sandstones and conglomerates are barren of microfossils, although macroinver-tebrate remains provide broad biostratigraphic and paleowater depth constraints.
Planktonic foraminifers and calcareous nannofossils indicate that Holes U1526A and U1526B recovered a succession of Holocene (<0.009 Ma) and Pleistocene (0.44–2.17 Ma) sediments from 0.07 to 19.95 mbsf, overlying late Miocene (5.33–5.44 Ma) sediments from 20.47 to 21.07 mbsf and Late Cretaceous (~66–74 Ma) sediments at 30.20 mbsf. Planktonic foraminifer abundances and benthic fora-minifer assemblages throughout Unit I are indicative of open oce-anic settings and mid- to lower bathyal water depths (>600 m), respectively. Macroinvertebrate remains in Unit II are consistent with Late Cretaceous shallow-water bioclastic material transported downslope.
19

D.M. Saffer et al. Expedition 375 Preliminary Report
The underlying volcaniclastic section recovered in Hole U1526A (29.1–81.39 mbsf ) was generally barren of microfossil re-mains; however, a coarse sand–sized volcaniclastic sandstone to conglomerate in the upper portion (29.1–38.8 mbsf ) of Unit II con-tains abundant bivalve shells. Below this interval, large subrounded to subangular pebbles and boulders of variably altered to fresh ba-salt are embedded in a coarse volcaniclastic sand matrix that con-tains remobilized shell material, echinoid spines, and coralline algae.
PaleomagnetismPaleomagnetic investigations at Site U1526 focused on (1) pro-
ducing a preliminary magnetostratigraphy for the sedimentary cover sequence sampled in Hole U1526B, (2) resolving remanence intensity and demagnetization behavior of volcaniclastic material recovered deeper than 24 mbsf, (3) providing constraints on the emplacement temperatures of the volcaniclastic material, and (4) exploring the possibility that in situ lava flows are present. Analyses included the continuous NRM measurement of archive-half sec-tions prior to and following AF demagnetization. An additional 14 discrete samples from individual basaltic clasts were subjected to thermal demagnetization experiments.
The pelagic sediments from Hole U1526B yield NRMs in the range of ~0.005 to 0.5 A/m that decay rapidly during the removal of a steep drilling overprint. Following AF treatment to 10 or 20 mT, inclination records display a well-defined pattern with multiple switches from negative (normal polarity) to positive (reversed po-larity) inclinations with sharp transitions.
The NRM of the volcaniclastic materials in lithostratigraphic Unit II ranges from ~0.2 to 13.0 A/m. The NRM directions have in-clinations that usually differ among mafic clasts, suggesting that the clastic material was emplaced at ambient (“cold”) temperatures. Re-manent magnetization directions from discrete samples are coher-ent with the directions measured on the archive-half sections. Samples generally yield high-quality demagnetization behavior and primarily demagnetize in the blocking temperature range of 250°–350°C, suggesting that titanomagnetite or titanomaghemite is the main remanence carrier.
Basalts recovered between 57.2 and 64.8 mbsf yield consistent steep and negative NRM inclinations similar to the inclination of a ~1.5 m long and mostly intact piece of basalt recovered between 24.6 and 26.03 mbsf, which raises the possibility that in situ lava flows may be present, although heavily fractured, in the sequence.
Structural geologyBedding planes are difficult to resolve throughout the cored in-
terval at Site U1526, although local distinctive sedimentary struc-tures are noted. Brecciated clasts are scattered throughout, exhibiting possible shear fabrics. Fractures and veins are the most common structural features (Figure F13) and can be observed in both clasts and matrix. Both fracture-filled and diffuse veins are present in the volcaniclastic deposits. We defined two distinct structural domains at this site. Domain 1 contains fine-grained sed-iments with no veins. Domain 2 contains volcaniclastic sediments and basalt and is distinguished by varying degrees of cementation and veining.
GeochemistryThe main objective of the inorganic geochemistry program at
Site U1526 was to identify diagenetic reactions and to evaluate the possibility of vertical recharge of seawater through the Tūranganui
Knoll Seamount. A total of 11 routine pore water WR samples were collected from APC cores in Hole U1526B and squeezed for ship-board and shore-based pore water chemical analyses. The geo-chemical profiles at Site U1526 reflect the combined effects of early organic matter diagenesis and carbonate/silicate mineral diagenesis. There is a sharp gradient in the profiles of many solutes (Figure F13) approaching the volcaniclastic sediments of Unit II to a modi-fied fluid composition similar to that of the volcaniclastic unit (Unit V) at Site U1520.
Hydrocarbon gases were not detected at Site U1526. In litho-stratigraphic Unit I (0–30.23 mbsf), which consists of fine-grained mixed to biocalcareous sediment, CaCO3 exhibits a large degree of scatter (ranging from 1.26 to 69.99 wt%). Calcium carbonate con-tent increases with depth and reaches the highest value (69.99 wt%) in Unit I at 21 mbsf, which corresponds to nannofossil-rich ooze. In lithostratigraphic Unit II (30.23–81.39 mbsf ), which is composed of coarse volcaniclastic sandstone and volcaniclastic conglomerate, CaCO3 concentrations also exhibit a large degree of scatter, ranging between 0.25 and 68.30 wt%. The highest value (68.30 wt%) in Unit II is indicative of bivalve shell and calcite cement incorporation in the shell-rich bed at the top of the volcaniclastic sequence. Organic carbon values are low in Units I and II (ranging from 0.00 to 0.61 wt%); the highest values are shallower than 21 mbsf and correspond to calcareous mud. Carbon/nitrogen ratios range from 20.89 (possi-bly due to a terrestrial influence of organic matter) to 190.91.
Physical propertiesPorosity values are 62%–68% between the seafloor and 21 mbsf
in lithostratigraphic Unit I (Figure F13). Porosity decreases abruptly to 18% at ~30 mbsf at the top of Unit II. From 39 mbsf to the bottom of Hole U1526A in lithostratigraphic Unit II, porosity values exhibit large scatter (2%–44%) and average 20% with no significant down-hole trend. In lithostratigraphic Unit I (0–30 mbsf ), P-wave velocity ranges from 1450 to 1570 m/s. Deeper than 30 mbsf in Unit II, P-wave velocity ranges from 1700 to ~6000 m/s, with significant scat-ter arising from the heterogeneous nature of the conglomerates and basalt, due in part to variable degrees of cementation. Thermal con-ductivity values range between 1.2 and 1.6 W/(m·K) and have a mean value of 1.5 W/(m·K). Undrained shear strength increases with depth, ranging from 0 to ~100 kPa between 0 and 30 mbsf. NGR values in lithostratigraphic Unit I mostly range between 20 and 40 counts/s, except for lower values of 2–8 counts/s between 27 and 30 mbsf, where nannofossil-rich ooze is present. NGR values in lithostratigraphic Unit II increase from ~29 counts/s at the top of the unit to ~36 counts/s at ~50 mbsf and then decrease gradually to 27 counts/s at the bottom of the cored interval. Magnetic suscepti-bility values mostly range from 10 × 10−5 to 200 × 10−5 SI in litho-stratigraphic Unit I, shallower than ~30 mbsf. Deeper than ~30 mbsf, magnetic susceptibility values range from ~100 × 10−5 to 3000 × 10−5 SI with an average value of ~1400 × 10−5 SI.
Core-log-seismic integrationCore-based observations and measurements from Holes
U1526A and U1526B were integrated with seismic reflection data from Tūranganui Knoll. In the absence of logging data, we used P-wave velocity and density data from cores to construct a lithologic model and produce a seismic-well tie (Figure F13). P-wave velocity data from the Hole U1526B pelagic sediments indicate that velocity values in this interval are low, typically ranging from ~1500 to 1530 m/s, which is consistent with a strong reflection at the base of litho-stratigraphic Unit I that separates the pelagic sediments from ce-
20
D.M. Saffer et al. Expedition 375 Preliminary Report
mented volcaniclastic sandstones below. To depth convert the seismic data below Unit I, we used a mean P-wave velocity value of 3805 m/s from core data.
Two seismic units were identified at Site U1526. Seismic Unit 1 corresponds to lithostratigraphic Unit I and is represented by a weakly reflective interval that is 30.2 m thick in Hole U1526B. How-ever, the thickness varies significantly away from the site, reaching more than 140 m elsewhere on Tūranganui Knoll. Cores show that seismic Unit 1 (0–30.2 mbsf) comprises predominantly light green-ish gray calcareous mudstone over brownish white nannofossil-rich ooze with thin layers of volcanic ash and represents a highly con-densed section that spans from the Holocene to Cretaceous. Seis-mic Unit 2 corresponds to lithostratigraphic Unit II and represents the lower 44 m drilled in Hole U1526A, but it extends below the depth of drilling. The upper part of the unit is strongly reflective, comprising planar to irregular, discontinuous high-amplitude re-flections. Cores show that seismic Unit 2 comprises large, sub-rounded to subangular pebbles and boulders of variably altered to fresh basalt embedded in a heavily cemented coarse-grained volca-niclastic matrix.
Observatory installationsBorehole observatories were installed at Sites U1518 and U1519.
The observatory at Site U1518 (penetrating an active thrust fault) includes three levels of pore pressure monitoring, distributed tem-perature monitoring, a geochemical fluid flowmeter, and time-se-ries fluid sampling for geochemical analyses (Figure F4). The observatory at Site U1519 is similar in overall design (as described below) but includes only two pore pressure monitoring intervals and distributed temperature monitoring, with no fluid sampling (Figure F4). Pore pressure monitoring is conducted via hydraulic tubing that terminates in screens outside of casing, except in the fault zone interval at Site U1518, where the casing is perforated for geochemical sampling. The fluid sampling is conducted using sam-pling coils driven by osmotic pumps (Jannasch et al., 2004). Distrib-uted temperature monitoring is conducted using distributed autonomous temperature sensing data loggers suspended in the in-terior of the casing.
Both observatories consist of an outer 10¾ inch casing string with an ACORK head and a 4½ inch inner casing string with a CORK-II head emplaced inside the ACORK (Figure F4). For the fault site, Hole U1518G was predrilled to 433 mbsf, and the inten-tion was to lower 10¾ inch casing into the hole escorted by an underreamer and mud motor, with the ACORK head attached to the top of the casing. During reentry, however, unanticipated heave caused the bit to knock the reentry funnel away from Hole U1518G, requiring us to drill in the ACORK and casing at the new location of the funnel and mud skirt (Hole U1518H; drilled to 426 mbsf ). For the Site U1519 observatory, Hole U1519B was predrilled to 283 mbsf, and the 10¾ inch casing was lowered behind an underreamer and mud motor, with the ACORK head attached to the top of the casing. At both sites, an HRT was used to release the ACORK as-sembly after it was drilled in.
A flatpack umbilical containing three hydraulic lines (¼ inch di-ameter) was strapped to the outside of the 10¾ inch casing as it was assembled and run through the moonpool. These lines terminate in casing screens in the target monitoring intervals at depth (at the base of the screens) and are connected to valves and the pressure sensing unit at the ACORK head. Pressure monitoring at Site U1518 takes place in the hanging wall (217.7 mbsf), fault zone (332.1
mbsf), and footwall (393.2 mbsf ) of the thrust fault. Pressure moni-toring takes place in two intervals at Site U1519 (at 124 and 264 mbsf). After the ACORK was seated, the CORK-II was lowered into the inner bore of the 10¾ inch ACORK casing and latched into the ACORK head after lowering and landing the temperature and geo-chemical sampling instrument string into the CORK-II. A titanium landing seat for the OsmoSampler and OsmoFlowmeter is located inside the CORK-II at Site U1518.
To undertake temperature monitoring at Sites U1518 and U1519, temperature sensing data loggers were attached to a rope (7⁄16 inch Spectra line) with sinker bars at various depths to hold the rope taut (Figure F4). A total of 30 temperature sensing data loggers were installed at Site U1518, with dense spacing spanning the fault zone and coarser spacing in the hanging wall and footwall. The in-strument string at Site U1519 consists of 15 temperature sensing data loggers. Both instrument strings were lowered through the drill pipe into the inner bore of the 4½ inch casing and seated with a landing plug at the CORK-II head. The OsmoSamplers and Osmo-Flowmeter were lowered as part of the temperature string at Site U1518 (Figure F4) and were landed on the titanium seat inside the CORK-II casing that was positioned in the fault zone interval. Screened, perforated casing (7 m high) at the fault zone monitoring interval allows flow of formation fluids into the OsmoSamplers and OsmoFlowmeter.
Preliminary scientific assessmentAll of the primary objectives described above were successfully
achieved during Expedition 375:
• Installing two subseafloor observatories to monitor deformation and characterize changes in thermal, hydrological, and chemical state during multiple SSE cycles; and
• Coring at four sites to characterize the physical conditions and rock properties that underlie SSE occurrence.
Because of excellent weather and smooth operations, we were able to complete an ambitious slate of planned drilling activities, in-cluding wireline logging the lower portion of Site U1520. Together, Expeditions 372 and 375 implemented a complex, linked data shar-ing and sampling plan that spanned two expeditions, several shore-based investigators, and a high volume of sample requests for mis-sion-critical postexpedition studies of rock properties, composition, structures, and deformation. This plan was largely successful owing to the careful coordination of sample requests and sampling strate-gies during the several months prior to the two expeditions.
Observatory installationsBoth of the complex, nested observatory installations were com-
pleted successfully. Each of the installations required a carefully co-ordinated sequence of operations, including several reentries, running and releasing multiple nested casing strings in deep water, and rigging large instrument strings, lengthy rope, and several hun-dred meters of hydraulic umbilical (see Operations in Site U1518 and Operations in Site U1519). At Site U1518, the observatory in-cluded monitoring of fluid pressure at three separate intervals and fluid sampling in the interior of the casing via a complex hole com-pletion design (Figure F4). At Site U1519, the observatory design was somewhat simpler but also included multiple nested casing strings and installation of a 270 m instrument string. We attribute the overall success of both observatory installations to a combina-tion of extensive pre-expedition preparation and to a carefully
21

D.M. Saffer et al. Expedition 375 Preliminary Report
planned operations strategy for casing installation and instrument handling at the rig floor and moonpool. The design phase of the ob-servatories began in collaboration with Texas A&M University (USA) engineering staff in April 2015 (~35 months in advance of Expedition 375). This preparation time was enabled by funding of the observatory development well in advance of the expedition and was essential to design and fabricate the observatory systems and to develop the implementation strategy.
Observatory operations generally went smoothly and, in some cases, more quickly than anticipated (e.g., running casing while strapping umbilical took less time than allotted in initial time esti-mates). However, a few minor problems were encountered during deployment that may compromise the observatory integrity at each site. At Site U1518, unexpected heave during reentry in the pre-drilled hole (U1518G) caused the drill pipe to bump and displace the reentry cone. As a result, we had no viable option other than to drill in the ACORK system to its total depth of 423 mbsf at a new location (Hole U1518H) a few meters away from the previously drilled hole. Although it was fortunate that we were prepared to drill with a mud motor and underreamer, the proximity of a large open hole very near to the observatory installation raises the possi-bility of fluid sample contamination and compromised hydraulic isolation from the seafloor. Because the casing string was drilled in rather than lowered into a predrilled hole, it is also possible that the umbilical was damaged during installation and/or that the casing screens were fouled by circulation of a large volume of cuttings during drilling of the large diameter hole. An additional potential issue at Site U1518 arose because the ROV platform (deployed by free-fall) hung up on the top of the ACORK wellhead. For this rea-son, we elected not to install an ROV platform at Site U1519.
At Site U1519, postinstallation inspection of the ACORK and CORK-II wellheads by the subsea camera revealed that the reentry funnel had filled with cuttings that partly bury the ACORK bays and the lower portion of the pressure sensor package. Potential future replacement of the sensor package, which is designed to be modu-lar, may therefore require remediation or could prove impossible if the cuttings cannot be cleared. The inspection also revealed that one of the support fins on the CORK-II wellhead was slightly dam-aged, likely during release using the J-tool. In general, these issues were unavoidable. However, based on these experiences, modifica-tion of installation operations may warrant consideration, for exam-ple, (1) to minimize the risk of large cuttings loads filling the ACORK reentry funnel, (2) to more reliably release wellheads with-out requiring drill string rotation (e.g., by using a hydraulic release as was used for the ACORK), and (3) to redesign the ACORK well-head profile to minimize risk of ROV platform or other free-fall components becoming misaligned.
Coring and samplingAt all of our coring sites (U1518–U1520 and U1526), the pri-
mary drilling and sampling objectives were met. At Site U1518, the formation was highly overconsolidated at the seafloor, and as a re-sult we were unable to drill with the APC/XCB systems as deeply as planned and switched to RCB coring at a relatively shallow depth (<200 mbsf ) to drill across the thrust fault. At Site U1520 (Hole U1520C), we used a drill-in reentry system to case the upper por-tion of the sediment section; this system worked as planned and al-lowed us to reach our depth target in the volcaniclastic sequence. The original planned depth of the hole was 1200 mbsf, but the total depth was shallower because we had reached our main scientific ob-jective. At Site U1526, we initially elected to undertake RCB coring
in Hole U1526A because the primary target was the volcaniclastic and basaltic sequences of the seamount. However, sufficient time became available after completing operations at Site U1520 near the end of the expedition that we were able to return to Site U1526 to obtain a nearly complete section of the sedimentary sequence over-lying the seamount in Hole U1526B with APC coring. At Site U1519, a highly targeted coring strategy was undertaken to maxi-mize our efficiency with limited time. Here, we opted to spot core with the RCB system to collect material only from depths corre-sponding to the screened intervals of the observatory and in the lower part of the section where wellbore failures (breakouts) were observed in LWD data. A second APC/HLAPC hole targeted shal-low temperature measurements at Site U1519. This targeted ap-proach yielded the key data needed to meet expedition science objectives.
The suite of cores obtained at Sites U1520 and U1526 reveal a surprising diversity of lithologies entering the subduction zone, in-cluding clastic trench fill material, carbonate-rich pelagic sedi-ments, and a thick volcaniclastic sequence. Postexpedition research focused on the composition, diagenetic state, and physical proper-ties of these lithologies will reveal the role that they play in SSE oc-currence. Of particular interest are the extensive volcaniclastic deposits found in the lower portions of Sites U1520 and U1526; the alteration and diagenetic products of these materials may strongly influence the frictional properties and fluid content in the SSE source region. Tying the position of the lithologic sequences from Sites U1520 and U1526 into regional seismic data will provide im-portant insight into the dominant lithologies in the SSE source re-gion and their along-strike variations. Changes in pore water geochemistry observed throughout the section suggest evidence for recent fluid flow in lithologies recovered from the lower half of Site U1520. Fluid geochemistry also shows changes due to rapid sedi-mentation events in the upper, clastic portion of Site U1520.
At Site U1518, coring across an active shallow thrust fault pro-vided new insights into the fault architecture, small-scale structural features, physical properties, and pore fluid geochemistry of an ac-tive fault that may be involved in SSEs. Postexpedition investiga-tions will illuminate the hydrological and mechanical behavior of this active fault, particularly investigations related to fault structure and microstructures; analysis of pore fluid geochemistry variations across the fault; and laboratory studies of fault and wall rock fric-tion, strength, and hydrological properties. These studies will also strongly complement the insights gained from the observatory sam-ples and data (see above).
Drilling at Site U1519 aimed to characterize the upper plate physical and mechanical properties and thermal state. The ap-proach of targeted spot coring was successful in obtaining samples needed to robustly interpret observatory pressure and temperature data and to extract quantitative information about in situ stress state from wellbore breakouts deeper than ~590 mbsf. Temperature measurements in the APC hole were also successful and provide valuable constraints for models that will define the thermal struc-ture of the subduction zone and the temperature regime of the SSE source region.
Although the Expedition 375 priorities were focused on slow slip at subduction zones, we also recovered material that will give new insights into a range of other processes. Tephra layers, some-times as thick as 1.5 m, were encountered throughout Sites U1518–U1520. These layers provide a nearly complete and continuous re-cord of volcanic events at the Hikurangi subduction zone since the inception of subduction at the Hikurangi-Kermadec-Tonga Trench.
22
D.M. Saffer et al. Expedition 375 Preliminary Report
Postexpedition research on the tephra will reveal changes in the magnitude, frequency, and source of arc volcanism. Pre-expedition interpretation of seismic reflection images suggested that Site U1520 would intersect the distal portions of the ~3150 km3 Ruato-ria debris avalanche deposit (Collot et al., 2001). However, evidence of mass transport processes in cores recovered from this unit is equivocal; further investigation is needed to determine if Site U1520 did indeed intersect the Ruatoria debris avalanche deposit. If so, the cores may provide important insights into processes associated with the emplacement of this massive debris avalanche deposit. Dating of basaltic material and detailed biostratigraphic and sedimentological investigation of sedimentary sequences recovered from Site U1526 will yield improved constraints on Hikurangi Plateau development, including its vertical tectonic history.
OutreachDuring Expedition 375, we communicated the goals and prog-
ress of the expedition to students and the general public through live broadcasts, online social media, videos, animations, blogs on the JOIDES Resolution website, radio interviews, and media re-leases. The information in this section was contributed by Outreach Officers Aliki Weststrate and Thanos Fatouros.
Video conferencesWe interacted with the general public and school and university
students to share the scientific goals, expedition progress, and capa-bilities of the JOIDES Resolution. The 41 live events included tours of the ship and laboratories and time with scientists (Table T2). Of these events, 40% were with New Zealand schools or community organizations. Ages ranged from 5 to over 60.
Social mediaWe maintained four websites for the duration of the expedition.
There were a total of 199 posts with 21,494 people engaged on Face-book (58 posts), Twitter (59 posts), Instagram (36 posts), and the http://joidesresolution.org/expedition/375 blog (46 posts). In ad-dition, we produced 20 videos on topics such as the expedition sci-ence objectives, observatory deployment and animations, core measurements and sampling, micropaleontology, and core-log-seis-mic integration. All videos are available on the JOIDES ResolutionYouTube Expedition 375 playlist. We also hosted an “Ask Me Any-thing” 2 h live event on Reddit (https://doi.org/10.15200/winn .152310.09069).
MediaExpedition 375 received a significant amount of national and
global media attention, resulting in a total of 15 media items: 5 print articles, 2 television broadcasts, 3 radio interviews, and 5 web news stories (Table T3).
ReferencesAraki, E., Saffer, D.M, Kopf, A.J., Wallace, L.M., Kimura, T., Machida, Y., Ide,
S., Davis, E., and IODP Expedition 365 Shipboard Scientists, 2017. Recur-ring and triggered slow-slip events near the trench at the Nankai Trough subduction megathrust. Science, 356(6343):1157–1160. https://doi.org/10.1126/science.aan3120
Audet, P., Bostock, M.G., Christensen, N.I., and Peacock, S.M., 2009. Seismic evidence for overpressured subducted oceanic crust and megathrust fault sealing. Nature, 457(7225):76–78. https://doi.org/10.1038/nature07650
Baker E.T., Lavelle, J.W., Feely, R.A., Massoth, G.J., Walker, S.L., and Lupton, J.E., 1989. Episodic venting of hydrothermal fluids from the Juan de Fuca Ridge. Journal of Geophysical Research: Solid Earth, 94(B7):9237–9250. https://doi.org/10.1029/JB094iB07p09237
Barker, D.H.N., Sutherland, R., Henrys, S., and Bannister, S., 2009. Geometry of the Hikurangi subduction thrust and upper plate, North Island, New Zealand. Geochemistry, Geophysics, Geosystems, 10(2):Q02007. https://doi.org/10.1029/2008GC002153
Barnes, P.M., Ghisetti, F.C., Ellis, S., and Morgan, J.K., 2018. The role of proto-thrusts in frontal accretion and accommodation of plate convergence, Hikurangi subduction margin, New Zealand. Geosphere, 14(2):440–468. https://doi.org/10.1130/GES01552.1
Barnes, P.M., Lamarche, G., Bialas, J., Henrys, S., Pecher, I., Netzeband, G.L., Greinert, J., Mountjoy, J.J., Pedley, K., and Crutchley, G., 2010. Tectonic and geological framework for gas hydrates and cold seeps on the Hiku-rangi subduction margin, New Zealand. Marine Geology, 272(1–4):26–48. https://doi.org/10.1016/j.margeo.2009.03.012
Bell, R., Holden, C., Power, W., Wang, X., and Downes, G., 2014. Hikurangi margin tsunami earthquake generated by slow seismic rupture over a sub-ducted seamount. Earth and Planetary Science Letters, 397:1–9. https://doi.org/10.1016/j.epsl.2014.04.005
Bell, R., Sutherland, R., Barker, D.H.N., Henrys, S., Bannister, S., Wallace, L., and Beavan, J., 2010. Seismic reflection character of the Hikurangi sub-duction interface, New Zealand, in the region of repeated Gisborne slow slip events. Geophysical Journal International, 180(1):34–48. https//doi.org/10.1111/j.1365-246X.2009.04401.x
Byrne, T.B., Lin, W., Tsutsumi, A., Yamamoto, Y., Lewis, J.C., Kanagawa, K., Kitamura, Y., Yamaguchi, A., and Kimura, G., 2009. Anelastic strain recovery reveals extension across SW Japan subduction zone. Geophysi-cal Research Letters, 36(23):L23310. https://doi.org/10.1029/2009GL040749
Chang, C., McNeill, L.C., Moore, J.C., Lin, W., Conin, M., and Yamada, Y., 2010. In situ stress state in the Nankai accretionary wedge estimated from borehole wall failures. Geochemistry, Geophysics, Geosystems, 11:Q0AD04. https://doi.org/10.1029/2010GC003261
Collot, J.-Y., Lewis, K., Lamarache, G., and Lallemand, S., 2001. The giant Rua-toria debris avalanche on the northern Hikurangi margin, New Zealand; result of oblique seamount subduction. Journal of Geophysical Research: Solid Earth, 106(B9):19271–19297. https://doi.org/10.1029/2001JB900004
Davis, E., Becker, K., Dziak, R., Cassidy, J., Wang, K., and Lilley, M., 2004. Hydrological response to a seafloor spreading episode on the Juan de Fuca Ridge. Nature, 430(6997):335–338. https://doi.org/10.1038/nature02755
Davis, E., Becker, K., Wang, K., and Kinoshita, M., 2009. Co-seismic and post-seismic pore-fluid pressure changes in the Philippine Sea plate and Nankai decollement in response to a seismogenic strain event off Kii Pen-insula, Japan. Earth, Planets Space, 61(6):649–657. http://www.terra-pub.co.jp/journals/EPS/abstract/6106/61060649.html
Davis, E., Heesemann, M., and Wang, K., 2011. Evidence for episodic aseismic slip across the subduction seismogenic zone off Costa Rica: CORK bore-hole pressure observations at the subduction prism toe. Earth and Plane-tary Science Letters, 306(3–4):299–305. https://doi.org/10.1016/j.epsl.2011.04.017
Davy, B., Hoernle, K., and Werner, R., 2008. Hikurangi Plateau: crustal struc-ture, rifted formation, and Gondwana subduction history. Geochemistry, Geophysics, Geosystems, 9(7):Q07004. https://doi.org/10.1029/2007GC001855
Fisher, A.T., and Wheat, C.G., 2010. Seamounts as conduits for massive fluid, heat, and solute fluxes on ridge flanks. Oceanography, 23(1):74–87. http://www.tos.org/oceanography/issues/issue_ar-chive/issue_pdfs/23_1/23-1_fisher.pdf
Ghisetti, F.C., Barnes, P.M., Ellis, S., Plaza-Faverola, A.A., and Barker, D.H.N., 2016. The last 2 Myr of accretionary wedge construction in the central Hikurangi margin (North Island, New Zealand): insights from structural modeling. Geochemistry, Geophysics, Geosystems, 17(7):2661–2686. https://doi.org/10.1002/2016GC006341
23
D.M. Saffer et al. Expedition 375 Preliminary Report
Hammerschmidt, S., Davis, E.E., and Kopf, A., 2013. Fluid pressure and tem-perature transients detected at the Nankai Trough megasplay fault: results from the SmartPlug borehole observatory. Tectonophysics, 600:116–133. https://doi.org/10.1016/j.tecto.2013.02.010
Harris, R., Wallace, L., Webb, S., Ito, Y., Mochizuki, K., Ichihara, H., Henrys, S., et al., 2016. Investigations of shallow slow slip offshore of New Zea-land. Eos, 9. https://doi.org/10.1029/2016EO048945
Hensen, C., Wallmann, K., Schmidt, M., Ranero, C.R., and Suess, E., 2004. Fluid expulsion related to mud extrusion off Costa Rica—a window to the subducting slab. Geology, 32(3):201–204. https://doi.org/10.1130/G20119.1
Huffman, K.A., and Saffer, D.M., 2016. In situ stress magnitudes at the toe of the Nankai Trough Accretionary Prism, offshore Shikoku Island, Japan. Journal of Geophysical Research: Solid Earth, 121(2):1202–1217. https://doi.org/10.1002/2015JB012415
Jannasch, H.W., Davis, E.E., Kastner, M., Morris, J.D., Pettigrew, T.L., Plant, J.N., Solomon, E.A., Villinger, H.W., and Wheat, C.G., 2003. CORK-II: long-term monitoring of fluid chemistry, fluxes, and hydrology in instru-mented boreholes at the Costa Rica subduction zone. In Morris, J.D., Vil-linger, H.W., Klaus, A., Proceedings of the Ocean Drilling Program, Initial Reports, 205: College Station, TX (Ocean Drilling Program), 1–36. http://dx.doi.org/10.2973/odp.proc.ir.205.102.2003
Jannasch, H.W., Wheat, C.G., Plant, J.N., Kastner, M., and Stakes, D.S., 2004. Continuous chemical monitoring with osmotically pumped water sam-plers: OsmoSampler design and applications. Limnology and Oceanogra-phy: Methods, 2(2):102–113. https://doi.org/10.4319/lom.2004.2.102
Kinoshita, C., Saffer, D., Kopf, A., Roesner, A., Wallace, L.M., Araki, E., Kimura, T., et al., 2018. Changes in physical properties of the Nankai Trough Megasplay Fault induced by earthquakes, detected by continuous pressure monitoring. Journal of Geophysical Research: Solid Earth, 123(2):1072–1088. https://doi.org/10.1002/2017JB014924
Kodaira, S., Iidaka, T., Kato, A., Park, J.-O., Iwasaki, T., and Kaneda, Y., 2004. High pore fluid pressure may cause silent slip in the Nankai Trough. Sci-ence, 304(5675):1295–1298. https://doi.org/10.1126/science.1096535
Kopf, A., Mora, G., Deyhle, A., Frape, S., and Hesse, R., 2003. Fluid geochem-istry in the Japan Trench forearc (ODP Leg 186): a synthesis. In Suyehiro, K., Sacks, I.S., Acton, G.D., and Oda, M. (Eds.), Proceedings of the Ocean Drilling Program, Scientific Results, 186: College Station, TX (Ocean Drilling Program), 1–23. https://doi.org/10.2973/odp.proc.sr.186.117.2003
Leeman, J.R., Safffer, D.M., Scuderi, M.M., and Marone, C., 2016. Laboratory observations of slow earthquakes and the spectrum of tectonic fault slip modes. Nature Communications, 7:11104. https://doi.org/10.1038/ncomms11104
Lewis, K.B., Collot, J.-Y., and Lallemand, S.E., 1998. The dammed Hikurangi Trough: a channel-fed trench blocked by subducting seamounts and their wake avalanches (New Zealand–France GeodyNZ Project). Basin Research, 10(4):441–468. https://doi.org/10.1046/j.1365-2117.1998.00080.x
Lin, W., Conin, M., Moore, J.C., Chester, F.M., Nakamura, Y., Mori, J.J., Ander-son, L., Brodsky, E.E., Eguchi, N., and Expedition 343 Scientists, 2013. Stress state in the largest displacement area of the 2011 Tohoku-Oki Earthquake. Science, 339(6120):687–690. http://dx.doi.org/10.1126/science.1229379
Liu, Y., and Rice, J.R., 2007. Spontaneous and triggered aseismic deformation transients in a subduction fault model. Journal of Geophysical Research: Solid Earth, 112(B9):B09404. https://doi.org/10.1029/2007JB004930
Moos, D., and Zoback, M.D., 1990. Utilization of observations of well bore failure to constrain the orientation and magnitude of crustal stresses: application to continental, Deep Sea Drilling Project, and Ocean Drilling Program boreholes. Journal of Geophysical Research: Solid Earth, 95(B6):9305–9325. https://doi.org/10.1029/JB095iB06p09305
Peacock, S.M., 2009. Thermal and metamorphic environment of subduction zone episodic tremor and slip. Journal of Geophysical Research: Solid Earth, 114(B8):B00A07. https://doi.org/10.1029/2008JB005978
Pecher, I.A., Barnes, P.M., LeVay, L.J., and the Expedition 372 Scientists, 2018. Expedition 372 Preliminary Report: Creeping Gas Hydrate Slides and
Hikurangi LWD. International Ocean Discovery Program. https://doi.org/10.14379/iodp.pr.372.2018
Pedley, K.L., Barnes, P.M., Pettinga, J.R., and Lewis, K.B., 2010. Seafloor struc-tural geomorphic evolution of the accretionary frontal wedge in response to seamount subduction, Poverty Indentation, New Zealand. Marine Geology, 270(1–4):119–138. https://doi.org/10.1016/j.margeo.2009.11.006
Peng, Z., and Gomberg, J., 2010. An integrated perspective of the continuum between earthquakes and slow-slip phenomena. Nature Geoscience, 3(9):599–607. https://doi.org/10.1038/ngeo940
Plaza-Faverola, A., Klaeschen, D., Barnes, P., Pecher, I., Henrys, S., and Mountjoy, J., 2012. Evolution of fluid expulsion and concentrated hydrate zones across the southern Hikurangi subduction margin, New Zealand: an analysis from depth migrated seismic data. Geochemistry, Geophysics, Geosystems, 13(8):Q08019. https://doi.org/10.1029/2012GC004228
Ranero, C.R., Grevemeyer, I., Sahling, U., Barckhausen, U., Hensen, C., Wall-mann, K., Weinrebe, W., Vannucchi, P., von Huene, R., and McIntosh, K., 2008. Hydrogeological system of erosional convergent margins and its influence on tectonics and interplate seismogenesis. Geochemistry, Geo-physics, Geosystems, 9(3):Q03S04. https://doi.org/10.1029/2007GC001679
Rubinstein, J.L., Shelly, D.R., and Ellsworth, W.L., 2010. Non-volcanic tremor: a window into the roots of fault zones. In Cloetingh, S., and Negendank, J. (Eds.), New Frontiers in Integrated Solid Earth Sciences: Dordrecht, The Netherlands (Springer), 287–314. https://doi.org/10.1007/978-90-481-2737-5_8
Saffer, D.M., Underwood, M.B., and McKiernan, A.W., 2008. Evaluation of factors controlling smectite transformation and fluid production in sub-duction zones: application to the Nankai Trough. Island Arc, 17(2):208–230. https://doi.org/10.1111/j.1440-1738.2008.00614.x
Saffer, D.M., and Wallace, L.M., 2015. The frictional, hydrologic, metamor-phic and thermal habitat of shallow slow earthquakes. Nature Geoscience, 8(8):594–600. https://doi.org/10.1038/ngeo2490
Sawyer, A.H., Flemings, P., Elsworth, D., and Kinoshita, M., 2008. Response of submarine hydrologic monitoring instruments to formation pressure changes: theory and application to Nankai advanced CORKs. Journal of Geophysical Research: Solid Earth, 113(B1):B01102. https://doi.org/10.1029/2007JB005132
Schwartz, S.Y., and Rokosky, J.M., 2007. Slow slip events and seismic tremor at circum-Pacific subduction zones. Reviews of Geophysics, 45(3):RG3004. https://doi.org/10.1029/2006RG000208
Solomon, E.A., and Kastner, M., 2012. Progressive barite dissolution in the Costa Rica forearc—implications for global fluxes of Ba to the volcanic arc and mantle. Geochimica et Cosmochimica Acta, 83:110–124. https://doi.org/10.1016/j.gca.2011.12.021
Solomon, E.A., Kastner, M., Wheat, C.G., Jannasch, H., Robertson, G., Davis, E.E., and Morris, J.D., 2009. Long-term hydrogeochemical records in the oceanic basement and forearc prism at the Costa Rica subduction zone. Earth and Planetary Science Letters, 282(1–4):240–251. https://doi.org/10.1016/j.epsl.2009.03.022
Song, T.-R.A., Helmberger, D.V., Brudzinski, M.R., Clayton, R.W., Davis, P., Pérez-Campos, X., and Singh, S.K., 2009. Subducting slab ultra-slow velocity layer coincident with silent earthquakes in southern Mexico. Sci-ence, 324(5926):502–506. https://doi.org/10.1126/science.1167595
Tobin, H.J., and Saffer, D.M., 2009. Elevated fluid pressure and extreme mechanical weakness of a plate boundary thrust, Nankai Trough sub-duction zone. Geology, 37(8):679–682. https://doi.org/10.1130/G25752A.1
Vannucchi, P., Ujiie, K., Stroncik, N., and the IODP Expedition 334 Science Party, 2013. IODP Expedition 334: an investigation of the sedimentary record, fluid flow and state of stress on top of the seismogenic zone of an erosive subduction margin. Scientific Drilling, 15:23–30. https://doi.org/10.2204/iodp.sd.15.03.2013
Wallace, L.M., Kaneko, Y., Hreinsdóttir, S., Hamling, I., Peng, Z., Bartlow, N., D’Anastasio, E., and Fry, B., 2017. Large-scale dynamic triggering of shal-low slow slip enhanced by overlying sedimentary wedge. Nature Geosci-ence, 10(10):765–770. https://doi.org/10.1038/ngeo3021
24

D.M. Saffer et al. Expedition 375 Preliminary Report
Wallace, L.M., and Beavan, J., 2010. Diverse slow slip behavior at the Hiku-rangi subduction margin, New Zealand. Journal of Geophysical Research: Solid Earth, 115(B12):B12402. https://doi.org/10.1029/2010JB007717
Wallace, L.M., Beavan, J., McCaffrey, R., and Darby, D., 2004. Subduction zone coupling and tectonic block rotations in the North Island, New Zea-land. Journal of Geophysical Research: Solid Earth, 109(B12):B12406. https://doi.org/10.1029/2004JB003241
Wallace, L.M., Webb, S.C., Ito, Y., Mochizuki, K., Hino, R., Henrys, S., Schwartz, S.Y., and Sheehan, A.F., 2016. Slow slip near the trench at the Hikurangi subduction zone, New Zealand. Science, 352(6286):701–704. https://doi.org/10.1126/science.aaf2349
Wang, K., 2004. Applying fundamental principles and mathematical models to understand processes and estimate parameters. In Davis, E.E., and Elderfield, H. (Eds.), Hydrogeology of the Oceanic Lithosphere: Cambridge, United Kingdom (Cambridge University Press), 376–413.
Wang, K., and Davis, E.E., 1996. Theory for the propagation of tidally induced pore pressure variations in layered subseafloor formations. Journal of Geophysical Research: Solid Earth, 101(B5):11483–11495. https://doi.org/10.1029/96JB00641
Wech, A.G., and Creager, K.C., 2011. A continuum of stress, strength and slip in the Cascadia subduction zone. Nature Geoscience, 4(9):624–628. https://doi.org/10.1038/ngeo1215
Williams, C.A., and Wallace, L.M., 2015. Effects of material property varia-tions on slip estimates for subduction interface slow-slip events. Geophys-ical Research Letters, 42(4):1113–1121. https://doi.org/10.1002/2014GL062505
Zoback, M.D., Hickman, S., and Ellsworth, W., 2007. The role of fault zone drilling. In Kanamori, H., and Schubert, G. (Eds.), Treatise on Geophysics (Volume 4): Earthquake Seismology: Amsterdam (Elsevier), 649–674. https://doi.org/10.1016/B978-044452748-6/00084-5
25
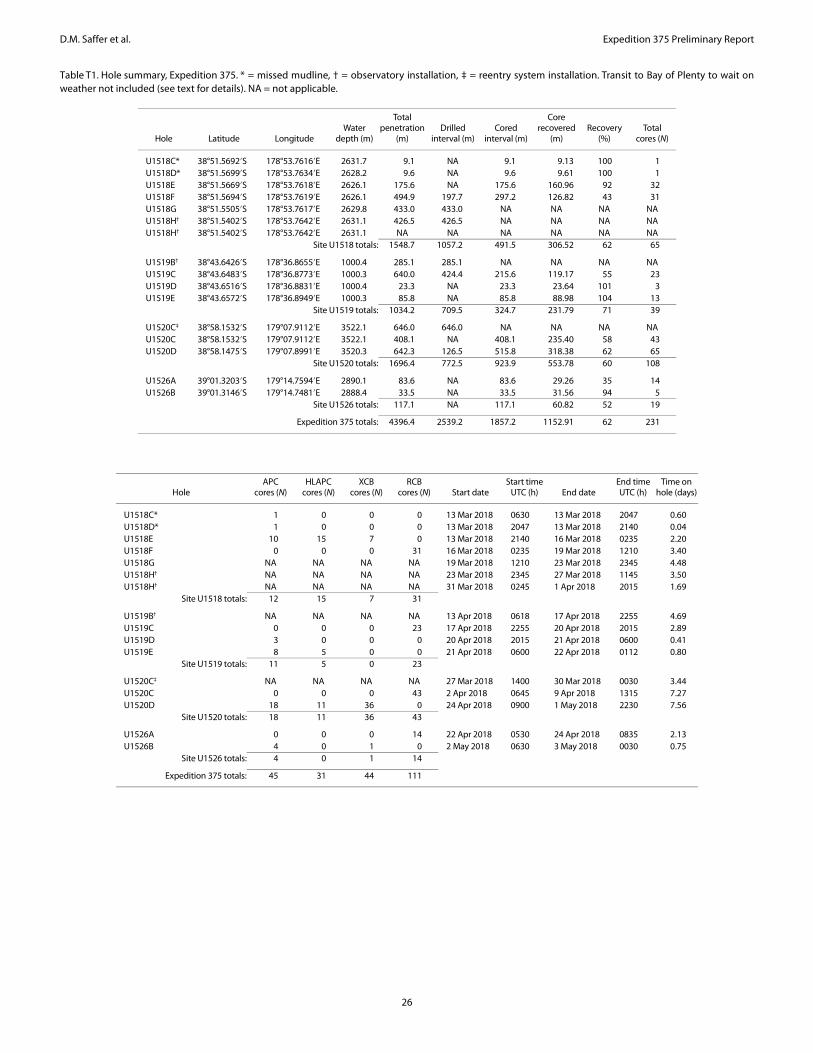
D.M. Saffer et al. Expedition 375 Preliminary Report
Table T1. Hole summary, Expedition 375. * = missed mudline, † = observatory installation, ‡ = reentry system installation. Transit to Bay of Plenty to wait onweather not included (see text for details). NA = not applicable.
Hole Latitude LongitudeWater
depth (m)
Totalpenetration
(m)Drilled
interval (m)Cored
interval (m)
Corerecovered
(m)Recovery
(%)Total
cores (N)
U1518C* 38°51.5692′S 178°53.7616′E 2631.7 9.1 NA 9.1 9.13 100 1U1518D* 38°51.5699′S 178°53.7634′E 2628.2 9.6 NA 9.6 9.61 100 1U1518E 38°51.5669′S 178°53.7618′E 2626.1 175.6 NA 175.6 160.96 92 32U1518F 38°51.5694′S 178°53.7619′E 2626.1 494.9 197.7 297.2 126.82 43 31U1518G 38°51.5505′S 178°53.7617′E 2629.8 433.0 433.0 NA NA NA NAU1518H† 38°51.5402′S 178°53.7642′E 2631.1 426.5 426.5 NA NA NA NAU1518H† 38°51.5402′S 178°53.7642′E 2631.1 NA NA NA NA NA NA
Site U1518 totals: 1548.7 1057.2 491.5 306.52 62 65
U1519B† 38°43.6426′S 178°36.8655′E 1000.4 285.1 285.1 NA NA NA NAU1519C 38°43.6483′S 178°36.8773′E 1000.3 640.0 424.4 215.6 119.17 55 23U1519D 38°43.6516′S 178°36.8831′E 1000.4 23.3 NA 23.3 23.64 101 3U1519E 38°43.6572′S 178°36.8949′E 1000.3 85.8 NA 85.8 88.98 104 13
Site U1519 totals: 1034.2 709.5 324.7 231.79 71 39
U1520C‡ 38°58.1532′S 179°07.9112′E 3522.1 646.0 646.0 NA NA NA NAU1520C 38°58.1532′S 179°07.9112′E 3522.1 408.1 NA 408.1 235.40 58 43U1520D 38°58.1475′S 179°07.8991′E 3520.3 642.3 126.5 515.8 318.38 62 65
Site U1520 totals: 1696.4 772.5 923.9 553.78 60 108
U1526A 39°01.3203′S 179°14.7594′E 2890.1 83.6 NA 83.6 29.26 35 14U1526B 39°01.3146′S 179°14.7481′E 2888.4 33.5 NA 33.5 31.56 94 5
Site U1526 totals: 117.1 NA 117.1 60.82 52 19
Expedition 375 totals: 4396.4 2539.2 1857.2 1152.91 62 231
HoleAPC
cores (N)HLAPC
cores (N)XCB
cores (N)RCB
cores (N) Start dateStart time
UTC (h) End dateEnd timeUTC (h)
Time on hole (days)
U1518C* 1 0 0 0 13 Mar 2018 0630 13 Mar 2018 2047 0.60U1518D* 1 0 0 0 13 Mar 2018 2047 13 Mar 2018 2140 0.04U1518E 10 15 7 0 13 Mar 2018 2140 16 Mar 2018 0235 2.20U1518F 0 0 0 31 16 Mar 2018 0235 19 Mar 2018 1210 3.40U1518G NA NA NA NA 19 Mar 2018 1210 23 Mar 2018 2345 4.48U1518H† NA NA NA NA 23 Mar 2018 2345 27 Mar 2018 1145 3.50U1518H† NA NA NA NA 31 Mar 2018 0245 1 Apr 2018 2015 1.69
Site U1518 totals: 12 15 7 31
U1519B† NA NA NA NA 13 Apr 2018 0618 17 Apr 2018 2255 4.69U1519C 0 0 0 23 17 Apr 2018 2255 20 Apr 2018 2015 2.89U1519D 3 0 0 0 20 Apr 2018 2015 21 Apr 2018 0600 0.41U1519E 8 5 0 0 21 Apr 2018 0600 22 Apr 2018 0112 0.80
Site U1519 totals: 11 5 0 23
U1520C‡ NA NA NA NA 27 Mar 2018 1400 30 Mar 2018 0030 3.44U1520C 0 0 0 43 2 Apr 2018 0645 9 Apr 2018 1315 7.27U1520D 18 11 36 0 24 Apr 2018 0900 1 May 2018 2230 7.56
Site U1520 totals: 18 11 36 43
U1526A 0 0 0 14 22 Apr 2018 0530 24 Apr 2018 0835 2.13U1526B 4 0 1 0 2 May 2018 0630 3 May 2018 0030 0.75
Site U1526 totals: 4 0 1 14
Expedition 375 totals: 45 31 44 111
26
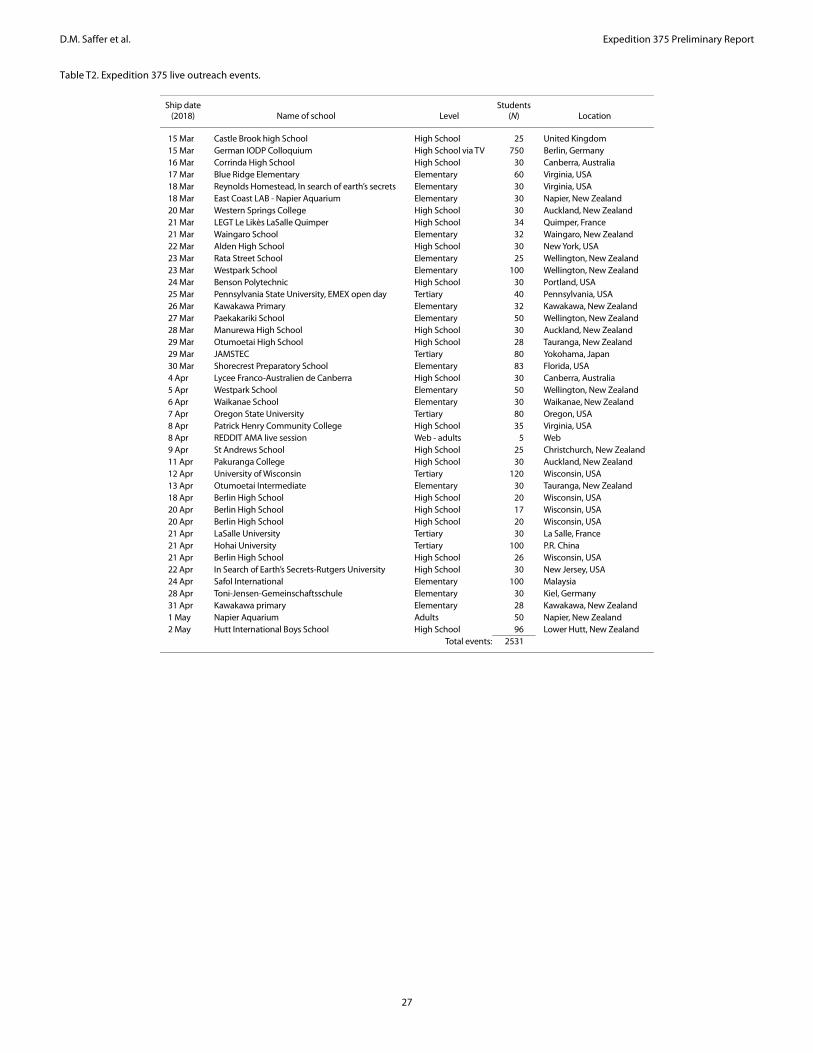
D.M. Saffer et al. Expedition 375 Preliminary Report
Table T2. Expedition 375 live outreach events.
Ship date(2018) Name of school Level
Students (N) Location
15 Mar Castle Brook high School High School 25 United Kingdom15 Mar German IODP Colloquium High School via TV 750 Berlin, Germany16 Mar Corrinda High School High School 30 Canberra, Australia17 Mar Blue Ridge Elementary Elementary 60 Virginia, USA18 Mar Reynolds Homestead, In search of earth’s secrets Elementary 30 Virginia, USA18 Mar East Coast LAB - Napier Aquarium Elementary 30 Napier, New Zealand20 Mar Western Springs College High School 30 Auckland, New Zealand21 Mar LEGT Le Likès LaSalle Quimper High School 34 Quimper, France21 Mar Waingaro School Elementary 32 Waingaro, New Zealand22 Mar Alden High School High School 30 New York, USA23 Mar Rata Street School Elementary 25 Wellington, New Zealand23 Mar Westpark School Elementary 100 Wellington, New Zealand24 Mar Benson Polytechnic High School 30 Portland, USA25 Mar Pennsylvania State University, EMEX open day Tertiary 40 Pennsylvania, USA26 Mar Kawakawa Primary Elementary 32 Kawakawa, New Zealand27 Mar Paekakariki School Elementary 50 Wellington, New Zealand28 Mar Manurewa High School High School 30 Auckland, New Zealand29 Mar Otumoetai High School High School 28 Tauranga, New Zealand29 Mar JAMSTEC Tertiary 80 Yokohama, Japan30 Mar Shorecrest Preparatory School Elementary 83 Florida, USA4 Apr Lycee Franco-Australien de Canberra High School 30 Canberra, Australia5 Apr Westpark School Elementary 50 Wellington, New Zealand6 Apr Waikanae School Elementary 30 Waikanae, New Zealand7 Apr Oregon State University Tertiary 80 Oregon, USA8 Apr Patrick Henry Community College High School 35 Virginia, USA8 Apr REDDIT AMA live session Web - adults 5 Web9 Apr St Andrews School High School 25 Christchurch, New Zealand11 Apr Pakuranga College High School 30 Auckland, New Zealand12 Apr University of Wisconsin Tertiary 120 Wisconsin, USA13 Apr Otumoetai Intermediate Elementary 30 Tauranga, New Zealand18 Apr Berlin High School High School 20 Wisconsin, USA20 Apr Berlin High School High School 17 Wisconsin, USA20 Apr Berlin High School High School 20 Wisconsin, USA21 Apr LaSalle University Tertiary 30 La Salle, France21 Apr Hohai University Tertiary 100 P.R. China21 Apr Berlin High School High School 26 Wisconsin, USA22 Apr In Search of Earth’s Secrets-Rutgers University High School 30 New Jersey, USA24 Apr Safol International Elementary 100 Malaysia28 Apr Toni-Jensen-Gemeinschaftsschule Elementary 30 Kiel, Germany31 Apr Kawakawa primary Elementary 28 Kawakawa, New Zealand1 May Napier Aquarium Adults 50 Napier, New Zealand2 May Hutt International Boys School High School 96 Lower Hutt, New Zealand Total events: 2531
27
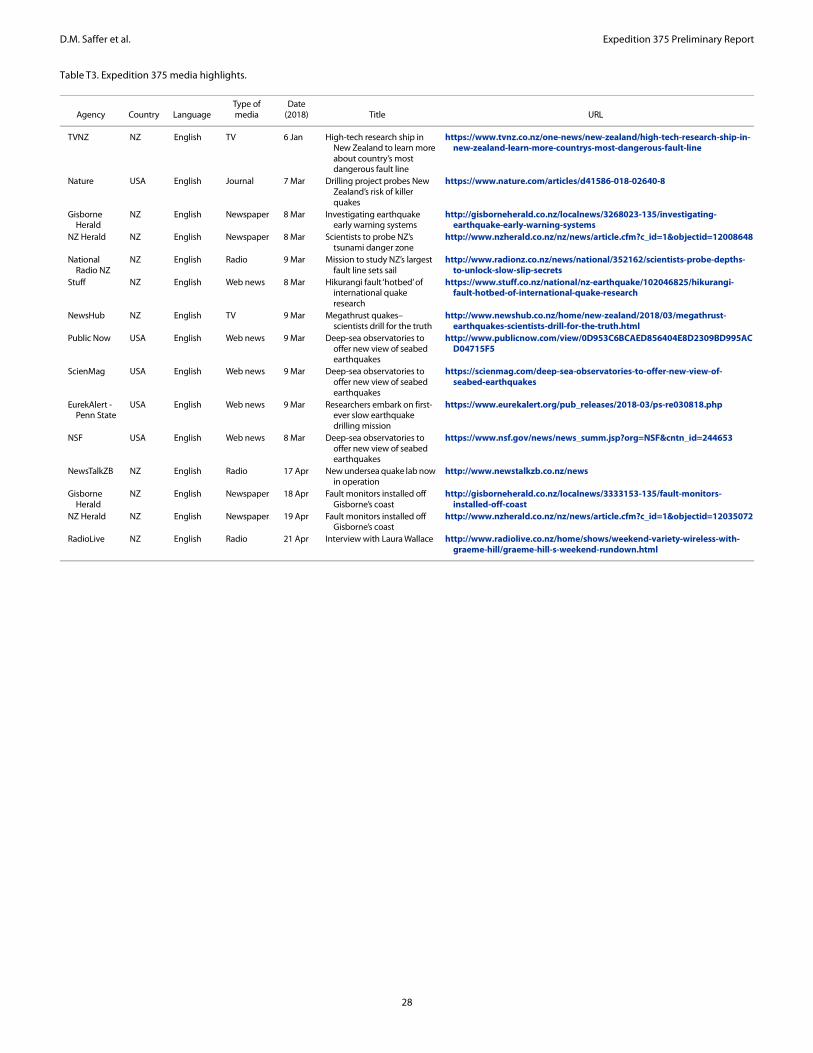
D.M. Saffer et al. Expedition 375 Preliminary Report
Table T3. Expedition 375 media highlights.
Agency Country LanguageType ofmedia
Date(2018) Title URL
TVNZ NZ English TV 6 Jan High-tech research ship in New Zealand to learn more about country’s most dangerous fault line
https://www.tvnz.co.nz/one-news/new-zealand/high-tech-research-ship-in-new-zealand-learn-more-countrys-most-dangerous-fault-line
Nature USA English Journal 7 Mar Drilling project probes New Zealand’s risk of killer quakes
https://www.nature.com/articles/d41586-018-02640-8
Gisborne Herald
NZ English Newspaper 8 Mar Investigating earthquake early warning systems
http://gisborneherald.co.nz/localnews/3268023-135/investigating-earthquake-early-warning-systems
NZ Herald NZ English Newspaper 8 Mar Scientists to probe NZ’s tsunami danger zone
http://www.nzherald.co.nz/nz/news/article.cfm?c_id=1&objectid=12008648
National Radio NZ
NZ English Radio 9 Mar Mission to study NZ’s largest fault line sets sail
http://www.radionz.co.nz/news/national/352162/scientists-probe-depths-to-unlock-slow-slip-secrets
Stuff NZ English Web news 8 Mar Hikurangi fault ‘hotbed’ of international quake research
https://www.stuff.co.nz/national/nz-earthquake/102046825/hikurangi-fault-hotbed-of-international-quake-research
NewsHub NZ English TV 9 Mar Megathrust quakes–scientists drill for the truth
http://www.newshub.co.nz/home/new-zealand/2018/03/megathrust-earthquakes-scientists-drill-for-the-truth.html
Public Now USA English Web news 9 Mar Deep-sea observatories to offer new view of seabed earthquakes
http://www.publicnow.com/view/0D953C6BCAED856404E8D2309BD995ACD04715F5
ScienMag USA English Web news 9 Mar Deep-sea observatories to offer new view of seabed earthquakes
https://scienmag.com/deep-sea-observatories-to-offer-new-view-of-seabed-earthquakes
EurekAlert -Penn State
USA English Web news 9 Mar Researchers embark on first-ever slow earthquake drilling mission
https://www.eurekalert.org/pub_releases/2018-03/ps-re030818.php
NSF USA English Web news 8 Mar Deep-sea observatories to offer new view of seabed earthquakes
https://www.nsf.gov/news/news_summ.jsp?org=NSF&cntn_id=244653
NewsTalkZB NZ English Radio 17 Apr New undersea quake lab now in operation
http://www.newstalkzb.co.nz/news
Gisborne Herald
NZ English Newspaper 18 Apr Fault monitors installed off Gisborne’s coast
http://gisborneherald.co.nz/localnews/3333153-135/fault-monitors-installed-off-coast
NZ Herald NZ English Newspaper 19 Apr Fault monitors installed off Gisborne’s coast
http://www.nzherald.co.nz/nz/news/article.cfm?c_id=1&objectid=12035072
RadioLive NZ English Radio 21 Apr Interview with Laura Wallace http://www.radiolive.co.nz/home/shows/weekend-variety-wireless-with-graeme-hill/graeme-hill-s-weekend-rundown.html
28
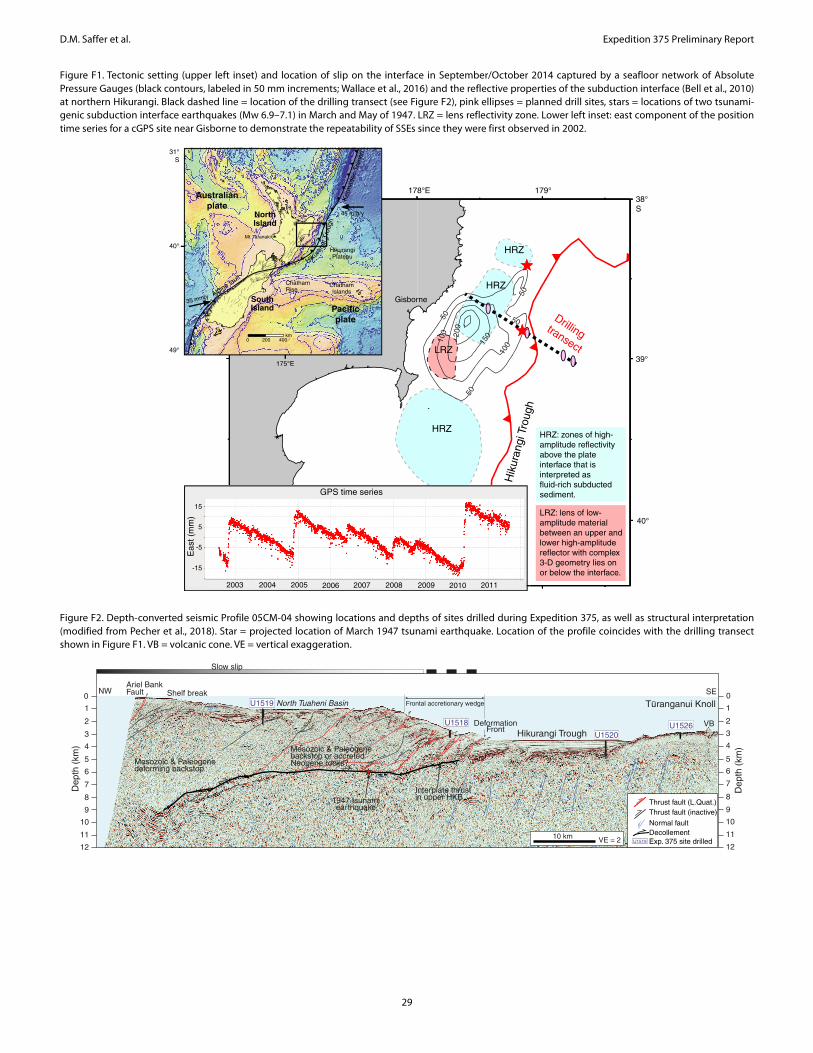
D.M. Saffer et al. Expedition 375 Preliminary Report
Figure F1. Tectonic setting (upper left inset) and location of slip on the interface in September/October 2014 captured by a seafloor network of Absolute Pressure Gauges (black contours, labeled in 50 mm increments; Wallace et al., 2016) and the reflective properties of the subduction interface (Bell et al., 2010) at northern Hikurangi. Black dashed line = location of the drilling transect (see Figure F2), pink ellipses = planned drill sites, stars = locations of two tsunami-genic subduction interface earthquakes (Mw 6.9–7.1) in March and May of 1947. LRZ = lens reflectivity zone. Lower left inset: east component of the position time series for a cGPS site near Gisborne to demonstrate the repeatability of SSEs since they were first observed in 2002.
Figure F2. Depth-converted seismic Profile 05CM-04 showing locations and depths of sites drilled during Expedition 375, as well as structural interpretation (modified from Pecher et al., 2018). Star = projected location of March 1947 tsunami earthquake. Location of the profile coincides with the drilling transect shown in Figure F1. VB = volcanic cone. VE = vertical exaggeration.
178°E 179°
39°
38°
S
40°
HRZ
.
.
LRZ
HRZ
HRZ
Hik
ura
ngi T
rough
Jan/Feb
2010 SSE
North Island
Drilling transect
50
50
50
50
100
100
1502
00
HRZ: zones of high-
amplitude reflectivity
above the plate
interface that is
interpreted as
fluid-rich subducted
sediment.
LRZ: lens of low-
amplitude material
between an upper and
lower high-amplitude
reflector with complex
3-D geometry lies on
or below the interface.
2003 2004 2005 2006 2007 2008 2009 2010 2011
GPS time series
East (m
m)
-15
15
-5
5
Gisborne
3 1 S
4 0 SMt. Taranaki
175°E
40°
49°
31°
S
Kerm
adec
Tre
nch
Alpine fault
SouthIsland
NorthIsland
Australianplate
Pacificplate
Hiku
rangi T
rough
HikurangiPlateau
ChathamIslands
ChathamRise
45 mm/y
35 mm/y
400200km
0
0
1
2
3
4
5
6
7
8
9
10
11
12
De
pth
(km
)
0
1
2
3
4
5
6
7
8
9
10
11
12
De
pth
(km
)
Mesozoic & Paleogenedeforming backstop
Mesozoic & Paleogenebackstop or accreted Neogene rocks?
NW Shelf break
Interplate thrustin upper HKB
SE
DeformationFront
Hikurangi Trough
Frontal accretionary wedge
Ariel BankFault
1947 tsunamiearthquake
Tūranganui Knoll
VB
North Tuaheni Basin
Thrust fault (L.Quat.)
U1519 Exp. 375 site drilled
Normal fault
Decollement
Thrust fault (inactive)
Slow slip
10 kmVE = 2
U1520
U1518
U1519
U1526
29

D.M. Saffer et al. Expedition 375 Preliminary Report
Figure F3. Bathymetry and location of seismic Line 05CM-04 (black line) (Figure F2) in the region of Expedition 375. Dots = Expedition 375 sites.
Figure F4. Observatory configurations, Sites U1518 and U1519.
1000 2000
3000
179°20'0"179°0'0"178°40'0"178°20'0"E
0 4 8 12 16 202km
U1520
U1526
38°40'0"S
39°0'0"
N
U1519
U1518
HikurangiTrough
Tūranganui Knoll (formerly Gisborne Knoll)
U1519
Open hole
Hydraulic bridge plug
274-277 mbsf
Casing screen
122.7-124.7 mbsf
Mud skirt
ACORK head:
– Pressure data logger and valves– ROV handles
Free-fall funnel
Reentry cone
T
T
T
T
T
T
T
T
T
T
T
T
T
T
T
Casing screen
262.6-264.6 mbsf
Autonomous temperature sensorssuspended on spectra line
4-1/2 inch CORK-II casing
CORK-II wellhead:
– Top plug for T-sensor string
Seafloor
TT
TTTTT
T
F
TTTTTTT
TTTTTTTTT
TT
ACORK head:
– Pressure data logger and valves– ROV handles
Free-fall funnel
Reentry cone
CORK-II wellhead:
– Top plug for T-sensor string
Seafloor
U1518
Casing screen
319.6-326.6 mbsf;perforated casing
OsmoSampler and OsmoFlowmeter
10-3/4 inch ACORK casing
Hydraulic umbilical (3 lines)Autonomous temperature sensors
suspended on spectra line
Open hole
Hydraulic bridge plug
418-421 mbsf
Casing screen
216.7-218.7 mbsf
Casing screen
392.2-394.2 mbsf
Hydraulic umbilical (3 lines)
10-3/4 inch ACORK casing
4-1/2 inch CORK-II casing
Fault zone
~320 mbsf
Swellable packer
311.7 mbsf
Swellable packer
334.5 mbsf
Mud skirt
30

D.M. Saffer et al. Expedition 375 Preliminary Report
Figure F5. Observatory components from ACORK and CORK-II installations. A. ACORK wellhead with bay containing valves facing forward, Hole U1518H. B. Attachment of hydraulic umbilical to ACORK casing in the moonpool, Hole U1518H. C. Hydraulic line connections at the base of an ACORK casing screen, Hole U1519B. D. CORK-II wellhead connection to 4½ inch casing at the rig floor, Hole U1519B. E. OsmoSampler pump (right) and Teflon coil (left), Hole U1518H. F. Miniature temperature sensor attached to Spectra line prior to wrapping and taping, Hole U1518H.
A B C
D E
F
31
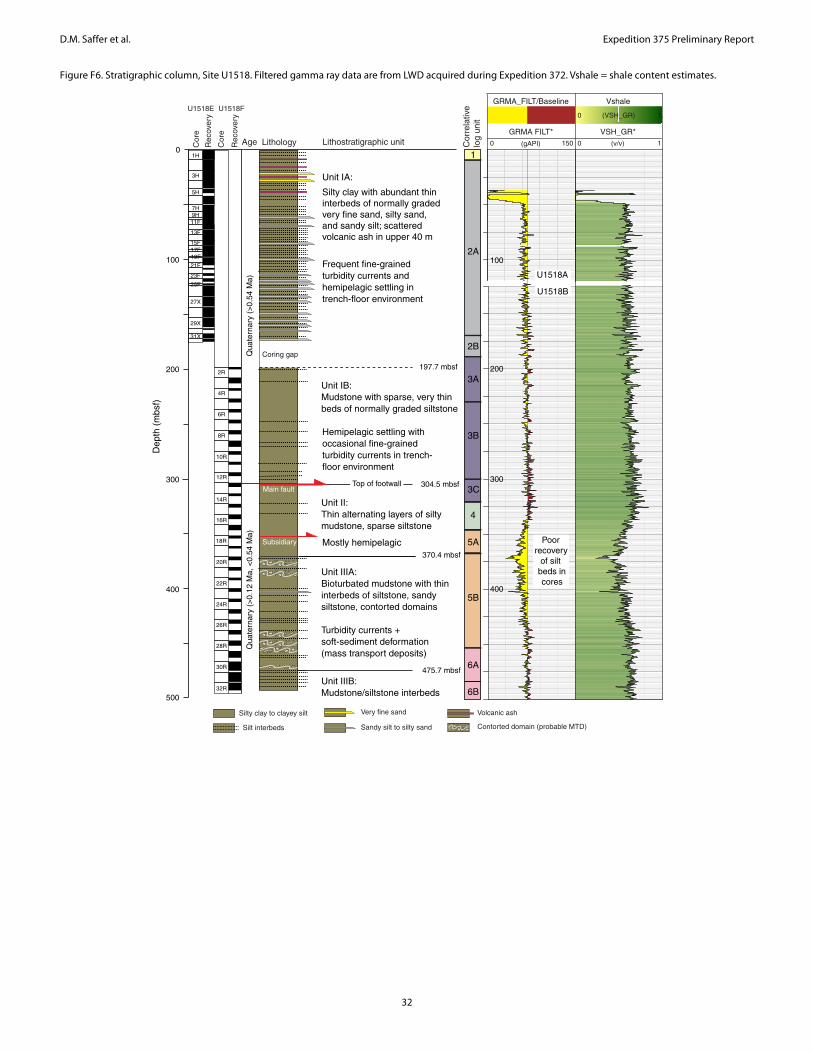
D.M. Saffer et al. Expedition 375 Preliminary Report
Figure F6. Stratigraphic column, Site U1518. Filtered gamma ray data are from LWD acquired during Expedition 372. Vshale = shale content estimates.
De
pth
(m
bsf)
Qu
ate
rna
ry (
>0
.54
Ma
)
Unit IA:
Unit IB:
Mudstone with sparse, very thin
beds of normally graded siltstone
Unit II:
Thin alternating layers of silty
mudstone, sparse siltstone
Unit IIIA:
Bioturbated mudstone with thin
interbeds of siltstone, sandy
siltstone, contorted domains
Turbidity currents +
soft-sediment deformation
(mass transport deposits)
Frequent fine-grained
turbidity currents and
hemipelagic settling in
trench-floor environment
Hemipelagic settling with
occasional fine-grained
turbidity currents in trench-
floor environment
304.5 mbsf
0
100
200
300
400
500
30R
28R
2R
4R
6R
8R
10R
12R
14R
16R
18R
20R
22R
24R
26R
32R
1H
3H
5H
7H9H
11F
13F
27X
29X
31X
25F
23F
21F
19F17F
15F
GRMA FILT*
GRMA_FILT/Baseline
(v/v)
VSH_GR*
(VSH_GR)
U1518A
U1518B
Vshale
Poor
recovery
of silt
beds in
cores
197.7 mbsf
Top of footwall
Qu
ate
rna
ry (
>0
.12
Ma
, <
0.5
4 M
a)
Unit IIIB:
Mudstone/siltstone interbeds
370.4 mbsf
475.7 mbsf
200
100
300
400
Main fault
Mostly hemipelagic
1
2A
2B
3A
3B
4
3C
5A
5B
6A
6B
Subsidiary
Coring gap
LithologyAge Lithostratigraphic unitCo
re
Re
cove
ry U1518E U1518F
Co
re
Re
cove
ry
Co
rre
lative
log
un
it
(gAPI)0 150 0 1
0 1
Volcanic ashSilty clay to clayey silt
Silt interbeds Sandy silt to silty sand Contorted domain (probable MTD)
Very fine sand
Silty clay with abundant thin
interbeds of normally graded
very fine sand, silty sand,
and sandy silt; scattered
volcanic ash in upper 40 m
32

D.M. Saffer et al. Expedition 375 Preliminary Report
Figure F7. Selected drilling results and core-log-seismic tie (synthetic seismic trace), Site U1518. Chlorinity: blue = Hole U1518E, red = Hole U1518F, dashed line = seawater concentration. CDP = common depth point.
0
100
200
300
400
500
IA
IB
II
IIIA
IIIB
0 30 60 9020 8050 540 580
Main fault
Coring gap
Subsidiary fault
Gradually decreasingdeformation intensity
De
pth
(m
bsf)
4311 4313 4315 4317 4319 4321 4323 4325 4327 4329CDP
Porosity (%) Bedding dip (°) Cl (mM) Synthetic
Lith
. u
nit
33

D.M. Saffer et al. Expedition 375 Preliminary Report
Figure F8. Stratigraphic column, Site U1519. Gamma ray, caliper, and resistivity are from LWD acquired during Expedition 372 and wireline logging data. TD = total depth.
3B
1A
1B
1C
1D
2A
2B
2C
2D
3A
Shallow
0.1 100
Medium
Deep
Ring
De
pth
(m
bsf)
late
mid
dle
Ple
isto
cene (
<0.5
4 M
a)
Unit I:
Mud, mudstone,
minor silt and volcanic ash
Unit II:
Mudstone, silty mudstone,
fine sand, coarse sand,
mass transport deposits
Poor recovery and
coring disturbance
preclude facies
interpretation
282.66 mbsf
Void
Pro
ba
ble
sa
nd
-ric
h in
terv
al
100
200
300
400
500
600
Volcanic ashMud(stone)
Silt(stone) Sandy silt(stone) to
silty sand(stone)
Sand(stone)
Mass transport deposit
TD = 635.65 mbsf
Hemipelagic settling,
turbidity currents, debris flow
Hemipelagic settling,
rare dilute turbidity currents
2H
4H
6H
8F10F12F
1H
3H
2R
4R
6R
10R
12R
14R
16R
18R
20R
22R
24R
26R
mid
dle
to e
arl
y P
leis
tocene (
0.5
4-2
.17 M
a)
LithologyAge Lithostratigraphic unitCo
re
Re
cove
ry U1519C U1519D
Co
re
Re
cove
ry U1519E
Co
re
Re
cove
ry
Not cored
Not cored
Not cored
Lo
g u
nit
Resistivity(Ωm)
(inch)8 18
Gamma ray
(gAPI)20 100
Ultrasonic
caliper
34
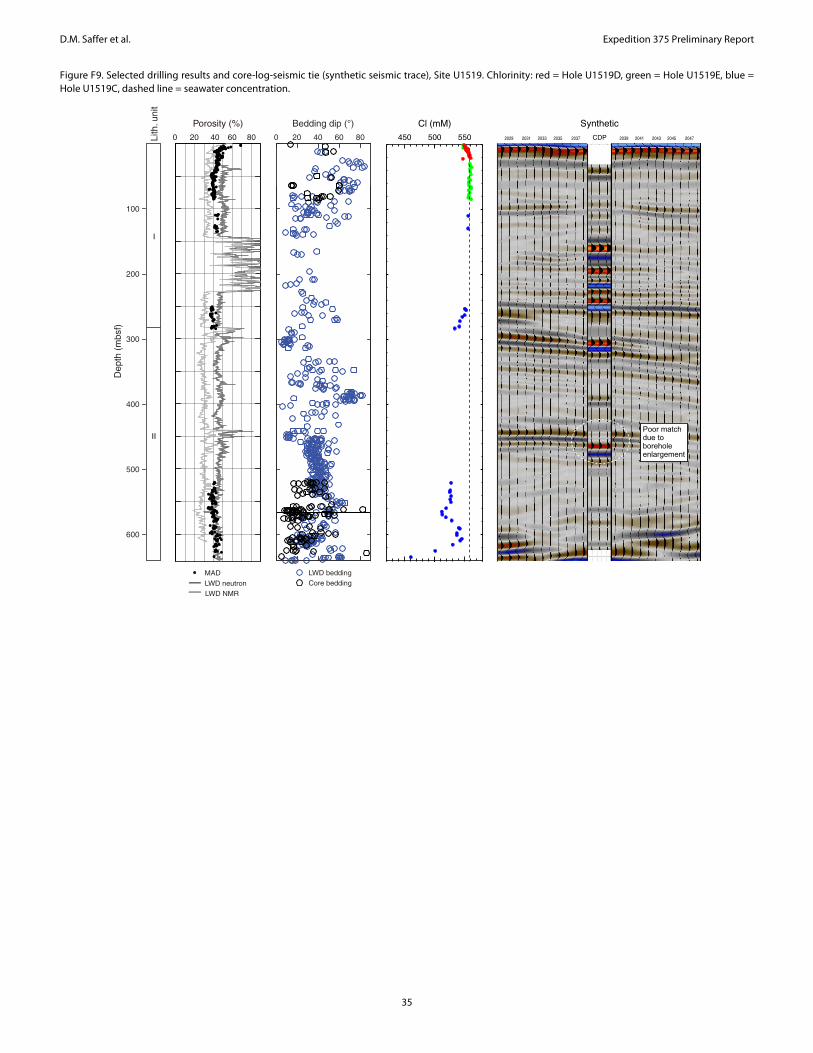
D.M. Saffer et al. Expedition 375 Preliminary Report
Figure F9. Selected drilling results and core-log-seismic tie (synthetic seismic trace), Site U1519. Chlorinity: red = Hole U1519D, green = Hole U1519E, blue = Hole U1519C, dashed line = seawater concentration.
0 20 40 60 80
100
200
300
400
500
600
I
II
De
pth
(m
bsf)
Lith
. u
nit
0 80604020 450 500 550 2029 2031 2033 2035 2037 2039 2041 2043 2045 2047
Poor matchdue toborehole enlargement
LWD bedding
Core bedding
Porosity (%) Bedding dip (°) Cl (mM) Synthetic
MAD
LWD neutron
LWD NMR
CDP
35

D.M. Saffer et al. Expedition 375 Preliminary Report
Figure F10. Stratigraphic column, Site U1520. Gamma ray, caliper, and resistivity are from LWD acquired during Expedition 372 and wireline logging data.
(inch)8 18
Gamma ray
(gAPI)20 100 2 20
1
2
4
3
5
6
7
8
9
10
11
GR (wireline) Res (wireline)
Lithology
Not cored
Not cored
Unit I:
Trench-wedge facies
Lithostratigraphic unit
Unit II:
Ruatoria slide
Unit III:
Trench-wedge facies
Unit IV:
Pelagic facies
Unit V:
Volcaniclastic facies
Unit VI: mixed lithologies
100
200
300
400
500
600
700
800
900
1000
De
pth
(m
bsf)
Re
cove
ry U1520C U1520D
Re
cove
ry LWD
resistivity
Ultrasonic
caliper
(Ωm)
Caliper (wireline)
Lo
g u
nit
Volcanic ash/TuffSilt(stone),
silty sand(stone)
Chalk, muddy chalk
Calcareous mudstone
MarlVolcaniclastic
conglomerate
Debris flow deposit
Sand(stone)
Hemipelagic
mud(stone)
Black mudstone
36
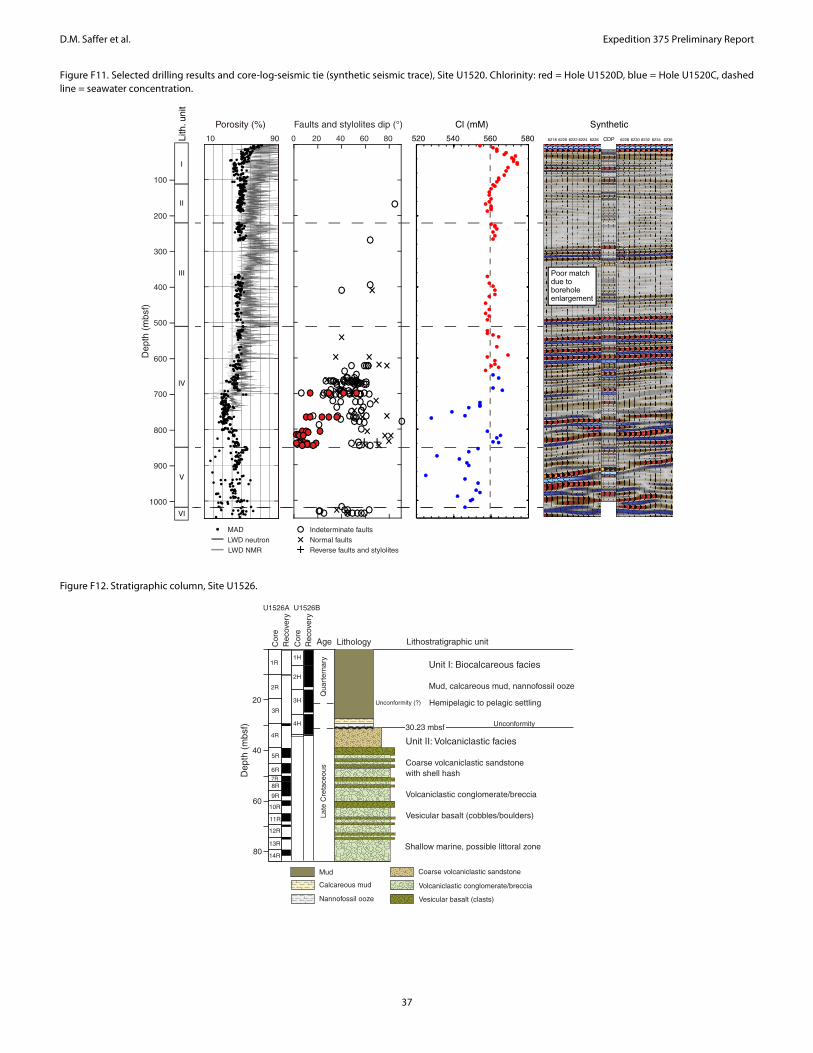
D.M. Saffer et al. Expedition 375 Preliminary Report
Figure F11. Selected drilling results and core-log-seismic tie (synthetic seismic trace), Site U1520. Chlorinity: red = Hole U1520D, blue = Hole U1520C, dashed line = seawater concentration.
Figure F12. Stratigraphic column, Site U1526.
I
De
pth
(m
bsf)
II
Lith
. u
nit
10 90
Porosity (%)
100
200
300
400
500
600
700
800
900
1000
III
IV
V
VI
0 20 40 60 80
Faults and stylolites dip (°)
Indeterminate faults
Normal faults
Reverse faults and stylolites
Cl (mM)
540 560 580520
Synthetic6218 6220 6222 6224 6226 6228 6230 6232 6234 6236CDP
MAD
LWD neutron
LWD NMR
Poor matchdue toborehole enlargement
Lithology
De
pth
(m
bsf)
20
40
80
60
Unit I: Biocalcareous facies
Mud, calcareous mud, nannofossil ooze
Unit II: Volcaniclastic facies
Coarse volcaniclastic sandstone
with shell hash
Volcaniclastic conglomerate/breccia
Vesicular basalt (cobbles/boulders)
Age Lithostratigraphic unit
Calcareous mud
Nannofossil ooze
Coarse volcaniclastic sandstone
Volcaniclastic conglomerate/breccia
Vesicular basalt (clasts)
30.23 mbsf
Co
re
Hemipelagic to pelagic settling
Shallow marine, possible littoral zone
1R
2R
3R
4R
5R
6R
8R
9R
10R
11R
12R
13R
14R
7R
Unconformity
Unconformity (?)
La
te C
reta
ce
ou
s
Re
cove
ry
1H
2H
3H
4H
Mud
Qu
art
ern
ary
U1526A U1526B
Co
re
Re
cove
ry
37

D.M. Saffer et al. Expedition 375 Preliminary Report
Figure F13. Selected drilling results and core-seismic tie (synthetic seismic trace), Site U1526.
0 20 40 60 80
Faults
Fracture-fill veins
Diffuse veins
Open fractures
0
20
40
60
80
I
II
De
pth
(m
bsf)
Lith
. u
nit
0 80
05CM-04_Amplitudes[Realized]1
7135 7137 7139 7141 7143
-20000.00 20000.00Seismic(default)
Synthetic
-0.23Seismic(default)0.28
05CM-04_Amplitudes[Realized]1
7145 7147 7149 7151 7153
-20000.00 20000.00Seismic(default)– + – +
7135 7139 7143 7145 7149 7153CDP
Porosity (%) Fracture dip (°)
Synthetic
38