Embed Size (px)
Citation preview
International patent families: from application strategiesto statistical indicators
Antoine Dechezlepretre1• Yann Meniere2
• Myra Mohnen3
Received: 20 April 2016 / Published online: 28 February 2017� The Author(s) 2017. This article is published with open access at Springerlink.com
Abstract This paper provides an in-depth analysis of the characteristics of international
patent families, including their domestic component. We exploit a relatively under-studied
feature of patent families, namely the number of patents covering the same invention
within a given jurisdiction. Using this information, we highlight common patterns in the
structure of international patent families, which reflect both the patenting strategies of
innovators and the peculiarities of the different patent systems. While the literature has
extensively used family size, i.e. the number of countries in which a given invention is
protected, as a measure of patent value, our results suggest that the number of patent filings
in the priority country within a patent family as well as the timespan between the first and
last filings within a family are other insightful indicators of the value of patented
innovations.
Keywords Patent families � Patent value � Priority patents � Continuations � Divisionalapplications
JEL Classification O31 � O34
We thank David Popp, Lluis Gimeno-Fabra and an anonymous referee for very helpful suggestions. Dis-cussions with patent attorneys have greatly enhanced our understanding of the legal and strategic deter-minants of the structure of patent families. We are especially grateful to Francois Gevers (Gevers & VanderHaeghen), Dominique Kaesmacher, Kanae Doda and Marie Paule Vandeberg (Kirkpatrick), Jerome Collinand Isabelle Clery (Regimbeau), Herbert Lewitter and Laurent Kurtz (Santarelli). Of course, any remainingmistake or inaccuracy is of our own responsibility.
& Antoine [email protected]
1 Grantham Research Institute on Climate Change and the Environment and Centre for EconomicPerformance, London School of Economics, London, UK
2 MINES ParisTech, PSL – Research University, CERNA, i3 UMR CNRS, 60 boulevard SaintMichel, Paris 75006, France
3 University of Essex, Colchester, UK
123
Scientometrics (2017) 111:793–828DOI 10.1007/s11192-017-2311-4

Introduction
Patents have been increasingly used as an indicator of innovation activity over the last
decades, and the recent availability of global patent databases such as the European Patent
Office’s Worldwide Patent Statistical Database PATSTAT has only reinforced this trend.
However, it has long been acknowledged that using patent statistics to measure the pro-
ductivity of research and development activities is not without limitations (Pavitt
1982, 1985; Griliches 1990). Some innovations are never patented, while others are pro-
tected by several patents. Mere patent counts tell little about the market value of patented
innovations, which varies considerably. Furthermore, patent design and patenting practices
differ between countries. Moreover, the propensity to patent (e.g. number of patents filed
per USD of R&D) has been increasing faster in some industries and jurisdictions, making it
all the more difficult to use patent metrics for comparisons across time, sectors, and/or
countries (Hall and Ziedonis 2001; Jaffe and Lerner 2004; Van Zeebroeck et al. 2009).
Patent families go a good way in alleviating these methodological shortcomings. Patent
families generally refer to the whole set of patents covering the same invention in one or
more countries. Formally, it encompasses ‘‘the set of patents (or applications) filed in
several countries which are related to each other by one or several common priority
filings’’ (OECD 2009).1 Counting the number of patent families avoids double counting
patents filed in several countries, thus providing a count of patent inventions (de
Rassenfosse et al. 2013). Since the decision of a firm to patent in a particular country
signals an intention to enter into a local market and sell a new product or use a new
technology. Patent families have therefore been used to measure the international diffusion
of technologies (e.g. Eaton and Kortum 1999; Dechezlepretre et al. 2011). The size of
patent families—defined as the number of countries where the family is represented—may
be used to measure the invention’s market size and, hence, its value (Harhoff et al. 2003).
In this paper, we focus on another dimension of patent families: the number of patents
that are part of the same family within each jurisdiction. Indeed, inventions may be
patented in several countries and may be protected by several patents in each country.
Moreover the number of patents protecting the invention may differ between countries.
Our objective is to carry out a comprehensive analysis of the structure of patent families
that takes these dimensions into account. In contrast to recent studies which have looked at
domestic patent families in a United States (Hegde et al. 2009) or European context
(Harhoff 2006; Gambardella et al. 2008; van Zeebroeck and van Pottelsberghe 2011a), we
take a global approach and jointly consider the domestic and international aspect of patent
families in all three major patent systems: the European Patent Office, the United States
Patent and Trademark Office and the Japan Patent Office. This makes it possible to shed
light on statistical patterns in the structure of patent families, reflecting both the patenting
strategies of innovators and the peculiarities of the different patent systems. Based on these
patterns, we revisit the interpretation of statistics on patent families, and propose new
international patent-based indicators enabling more rigorous cross-country comparisons of
innovation performances at the national and sector levels.
Our approach is based on a statistical analysis of the global PATSTAT database
between 1993 and 2010, supplemented by interviews with IP attorneys and companies and
by a review of patent law in the European, American and Japanese patent systems. Our
interviews suggest that patent families should be viewed from a dynamic perspective,
1 See Martinez (2010) and Martinez (2011) for the different implementations of this principle.
794 Scientometrics (2017) 111:793–828
123
taking into account the maturation process of innovations. Applicants indeed face a trade-
off between the pre-emption of patent protection at an early stage of the innovation
development, and the fine-tuning of patent protection as the innovation matures and its
market potential becomes clearer. We show that national patent systems and international
procedures jointly offer various types of flexibilities that allow inventors to reconcile these
objectives through sequential patent applications. In fact, inventors typically file multiple
applications in the first filing country (the priority country2) as a first step and seek
protection in other countries later in the maturation process by filing a single foreign
patent.
This finding has implications for patent-based statistics. In particular, we show that the
number of patents filed in the priority country along with the timespan between the first and
last filings within a patent family are strongly correlated with other commonly used
measures of patent value such as forward citations, family size, grant status and mem-
bership of triadic and PCT families. Compared to other indicators such as the size of
international families, the number of patents filed in the priority country as well as the
family timespan provide common metrics for all inventions, including those that are never
patented abroad, which represent 80% of patented inventions worldwide. By sorting
patents according to their national family size, we argue that these measures are able to
deal with the very high proportion of purely domestic patents filed for example in Japan or
China. We thus refine existing indicators such as the count of priority filings proposed by
de Rassenfosse et al. (2013). The timespan between the first and last filings within a patent
family has the advantage of combining information from both the priority country and
foreign offices and is relatively robust to administrative idiosyncrasies of the various patent
offices.
The article is organized as follows. We review the literature on the use of patent
statistics as indicators of innovation in the following section. We then analyse the legal and
economic determinants of the structure of national and international patent families, with a
specific focus on the US, European and Japanese patent systems. In fourth section we
describe the methodology used to analyse patent families and provide some descriptive
statistics on the composition of patent families since 1993. Fifth section presents our
econometric analysis and introduces new measures of patent value based on the number of
patents filed in the priority office and on the timespan of patent families between the first
and the last patent applications. Sixth section compares countries’ innovative output based
on different patent counts. We conclude by reflecting on the implications of the new
measures presented.
Patents as innovation indicators
Patents are one of the main indicators used to assess the productivity of innovation sys-
tems. In contrast to R&D spending, patents do not measure inputs but outputs of the R&D
process. Compared with academic publications—an alternative indicator of innovative
output—they are more oriented towards the industry and cover a broader scope of tech-
nologies (Freeman 1982; Grupp 1997, 1998; Frietsch and Schmoch 2006). Especially in
high-technology areas, patents can help to assess present and future competitiveness of
2 A priority right is a time-limited right, triggered by the first filing of a patent application for an invention.The applicant is allowed to file subsequent applications in other countries for the same invention effective asof the date of filing the first (priority) application.
Scientometrics (2017) 111:793–828 795
123
companies, sectors, or economies, since they indicate a potential for opening new markets
or gaining market shares with new products (Frietsch and Schmoch 2006; Schmoch 2004).
In addition, patent data are now widely available, making it possible to generate large
datasets for statistical analyses without having to conduct costly interviews or surveys.
They also include a wealth of information, in particular fine technology classifications
allowing to conduct analysis at low levels of aggregation.
Patent-based indicators are however imperfect proxies for technological innovation.
First, they are not the only way to protect inventions, as inventors may instead rely on trade
secret or lead time (Cohen et al. 2000) even if the most economically significant inventions
seem to have historically been patented (Dernis et al. 2001). Second, the propensity to
patent differs across sectors, technological fields, and countries, depending on how patent
law is enforced. Third and most importantly, it is widely recognized that the distribution of
patent value is highly skewed (Scherer 1965; Pakes and Schankerman 1984; Pakes 1986;
Griliches 1990). As a general rule, there is a large number of patents of limited value and a
small number of highly valuable ones. Among high-value patents, the distribution is still
uneven: examining German patents that have been renewed during at least 17 years,
Harhoff et al. (1999) find a highly skewed value distribution, referred to as a ‘‘tail within
the tail’’. This means that simply counting the number of patents assuming that they were
all of equal value is bound to generate significant biases in the measure of innovation.
A natural solution to this problem is to weigh patents by some indicator of their value.
Various measures have been used as proxies for the unobserved monetary value of patents
(for recent overviews of patent quality measures, see van Zeebroeck 2011; van Zeebroeck
and van Pottelsberghe 2011b; Squicciarini et al. 2013).3 Generally, patent values are
inferred from characteristics of either the patent itself or the patent owner. These variables
are typically only loosely correlated with each other and are thus sometimes aggregated
into composite patent quality indexes (Lanjouw and Schankerman 2004; van Pottelsberghe
and van Zeebroeck 2008; van Zeebroeck 2011). In the remainder of this section we review
the most frequently used indicators of patent value in greater detail and use them to assess
the quality of our proposed new indicators in sector 5.
A first way to measure the value of patents is to resort to surveys of patent holders who
are asked to provide an assessment of the private value of their patents (e.g. Harhoff et al.
2003; Gambardella et al. 2008). The major drawback of this approach is obviously the size
of the sample which is naturally limited by the cost of undertake such surveys, making it
unusable on a large scale. As a consequence, survey-based measures have been mostly
used to show that patent value is correlated with a number of features of the patents that are
readily available in patent databases.
Some value indicators are observable as soon as the patent is published. Those include
the number of claims, which provides an indication of the legal breadth of patent protection
and signals the complexity of a patent. Tong and Frame (1994) show that patents weighted
by their claims are positively linked to other measures of national research performance,
while Lanjouw and Schankerman (2001) show that a patent is more likely to be litigated if
it has more claims. The number of IPC classes mentioned on the patent application is
another measure of the scope or breadth of a patent. As inventions are considered to be a
combination of existing ideas, the wider set of ideas, the more valuable the patent (Guellec
and van Pottelsberghe de la Potterie 2000). Finally, backward citations—i.e. references to
previous patents made in the patent application—have also been used as an indicator of
3 Reitzig (2004), Sapsalis and van Pottelsberghe de la Potterie (2007) and Greenhalgh and Rogers (2007)survey the earlier empirical literature on patent value.
796 Scientometrics (2017) 111:793–828
123
value based on the idea that backward citations signal a patent of a larger scope. A higher
number of backward citations however also causes the content of the patent to be more
restricted and therefore limits its possible value (Harhoff et al. 2003), so that the rela-
tionship between backward citations and patent value can be ambiguous.
Although the above indicators have the advantage of being immediately available to the
researcher, a lot of information on patent value is only observed a long time after the initial
publication. The grant status of a patent is one such indicator of value since the granting
process confirms the novelty, applicability and inventiveness of the invention, and confers
monopoly rights to the holder (Guellec and van Pottelsberghe de la Potterie 2000). The
grant status has been shown to be correlated with other measures of value (Hall et al. 2005;
Lanjouw et al. 1998). A potential disadvantage of grant status is the substantial length of
the process, which is aggravated by the increased workload at the patent offices and by the
possibility to delay the start of the examination process in certain patent offices (Harhoff
2009).
Hall and Harhoff (2012) argue that patent renewals come closest to estimating the true
value distribution of patents. Indeed, if an assignee pays renewal fees, this means that she
expects to earn at least the cost of the fee through the use of the technology in production,
licensing and/or commercialization of the patent. This approach has been used by many
scholars (e.g. Pakes and Schankerman 1984; Shankerman and Pakes 1986; van Pottels-
berghe and van Zeebroeck 2008; Hegde and Sampat 2009). However, renewal data raises
several issues. First, the information on renewal decision only becomes visible over time, a
disadvantage compared to other indicators that are available more quickly, such as grant
status. Second, renewal data are not readily available for all patent offices in a harmonized
manner (Pakes 1986; Lanjouw et al. 1998; Bessen and Meurer 2008). Third, because
renewal fees are relatively low, this approach is unable to say anything for the tail of the
value distribution, where the highest-value patents lie (Hall and Harhoff 2012).
One way to look inside the tail of the distribution might be to use information on
opposition (for the EPO system) and litigation (for the US), which indicate that both the
applicant and the opposing party are willing to incur additional costs to safeguard their
property rights (van der Drift 1989; Lanjouw and Schankerman 2001, 2004). Harhoff et al.
(2003) and Harhoff and Reitzig (2004) confirm that oppositions and the value of patents
are positively related and only 8% of all EPO patents—likely the highest-value ones—are
opposed. Unfortunately, information on opposition and litigation is not yet consistently
available for all patent offices in global databases such as PATSTAT.
The number of citations made to patents (or forward citations), initially proposed by
Narin et al. (1987) and later popularized by Trajtenberg (1990), is one of the most frequent
value indicators used in the literature. It is based on the fact that inventors are required to
mention prior art, implying that the more a patent is cited, the more relevant it is to
subsequent inventors. The number of citation-weighted patents a firm files is strongly
correlated with measures of firm value based on financial market data (Harhoff et al. 1999;
Lanjouw and Schankerman 2001; Hall et al. 2005; Moser et al. 2012). Interestingly, Hall
et al. (2005) show that self-citations (i.e. citations made by a firm to its own patents) are
actually more valued by the market than other citations. A general drawback of patent
citations is that they can be used strategically by applicants (Abrams et al. 2013), intro-
ducing noise in the measure. From a practical point of view however, the wide availability
of this measure in patent databases constitutes a major advantage.
Finally, patent family size, introduced by Putnam (1996), refers to the number of
countries in which the applicant has sought protection for a given invention. More
specifically, patent families include all the patents claiming the same priority (or set of
Scientometrics (2017) 111:793–828 797
123

priorities), and are usually thought of as the set of patents protecting the same invention in
different countries (for a very complete review of the definition of patent families, see
Martinez 2010). Putnam (1996), Harhoff et al. (2003) and van Pottelsberghe and van
Zeebroeck (2008) find a positive correlation between patent value and the number of
countries in which patent protection is sought for the same invention. Patent families are
also at the origin of simpler indicators. Triadic families (e.g. families including patents
applied for at the Japan, U.S. and European patent offices) are probably the most common
one (Guellec and van Pottelsberghe de la Potterie 2004; Dernis and Kahn 2004; Aghion
et al. 2016). Other indicators require patent families to include at least two triadic offices
(Henderson and Cockburn 1996; Grupp 1998) or more than one patent office (Deche-
zlepretre et al. 2011). Frietsch and Schmoch (2010) propose a measure called ‘‘transna-
tional patents’’. It includes all patent families with at least a PCT application (see below) or
an EPO application. The rationale behind these measures is that a patent should be more
valuable if the cost associated to multiple filings has been born to acquire the protection in
a large number of countries.
It is not unusual that patent families include several patents within the same patent
system (Martinez 2010). This aspect of patent families has been relatively under-explored.
Harhoff (2006) establishes a correspondence between the filing route and the structure of
patent families within the European Patent System. Van Zeebroeck and van Pottelsberghe
(2011a) find that the size of EP patent families (as defined by the number of national
validations) and the filing of divisional applications (patent applications containing matter
from a previously filed application) are positively correlated with various indicators of
patent value based on citations, families, renewals and oppositions. Hegde et al. (2009)
study the continuation procedures within the U.S. patent system. These procedures allow
applicants to base several applications on the same priority. Empirical analysis suggests
that, depending on the sectors, they may be used strategically either to strengthen the
protection of valuable invention, or to obtain more patents on less important innovations.
The law and economics of patent families
Using patents as a measure of innovation activity requires some understanding of how and
why they are taken out, how they are administered, how they are enforced and how all this
changes over time. Before presenting data on the structure of national and international
patent families, we first review the legal and economic drivers of their formation. The
decision to file several patents for the same innovation depends on the procedures presiding
over international patent applications and on the legal rules prevailing in each national
patent system. The structure of patent families in turn depends on patenting decisions made
by innovators.
Patent families generally refer to the extension of patent protection at the international
level. In the next subsection, we first review the different rules and procedures available
for applicants seeking international patent protection, before examining procedures in the
U.S., European and Japanese patent systems that allow for multiple patent applications.
Based on interviews with industry representatives and patent lawyers, we finally high-
light the strategic motives of innovators to file several patent applications on the same
invention.
798 Scientometrics (2017) 111:793–828
123

Circuits for international patent applications
Under the Paris Convention, an applicant in any country has one year after the first national
application to file other applications abroad. One option for applicants seeking interna-
tional protection is thus to file a national application at the patent office of each relevant
country within a year. However, this strategy lacks flexibility.
A more flexible option consists in filing an international patent application under the
Patent Cooperation Treaty (PCT).4 This option has become increasingly popular over the
years.5 The PCT route does not result in an ‘‘international patent’’ but opens a period of
30 months from the priority application during which it is possible to file other national
applications. The advantage for applicants is thus to postpone the cost of national appli-
cations, and to delay the decision of whether to file national applications and in which
countries. Once filed at a Receiving Office, the international application results in a report
including a written opinion on patentability issued by an International Searching Authority
(ISA) within 16 months after the first (priority) filing.6 This report is helpful for applicants
to decide whether it would be worthwhile to file national applications. It may also be used
subsequently by examiners in national patent offices—and thus save search fees for the
applicants.
Another option available for inventions seeking protection in European countries is to
file a European patent application under the European Patent Convention7 (EPC). Suc-
cessful applications lead to a European patent granted by the European Patent Office
(EPO). The European patent merely confers applicants the right to obtain national patents
in designated countries without any additional examination, provided the required fees are
paid and the patent is properly translated in the national language. By contrast with PCT
applications, EP applications result in European patents that are distinct from the subse-
quent national patents in designated countries. Although these European patents do not
confer any protection per se, European patent applications can be priority applications, and
they frequently appear in international patent families.8
Second domestic filings, divisional applications and continuationsin the European, U.S. and Japanese patent systems
Patent families may include several patents not only at the international level, but also
within each national patent system. These multiple patents are usually second filings,
including divisional applications or continuing applications, i.e. patent applications con-
taining matter from a previously filed application, which is claimed as its priority.
4 The Patent Cooperation Treaty (PCT) is an international patent law treaty concluded in 1970. It provides aunified procedure for filing patent applications to protect inventions in each of its contracting states. Over140 member countries are members.5 In 2007, 50.3% of total non-resident filings were filed through the PCT procedure, compared to 25.4% in1995 (World Patent Report 2009).6 It is optionally followed by a preliminary examination, performed by an International PreliminaryExamining Authority (IPEA).7 The European Patent Convention (EPC) was signed in 1973. It provides a legal framework for the grantingof European patents, via a single, harmonized procedure before the European Patent Office.8 In 2012, EU member states agreed to create a European unitary patent that will guarantee supranationalprotection for inventions in 26 countries across Europe. The unitary patent will enter into force uponratification of a Unified European patent court by at least 13 EU member states, including Germany, Franceand the United Kingdom.
Scientometrics (2017) 111:793–828 799
123
Under the Paris Convention, an applicant who has filed a priority application has a first
general possibility to file second applications for the same invention within the (1-year)
priority period. Such second filings typically claim the parent’s priority, so that the
applicant can have the benefit of the filing date of the original application. This is par-
ticularly important, as it defines the point in time up to when prior art can—in general
lines—be considered relevant against the application. The so called ‘‘right to priority’’
gives applicants some margin of time in order to decide which markets are of interest to
them and to further improve the industrialisation and business case before engaging in
onerous international patent procedures.
As well as the usual ‘‘right to priority’’ in the sense of the Paris Convention, applicants
may use the longer time margins (about 30–31 months) allowed by the international
processing of patent applications under the Patent Cooperation Treaty (PCT) before
engaging in second filings.
As well as making second filings from ‘‘priority applications’’, applicants may also file
divisional applications. This is guaranteed by the Paris Convention. Divisional applications
are often filed when a first patent application lacks unity of invention; that is, when it
describes more than one invention. Additionally, the applicant can decide to divide a first
application in several divisionals as long as the parent application is pending. Divisionals
thus make it possible for the applicant to seek protection for part of the subject matter
disclosed but not (or no longer) claimed in the parent application. Whilst a divisional
application can be filed for any pending application up to the day preceding the mention of
grant of the patent, it will retain its parent’s filing date. Although these general principles
hold in all patent systems, the practical conditions of their implementation may differ from
one country to another, depending for instance on how unity of invention is interpreted.9
Divisional applications are not necessarily imposed by examiners: they may also be used
deliberately by applicants.
While divisional applications are common to all patent systems, there are also specific
legal provisions in the U.S. system that can induce multiple patent filings based on the same
priority. The U.S. patent system offers applicants some flexibility to file continuing
applications on purpose. Continuations make it possible to pursue additional claims to an
invention disclosed in a prior application of the same applicant. They are useful when a
patent examiner allowed only part of the claims in an initial application, or when an
applicant identifies new ways of claiming different embodiments of the invention. Besides
continuing applications, inventors can also file continuation-in-part applications. In contrast
to simple continuations, continuation-in-part applications make it possible to also protect
subject matter that was not disclosed in the parent application.10 Moreover, the protection of
claims for the added subject matter do not start from the date of filing of the priority, but
from their own date of filing. The USPTO introduced a new rule in 2007 restricting
inventors to filing two continuation applications for each original patent application.
However, this rule has been challenged in court and was eventually withdrawn in 2009.
9 The practice related to the filing of divisional applications at the EPO was for instance clarified in 2007:the EPO Enlarged Board of Appeal held that divisional applications containing subject-matter extendingbeyond that of the earlier application could be amended to remove the deficiency even though the initialapplication was no longer pending. In 2010, a time-limit was introduced for voluntary division of the parentapplication by the applicant. This rule was removed in 2014, thereby aligning the EPO with the practice ofUSPTO and JPO.10 Applicants are required to disclose continuation-in-part applications because they change the descriptionof the invention. Continuing applications are not disclosed for they are based exactly on the same inventionas the priority application.
800 Scientometrics (2017) 111:793–828
123

Japanese patent law traditionally only allows patents with a narrow scope (Ordover
1991). Although the system has been evolving in the last decades11 (it is now closer to the
European and U.S. ones), this specificity has not disappeared. Japanese patents have long
been limited to a single claim—itself sharply delimited by examiners (Ordover 1991).
Applicants were allowed to file several dependent claims in 1976, and in 1988 further
reforms significantly extended the number of claims that could be included in a single
patent (Sakakibara and Branstetter 2001). However, applicants must still pay additional
fees beyond five claims, which discourage applications for broad patents. In the mid-
nineties, an average Japanese patent included less than five claims, as compared with
fifteen claims for an average U.S. patent (Allison and Tiller 2003). Narrower patents in turn
result in more fragmented patent applications. Cohen et al. (2002) find for example that a
million U.S. dollar invested in R&D generates on average 2.8 patents in Japan, as com-
pared to 0.6 patents in the United Sates.
Strategies for patent routes and families
Multiple patenting is thus possible under a broad set of rules in the national, regional and
international patent systems. These rules are in some cases experienced as a constraint by
the applicants—for instance when an examiner partly rejects an application for lack of
unity of invention. However, they also offer applicants some degree of freedom to
deliberately increase the number of applications based on the same priority. Our interviews
with patent attorneys and IP professionals in various sectors suggest that applicants indeed
find it useful to exercise this freedom, sometimes intensively.
Although practices vary greatly—reflecting the heterogeneity of technologies, legal
rules, economic contexts and strategic motives—the underlying incentives are similar to all
applicants. At the heart of patenting strategies lies a trade-off between the need to secure
patent protection as early as possible, and the willingness to preserve the option to adjust
this protection as long as possible in an evolving environment.
Inventors have strong incentives to file a priority application as soon as possible in order
to protect them against imitators. Any information leakage on the invention before the
priority application would be damaging in two ways. It would enable competitors to use
the invention legally, and may prevent the invention from being ever patented (since
through the leakage it has become prior art).12 Even if the secret is well kept, there is a risk
under the first-to-file rule13 that the patent would be granted to another inventor that files an
application first. Applying for a patent alleviates these risks, as it freezes relevant prior art
at the date of application, and guarantees that the patent, once granted, can be opposed to
any infringer.14
11 Partly in compliance with the TRIPS (Trade-Related Aspects of Intellectual Property Rights) agreement.12 In some countries, a grace period may however allow for public disclosure of an invention (under certainconditions) without affecting the validity of a subsequent patent application up to a certain delay.13 In a first-to-file system, the right to the grant of a patent for a given invention lies with the first person tofile a patent application for protection of that invention, regardless of the date of actual invention. This ruleis now used in almost all countries. In the United States, the first-to-invent rule prevailed until 2013, whenthe first to file system was adopted with the America Invents Act.14 Note that the incentives to delay grant date probably vary across technological fields and types ofapplicants. They are likely to be weaker in fields characterized by quick technological upgrading such as ITand for start-up businesses, for whom possessing a granted patent could increase the likelihood of receivingexternal funding (see Farre-Mensa et al. 2016).
Scientometrics (2017) 111:793–828 801
123

Although inventors may want to file a priority application as early as possible, they also
have reasons to delay as much as possible the moment when their patent will be granted.
Early applications can take place when the invention and/or its market are not yet mature,
but this induces opportunity costs for the applicant. Patent applications must be disclosed
after 18 months, which may provide competitors with important information on on-going
R&D. If the application is filed too early, limited patent duration may also later deprive
applicants of protection while the invention is still commercially exploited. Moreover, the
design of a patent granted early may not perfectly match the final version of the invention,
thus facilitating circumvention. To avoid such discrepancies, applicants need to delay the
moment when the patent is granted with its definitive claims. Preserving some uncertainty
on the design of the claims can also be a way for them to deter competitors from devel-
oping potentially infringing technology.
The rules of the patent system give applicants various means to ease the tension
between early priority applications and late patent grant. At the international level, PCT
applications can be seen as an option mechanism, whereby the moderate cost of filing a
first application makes it possible to wait before choosing whether to extend protection
internationally, and in which countries. The 30 months delay opened by the PCT route also
provides substantial flexibility to fine-tune the design of the patents that will be applied for
in foreign countries.15
At the national or regional levels, applicants can in turn use second domestic filings,
including divisional and continuing applications, to delay a patent grant. By filing a di-
visional application while the parent application is still pending, applicants can obtain a
second (or possibly more) divisional patent(s) granted later, and meanwhile maintain some
uncertainty on the claims. In the U.S. patent system, continuations and continuations-in-
part can be filed after the examination, and aim precisely at adding more claims to a patent
(Hegde et al. 2009). Filing a first application with narrow claims thus makes it possible for
the applicant to obtain several patents on the same invention, thereby gradually extending
the overall scope of the claims and even, in the case of continuations-in-part, the duration
of the patent family.16 It must finally be noted that filing divisional and continuing
applications is costly for the applicants, who incur the related examination and represen-
tation fees. They are thus patenting strategies used selectively by applicants depending on
the economic value of the invention and the potential competition.
A look inside patents families
In this section, we take a historical look at the use of domestic (i.e. second domestic filings)
and foreign extensions in the major patent offices over the past decades. The source of our
data is the Worldwide Patent Statistical Database (PATSTAT, October 2016 edition),
developed by the European Patent Office (EPO). PATSTAT was first published in 2006
and is updated bi-annually. The richness of the database comes from its unique
15 It is even possible to file another (post-PCT) application in the priority country.16 For example, inventor Jerome Lemelson filed a series of continuations over thirty years to get a verybroad patent on bar code readers. This patent was issued in 1984, long after bar code readers had become anintegral part of the U.S. economy. Jerome Lemelson was then able to collect over a billion dollars in licensefees from large companies using bar code readers. Lemelson had taken advantage of the facts (bothabolished now in US patent law) that (1) a patent, once issued, lasted for 17 years from the date of issue, and(2) applications were kept secret until granted (Lemley and Moore 2004).
802 Scientometrics (2017) 111:793–828
123

geographical coverage: it gathers data from almost all of the world’s patent offices and
contains over 87 million patent documents. Consequently, it is the first truly global patent
database available to the research community. It should be noted that only applications that
are maintained until the publication of 18 months after the priority filing date are stored.
The PATSTAT database includes information on different linkages between patent
applications: PCT linkages (table 201), Paris Convention priorities (table 204), domestic
priorities—e.g. continuations, continuations in part, provisionals, divisionals—(table 216),
and technical relations, which are established by examiners (table 205). These various
linkages are used to group patent applications into patent families, available in the DOCDB
patent families table.17 The DOCDB table includes over 87 million patent applications
grouped in 63 million families18 and is originally intended for examiners to search for prior
art and to carry out their examination of novelty. As a consequence, each DOCDB patent
family includes all the documents protecting the same invention in different patent offices
and allows retrieving information on the date of first filing (priority), the priority office, the
date of individual filings in each office, etc.
Domestic priorities and domestic extensions
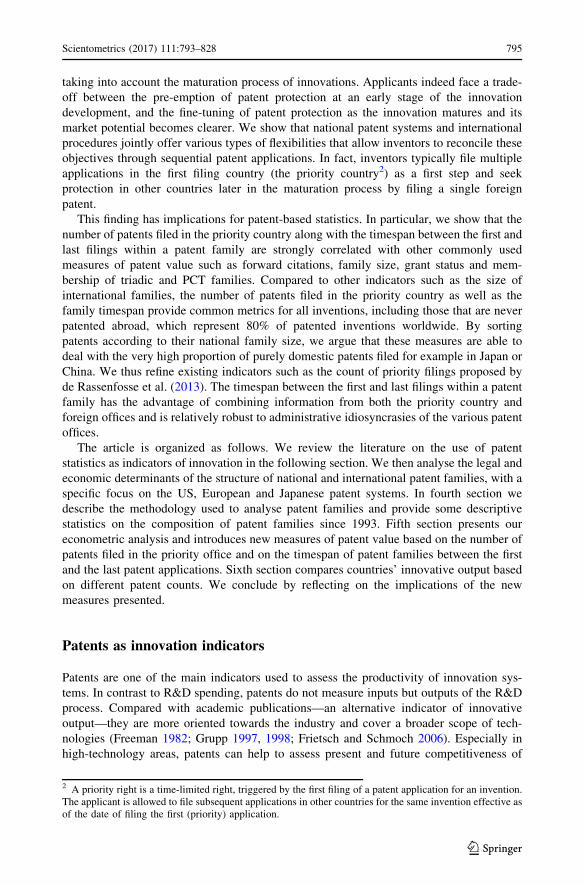
At its most basic level, a domestic patent family includes only one patent. However, it can
also include one initial patent, which can be seen as the domestic priority, and a set of
subsequent patent applications filed in the same office (including continuations or divi-
sional applications), which are available in the ‘‘continuations’’ table of PATSTAT. An
example of such a patent family is shown in Fig. 1.
Table 1 shows the number of domestic extensions per patent family in the three major
patent offices for the period 1993–2010. The use of domestic extensions is most frequent at
the USPTO, where the average family includes 0.24 domestic extensions, most of these
being continuations. The number of continuations per parent application is highly
heterogeneous. The data reveal that some patents have several hundreds of continuations
(the maximum recorded in PATSTAT for a single DOCDB family being 468 continua-
tions). Moreover, the distribution is skewed. Among patents having continuations, roughly
70% of them have only one continuation and 15% have three or more continuations. This
distribution seems similar to that of the value of patents as suggested by various other value
indicators (Scherer 1965; Pakes and Schankerman 1984; Pakes 1986; Griliches 1990).
Alongside continuations, US patent families also include continuations-in-part and divi-
sional applications, although used less frequently.19
Divisional applications are relatively less frequent at the EPO with a patent family
having on average 0.07 divisional at the EPO and 0.03 at the JPO. Note that PATSTAT
does not have a complete information on divisionals filed at the JPO (Martinez 2010), but
17 According to the PATSTAT Data Catalog, applications sharing the same DOCDB family identifier‘‘most probably share exactly the same priorities (Paris Convention or technical relation) as intable TLS204_PRIOR_APPLN, TLS205_TECH_REL and tls216_APPLN_CONTN.’’ The terms ‘‘mostprobably’’ stem from the fact that patent examiners may add a patent application to a DOCDB family even ifit hasn’t claimed priority over one of the family’s patents if they consider that the application does in factbelongs to the family (for example because they share the same technical content and the same applicant, orbecause they result from PCT applications).18 Obviously, many families include only one patent, hence the very large total number of families.19 Note that some domestic extensions are both recorded as continuation and as continuation-in-part, so thatthe sum of continuations, continuations in part and divisional applications is greater than the total number ofextensions.
Scientometrics (2017) 111:793–828 803
123

we obtained information on JPO divisionals directly from the JPO and added those to
PATSTAT’s continuation table, so that our coverage of JPO divisionals should be com-
prehensive, at least until 2005—for this reason, the descriptive statistics presented in
Table 1 as well as in Fig. 2 are presented for the period 1993–2005 only. This result runs
counter to the common belief that applicants at JPO make heavy use of divisional appli-
cations. This does not contradict the fact that JPO patent applications tend to be narrow in
scope as this is not observable in domestic patent families. No formal link between patents
may be reported, so that patent applications related to the same underlying invention may
Priority Domestic subsequent applications
Priority office
P1 D4 D3 D2
Fig. 1 Domestic extensions
Table 1 Number of domesticextensions per patent family forthe main patent offices,1993–2010
Mean SD Median Min Max
USPTO families (n = 4,278,457)
All domestic extensions 0.238 0.847 0 0 468
Continuations 0.123 0.663 0 0 468
Continuations in part 0.077 0.435 0 0 152
Divisionals 0.085 0.508 0 0 382
JPO families (n = 5,147,872)
Divisionals 0.031 0.407 0 0 106
EPO families (n = 1,088,435)
Divisionals 0.070 0.382 0 0 43
0
0.05
0.1
0.15
0.2
0.25
0.3
Dom
estic
ext
ensi
ons
per
fam
ily
1995 2000 2005 2010Year
EPO JPO USPTO
Fig. 2 Average number of domestic extensions (divisionals and continuations) per patent family for themain patent offices (1993–2010)
804 Scientometrics (2017) 111:793–828
123

be represented as members of different patent families. International patent families can
help us investigate this further, and we do this in the next subsection.
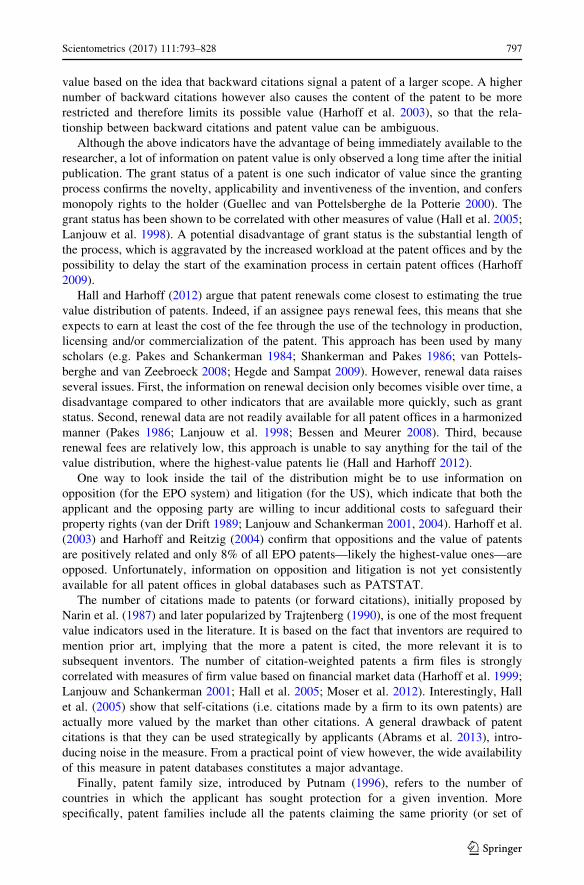
Figure 2 shows the evolution of the number of domestic extensions per patent family
across the main offices between 1993 and 2010. The number of continuations and con-
tinuations-in-part filed at the USPTO peaked at 0.3 domestic extensions per patent family
in 1994. A similar peak is observed by Hegde et al. (2009) for their analysis of continuing
applications at the USPTO. We observe a decrease in the size of U.S. families after 2000.
This can be related to a 1999 U.S. legislation mandating the publication of most appli-
cations 18 months after their submission. This legislation indeed suppressed the possibility
for applicants to use continuations in order extend the period of secrecy prior to the issue of
the patent (see Hegde et al. 2009, for a more extensive discussion of the revisions of the
U.S. continuations regime). There has been an increase in the use of divisional applications
at EPO and JPO in the 1990s, but the numbers have remained very low in both countries
compared to the USPTO.
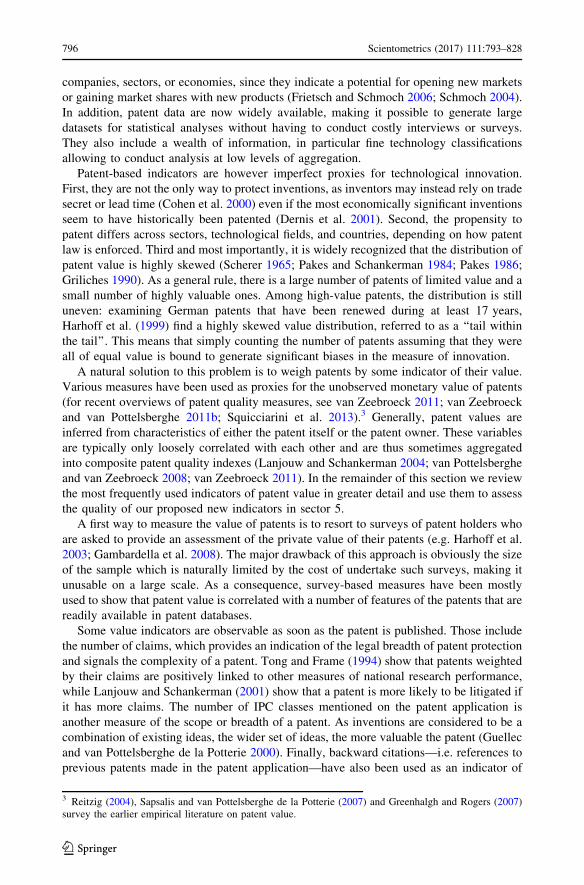
International patents families
International patent families have numerous possible structures (see Martinez 2010, for a
comprehensive overview), but a key feature is that they include patent applications filed in
several patent offices. Figure 3 presents three basic linkages between priority patents filed
in country X and subsequent patents filed in country Y. Case A is the simplest possible
linkage: patent F1 in country Y claims priority over patent P1 in country X.20 P1 and F1
may have been filed through the PCT or through the Paris convention. This is the most
frequent family structure. In case B, two patents (F2 and F3) in country Y claim priority
over the same patent (P2) in country X. In other words, patent P2 has led to (or has been
divided into) two patents F2 and F3 when transferred to country Y. F3 can also be a
divisional or a continuing application from F2. Case C presents the opposite situation:
patents P3 and P4 have been ‘‘merged’’ to form patent S4 in country Y, as S4 claims
priority over both patents P3 and P4. This situation would happen for example if P4 is a
continuation or a divisional patent that followed P3 but preceded F4. In that case, P3 is
(C)(B)(A)
P1 P2 P4 P3
F1 F3 F2 F4
Fig. 3 Basic two-country family structures
20 We cannot check that patents P1 and S1 have exactly identical contents. This would require the help of apatent expert and this work is clearly out of reach given the million records included in the data set.However, we can reasonably assume that the technological content of S1 and P1 is roughly similar.
Scientometrics (2017) 111:793–828 805
123

formally designated as the domestic priority of P4 alongside P3. In that case, the fact that
F4 claims priority over both P3 and P4 means that when F4 is filed, it covers technological
aspects described both in P3 and P4. P4 can also be a patent filed independently from P3—
i.e. which has no formal priority link with P3.
Following the basic principle that each patent family covers a single invention, data on
international patent families reveal how many priority patents cover an average invention
in each country. For example, in cases A and B, the invention is covered by one priority
patent, whereas in case C, it is covered by two patents. Similarly, the data also allow us to
measure how many patents cover the same invention in subsequent countries. For example,
in cases A and C, the invention is covered by one subsequent patent, whereas in case B, it
is covered by two patents.
We now look only at patent families including applications in at least two patent offices
and compare the number of patents in origin and destination countries in international
families. For every DOCDB international patent family, we count the number of patent
applications filed in the priority country and the number of patent applications filed in each
destination country. We use information on application date, Paris convention linkages and
PCT linkages to determine the priority office (in other terms, the ‘‘originating’’ office) of
each DOCDB family.21 This allows us to compare the average number of patents covering
a single invention in priority and subsequent offices. For example, we find that patent
families originating from the US (i.e. having a USPTO priority patent) in 199322 contain on
average 1.66 priority patents and only 1.15 patents in each subsequent patent office. In
contrast, the average family originating from Japan in that same year contains on average
1.37 priority patents, and 1.17 patents in each subsequent patent office.
Table 2 presents the average number of priority and subsequent patents per international
family between 1993 and 2010 for patents originating from the USPTO, JPO and EPO.
Three findings stand out from Table 2. First, for all three offices, the number of priority
patents per patent family always turns out to be higher than the average number of sub-
sequent patents in the destination countries. This result also applies to continuing and
divisional applications, which are more frequent on average in priority offices than in
subsequent offices. Second, the number of subsequent patents in the destination countries is
close to one (and this has hardly changed between 1993 and 2010)., In brief, multiple
applications typically take place as a first step in the priority country, while inventors
usually file close to a unique foreign patent when they seek protection in other offices.
Third, divisional and continuing applications are only one of the ways to cover an
invention by multiple filings in the priority office. In most cases, when several patent
applications are filed in the priority office, there exists no formal link between them. It is
only when the patent application is filed in other offices that it becomes apparent that
multiple applications in the priority office relate to the same invention. This can happen for
example because the foreign patent claims priority over two initial patents as in case C of
Fig. 3.
Table 2 also highlights differences between patent offices. We find that patent families
first filed at the USPTO include 1.89 patents on average, which is higher than at the EPO
(1.67) and the JPO (1.40). This reflects the specificities of national patent systems and
21 For around 5% of patent families, it is not possible to determine with certainty which office is the priorityoffice. We discard these families from our working dataset.22 When a patent family includes several priority applications, we use the earliest filing year of the set ofpriorities as the family’s priority year.
806 Scientometrics (2017) 111:793–828
123
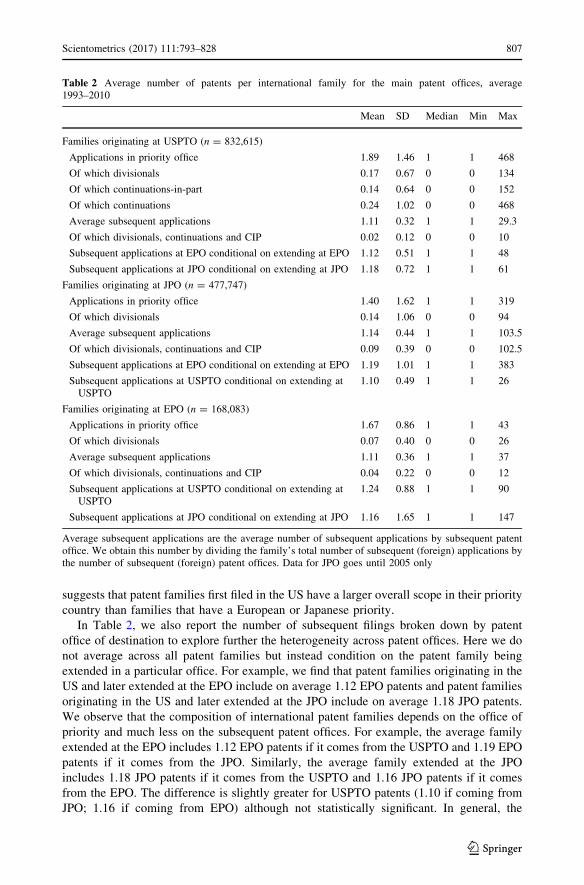
suggests that patent families first filed in the US have a larger overall scope in their priority
country than families that have a European or Japanese priority.
In Table 2, we also report the number of subsequent filings broken down by patent
office of destination to explore further the heterogeneity across patent offices. Here we do
not average across all patent families but instead condition on the patent family being
extended in a particular office. For example, we find that patent families originating in the
US and later extended at the EPO include on average 1.12 EPO patents and patent families
originating in the US and later extended at the JPO include on average 1.18 JPO patents.
We observe that the composition of international patent families depends on the office of
priority and much less on the subsequent patent offices. For example, the average family
extended at the EPO includes 1.12 EPO patents if it comes from the USPTO and 1.19 EPO
patents if it comes from the JPO. Similarly, the average family extended at the JPO
includes 1.18 JPO patents if it comes from the USPTO and 1.16 JPO patents if it comes
from the EPO. The difference is slightly greater for USPTO patents (1.10 if coming from
JPO; 1.16 if coming from EPO) although not statistically significant. In general, the
Table 2 Average number of patents per international family for the main patent offices, average1993–2010
Mean SD Median Min Max
Families originating at USPTO (n = 832,615)
Applications in priority office 1.89 1.46 1 1 468
Of which divisionals 0.17 0.67 0 0 134
Of which continuations-in-part 0.14 0.64 0 0 152
Of which continuations 0.24 1.02 0 0 468
Average subsequent applications 1.11 0.32 1 1 29.3
Of which divisionals, continuations and CIP 0.02 0.12 0 0 10
Subsequent applications at EPO conditional on extending at EPO 1.12 0.51 1 1 48
Subsequent applications at JPO conditional on extending at JPO 1.18 0.72 1 1 61
Families originating at JPO (n = 477,747)
Applications in priority office 1.40 1.62 1 1 319
Of which divisionals 0.14 1.06 0 0 94
Average subsequent applications 1.14 0.44 1 1 103.5
Of which divisionals, continuations and CIP 0.09 0.39 0 0 102.5
Subsequent applications at EPO conditional on extending at EPO 1.19 1.01 1 1 383
Subsequent applications at USPTO conditional on extending atUSPTO
1.10 0.49 1 1 26
Families originating at EPO (n = 168,083)
Applications in priority office 1.67 0.86 1 1 43
Of which divisionals 0.07 0.40 0 0 26
Average subsequent applications 1.11 0.36 1 1 37
Of which divisionals, continuations and CIP 0.04 0.22 0 0 12
Subsequent applications at USPTO conditional on extending atUSPTO
1.24 0.88 1 1 90
Subsequent applications at JPO conditional on extending at JPO 1.16 1.65 1 1 147
Average subsequent applications are the average number of subsequent applications by subsequent patentoffice. We obtain this number by dividing the family’s total number of subsequent (foreign) applications bythe number of subsequent (foreign) patent offices. Data for JPO goes until 2005 only
Scientometrics (2017) 111:793–828 807
123
number of foreign USPTO patents is greater than that of foreign EPO or JPO patents, a
finding consistent with the greater use of domestic extensions at the USPTO.
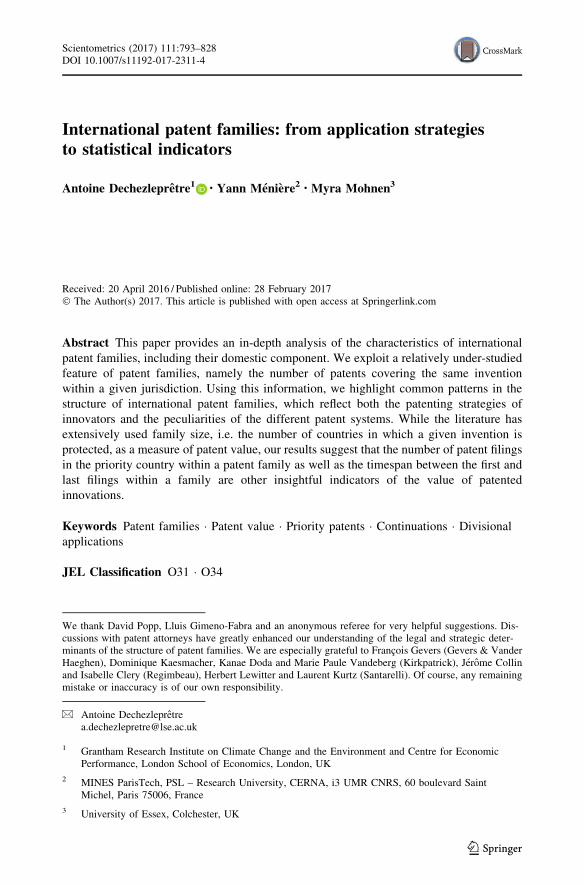
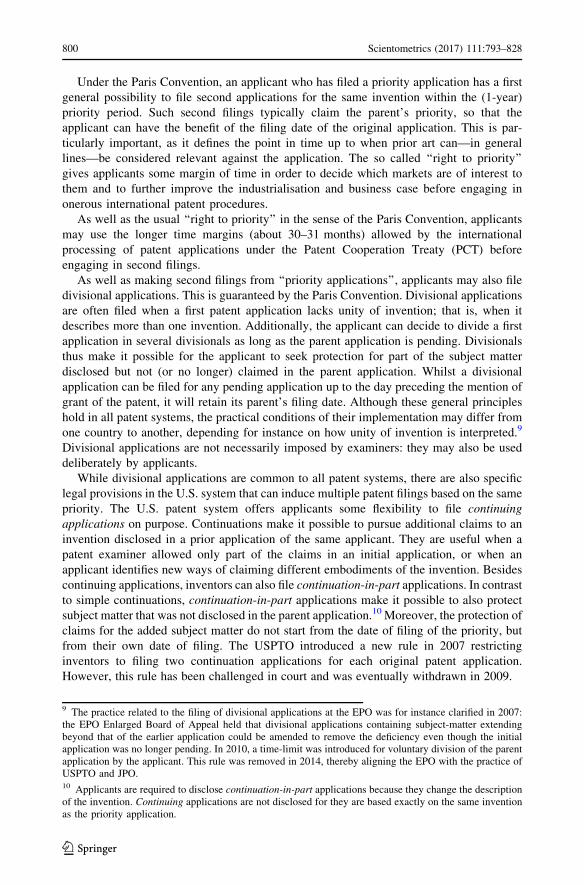
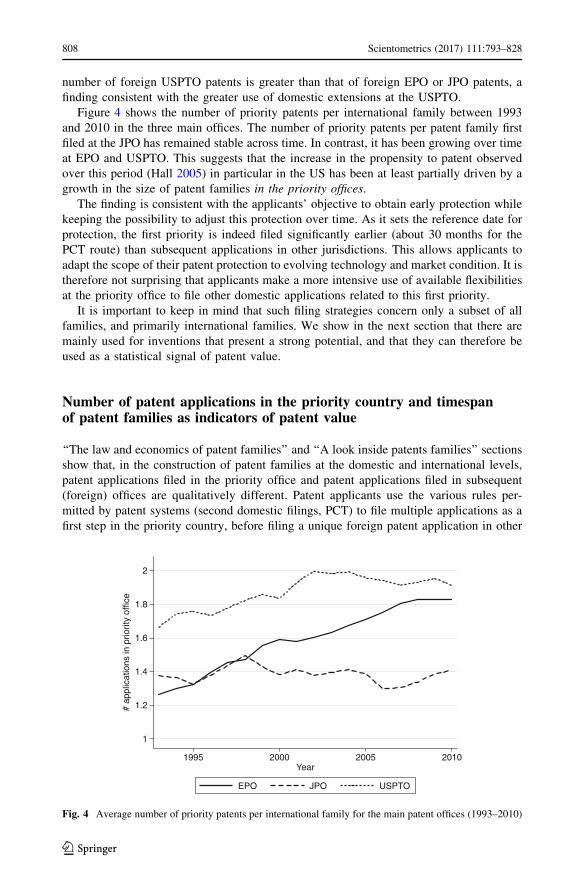
Figure 4 shows the number of priority patents per international family between 1993
and 2010 in the three main offices. The number of priority patents per patent family first
filed at the JPO has remained stable across time. In contrast, it has been growing over time
at EPO and USPTO. This suggests that the increase in the propensity to patent observed
over this period (Hall 2005) in particular in the US has been at least partially driven by a
growth in the size of patent families in the priority offices.
The finding is consistent with the applicants’ objective to obtain early protection while
keeping the possibility to adjust this protection over time. As it sets the reference date for
protection, the first priority is indeed filed significantly earlier (about 30 months for the
PCT route) than subsequent applications in other jurisdictions. This allows applicants to
adapt the scope of their patent protection to evolving technology and market condition. It is
therefore not surprising that applicants make a more intensive use of available flexibilities
at the priority office to file other domestic applications related to this first priority.
It is important to keep in mind that such filing strategies concern only a subset of all
families, and primarily international families. We show in the next section that there are
mainly used for inventions that present a strong potential, and that they can therefore be
used as a statistical signal of patent value.
Number of patent applications in the priority country and timespanof patent families as indicators of patent value
‘‘The law and economics of patent families’’ and ‘‘A look inside patents families’’ sections
show that, in the construction of patent families at the domestic and international levels,
patent applications filed in the priority office and patent applications filed in subsequent
(foreign) offices are qualitatively different. Patent applicants use the various rules per-
mitted by patent systems (second domestic filings, PCT) to file multiple applications as a
first step in the priority country, before filing a unique foreign patent application in other
1
1.2
1.4
1.6
1.8
2
1995 2000 2005 2010Year
EPO JPO USPTO
Fig. 4 Average number of priority patents per international family for the main patent offices (1993–2010)
808 Scientometrics (2017) 111:793–828
123
offices. These options are used to gradually extend the scope of the claims and the duration
of the patent family and to fine-tune the design of the final patent that will be filed in
foreign offices. However, because filing multiple patent applications is costly, we
hypothesize that making use of these various options—at the domestic or international
level—reflects the value of the underlying invention.
The aim of this section is to empirically validate the prediction that the use of divisional
and continuing applications and more generally the number of patents filed in the priority
office within a single patent family is a relevant signal of the value of priority applications.
For this purpose, we empirically examine the relationship between the number of patents
filed in the priority office and common measures of patents value presented in ‘‘Patents as
innovation indicators’’ section (i.e. forward citations, triadic patents, international family
size, etc.). We disaggregate patents filed in the priority office according to their type (i.e.
regular patent applications, divisionals, continuations and continuations-in-part). This
analysis leads us to propose two new indicators of patent value that use both the domestic
and the international aspects of patent families: the total number of members in a given
patent family and the timespan between the first application date and the last application
date within a patent family.
Econometric approach and descriptive statistics
In order to measure the relationship between the number of patents filed in the priority
office within the patent family of priority patent i and various measures of patent value, we
use data on all patent families originating at EPO, USPTO and JPO between 1993 and
2010.23 This includes both domestic-only and international patent families. Following
Zeebroeck and Pottelsberghe (2011a), we estimate models of the following general form:
Vi ¼ f Di;Pi;Xið Þ ð1Þ
where Vi is a measure of the value of priority patent i, Di is the number of patents filed in
the priority office belonging to the patent family of patent i (further disaggregated into
different patent application types, see below), Pi is a vector of characteristics of patent
i and Xi is a vector of other control variables that includes sector, applicant country and
application year fixed effects.
In order to identify the priority patent i within each DOCDB patent family, we combine
information on Paris convention linkages, PCT linkages and application date to identify the
first patent filed in the priority office of each patent family. The focal patent (the unit of
observation in the regressions) is the priority application i.
We use five different measures of patent value for the dependent variable:
• the number of forward citations received by patent i within 5 years from the patent
publication date. We exclude from the citation count citations made by the same
inventors (i.e. self-citations) and citations made by other patents from the same family
(such as citations made by potential divisional and continuation applications);24
23 For the USPTO, only granted patents are included up to 2000.24 Some citations may obviously be missing from the PATSTAT database. We do not know of anyinvestigation of the extent of this potential problem. Generally speaking, since most citations come fromdomestic patents and we focus on focal patents filed at EPO, USPTO and JPO for which the data coverage inPatstat is good, we do not worry too much about this issue. In the presence of classical measurement error,this would lead to attenuation bias, and our point estimates should be seen as a lower bound of the trueestimates.
Scientometrics (2017) 111:793–828 809
123
• the number of patent offices included in patent i’s DOCDB family (i.e. family size);
• whether the patent family of patent i includes PCT applications;
• whether patent i is a member of a triadic patent family (i.e. has been applied for at the
EPO, JPO and USPTO);
• whether patent i has been granted.
The choice of these five measures of patent value is motivated by their wide use in the
literature as well as by their availability across the three offices we cover.
We use different versions of Di, the number of patents filed in the priority office linked
to priority patent i, depending on the patent office:
• the number of divisional applications;
• the number of continuations;
• the number of continuations-in-part;
• the total number of domestic patents, including international claimed priorities
(through PCT or Paris convention), divisional applications, continuations or contin-
uations-in-part.
We include the following characteristics of patent i in the vector Pi:
• the number of inventors listed in the application;
• the number of IPC classes at 8-digit level listed on the patent;
• the number of backward citations.
Finally, the vector Xi includes the following control variables:
• dummy variables for each applicant country (to make things computationally feasible,
we keep only the top 25 applicant countries, representing 99.7% of patent applications);
• dummy variables for 35 technological sectors as defined by Schmoch et al. (2006);
• dummy variables for the application year.
Table 3 presents descriptive statistics of the main variables of interest. The value
measures have the usual skewed distributions discussed in ‘‘Patents as innovation indi-
cators’’ section.
We estimate Eq. (1) using maximum-likelihood estimator with a negative binomial
specification when the dependent variable is a count (i.e. the number of forward citations
and family size) and a probit estimator for the binary indicators (triadic, PCT and granted).
We run regressions separately for the three major priority offices that we consider: EPO,
JPO and USPTO.
Number of patents in the priority country
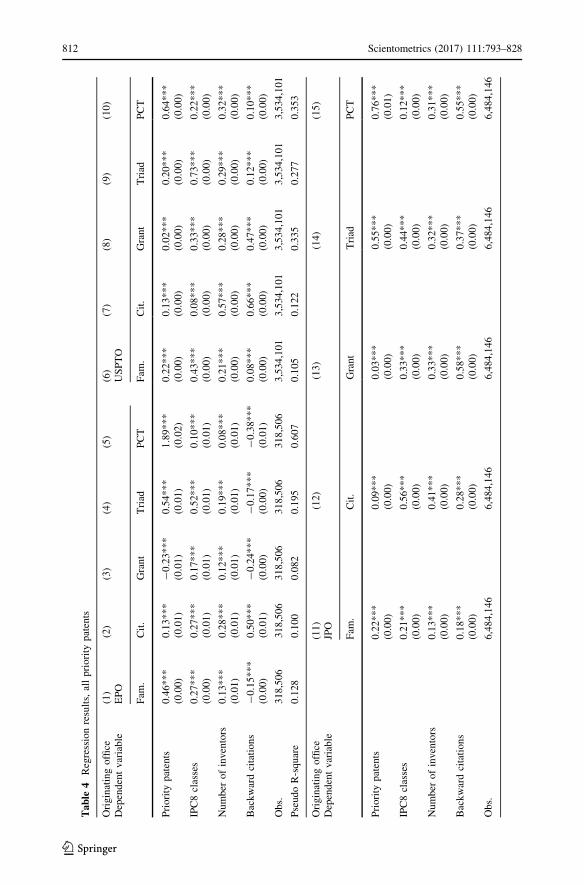
In Table 4 we regress our five measures of patent value on the total number of domestic
patents, be they international claimed priorities (through PCT or Paris convention), divi-
sional applications, continuations or continuations-in-part. Columns (1) to (5) report results
for patents originating from the EPO, columns (6) to (10) for patents originating from the
USPTO and columns (11) to (15) for patents originating from the JPO. We find robust
evidence that the number of patent applications filed in the priority country is positively
correlated with the value of the initial priority patent, as measured by the family size, the
number of citations received, triadic family, grant status and the existence of PCT mem-
bers. The magnitude of the association differs across offices. For example, at the EPO, one
additional patent filed in the priority office is associated with 57% greater family size, 13%
810 Scientometrics (2017) 111:793–828
123

more citations for the initial priority patent and increases the likelihood that the family will
be triadic by 13 percentage points. The respective magnitudes are respectively 22, 13% and
2.2 percentage points for the USPTO and 22, 9% and 3.5 percentage points for the JPO.25
The only remarkable exception to this pattern is that the number of patent applications
filed in the priority country is negatively associated with the probability that the initial
priority patent ultimately becomes granted at the EPO. This implies that, in contrast to the
other offices, the average number of priority patents per patent family first filed at the EPO
is significantly reduced during the examination process in this office.26 A possible
explanation is that at the EPO divisionals are often used to save part of a pending priority
application that is heading towards a refusal.
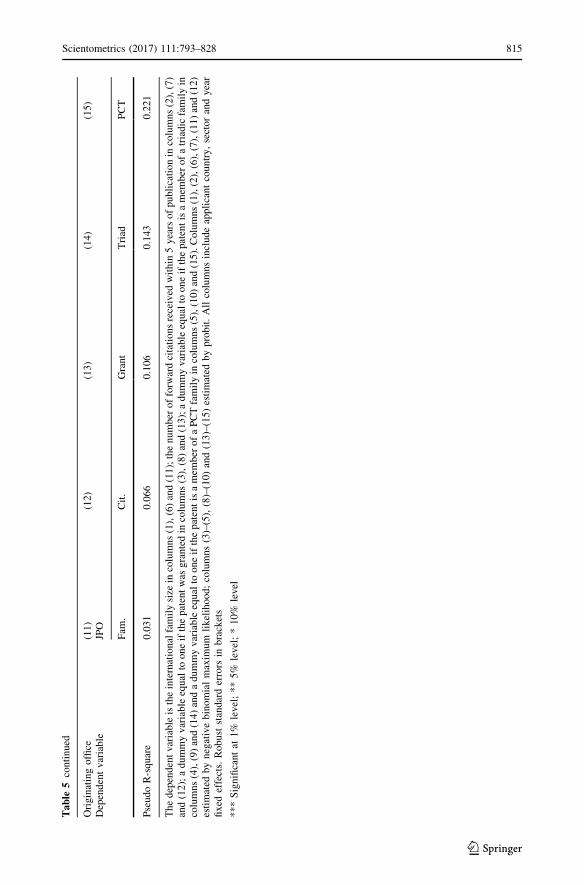
In Tables 5, 6 and 7 we disaggregate priority patents into their domestic components,
i.e. divisional applications (Table 5), continuations (Table 6) and continuations-in-part
(Table 7). We find consistent evidence that the number of divisional applications is pos-
itively associated with greater value of the initial priority application in all patent offices.
This result confirms previous finding that parents of divisional are strongly associated with
a higher patent value (van Zeebroeck and van Pottelsberghe 2011a).
In the US system, we find a strongly significant and positive correlation between all our
measures of patent value for the priority patent and the number of continuations filed after
this patent. In contrast, the number of continuations-in-part is positively associated with the
Table 3 Summary statistics, average 1993–2010
Variable Mean SD Median Min Max
Dependent variables
Forward citations 3.01 9.48 0 0 1334
Family size 1.65 2.30 1 1 66
Granted 0.39 0.49 0 0 1
Triadic 0.06 0.24 0 0 1
PCT 0.11 0.31 0 0 1
Main explanatory variables
Number of domestic patents 1.17 0.71 1 1 468
Number of divisionals 0.04 0.36 0 0 134
Number of continuations 0.04 0.41 0 0 468
Number of continuations in part 0.03 0.28 0 0 152
Timespan 148.12 505.21 0 0 11,120
Control variables
Number of IPC classes at 8-digit level 2.73 2.50 2 1 245
Number of inventors 2.03 1.54 1 1 76
Number of backward citations 4.58 13.14 0 0 1010
N = 10,336,753
25 If we count forward citations at the level of the family instead of at the level of the priority patent, theresults are robust for EPO and USPTO (coefficients are respectively 0.25*** and 0.19***) but not for JPO,for which we find a small but negative coefficient (-0.01***).26 Note that the incentives to delay grant date probably vary across technological fields and types ofapplicants. They are likely to be weaker in fields characterized by quick technological upgrading such as ITand for start-up businesses, for whom possessing a granted patent could increase the likelihood of receivingexternal funding (see Farre-Mensa et al. 2016).
Scientometrics (2017) 111:793–828 811
123
Ta
ble
4Regressionresults,allpriority
patents
Originatingoffice
(1)
(2)
(3)
(4)
(5)
(6)
(7)
(8)
(9)
(10)
Dependentvariable
EPO
USPTO
Fam
.Cit.
Grant
Triad
PCT
Fam
.Cit.
Grant
Triad
PCT
Priority
patents
0.46***
(0.00)
0.13***
(0.01)
-0.23***
(0.01)
0.54***
(0.01)
1.89***
(0.02)
0.22***
(0.00)
0.13***
(0.00)
0.02***
(0.00)
0.20***
(0.00)
0.64***
(0.00)
IPC8classes
0.27***
(0.00)
0.27***
(0.01)
0.17***
(0.01)
0.52***
(0.01)
0.10***
(0.01)
0.43***
(0.00)
0.08***
(0.00)
0.33***
(0.00)
0.73***
(0.00)
0.22***
(0.00)
Number
ofinventors
0.13***
(0.01)
0.28***
(0.01)
0.12***
(0.01)
0.19***
(0.01)
0.08***
(0.01)
0.21***
(0.00)
0.57***
(0.00)
0.28***
(0.00)
0.29***
(0.00)
0.32***
(0.00)
Backwardcitations
-0.15***
(0.00)
0.50***
(0.01)
-0.24***
(0.00)
-0.17***
(0.00)
-0.38***
(0.01)
0.08***
(0.00)
0.66***
(0.00)
0.47***
(0.00)
0.12***
(0.00)
0.10***
(0.00)
Obs.
318,506
318,506
318,506
318,506
318,506
3,534,101
3,534,101
3,534,101
3,534,101
3,534,101
PseudoR-square
0.128
0.100
0.082
0.195
0.607
0.105
0.122
0.335
0.277
0.353
Originatingoffice
(11)
(12)
(13)
(14)
(15)
Dependentvariable
JPO
Fam
.Cit.
Grant
Triad
PCT
Priority
patents
0.22***
(0.00)
0.09***
(0.00)
0.03***
(0.00)
0.55***
(0.00)
0.76***
(0.01)
IPC8classes
0.21***
(0.00)
0.56***
(0.00)
0.33***
(0.00)
0.44***
(0.00)
0.12***
(0.00)
Number
ofinventors
0.13***
(0.00)
0.41***
(0.00)
0.33***
(0.00)
0.32***
(0.00)
0.31***
(0.00)
Backwardcitations
0.18***
(0.00)
0.28***
(0.00)
0.58***
(0.00)
0.37***
(0.00)
0.55***
(0.00)
Obs.
6,484,146
6,484,146
6,484,146
6,484,146
6,484,146
812 Scientometrics (2017) 111:793–828
123

Ta
ble
4continued
Originatingoffice
(11)
(12)
(13)
(14)
(15)
Dependentvariable
JPO
Fam
.Cit.
Grant
Triad
PCT
PseudoR-square
0.040
0.066
0.106
0.202
0.362
Thedependentvariableistheinternationalfamilysize
incolumns(1),(6)and(11);thenumber
offorw
ardcitationsreceived
within
5yearsofpublicationin
columns(2),(7)
and(12);adummyvariableequalto
oneifthepatentwas
grantedin
columns(3),(8)and(13);adummyvariableequalto
oneifthepatentisamem
ber
ofatriadicfamilyin
columns(4),(9)and(14)andadummyvariableequalto
oneifthepatentisamem
ber
ofaPCTfamilyin
columns(5),(10)and(15).Columns(1),(2),(6),(7),(11)and(12)
estimated
bynegativebinomialmaxim
um
likelihood;columns(3)–(5),(8)–(10)and(13)–(15)estimated
byprobit.Allcolumnsincludeapplicantcountry,sectorandyear
fixed
effects.Robuststandarderrors
inbrackets
***Significantat
1%
level;**5%
level;*10%
level
Scientometrics (2017) 111:793–828 813
123

Ta
ble
5Regressionresults,divisional
applications
Originatingoffice
(1)
(2)
(3)
(4)
(5)
(6)
(7)
(8)
(9)
(10)
Dependentvariable
EPO
USPTO
Fam
.Cit.
Grant
Triad
PCT
Fam
.Cit.
Grant
Triad
PCT
Divisionals
0.33***
(0.01)
0.10***
(0.01)
0.26***
(0.01)
0.15***
(0.01)
0.05***
(0.01)
0.07***
(0.00)
0.09***
(0.00)
0.22***
(0.00)
0.03***
(0.00)
0.01***
(0.00)
IPC8classes
0.31***
(0.00)
0.28***
(0.01)
0.12***
(0.01)
0.57***
(0.01)
0.28***
(0.01)
0.49***
(0.00)
0.10***
(0.00)
0.32***
(0.00)
0.78***
(0.00)
0.35***
(0.00)
Number
ofinventors
0.16***
(0.01)
0.29***
(0.01)
0.08***
(0.01)
0.24***
(0.01)
0.23***
(0.01)
0.25***
(0.00)
0.58***
(0.00)
0.27***
(0.00)
0.32***
(0.00)
0.38***
(0.00)
Backwardcitations
-0.15***
(0.00)
0.50***
(0.01)
-0.22***
(0.00)
-0.20***
(0.00)
-0.40***
(0.00)
0.11***
(0.00)
0.68***
(0.00)
0.47***
(0.00)
0.15***
(0.00)
0.18***
(0.00)
Obs.
318,506
318,506
318,506
318,506
318,506
3,534,101
3,534,101
3,534,101
3,534,101
3,534,101
PseudoR-square
0.110
0.099
0.075
0.135
0.381
0.090
0.121
0.337
0.253
0.241
Originatingoffice
(11)
(12)
(13)
(14)
(15)
Dependentvariable
JPO
Fam
.Cit.
Grant
Triad
PCT
Divisionals
0.07***
(0.01)
-0.12***
(0.01)
0.21***
(0.01)
0.35***
(0.01)
0.12***
(0.01)
IPC8classes
0.22***
(0.00)
0.56***
(0.00)
0.33***
(0.00)
0.44***
(0.00)
0.15***
(0.00)
Number
ofinventors
0.14***
(0.00)
0.42***
(0.00)
0.33***
(0.00)
0.33***
(0.00)
0.32***
(0.00)
Backwardcitations
0.20***
(0.00)
0.29***
(0.00)
0.58***
(0.00)
0.40***
(0.00)
0.54***
(0.00)
Obs.
6,484,146
6,484,146
6,484,146
6,484,146
6,484,146
814 Scientometrics (2017) 111:793–828
123
Ta
ble
5continued
Originatingoffice
(11)
(12)
(13)
(14)
(15)
Dependentvariable
JPO
Fam
.Cit.
Grant
Triad
PCT
PseudoR-square
0.031
0.066
0.106
0.143
0.221
Thedependentvariableistheinternationalfamilysize
incolumns(1),(6)and(11);thenumber
offorw
ardcitationsreceived
within
5yearsofpublicationin
columns(2),(7)
and(12);adummyvariableequalto
oneifthepatentwas
grantedin
columns(3),(8)and(13);adummyvariableequalto
oneifthepatentisamem
ber
ofatriadicfamilyin
columns(4),(9)and(14)andadummyvariableequalto
oneifthepatentisamem
ber
ofaPCTfamilyin
columns(5),(10)and(15).Columns(1),(2),(6),(7),(11)and(12)
estimated
bynegativebinomialmaxim
um
likelihood;columns(3)–(5),(8)–(10)and(13)–(15)estimated
byprobit.Allcolumnsincludeapplicantcountry,sectorandyear
fixed
effects.Robuststandarderrors
inbrackets
***Significantat
1%
level;**5%
level;*10%
level
Scientometrics (2017) 111:793–828 815
123

Table 6 Regression results, continuations applications
Originating office (1) (2) (3) (4) (5)Dependent variable USPTO
Fam. Cit. Grant Triad PCT
Continuations 0.06***(0.00)
0.13***(0.00)
0.10***(0.01)
0.02***(0.00)
0.05***(0.00)
IPC8 classes 0.49***(0.00)
0.10***(0.00)
0.32***(0.00)
0.78***(0.00)
0.34***(0.00)
Number of inventors 0.25***(0.00)
0.58***(0.00)
0.27***(0.00)
0.32***(0.00)
0.38***(0.00)
Backward citations 0.11***(0.00)
0.67***(0.00)
0.47***(0.00)
0.15***(0.00)
0.18***(0.00)
Obs. 3,534,101 3,534,101 3,534,101 3,534,101 3,534,101
Pseudo R-square 0.091 0.122 0.335 0.253 0.241
The dependent variable is the international family size in column (1); the number of forward citationsreceived within 5 years of publication in column (2); a dummy variable equal to one if the patent wasgranted in column (3); a dummy variable equal to one if the patent is a member of a triadic family in column(4) and a dummy variable equal to one if the patent is a member of a PCT family in column (5). Column (1)and (2) estimated by negative binomial maximum likelihood; columns (3)–(5) estimated by probit. Allcolumns include applicant country, sector and year fixed effects. Robust standard errors in brackets
*** Significant at 1% level; ** 5% level; * 10% level
Table 7 Regression results, continuations-in-part
Originating office (1) (2) (3) (4) (5)Dependent variable USPTO
Fam. Cit. Grant Triad PCT
Continuations-in-part -0.05***(0.00)
0.07***(0.00)
0.08***(0.00)
-0.12***(0.01)
-0.05***(0.00)
IPC8 classes 0.50***(0.00)
0.11***(0.00)
0.33***(0.00)
0.80***(0.00)
0.35***(0.00)
Number of inventors 0.25***(0.00)
0.59***(0.00)
0.28***(0.00)
0.33***(0.00)
0.39***(0.00)
Backward citations 0.12***(0.00)
0.68***(0.00)
0.47***(0.00)
0.16***(0.00)
0.19***(0.00)
Obs. 3,534,101 3,534,101 3,534,101 3,534,101 3,534,101
Pseudo R-square 0.090 0.121 0.335 0.255 0.241
The dependent variable is the international family size in column (1); the number of forward citationsreceived within 5 years of publication in column (2); a dummy variable equal to one if the patent wasgranted in column (3); a dummy variable equal to one if the patent is a member of a triadic family in column(4) and a dummy variable equal to one if the patent is a member of a PCT family in column (5). Column (1)and (2) estimated by negative binomial maximum likelihood; columns (3)–(5) estimated by probit. Allcolumns include applicant country, sector and year fixed effects. Robust standard errors in brackets
*** Significant at 1% level; ** 5% level; * 10% level
816 Scientometrics (2017) 111:793–828
123
number of forward citations and with grant status but is negatively associated with family
size, triadic status and the presence of PCT members. These results are in line with the
findings by Hegde et al. (2009) who find important differences in the relation between
patent value and each of the three different types of USPTO filings considered (continu-
ations, continuations in part and divisionals). A possible explanation may be that contin-
uations and continuations-in-part cannot always be used as a priority for subsequent filings
in foreign jurisdictions.
Our baseline results presented in Tables 4, 5, 6 and 7 account for differences in the
propensity to patent not only across patent offices but also among technologies or sectors
by including fixed effects for 35 technological sectors. However, the results presented
above report average conditional correlations across all sectors. In order to examine the
heterogeneity across sectors, we separately estimate Eq. (1) for the IT, medical and
transport sectors, which cover a wide variety of patent uses. The IT sector is characterized
by complex technologies with short product cycles, and by an intensive use of patents for
strategic purposes (such as blocking or use in negotiations) that go beyond the mere
prevention of imitation. By contrast, the medical industry is characterized by long product
cycles, and uses patents mainly for protection purposes. The transportation sector is more
traditional and stands in an intermediate position (Cohen et al. 2000).
Results are presented in Table 8. All columns include the previous controls (the number
of IPC8 classes, the number of inventors, the number of backward citations as well as
applicant country, sector and year fixed effects) but coefficients for these variables are not
reported for brevity. For the same reason, we combine divisionals, continuations and
continuations-in-part in a single variable (this only affects the USPTO, since the latter two
types of patent applications are only available there).
The main takeaway messages from Table 8 are that the results presented above are
robust to considering individual sectors and that there is little heterogeneity across tech-
nological fields. In all three sectors, the number of patents filed in the priority office within
a patent family is positively correlated with the value of the initial priority application. The
only exception is again a negative and significant correlation between the number of
priority patents and the likelihood that the initial priority patent gets granted. This negative
relationship stands out at the EPO, and can be observed to a lesser extent at the USPTO, for
all three sectors. The magnitude of the coefficients is generally similar across sectors,
except at JPO where it is smaller in the transportation sector.
Similarly, in all three sectors, the number of domestic extensions (divisionals, contin-
uations and continuations-in-part) is positively correlated with the value of the initial
priority application. This positive relationship seems particularly strong for the trans-
portation sector at the EPO and the USPTO. By contrast, the use of divisional and con-
tinuation applications seems less strongly correlated with patent value in the IT and
medical sectors at these two offices, but not at the JPO.
Family timespan
The results from the previous section provide strong evidence that the number of patent
applications filed in the priority country is a relevant signal of the value of the invention
initially protected by the first priority application. Filing multiple applications allows
applicants to gradually adjust the overall scope of the patent family and, with continua-
tions-in-part, to extend their duration. At the international level, patent applicants make use
of other existing options, in particular the PCT route which opens a 30-months window, to
fine-tune the design of the patents that will be applied for in foreign countries.
Scientometrics (2017) 111:793–828 817
123
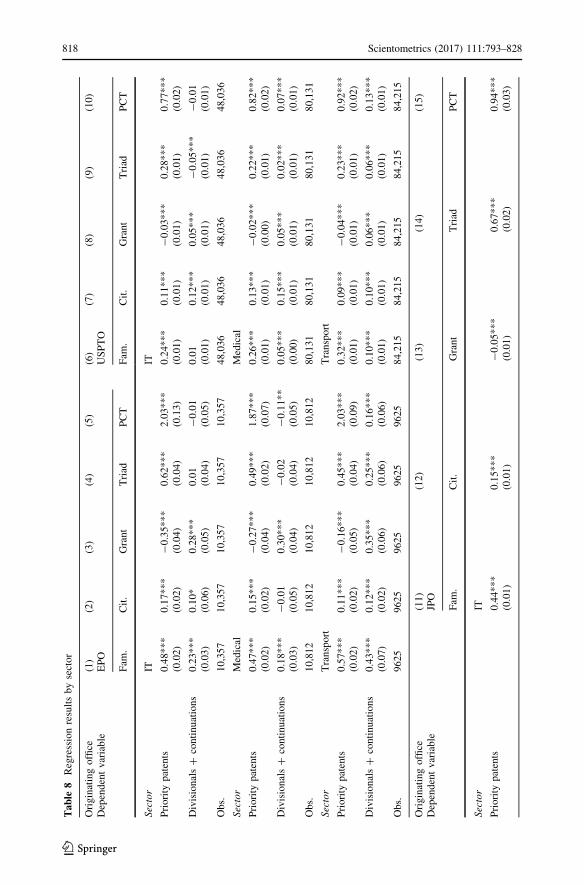
Ta
ble
8Regressionresultsbysector
Originatingoffice
(1)
(2)
(3)
(4)
(5)
(6)
(7)
(8)
(9)
(10)
Dependentvariable
EPO
USPTO
Fam
.Cit.
Grant
Triad
PCT
Fam
.Cit.
Grant
Triad
PCT
Sector
ITIT
Priority
patents
0.48***
(0.02)
0.17***
(0.02)
-0.35***
(0.04)
0.62***
(0.04)
2.03***
(0.13)
0.24***
(0.01)
0.11***
(0.01)
-0.03***
(0.01)
0.28***
(0.01)
0.77***
(0.02)
Divisionals?
continuations
0.23***
(0.03)
0.10*
(0.06)
0.28***
(0.05)
0.01
(0.04)
-0.01
(0.05)
0.01
(0.01)
0.12***
(0.01)
0.05***
(0.01)
-0.05***
(0.01)
-0.01
(0.01)
Obs.
10,357
10,357
10,357
10,357
10,357
48,036
48,036
48,036
48,036
48,036
Sector
Medical
Medical
Priority
patents
0.47***
(0.02)
0.15***
(0.02)
-0.27***
(0.04)
0.49***
(0.02)
1.87***
(0.07)
0.26***
(0.01)
0.13***
(0.01)
-0.02***
(0.00)
0.22***
(0.01)
0.82***
(0.02)
Divisionals?
continuations
0.18***
(0.03)
-0.01
(0.05)
0.30***
(0.04)
-0.02
(0.04)
-0.11**
(0.05)
0.05***
(0.00)
0.15***
(0.01)
0.05***
(0.01)
0.02***
(0.01)
0.07***
(0.01)
Obs.
10,812
10,812
10,812
10,812
10,812
80,131
80,131
80,131
80,131
80,131
Sector
Transport
Transport
Priority
patents
0.57***
(0.02)
0.11***
(0.02)
-0.16***
(0.05)
0.45***
(0.04)
2.03***
(0.09)
0.32***
(0.01)
0.09***
(0.01)
-0.04***
(0.01)
0.23***
(0.01)
0.92***
(0.02)
Divisionals?
continuations
0.43***
(0.07)
0.12***
(0.02)
0.35***
(0.06)
0.25***
(0.06)
0.16***
(0.06)
0.10***
(0.01)
0.10***
(0.01)
0.06***
(0.01)
0.06***
(0.01)
0.13***
(0.01)
Obs.
9625
9625
9625
9625
9625
84,215
84,215
84,215
84,215
84,215
Originatingoffice
(11)
(12)
(13)
(14)
(15)
Dependentvariable
JPO
Fam
.Cit.
Grant
Triad
PCT
Sector
IT
Priority
patents
0.44***
(0.01)
0.15***
(0.01)
-0.05***
(0.01)
0.67***
(0.02)
0.94***
(0.03)
818 Scientometrics (2017) 111:793–828
123
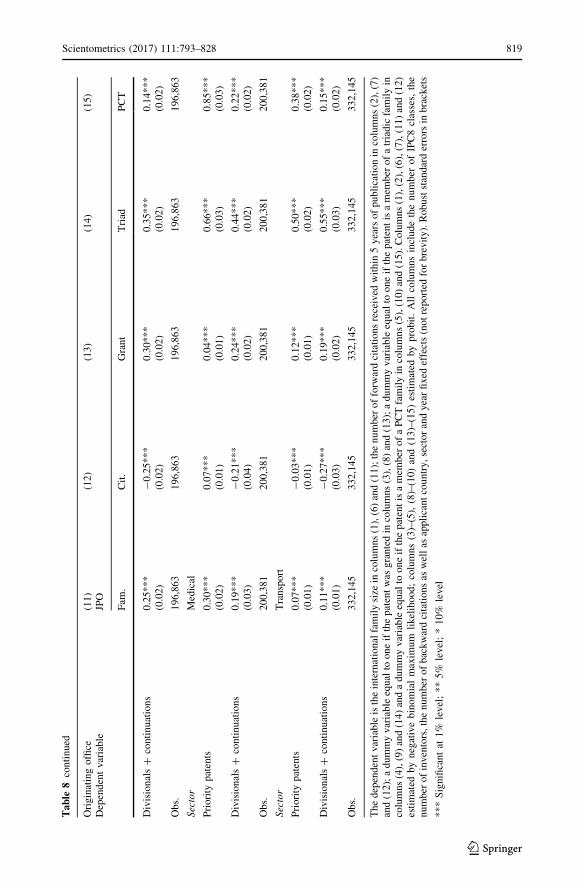
Ta
ble
8continued
Originatingoffice
(11)
(12)
(13)
(14)
(15)
Dependentvariable
JPO
Fam
.Cit.
Grant
Triad
PCT
Divisionals?
continuations
0.25***
(0.02)
-0.25***
(0.02)
0.30***
(0.02)
0.35***
(0.02)
0.14***
(0.02)
Obs.
196,863
196,863
196,863
196,863
196,863
Sector
Medical
Priority
patents
0.30***
(0.02)
0.07***
(0.01)
0.04***
(0.01)
0.66***
(0.03)
0.85***
(0.03)
Divisionals?
continuations
0.19***
(0.03)
-0.21***
(0.04)
0.24***
(0.02)
0.44***
(0.02)
0.22***
(0.02)
Obs.
200,381
200,381
200,381
200,381
200,381
Sector
Transport
Priority
patents
0.07***
(0.01)
-0.03***
(0.01)
0.12***
(0.01)
0.50***
(0.02)
0.38***
(0.02)
Divisionals?
continuations
0.11***
(0.01)
-0.27***
(0.03)
0.19***
(0.02)
0.55***
(0.03)
0.15***
(0.02)
Obs.
332,145
332,145
332,145
332,145
332,145
Thedependentvariableistheinternationalfamilysize
incolumns(1),(6)and(11);thenumber
offorw
ardcitationsreceived
within
5yearsofpublicationin
columns(2),(7)
and(12);adummyvariableequalto
oneifthepatentwas
grantedin
columns(3),(8)and(13);adummyvariableequalto
oneifthepatentisamem
ber
ofatriadicfamilyin
columns(4),(9)and(14)andadummyvariableequalto
oneifthepatentisamem
ber
ofaPCTfamilyin
columns(5),(10)and(15).Columns(1),(2),(6),(7),(11)and(12)
estimated
bynegativebinomialmaxim
um
likelihood;columns(3)–(5),(8)–(10)and(13)–(15)estimated
byprobit.Allcolumnsincludethenumber
ofIPC8classes,
the
number
ofinventors,thenumber
ofbackwardcitationsas
wellas
applicantcountry,sectorandyearfixed
effects(notreported
forbrevity).Robuststandarderrorsin
brackets
***Significantat
1%
level;**5%
level;*10%
level
Scientometrics (2017) 111:793–828 819
123
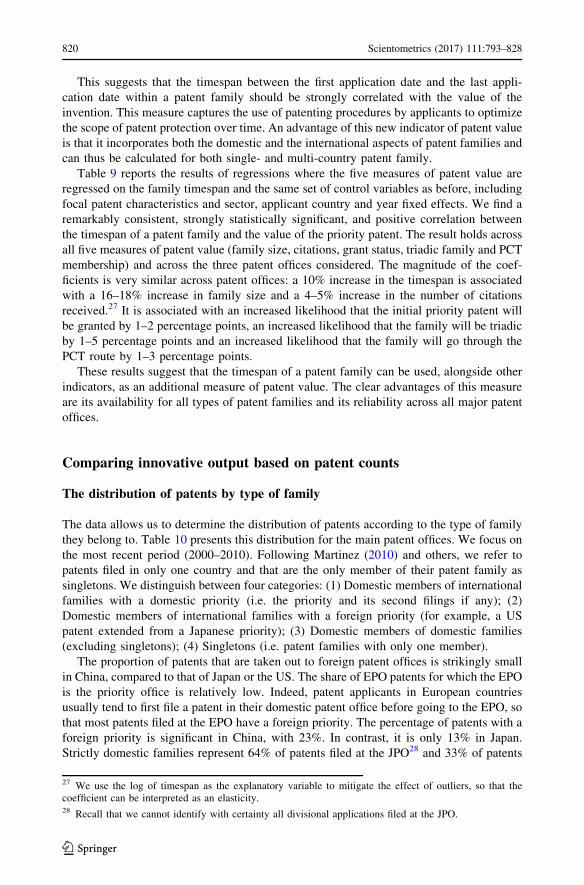
This suggests that the timespan between the first application date and the last appli-
cation date within a patent family should be strongly correlated with the value of the
invention. This measure captures the use of patenting procedures by applicants to optimize
the scope of patent protection over time. An advantage of this new indicator of patent value
is that it incorporates both the domestic and the international aspects of patent families and
can thus be calculated for both single- and multi-country patent family.
Table 9 reports the results of regressions where the five measures of patent value are
regressed on the family timespan and the same set of control variables as before, including
focal patent characteristics and sector, applicant country and year fixed effects. We find a
remarkably consistent, strongly statistically significant, and positive correlation between
the timespan of a patent family and the value of the priority patent. The result holds across
all five measures of patent value (family size, citations, grant status, triadic family and PCT
membership) and across the three patent offices considered. The magnitude of the coef-
ficients is very similar across patent offices: a 10% increase in the timespan is associated
with a 16–18% increase in family size and a 4–5% increase in the number of citations
received.27 It is associated with an increased likelihood that the initial priority patent will
be granted by 1–2 percentage points, an increased likelihood that the family will be triadic
by 1–5 percentage points and an increased likelihood that the family will go through the
PCT route by 1–3 percentage points.
These results suggest that the timespan of a patent family can be used, alongside other
indicators, as an additional measure of patent value. The clear advantages of this measure
are its availability for all types of patent families and its reliability across all major patent
offices.
Comparing innovative output based on patent counts
The distribution of patents by type of family
The data allows us to determine the distribution of patents according to the type of family
they belong to. Table 10 presents this distribution for the main patent offices. We focus on
the most recent period (2000–2010). Following Martinez (2010) and others, we refer to
patents filed in only one country and that are the only member of their patent family as
singletons. We distinguish between four categories: (1) Domestic members of international
families with a domestic priority (i.e. the priority and its second filings if any); (2)
Domestic members of international families with a foreign priority (for example, a US
patent extended from a Japanese priority); (3) Domestic members of domestic families
(excluding singletons); (4) Singletons (i.e. patent families with only one member).
The proportion of patents that are taken out to foreign patent offices is strikingly small
in China, compared to that of Japan or the US. The share of EPO patents for which the EPO
is the priority office is relatively low. Indeed, patent applicants in European countries
usually tend to first file a patent in their domestic patent office before going to the EPO, so
that most patents filed at the EPO have a foreign priority. The percentage of patents with a
foreign priority is significant in China, with 23%. In contrast, it is only 13% in Japan.
Strictly domestic families represent 64% of patents filed at the JPO28 and 33% of patents
27 We use the log of timespan as the explanatory variable to mitigate the effect of outliers, so that thecoefficient can be interpreted as an elasticity.28 Recall that we cannot identify with certainty all divisional applications filed at the JPO.
820 Scientometrics (2017) 111:793–828
123
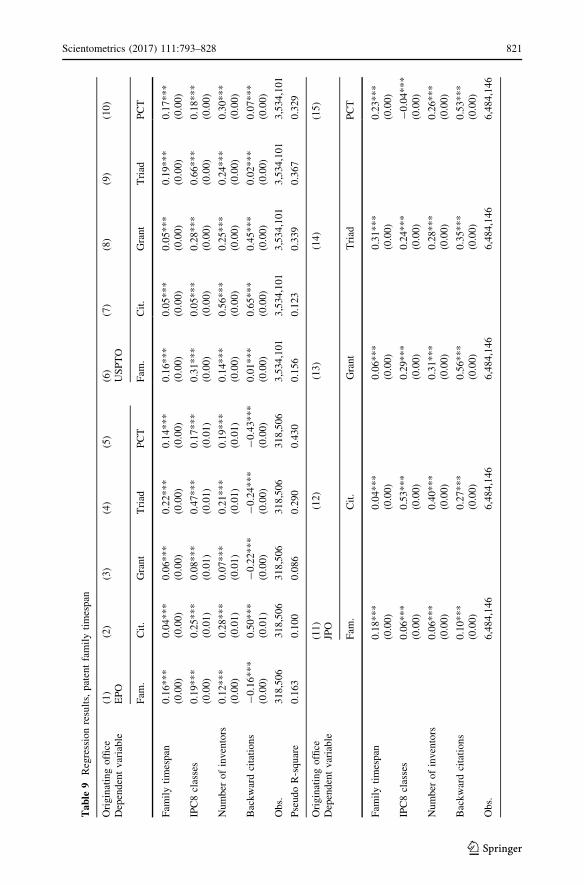
Ta
ble
9Regressionresults,patentfamilytimespan
Originatingoffice
(1)
(2)
(3)
(4)
(5)
(6)
(7)
(8)
(9)
(10)
Dependentvariable
EPO
USPTO
Fam
.Cit.
Grant
Triad
PCT
Fam
.Cit.
Grant
Triad
PCT
Fam
ilytimespan
0.16***
(0.00)
0.04***
(0.00)
0.06***
(0.00)
0.22***
(0.00)
0.14***
(0.00)
0.16***
(0.00)
0.05***
(0.00)
0.05***
(0.00)
0.19***
(0.00)
0.17***
(0.00)
IPC8classes
0.19***
(0.00)
0.25***
(0.01)
0.08***
(0.01)
0.47***
(0.01)
0.17***
(0.01)
0.31***
(0.00)
0.05***
(0.00)
0.28***
(0.00)
0.66***
(0.00)
0.18***
(0.00)
Number
ofinventors
0.12***
(0.00)
0.28***
(0.01)
0.07***
(0.01)
0.21***
(0.01)
0.19***
(0.01)
0.14***
(0.00)
0.56***
(0.00)
0.25***
(0.00)
0.24***
(0.00)
0.30***
(0.00)
Backwardcitations
-0.16***
(0.00)
0.50***
(0.01)
-0.22***
(0.00)
-0.24***
(0.00)
-0.43***
(0.00)
0.01***
(0.00)
0.65***
(0.00)
0.45***
(0.00)
0.02***
(0.00)
0.07***
(0.00)
Obs.
318,506
318,506
318,506
318,506
318,506
3,534,101
3,534,101
3,534,101
3,534,101
3,534,101
PseudoR-square
0.163
0.100
0.086
0.290
0.430
0.156
0.123
0.339
0.367
0.329
Originatingoffice
(11)
(12)
(13)
(14)
(15)
Dependentvariable
JPO
Fam
.Cit.
Grant
Triad
PCT
Fam
ilytimespan
0.18***
(0.00)
0.04***
(0.00)
0.06***
(0.00)
0.31***
(0.00)
0.23***
(0.00)
IPC8classes
0.06***
(0.00)
0.53***
(0.00)
0.29***
(0.00)
0.24***
(0.00)
-0.04***
(0.00)
Number
ofinventors
0.06***
(0.00)
0.40***
(0.00)
0.31***
(0.00)
0.28***
(0.00)
0.26***
(0.00)
Backwardcitations
0.10***
(0.00)
0.27***
(0.00)
0.56***
(0.00)
0.35***
(0.00)
0.53***
(0.00)
Obs.
6,484,146
6,484,146
6,484,146
6,484,146
6,484,146
Scientometrics (2017) 111:793–828 821
123
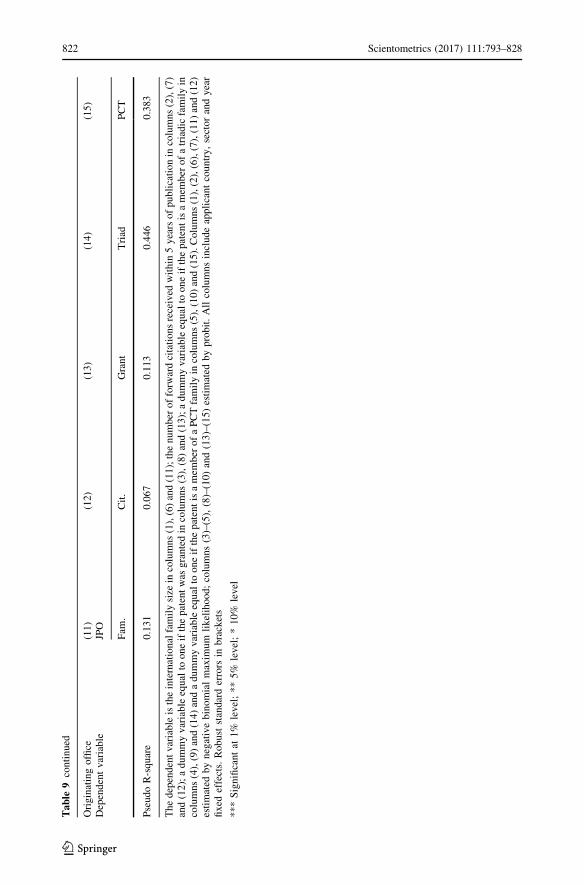
Ta
ble
9continued
Originatingoffice
(11)
(12)
(13)
(14)
(15)
Dependentvariable
JPO
Fam
.Cit.
Grant
Triad
PCT
PseudoR-square
0.131
0.067
0.113
0.446
0.383
Thedependentvariableistheinternationalfamilysize
incolumns(1),(6)and(11);thenumber
offorw
ardcitationsreceived
within
5yearsofpublicationin
columns(2),(7)
and(12);adummyvariableequalto
oneifthepatentwas
grantedin
columns(3),(8)and(13);adummyvariableequalto
oneifthepatentisamem
ber
ofatriadicfamilyin
columns(4),(9)and(14)andadummyvariableequalto
oneifthepatentisamem
ber
ofaPCTfamilyin
columns(5),(10)and(15).Columns(1),(2),(6),(7),(11)and(12)
estimated
bynegativebinomialmaxim
um
likelihood;columns(3)–(5),(8)–(10)and(13)–(15)estimated
byprobit.Allcolumnsincludeapplicantcountry,sectorandyear
fixed
effects.Robuststandarderrors
inbrackets
***Significantat
1%
level;**5%
level;*10%
level
822 Scientometrics (2017) 111:793–828
123
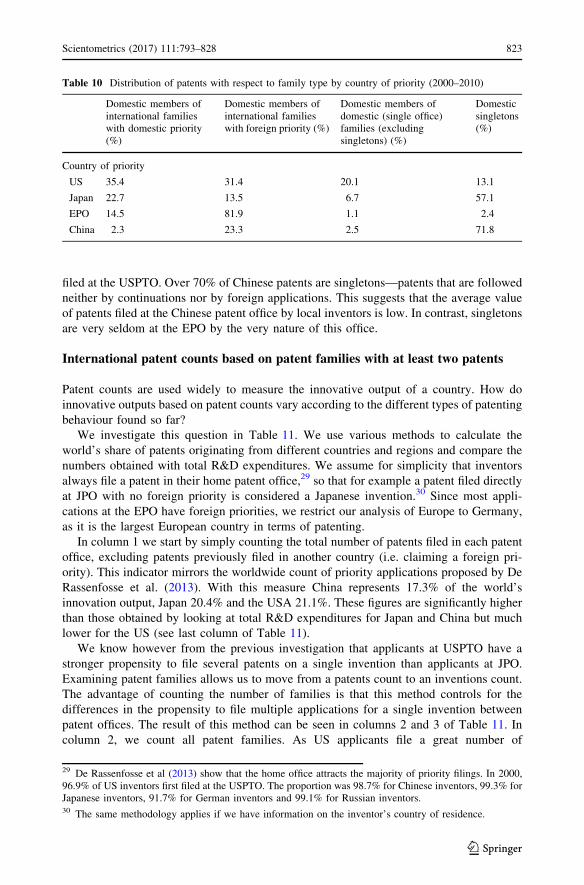
filed at the USPTO. Over 70% of Chinese patents are singletons—patents that are followed
neither by continuations nor by foreign applications. This suggests that the average value
of patents filed at the Chinese patent office by local inventors is low. In contrast, singletons
are very seldom at the EPO by the very nature of this office.
International patent counts based on patent families with at least two patents
Patent counts are used widely to measure the innovative output of a country. How do
innovative outputs based on patent counts vary according to the different types of patenting
behaviour found so far?
We investigate this question in Table 11. We use various methods to calculate the
world’s share of patents originating from different countries and regions and compare the
numbers obtained with total R&D expenditures. We assume for simplicity that inventors
always file a patent in their home patent office,29 so that for example a patent filed directly
at JPO with no foreign priority is considered a Japanese invention.30 Since most appli-
cations at the EPO have foreign priorities, we restrict our analysis of Europe to Germany,
as it is the largest European country in terms of patenting.
In column 1 we start by simply counting the total number of patents filed in each patent
office, excluding patents previously filed in another country (i.e. claiming a foreign pri-
ority). This indicator mirrors the worldwide count of priority applications proposed by De
Rassenfosse et al. (2013). With this measure China represents 17.3% of the world’s
innovation output, Japan 20.4% and the USA 21.1%. These figures are significantly higher
than those obtained by looking at total R&D expenditures for Japan and China but much
lower for the US (see last column of Table 11).
We know however from the previous investigation that applicants at USPTO have a
stronger propensity to file several patents on a single invention than applicants at JPO.
Examining patent families allows us to move from a patents count to an inventions count.
The advantage of counting the number of families is that this method controls for the
differences in the propensity to file multiple applications for a single invention between
patent offices. The result of this method can be seen in columns 2 and 3 of Table 11. In
column 2, we count all patent families. As US applicants file a great number of
Table 10 Distribution of patents with respect to family type by country of priority (2000–2010)
Domestic members ofinternational familieswith domestic priority(%)
Domestic members ofinternational familieswith foreign priority (%)
Domestic members ofdomestic (single office)families (excludingsingletons) (%)
Domesticsingletons(%)
Country of priority
US 35.4 31.4 20.1 13.1
Japan 22.7 13.5 6.7 57.1
EPO 14.5 81.9 1.1 2.4
China 2.3 23.3 2.5 71.8
29 De Rassenfosse et al (2013) show that the home office attracts the majority of priority filings. In 2000,96.9% of US inventors first filed at the USPTO. The proportion was 98.7% for Chinese inventors, 99.3% forJapanese inventors, 91.7% for German inventors and 99.1% for Russian inventors.30 The same methodology applies if we have information on the inventor’s country of residence.
Scientometrics (2017) 111:793–828 823
123
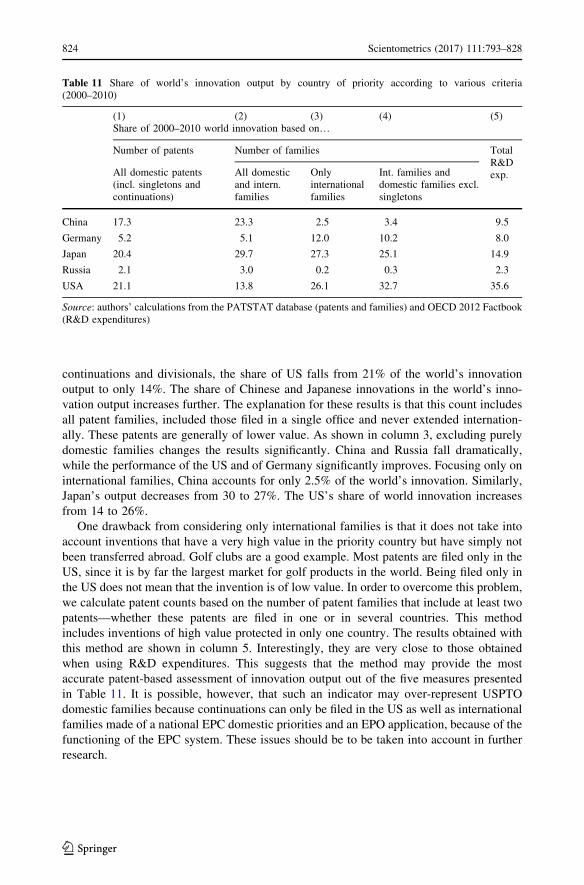
continuations and divisionals, the share of US falls from 21% of the world’s innovation
output to only 14%. The share of Chinese and Japanese innovations in the world’s inno-
vation output increases further. The explanation for these results is that this count includes
all patent families, included those filed in a single office and never extended internation-
ally. These patents are generally of lower value. As shown in column 3, excluding purely
domestic families changes the results significantly. China and Russia fall dramatically,
while the performance of the US and of Germany significantly improves. Focusing only on
international families, China accounts for only 2.5% of the world’s innovation. Similarly,
Japan’s output decreases from 30 to 27%. The US’s share of world innovation increases
from 14 to 26%.
One drawback from considering only international families is that it does not take into
account inventions that have a very high value in the priority country but have simply not
been transferred abroad. Golf clubs are a good example. Most patents are filed only in the
US, since it is by far the largest market for golf products in the world. Being filed only in
the US does not mean that the invention is of low value. In order to overcome this problem,
we calculate patent counts based on the number of patent families that include at least two
patents—whether these patents are filed in one or in several countries. This method
includes inventions of high value protected in only one country. The results obtained with
this method are shown in column 5. Interestingly, they are very close to those obtained
when using R&D expenditures. This suggests that the method may provide the most
accurate patent-based assessment of innovation output out of the five measures presented
in Table 11. It is possible, however, that such an indicator may over-represent USPTO
domestic families because continuations can only be filed in the US as well as international
families made of a national EPC domestic priorities and an EPO application, because of the
functioning of the EPC system. These issues should be to be taken into account in further
research.
Table 11 Share of world’s innovation output by country of priority according to various criteria(2000–2010)
(1) (2) (3) (4) (5)Share of 2000–2010 world innovation based on…
Number of patents Number of families TotalR&Dexp.All domestic patents
(incl. singletons andcontinuations)
All domesticand intern.families
Onlyinternationalfamilies
Int. families anddomestic families excl.singletons
China 17.3 23.3 2.5 3.4 9.5
Germany 5.2 5.1 12.0 10.2 8.0
Japan 20.4 29.7 27.3 25.1 14.9
Russia 2.1 3.0 0.2 0.3 2.3
USA 21.1 13.8 26.1 32.7 35.6
Source: authors’ calculations from the PATSTAT database (patents and families) and OECD 2012 Factbook(R&D expenditures)
824 Scientometrics (2017) 111:793–828
123

Conclusion
This paper offers an investigation into the structure of patent families. In particular, we
analyse characteristics of patent families that have been so far neglected in the literature:
the number of patents protecting the invention in each patent office and the time between
the first and last filing within a patent family.
We find that these characteristics of patent families reflect the maturation process of
innovations. Applicants indeed face a trade-off between the pre-emption of patent pro-
tection at an early stage of the innovation development and the fine-tuning of patent
protection as the innovation matures and its market potential becomes clearer. We show
that national patent systems and international procedures offer various types of flexibilities
that allow inventors to reconcile these objectives through sequential patent applications.
Multiple applications typically take place in a first step in the country of priority, while
inventors seek protection in other countries later in the maturation process by usually filing
a unique patent per foreign jurisdiction.
Our empirical results also suggest that the average number of patents protecting
innovations vary by priority offices and across time, reflecting the specificities of the
different patent systems. In particular, we find that divisional, continuing and continua-
tions-in-part applications are more frequently used at the USPTO and (for divisionals only)
at the EPO, and that patents are less likely to be granted at the EPO in those cases.
These findings have several implications with regards to patent-based statistics. We
derive two new indicators: the number of patents filed in the priority country within a
family, and the time elapsed between the first filing date and the last filing date within a
patent family. We show that both of them correlate with a number of widely established
measures of the value of the initial priority patent, and can therefore provide robust proxies
to measure this value. Compared to the size of international patent families, the advantage
of these measures is that they provide a metric available for all inventions, including those
that are never patented abroad.
Such metrics can also prove useful to better control for the difference in the propensity
to use patents between countries. We suggest in particular that basing cross-country
comparisons of innovative activity on the number of patent families that include at least
two patents (whether filed in one or in several countries) might be preferable to counting
only the number of international families. Indeed, this method controls for the difference in
the propensity to file multiple applications for a single invention between patent offices,
and excludes singletons of very low value while including high-value domestic inventions.
Acknowledgements Financial support has come from the Economic and Social Research Council throughthe Centre for Climate Change Economics and Policy, the Grantham Foundation for the Protection of theEnvironment and the Swiss National Science Foundation under the Sinergia programme, Project NoCRSII1_147612. Antoine Dechezlepretre gratefully acknowledges the support of the ESRC under the ESRCPostdoctoral Fellowship Scheme (Award PTA-026-27-2756).
Disclaimer Yann Meniere is currently on leave from Mines-ParisTech to serve as the Chief Economist ofthe European Patent Office. The views and opinions expressed in this article are his own and do notnecessarily reflect the official policy or position of the European Patent Office.
Open Access This article is distributed under the terms of the Creative Commons Attribution 4.0 Inter-national License (http://creativecommons.org/licenses/by/4.0/), which permits unrestricted use, distribution,and reproduction in any medium, provided you give appropriate credit to the original author(s) and thesource, provide a link to the Creative Commons license, and indicate if changes were made.
Scientometrics (2017) 111:793–828 825
123

References
Abrams, D. S., Akcigit, U., & Popadak, J. (2013). Patent value and citations: Creative destruction orstrategic disruption? (No. w19647). National Bureau of Economic Research Working Paper.
Aghion, P., Dechezlepretre, A., Hemous, D., Martin, R., & Van Reenen, J. (2016). Carbon taxes, pathdependency and directed technical change: Evidence from the auto industry. Journal of PoliticalEconomy, 124(1), 1–51.
Allison, J. R., & Tiller, E. H. (2003). The business method patent myth. Berkeley Technology Law Journal,18, 987–1084.
Bessen, J., & Meurer, M. J. (2008). Patent failure: How judges, bureaucrats, and lawyers put innovators atrisk. Princeton: Princeton University Press.
Cohen, W. M., Goto, A., Nagata, A., Nelson, R. R., & Walsh, J. P. (2002). R&D spillovers, patents and theincentives to innovate in Japan and the United States. Research Policy, 31(8), 1349–1367.
Cohen, W. M., Nelson, R. R., & Walsh, J. P. (2000). Protecting their intellectual assets: Appropriabilityconditions and why US manufacturing firms patent (or not). (No. W7552) National Bureau of Eco-nomic Research Working Paper.
De Rassenfosse, G., Dernis, H., Guellec, D., Picci, L., & van Pottelsberghe de la Potterie, B. (2013). Thewordwide count of priority patents: A new indicator of inventive activity. Research Policy, 42,720–737.
Dechezlepretre, A., Glachant, M., Hascic, I., Johnstone, N., & Meniere, Y. (2011). Invention and transfer ofclimate change mitigation technologies: A global analysis. Review of Environmental Economics andPolicy, 5(1), 109–130.
Dernis, H., Guellec, D., & van Pottelsberghe, B. (2001). Using patent counts for cross-country comparisonof technology output. STI Review (OECD), 27, 129–146.
Dernis, H., & Khan, M. (2004). Triadic patent families methodology. OECD Science, Technology andIndustry working paper 2004/2, Directorate for Science, Technology and Industry, OECD, Paris. www.oecd.org/sti/working-papers.
Eaton, J., & Kortum, S. (1999). International technology diffusion: Theory and measurement. InternationalEconomic Review, 40(3), 537–570.
Farre-Mensa, J., Hegde, D., & Ljungqvist, A. (2016). The bright side of patents. (No. w21959) NationalBureau of Economic Research working paper.
Freeman. (1982). The economics of industrial innovation, University of Illinois at Urbana-Champaign’sAcademy for Entrepreneurial Leadership Historical Research Reference in Entrepreneurship.
Frietsch, R., & Schmoch, U. (2006). Technological structures and performance as reflected by patentindicators. National System of Innovation in Comparison, pp. 89–105.
Frietsch, R., & Schmoch, U. (2010). Transnational patents and international markets. Scientometrics, 82(1),185–200.
Gambardella, A., Harhoff, D., & Verspagen, B. (2008). The Value of European Patents. European Man-agement Review, 5(2), 69–84.
Greenhalgh, C., & Rogers, M. (2007). The value of intellectual property rights to firms and society. OxfordReview of Economic Policy, 23(4), 541–567.
Griliches, Z. (1990). Patent statistics as economic indicators: A survey. Journal of Economic Literature,28(4), 1661–1707.
Grupp, H. (1997). The links between competitiveness, firms’ innovative activities and public R&D supportin Germany: An empirical analysis. Technology Analysis & Strategic Management, 9(1), 19–34.
Grupp, H. (1998). Foundations of the economics of innovation. Theory, measurement and practice. Chel-tenham: Edward Elgar Publishing Ltd.
Guellec, D., & van Pottelsberghe de la Potterie, B. (2000). Applications, grants and the value of patent.Economic Letters, 69(1), 109–114.
Guellec, D., & van Pottelsberghe de la Potterie, B. (2004). Measuring the globalisation of technology. Anapproach based on patent data, CEB working paper 04-13.
Hall, B. (2005). Exploring the patent explosion. Journal of Technology Transfer, 30, 35–48.Hall, B., & Harhoff, D. (2012). Recent research on the economics of patents. Annual Review of Economics,
4, 541–565.Hall, B., Jaffe, A., & Trajtenberg, M. (2005). Market value and patent citations. RAND Journal of Eco-
nomics, 36(1), 16–38.Hall, B., & Ziedonis, R. (2001). The patent paradox revisited: An empirical study of patenting in the U.S.
semiconductor industry, 1979–1995. RAND Journal of Economics, 32, 1.
826 Scientometrics (2017) 111:793–828
123
Harhoff, D. (2006). Patent constructionism: Exploring the microstructure of patent portfolios. Presentationprepared for the EPO/OECD conference on patent statistics for policy decision making, Vienna,October 23–24, 2006. http://academy.epo.org/schedule/2006/ac04/_pdf/monday/Harhoff.pdf.
Harhoff, D. (2009). Economic cost-benefit analysis of a unified and integrated European patent litigationsystem. Final report to the European Commission. http://ec.europa.eu/internal/_market/indprop/docs/patent/studies/litigation/_system/_en.pdf.
Harhoff, D., Narin, F., Scherer, F. M., & Vopel, K. (1999). Citation frequency and the value of patentedinnovation. Review of Economics and Statistics, 81(3), 511–515.
Harhoff, D., & Reitzig, M. (2004). Deterinants of opposition against EPO patent grants—The case ofbiotechnology and pharmaceuticals. International Journal of Industrial Organization, 22(4), 443–480.
Harhoff, D., Scherer, F. M., & Vopel, K. (2003). Citations, family size, opposition and the value of patentrights. Research Policy, 32(8), 1343–1363.
Hegde, D., Mowery, D. C., & Graham, S. (2009). Pioneers, submariners, or thicket-builders: Which firmsuse continuations in patenting? Management Science, 55(7), 1214–1226.
Hegde, D., & Sampat, B. (2009). Examiner citations, applicant citations, and the private value of patents.Economics Letters, 105, 287–289.
Henderson, R., & Cockburn, I. (1996). Scale, scope and spillovers: The determinants of research produc-tivity in ethical drug discovery. The RAND Journal of Economics, 27(1), 32–59.
Jaffe, A., & Lerner, J. (2004). Innovation and its discontents: How our broken patent system is endangeringinnovation and progress, and what to do about it. Princeton, NJ: Princeton University Press.
Lanjouw, J., Pakes, A., & Putnam, J. (1998). How to count patents and value intellectual property: The usesof patent renewal and application data. The Journal of Industrial Economics, 46(4), 405–432.
Lanjouw, J., & Schankerman, M. (2001). Characteristics of patent litigation: A window on competition. TheRand Journal of Economics, 32(1), 129–151.
Lanjouw, J., & Schankerman, M. (2004). Patent quality and research productivity: Measuring innovationwith multiple indicators. The Economic Journal, 114(495), 441–465.
Lemley, M., & Moore, K. (2004). Ending abuse of patent continuations. Kimberly A. Moor BostonUniversity Law Review, 84, 63.
Martinez, C. (2010). Insight into different types of patent families. Paris: OECD Publishing.Martinez, C. (2011). Patent families: when do different definitions really matter? Scientometrics, 86(1),
39–63.Moser, P., Ohmstedt, J., & Rhode, P. (2012). Patent citations and the size of innovation—Evidence from
hybrid corn. Stanford University working paper.Narin, F., Noma, E., & Perry, R. (1987). Patents as indicators of corporate technological strength. Research
Policy, 16(2–4), 143–155.OECD. (2009). Patent statistics manual. Paris: OECD.Ordover, J. A. (1991). A patent system for both diffusion and exclusion. The Journal of Economic Per-
spectives, 5(1), 43–60.Pakes, A. (1986). Patents as options: Some estimates of the value of holding European patent stocks.
Econometrica, 54, 755–784.Pakes, A., & Schankerman, M. (1984). The rate of obsolescence of patents, research gestation lags, and the
private rate of return to research resources. In Z. Griliches (Ed.), R&D, patents and productivity.Chicago: University of Chicago Press.
Pavitt, K. (1982). R&D, patenting and innovative activities: A statistical exploration. Research Policy,11(1), 33–51.
Pavitt, K. (1985). Patent statistics as indicators of innovative activities: Possibilities and problems. Scien-tometrics, 7(1–2), 77–99.
Putnam, J. (1996). The value of international patent rights. Ph.D. Thesis. Yale University Press.Reitzig, M. (2004). Improving patent valuations for management purposes—Validating new indicators by
analyzing application rationales. Research Policy, 33(6), 939–957.Sakakibara, M., & Branstetter, L. (2001). Do stronger patents induce more innovation? Evidence from 1988
Japanese patent law reforms. The Rand Journal of Economics, 32(1), 77–100.Sapsalis, E., & van Pottelsberghe de la Potterie, B. (2007). The institutional sources of knowledge and the
value of academic patents. Economics Innovation and New Technology, 16(2), 139–157.Schankerman, M., & Pakes, A. (1986). Estimates of the value of patent rights in European Countries during
the post-1950 period. The Economic Journal, 96(384), 1052–1076.Scherer, F. (1965). Firm size, market structure, opportunity, and the output of patented innovations. The
American Economic Review, 55(5), 1097–1125.
Scientometrics (2017) 111:793–828 827
123

Schmoch, U. (2004). The technological output of scientific institutions. In Handbook of quantitative scienceand technology research: The use of publication and patent statistics in studies of S&T systems (pp.717–731). Springer, Dordrecht.
Schmoch, U., Rammer, C., & Legler, H. (Eds.). (2006). National systems of innovation in comparison:Structure and performance indicators for knowledge societies. Berlin: Springer.
Squicciarini, M., Dernis, H., & Criscuolo, C. (2013). Measuring patent quality: Indicators of technologicaland economic value. OECD Science, Technology and Industry working papers, 2013/03, OECDPublishing. doi:10.1787/5k4522wkw1r8-en.
Tong, X., & Frame, J. D. (1994). Measuring national technological performance with patent claims data.Research Policy, 23(2), 133–141.
Trajtenberg, M. (1990). A penny for your quotes: Patent citations and the value of innovations. The RandJournal of Economics, 21(1), 172–187.
Van der Drift, J. (1989). Statistics of European patents on legal status and granting data. World PatentInformation, 11, 243–249.
Van Pottelsberghe, B., & van Zeebroeck, N. (2008). A brief history of space and time: The scope-year indexas a patent value indicator based on families and renewals. Scientometrics, 75(2), 319–338.
Van Zeebroeck, N. (2011). The puzzle of patent value indicators. Economics of Innovation and NewTechnology, 20(1), 33–62.
Van Zeebroeck, N., & van Pottelsberghe, B. (2011a). Filing strategies and patent value. Economics ofInnovation and New Technology, 20(6), 539–561.
Van Zeebroeck, N., & van Pottelsberghe, B. (2011b). The vulnerability of patent value determinants.Economics of Innovation and New Technology, 20(3), 283–308.
Van Zeebroeck, N., van Pottelsberghe de la Potterie, B., & Guellec, D. (2009). Claiming more: Theincreased voluminosity of patent applications and its determinants. Research Policy, 38(6), 1006–1020.
828 Scientometrics (2017) 111:793–828
123