Embed Size (px)
Citation preview
International propagation of economic shocks through global
supply chains
Yuzuka Kashiwagi, Petr Matous and Yasuyuki Todo
Waseda INstitute of Political EConomy
Waseda University
Tokyo, Japan
WINPEC Working Paper Series No.E1810
November 2018
International propagation of economic shocks through global supply chains*
Yuzuka Kashiwagi†
Petr Matous‡
Yasuyuki Todo§
Abstract
This study examines whether and how economic shocks by natural disasters propagate
through global supply chains to regions not directly hit by disasters. Although such
propagation within a country has been studied, this study contributes to the literature by
incorporating international propagation. Using firm-level data for more than 100,000
major firms in the world that include information on supply-chain ties among them, we
find evidence of intra-national propagation as found in the literature but no
international propagation. We further investigate possible mechanisms, finding that
internationalized firms’ ability to substitute for damaged partners most likely explains
the absence of international propagation.
Keywords: Global supply chains, Propagation of shocks, Spillover, Natural disasters
JEL classification: E32, F14, L14, Q54
* This study was conducted as part of a project titled ‘Research on Global Inter-firm Networks and Related
Policies’, which was undertaken at the Research Institute of Economy, Trade, and Industry (RIETI). Financial
support from JSPS KAKENHI Grant Number JP25101003 is gratefully acknowledged. The authors would like
to thank Sunghoon Chung, Stephane Hallegatte, Hidehiko Ichimura, Tomohiko Inui, Keiko Ito, Yukiko Saito,
Yohei Sugita, Russel Thomson, Zhihong Yu, and seminar participants at the European Trade Studies Group
Annual Conference, Japanese International Economics Association, Hitotsubashi University, Osaka University,
the University of Sydney, Waseda University, and World Bank for comments and Fu Jiangtao and Yohei
Kobashi for data extractions. The opinions expressed and arguments employed in this paper are the sole
responsibility of the authors and do not necessarily reflect those of RIETI, Waseda University, the University of
Sydney, or any institution with which the authors are affiliated. † Corresponding author. Graduate School of Economics, Waseda University, 1-6-1 Nishi-Waseda, Shinjuku-ku,
Tokyo 1640012, Japan (email: [email protected]). ‡ Complex Systems Research Group, Faculty of Engineering and IT, the University of Sydney (email:
[email protected]). § Faculty of Political Science and Economics, Waseda University, and Research Institute of Economy, Trade
and Industry (email: [email protected]).

1
1. Introduction
Negative economic shocks have been found to propagate through input-output linkages to both
upstream and downstream firms, leading to a substantial effect on the entire economy (Acemoglu et al.
2012;Bigio and La’O 2016;Caliendo et al. 2014;Di Giovanni and Levchenko 2010). Suppliers of a
firm directly affected by a negative shock are also indirectly affected because of lack of demand,
whereas its customers are affected because of a lack of material, parts, and components. While the
literature mostly relies on input-output tables aggregated at the sector level, recent studies have begun
utilizing newly available firm-level data with information on supply-chain links to investigate this
issue (Barrot and Sauvagnat 2016;Carvalho et al. 2016;Lu et al. 2017). Many of these studies take
natural disasters as a source of exogenous economic shocks because their direct effect is exogenous
and extensive (Cavallo, Powell, and Becerra 2010), confirming that, through supply chains, economic
shocks degrade the performance of firms that are located outside the directly affected region.
However, the literature has mostly focused on propagation of shocks within a country owing to
data limitations. In practice, however, supply chains are becoming increasingly globalized (Baldwin
2016), and thus negative economic shocks might propagate internationally. Although international
propagation of shocks through financial networks has been analyzed (Elliott, Golub, and Jackson
2014), whether and how much negative shocks propagate through global supply chains across
countries have rarely been examined. One exception is a study by Boehm, Flaaen, and Pandalai-Nayar
(2015), who examine propagation from parent firms damaged by a disaster affecting their overseas
affiliates. However, propagation between unaffiliated firms or the difference between intra-national
and international propagation are not explored in their study.
To fill this gap, this study utilizes a unique firm-level dataset that covers 110,000 major firms
from around the world, including 17,656 in the United States (US), and contains information on
supply-chain ties among them to investigate how negative shocks from natural disasters propagate
both within and across countries through supply chains. We take Hurricane Sandy (henceforth, the
hurricane) that hit the east coast of the US in October, 2012 as a source of negative shocks. The
hurricane is reported to have caused an economic loss of 50 billion US dollars, the second largest
economic loss from a natural disaster worldwide since 2010 (Center for Research on the
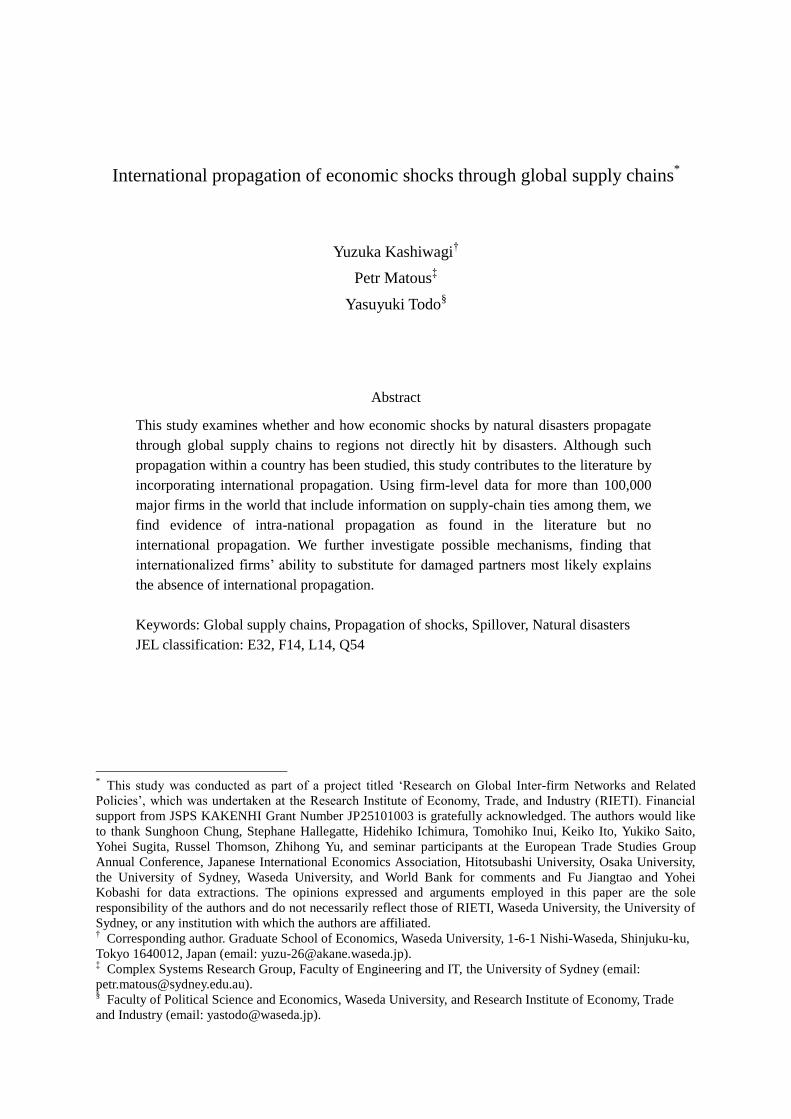
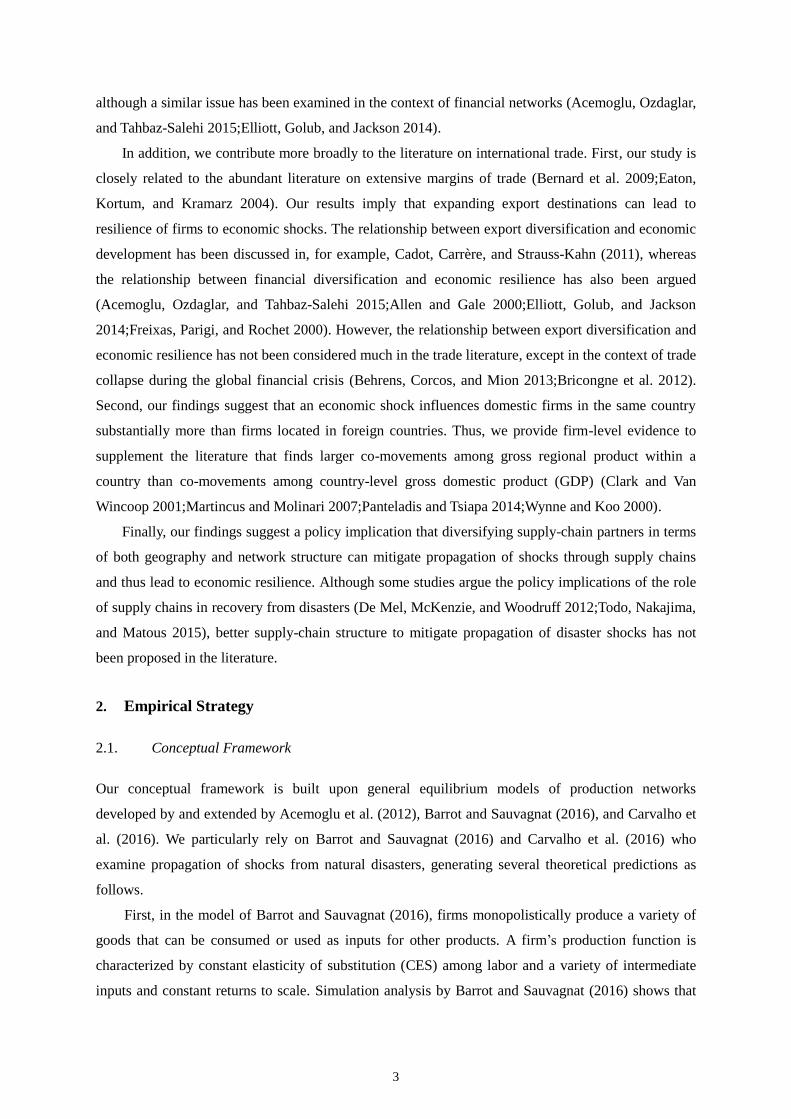
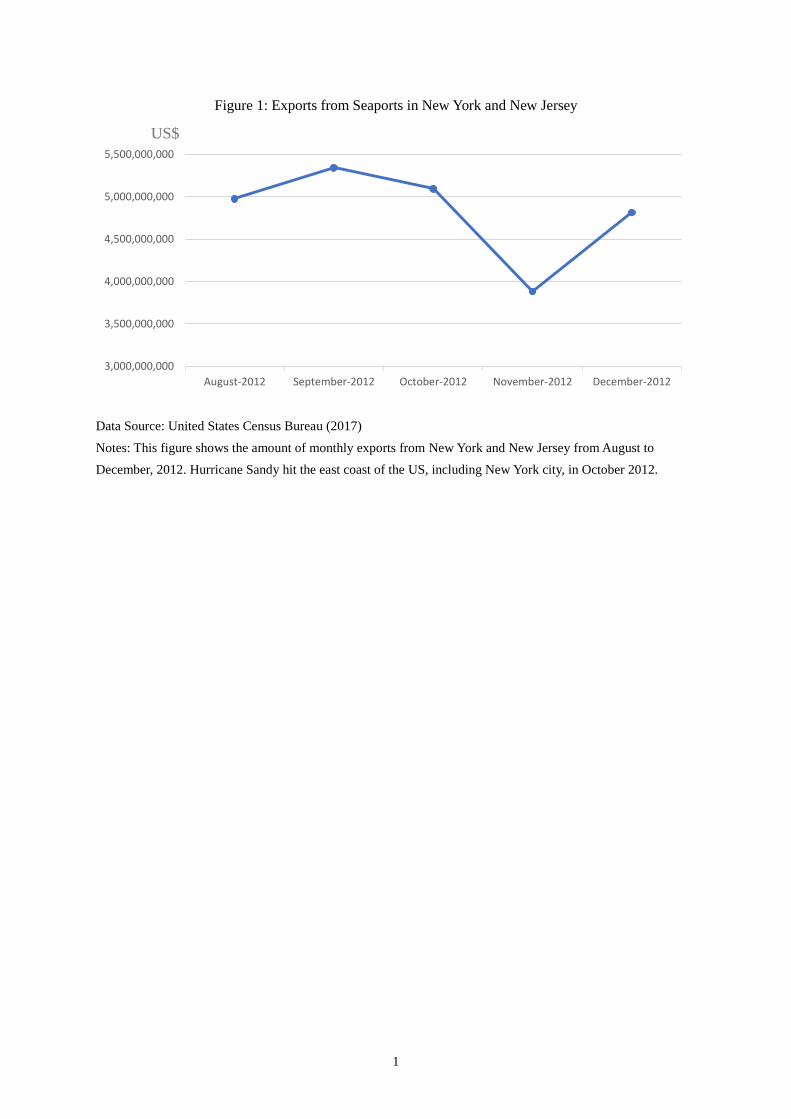
Epidemiology of Disasters 2017). Figure 1 shows that the hurricane also sharply decreased exports
from seaports in New York and New Jersey for several months (United States Census Bureau 2017),
as is often the case after large natural disasters (Felbermayr and Gröschl 2013;Gassebner, Keck, and
Teh 2010;Oh and Reuveny 2010).
More specifically, we estimate how much the sales of firms outside the hurricane’s disaster area
changed after the hurricane if their direct or indirect customers or suppliers were located in the
disaster area, using ordinary least squares (OLS) estimation, which is appropriate because of the
2
exogenous nature of the hurricane. Our major finding is the stark contrast between intra-national and
international propagation. After the hurricane, the sales growth of US suppliers and customers of
firms directly damaged by the hurricane was significantly lower than that of other firms. This finding
confirms the upstream and downstream propagation within the country at the firm level found in
Barrot and Sauvagnat (2016) and Carvalho et al. (2016). However, we do not find any negative
impact of damaged firms on their suppliers or customers outside the US, concluding that international
propagation of economic shocks is less likely than intra-national propagation.
Furthermore, while suppliers and customers in the US connected directly to damaged firms
generally saw a decline in sales growth, the negative effect on those additionally connected to foreign
partners and those with a large number of workers was smaller. Combined with the finding of no
significant international propagation, these results indicate that firms were less affected by
propagation of shocks if they were internationalized, regardless of their location or size. We interpret
the results as showing that in the presence of costs to search for transaction partners, internationalized
or large firms can use substitutes for their suppliers and customers affected by negative economic
shocks and thus mitigate the propagation of shocks more easily because of their lower search costs
relative to sales. The importance of search costs in firm transactions is in line with theoretical and
empirical findings in terms of selection of markets (Allen 2014) and partner firms (Antras, Fort, and
Tintelnot 2017;Bernard, Moxnes, and Saito 2018). Moreover, it is consistent with Barrot and
Sauvagnat (2016), who find that input specificity, which makes substitution of partners more difficult,
amplifies propagation.
We also examine how the structure of supply chains as a network affects propagation. Links
through international trade can be viewed as a network (Rauch 1999), and recent literature finds that
the network structure substantially affects how economic shocks propagate through firm networks
(Acemoglu, Ozdaglar, and Tahbaz-Salehi 2015;Elliott, Golub, and Jackson 2014). Our analysis
reveals that when a firm's partners are densely connected with each other through supply chains,
propagation of negative effects is augmented as the shock can circulate in the dense network.
This study contributes in various aspects to the growing literature on propagation of economic
shocks through firm networks. First, it is the first work to compare intra-national and international
propagation of economic shocks through supply chains. Our result that shocks propagate within a
country but are less likely to propagate across countries is a new finding and deserves attention.
Second, we find that there is no propagation to internationalized firms, possibly because these firms
can easily find substitutes for damaged suppliers and customers. This finding confirms the role of
input specificity in international trade (Rauch 1999) and propagation of shocks (Barrot and Sauvagnat
2016) in the recent literature because input specificity implies difficulty obtaining substitutes for
partners. Third, we investigate how the network structure, network density in particular, affects
propagation, rather than simply focusing on direct links with damaged firms. The use of measures of
network structure is new in the empirical literature on propagation of shocks through supply chains,
3
although a similar issue has been examined in the context of financial networks (Acemoglu, Ozdaglar,
and Tahbaz-Salehi 2015;Elliott, Golub, and Jackson 2014).
In addition, we contribute more broadly to the literature on international trade. First, our study is
closely related to the abundant literature on extensive margins of trade (Bernard et al. 2009;Eaton,
Kortum, and Kramarz 2004). Our results imply that expanding export destinations can lead to
resilience of firms to economic shocks. The relationship between export diversification and economic
development has been discussed in, for example, Cadot, Carrère, and Strauss-Kahn (2011), whereas
the relationship between financial diversification and economic resilience has also been argued
(Acemoglu, Ozdaglar, and Tahbaz-Salehi 2015;Allen and Gale 2000;Elliott, Golub, and Jackson
2014;Freixas, Parigi, and Rochet 2000). However, the relationship between export diversification and
economic resilience has not been considered much in the trade literature, except in the context of trade
collapse during the global financial crisis (Behrens, Corcos, and Mion 2013;Bricongne et al. 2012).
Second, our findings suggest that an economic shock influences domestic firms in the same country
substantially more than firms located in foreign countries. Thus, we provide firm-level evidence to
supplement the literature that finds larger co-movements among gross regional product within a
country than co-movements among country-level gross domestic product (GDP) (Clark and Van
Wincoop 2001;Martincus and Molinari 2007;Panteladis and Tsiapa 2014;Wynne and Koo 2000).
Finally, our findings suggest a policy implication that diversifying supply-chain partners in terms
of both geography and network structure can mitigate propagation of shocks through supply chains
and thus lead to economic resilience. Although some studies argue the policy implications of the role
of supply chains in recovery from disasters (De Mel, McKenzie, and Woodruff 2012;Todo, Nakajima,
and Matous 2015), better supply-chain structure to mitigate propagation of disaster shocks has not
been proposed in the literature.
2. Empirical Strategy
2.1. Conceptual Framework
Our conceptual framework is built upon general equilibrium models of production networks
developed by and extended by Acemoglu et al. (2012), Barrot and Sauvagnat (2016), and Carvalho et
al. (2016). We particularly rely on Barrot and Sauvagnat (2016) and Carvalho et al. (2016) who
examine propagation of shocks from natural disasters, generating several theoretical predictions as
follows.
First, in the model of Barrot and Sauvagnat (2016), firms monopolistically produce a variety of
goods that can be consumed or used as inputs for other products. A firm’s production function is
characterized by constant elasticity of substitution (CES) among labor and a variety of intermediate
inputs and constant returns to scale. Simulation analysis by Barrot and Sauvagnat (2016) shows that
4
destruction of a firm's production capacity by a disaster negatively affects the output of its direct
customers through input-output linkages. Using a similar theoretical model, Carvalho et al. (2016)
reach the same conclusion. In their model, when a firm's productivity is negatively affected by a
shock, the price of the firm's product becomes higher. As a result, its customers utilize a smaller
amount of its product as an intermediate good, producing a smaller amount of their products. Indirect
customers of the firm directly damaged by a shock, such as customers of their direct customers, or
two-step customers, are also negatively affected, although the effect on indirect customers is smaller
than the effect on direct customers. These findings suggest the following testable hypotheses
regarding downstream propagation of a shock generated by a natural disaster through supply chains
from suppliers to customers.
Hypothesis 1: The sales growth of customers of firms directly damaged by a natural disaster is lower
than that of customers of undamaged firms as a result of supply chain disruptions.
Hypothesis 2: The sales growth of two-step customers of firms directly damaged by a natural disaster
is lower than that of two-step customers of undamaged firms, whereas the effect on their two-step
customers is smaller than the effect on their direct customers.
Second, Carvalho et al. (2016) further show that a negative productivity shock on a firm
decreases the output of upstream suppliers of the firm when labor and intermediates are substitutes.
This effect is due to an increase in the demand for labor relative to intermediates because of a negative
productivity shock on the intermediate-goods sector. As in the case of downstream propagation,
negative shocks propagate further to more upstream suppliers beyond direct suppliers, although the
propagation effect diminishes along supply chains. These findings lead to the following hypotheses
regarding upstream propagation.
Hypothesis 3: The sales growth of suppliers of firms directly damaged by a natural disaster is lower
than that of suppliers of undamaged firms as a result of supply chain disruptions.
Hypothesis 4: The sales growth of two-step suppliers, i.e., suppliers of suppliers, of firms damaged
directly by a natural disaster is lower than that of two-step suppliers of undamaged firms, whereas the
effect on their two-step suppliers is smaller than the effect on direct suppliers.
These hypotheses have already been supported empirically by Barrot and Sauvagnat (2016) and
Carvalho et al. (2016) using data for supply chains within a country. The present study extends their
analysis to incorporate global supply chains, focusing on possible differences between intra-national
and international propagation. One possible cause of the difference is related to the difficulty finding
5
substitutes for damaged suppliers and customers. Barrot and Sauvagnat (2016) and Carvalho et al.
(2016) find theoretically and empirically that shocks propagate more through supply chains when
inputs are more specific and substitution is more difficult. Recently, theoretical and empirical analyses
by Allen (2014), Antras, Fort, and Tintelnot (2017), and Bernard, Moxnes, and Saito (2018)
incorporate costs of searching for transaction partners and find that the search cost is an important
determinant of partners. In our context, their results imply that when a firm's suppliers or customers
are affected by a negative shock, the firm can substitute new partners for damaged ones only if the
expected benefit from having new partners exceeds the search cost.
Under these circumstances, substitution of suppliers and customers within a country may or may
not be more difficult than substitution across countries. On one hand, internationalized firms using a
wide variety of inputs, including those from foreign countries, may have greater ability to collect
information in the world market than firms with only domestic partners. Therefore, internationalized
firms' costs of searching for new partners are lower than non-internationalized firms. In addition, as
internationalized firms are likely to be more productive, as argued by the heterogeneous-firm trade
model of Melitz (2003) and evidenced by many empirical studies, such as Bernard and Jensen (2004),
internationalized firms can obtain larger benefits from continuing production by finding new partners
and thus are willing to pay search costs. Therefore, internationalized firms may find it easier to
substitute for inputs from firms affected by a shock. If this is the case, international propagation of
shocks is smaller in size than intra-national propagation. On the other hand, inputs from a foreign
country may be more specific to the exporting country and unavailable domestically. If so,
international substitution for the inputs is more difficult than intra-national, and thus shocks propagate
more across countries than within a country. These arguments lead us to opposing hypotheses.
Hypothesis 5a: The negative effect of damaged suppliers (customers) in a country on their customers
(suppliers) in the same country is larger than the effect on their customers (suppliers) outside the
country.
Hypothesis 5b: The negative effect of damaged suppliers (customers) in a country on their customers
(suppliers) in the same country is smaller than the effect on their customers (suppliers) outside the
country.
Finally, we investigate the role of network density in propagation of shocks. The egocentric
network of a particular firm is considered to be dense when partners linked with the firm are also
linked with each other. Theoretically, there are two conflicting views of the effect of network density
on propagation. On one hand, in a dense network, shocks are circulated and thus may be amplified. In
the context of diffusion of behaviors, Centola (2010) empirically finds quicker diffusion in dense
networks than sparse ones. On the other hand, in a dense network, individuals and firms are more

6
likely to trust each other, creating social capital (Coleman 1988). In this situation, firms in dense
supply chains may help each other absorb shocks in the wake of a disaster. Such dense supply chains
are typically found in the keiretsu relationship among Japanese firms where each large final assembler
and its direct and indirect suppliers form an exclusive group of firms (Ahmadjian and Lincoln
2001;Aoki 1988). After the Great East Japan earthquake in 2011, the keiretsu supply chains are found
to have quicker recovery from the disaster (Todo, Nakajima, and Matous 2015).
In practice, the two opposing forces of network density result in mixed results of its effect on
propagation both theoretically and empirically. For example, Acemoglu, Ozdaglar, and Tahbaz-Salehi
(2015) use a theory of interbank networks and find that dense networks are resilient to a sufficiently
small financial shock because the shock is absorbed. However, they find that when a shock is
sufficiently large, dense networks are not resilient because the shock cannot be absorbed but is instead
circulated and amplified. In literature on the effect of networks of research collaboration on
knowledge diffusion, several studies, such as Rost (2011) and Gilsing et al. (2008), find an inverted
U-shaped relationship between network density and diffusion. Accordingly, our last set of hypotheses
is as follows.
Hypothesis 6a: The negative effect of damaged suppliers (customers) on their customers (suppliers)
is larger when the customers' (suppliers') ego network is denser.
Hypothesis 6b: The negative effect of damaged suppliers (customers) on their customers (suppliers)
is smaller when the customers' (suppliers') ego network is denser.
2.2. Estimation Methodology
To test these hypotheses, we consider the following estimation equation:
(2011 ) 0 1 2011 2 2011i t i i itSalesGrowth Shock X (1)
The dependent variable, SalesGrowthi(2011-t), is the growth rate of sales of firm i from 2011 to year t
where t is either 2012 or 2013. We experiment with the two growth rates to examine both short- and
long-term effects. Because Hurricane Sandy hit the US in October 2012, immediate propagation
within a few months is captured by sales growth from 2011 to 2012, whereas growth from 2011 to
2013 captures longer-run propagation. Because we examine possible differences between domestic
and international propagation, firm i can be either in the US but outside the disaster area or in any
other country in the world.
Shock is a vector of key independent variables that represent ties with suppliers and customers
directly hit by Hurricane Sandy. When we examine downstream propagation, that is, propagation from
suppliers to customers, we measure ties with directly damaged suppliers using the log of the number
7
of damaged suppliers of firm i plus one. In addition to firm i’s direct ties, Shock includes measures of
suppliers of firm i’s suppliers, or firm i’s two-step suppliers, that were directly hit by the hurricane. To
distinguish between propagation within the US and beyond the US, we classify Shock variables by the
location of firm i, either in the US or outside the US. Similarly, when we examine upstream
propagation from customers to suppliers, we use the number of firm i's damaged customers and
damaged two-step customers. The vector of the control variables X includes firm attributes and
network related variables, as described in Subsection 3.2.
To estimate equation (1), we use ordinary least squares (OLS) estimations, following Barrot and
Sauvagnat (2016) and Carvalho et al. (2016). This simple method is appropriate in the present case
because Hurricane Sandy is an exogenous shock and therefore, whether a firm is linked to damaged
firms should be exogenously determined, after controlling for the total number of links of the focal
firm. We check the exogeneity of the shock by testing the correlation between the shock and
pre-disaster sales growth, as shown in Section 4.1.
3. Data
3.1. Data Sources
This study uses two datasets, LiveData of FactSet Revere and Osiris of Bureau van Dijk. LiveData
includes information on supply chain relationships collected from public sources, such as financial
reports, websites of firms, and news articles. Because LiveData relies on public information, it
includes mostly publicly listed firms. Supply-chain information has become widely available through
the Internet. Most importantly, in the US, the Financial Accounting Standards Board requires publicly
listed firms to disclose customers who account for at least 10% of total sales, including foreign
customers. After automatically collecting information from the Internet and identifying the
identification number of each supplier and customer, trained analysts of FactSet Revere manually
verify it. Therefore, the quality of supply-chain information in LiveData is sufficiently high. Although
LiveData focused on US firms in earlier periods, it has recently expanded its coverage to other regions,
mostly Europe and Asia. We utilize LiveData for 2011, one year before Hurricane Sandy, to identify
pre-disaster global supply chains, which include 110,313 firms and 66,553 supply chain ties. Among
the 110,313 firms, 17,656 are located in the US, 3,908 in Japan, and 2,499 in the United Kingdom
(UK). Because the average number of suppliers per firm is approximately one, it should be noted that
this dataset includes only major supply-chain ties for major firms worldwide.
The other dataset, Osiris, includes firm-level data for mostly publicly listed firms in a number of
countries. Because Osiris contains detailed and globally comparable financial information, we extract
from Osiris each firm’s information about sales, value of total assets, number of employees, firm age,
industry code, and fiscal year end.
8
We merge LiveData and Osiris using the International Securities Identification Number (ISIN).
Thus, we have to omit 67,814 firms without ISINs in LiveData, which are mostly non-listed firms. We
also restrict our sample for regressions to firms that were not directly hit by Hurricane Sandy to
examine propagation from damaged firms only to firms that were not directly damaged by the
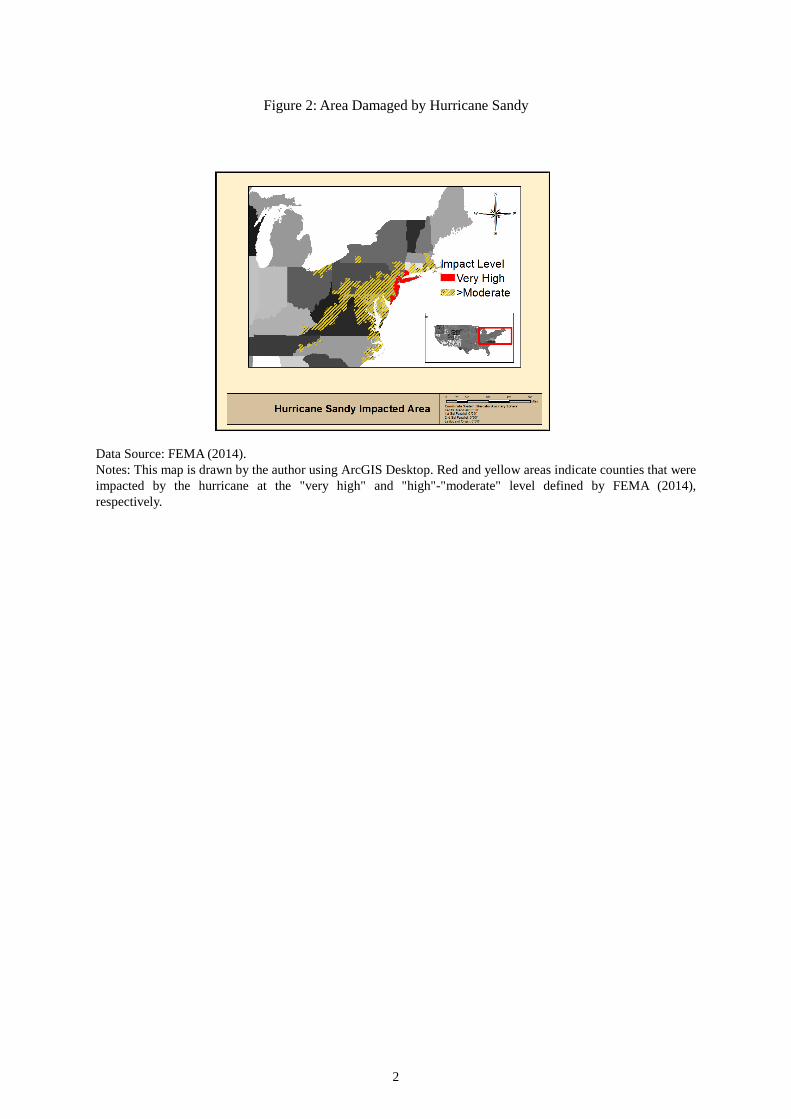
hurricane. Therefore, we exclude 1,709 firms in areas damaged at least moderately, as defined by the
Federal Emergency Management Agency (FEMA) ( Federal Emergency Management Agency (2014)).
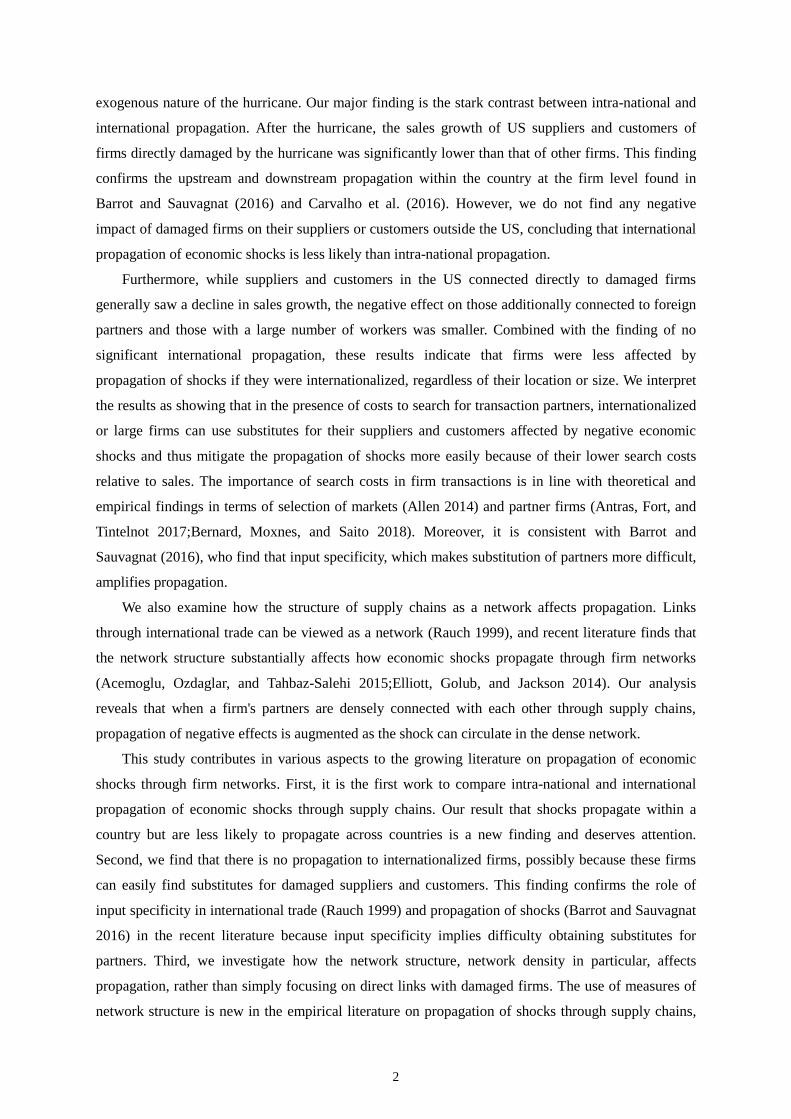
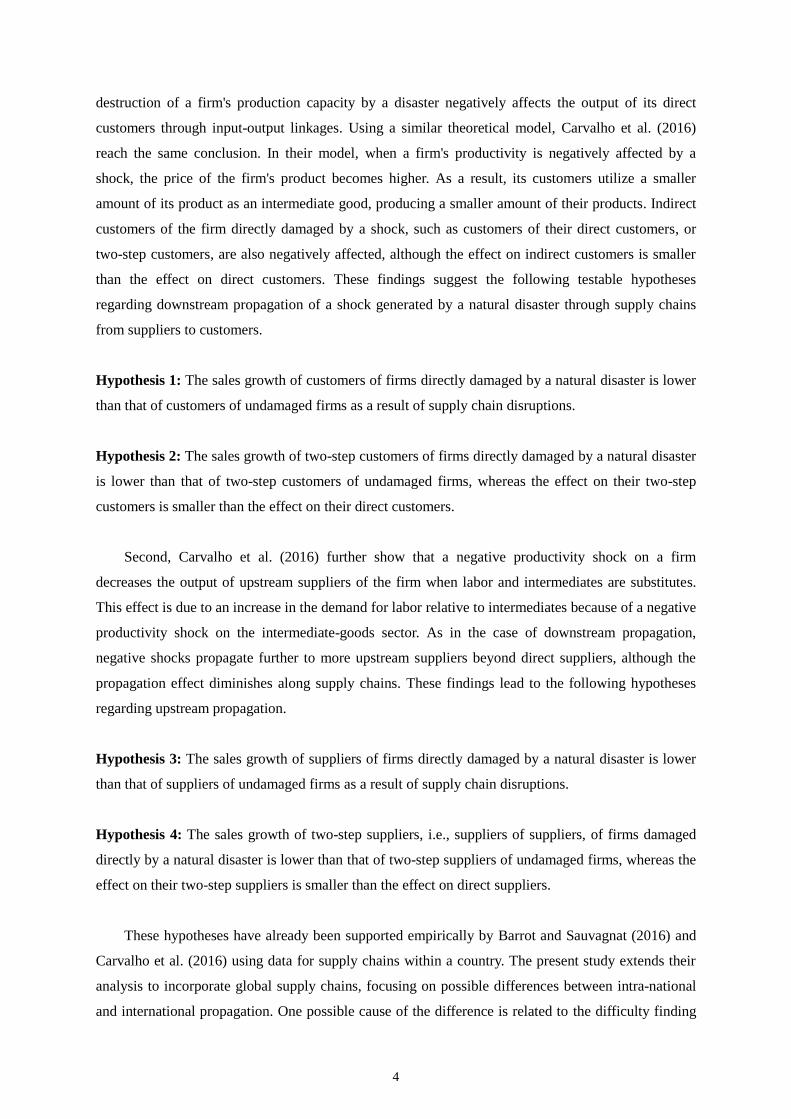
The excluded area is outlined in Figure 2 by a yellow border. In addition, we exclude firms in the
financial and real estate industries and governments, assuming that those are less likely to be affected
by supply chain disruptions caused by natural disasters. Finally, we exclude firms without sufficient
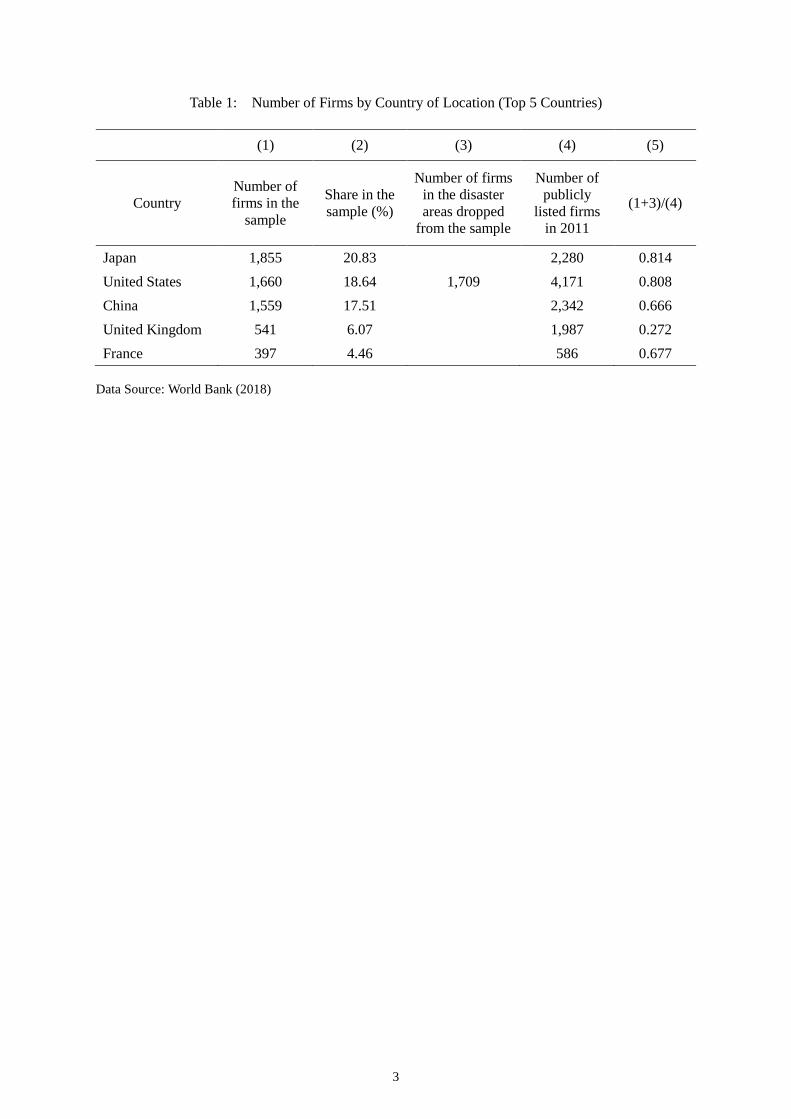
information. Accordingly, the number of observations for our benchmark regression is 8,906, among
which 1,660 are in the US, 1,855 in Japan, 1,559 in China, and 541 in the UK, as shown in Table 1.
The same table presents the number of publicly listed firms in 2011 in each of the top five countries in
our sample in column (4) and the ratio of firms in our sample (for the US, we add the number of firms
in the disaster areas that are dropped from the sample) to publicly listed firms in column (5), showing
that the coverage for most countries is reasonably high.
3.2. Variable Construction
Our key independent variables are the number of each firm’s suppliers and customers that were
directly damaged by Hurricane Sandy. To create these variables, we first identify the global supply
chains in 2011, 1 year before Hurricane Sandy, using all firms in LiveData, including observations
omitted from our estimation sample. Next, we define firms directly damaged by Hurricane Sandy as
those in “very highly damaged areas” according to FEMA (2014) . In these highly affected regions
(areas colored red in Figure 2), more than 10,000 people in each county were exposed to storm surge,
many buildings were flooded more than one meter in depth, and their exterior walls collapsed
FEMA(2013, 2014). It is most likely that the production activities of firms subjected to such
conditions were heavily disturbed. We count the number of each firm’s suppliers and customers
located in these heavily affected counties, as well as its two-step suppliers and two-step customers that
were in the disaster region.
To control for the size of the production network of each firm, we include the log of the number
of suppliers, two-step suppliers, customers, two-step customers, and those in the US in the set of
independent variables. We also control for the internationalization of the focal firm and existence of
other inter-firm networks, using the logs of the number of suppliers and customers in the country in
which the focal firm is located, the number of transaction links with capital shareholding links, and
transaction links with patent co-ownership links. We also incorporate another measure, PageRank,
developed by Page et al. (1999) to represent each firm’s centrality in the global supply chain.
Although the number of supply chain partners is also a measure of network centrality, it captures only
9
direct links and ignores indirect links. PageRank of node u, R(u), is defined as ( ) ( ) /u
vv BR u c R v N
where c, Bu, Nu, are a normalization factor, the set of nodes that are linked to (pointing at) node u, and
the number of links pointing from u, respectively. In short, PageRank, originally developed to
evaluate the centrality of websites on the Internet, takes into account all links within a network, not
only the number of those directly linked to the focal node. When a firm is not linked with any other
firm, we define PageRank as zero, and include it in estimations with a dummy variable for no link.
In some specifications, we incorporate density of firms' egocentric networks, measured by the
local clustering coefficient. The density of ego network is defined as the ratio of the number of actual
supply-chain ties between partners of the focal firm to the number of all possible ties between them
(Barabási 2016;Jackson 2010). For example, if a firm has three partners and two among the three are
also connected with supply chains, its density is 1/3. When a firm is not linked with any other firm or
linked with only one firm, we define the density as zero. In the estimations, we also include dummy
variables for no link and one link to account for any possible bias due to the arbitrary definitions.
The dependent variable is sales growth from 2011 to 2012 and from 2011 to 2013. Sales growth
is calculated as 1/( 2011)
(2011 ) 2011( / ) 1t
i t tSalesGrowth netsales netsales
. Control variables include
sales growth in the pre-disaster period from 2006 to 2011 to capture the pre-disaster characteristics,
sales per worker in 2011 in log form to represent productivity, and the number of workers and value of
total assets in 2011 in log form to represent firm size, firm age, industry dummies, country dummies,
and geographical distance from the damaged area (New York). When the country code is available but
a detailed address is not available for a firm, we use the address of the center of the capital city of the
country. In cases where the country code is not available, we use the average distance and include it
with a dummy indicating the code is unavailable. The dependent variable and controls are constructed
based on Osiris data. We use industry dummies based on the firms’ four-digit industry group codes in
the Global Industry Classification Standard (GICS). Country dummies are classified by the location of
the firm headquarters.
Each firm in Osiris also reports the end of its accounting period, which varies across countries.
Because sales of each firm in our sample cover different time periods depending on its fiscal year end,
the effect of supply-chain ties with directly affected firms on sales growth should also be affected by
the fiscal year end. For example, suppose that the end of the accounting period for a firm is December.
Then, our measure of short-term sales growth indicates the change in sales from the period
January-December 2011 to the period January-December 2012 and covers two months after the
hurricane, which hit the US at the end of October 2012. Now, suppose that the fiscal year end for
another firm is March. Then, short-term sales growth for this firm represents the change from the
period April 2011-March 2012 to the period April 2012-March 2013 and includes five months after
the hurricane (i.e., from November 2012 to March 2013). The difference in the period covered should
result in differences in sales growth and the effect of links with firms hit by the disaster. Therefore, we
10
include dummies for different fiscal year end months and interaction terms between these dummies
and the key variables for supply-chain ties, setting December as the base month. That is, our actual
estimation equation is given by:
(2011 ) 0 1 2011 1 2011 2 2 2011
November November
i t i k ik i k ik i itk January k JanuarySalesGrowth Shock D Shock D X
, (2)
where Dik is the dummy variable that takes a value of one if firm i's fiscal year end month is month k.
3.3. Descriptive Statistics
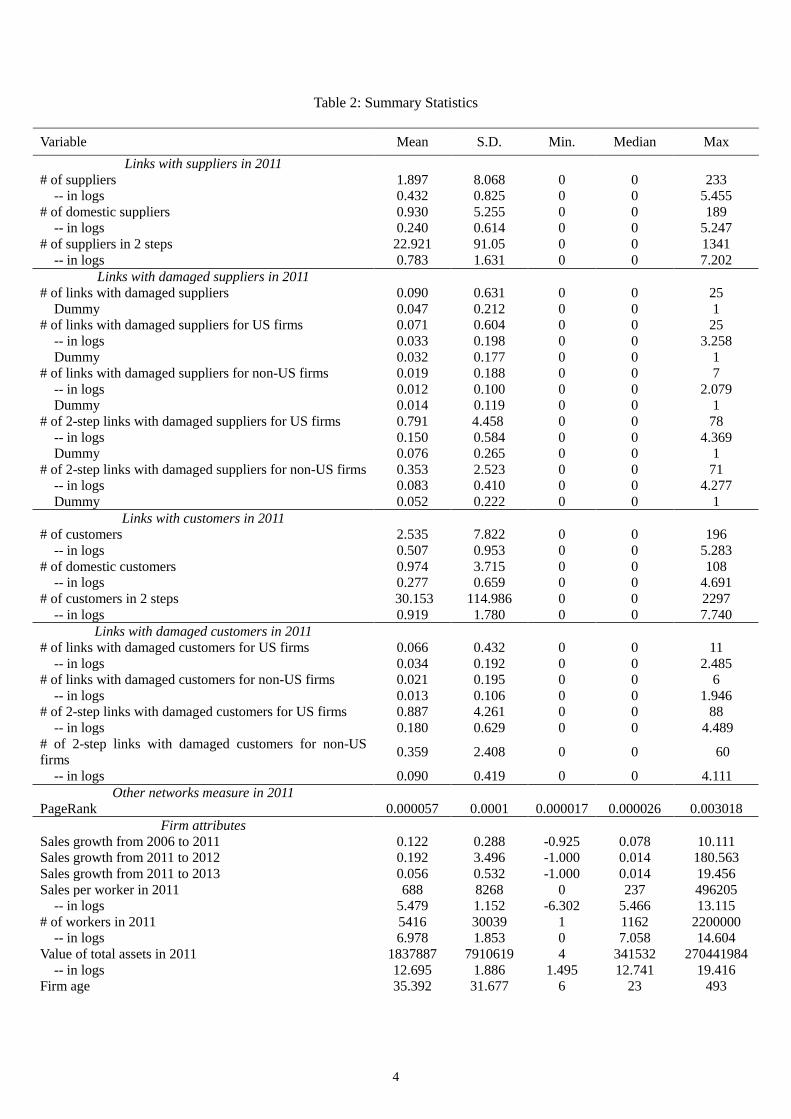
The upper rows of Table 2 show the summary statistics for the variables related to supply chains. The
mean and median of the number of suppliers is 1.897 and 0, respectively. This is because the coverage
of our data is mostly limited to links between major firms and their transaction partners. On average,
the number of domestic suppliers is 0.930, indicating that the number of domestic suppliers and that
of foreign suppliers do not differ substantially. The high degree of internationalization of firms in our
sample is because they are, again, mostly publicly listed firms. The average number of damaged
suppliers is 0.090. Looking at the mean of the dummy variable for damaged suppliers, we find 4.7
percent of all firms in our global sample are directly connected to suppliers directly damaged by the
hurricane. When we disaggregate the dummy for any links with damaged suppliers into a dummy for
US firms and non-US firms, 3.2 percent of US firms are directly linked to suppliers in the damaged
area. The average, median, and maximum number of links with damaged suppliers is 0.071, 0, and 25,
respectively. By contrast, non-US firms have 0.019 links with damaged suppliers on average and the
maximum number of such links is seven. These figures indicate that US firms seem to be linked with
more suppliers in the damaged area. This is plausible, since the damaged area is within the US.
The mean of the number of customers is 2.535. The mean of the number of domestic customers
is 0.974. Again, this small ratio of domestic customers is probably because firms in our sample are
mostly publicly listed firms. Including indirect links, the firms in the sample have on average 30
two-step customers. Furthermore, regarding links with firms in the damaged area, US firms have
0.066 such links on average, and 11 links at the maximum, while non-US firms have 0.021 links with
damaged firms on average and 6 links at the maximum.
The bottom rows of Table 2 indicate summary statistics of network measures and other control
variables. The median pre-disaster sales growth is 7.8 percent, whereas the median number of workers
and firm age are 1,162 and 23 years, respectively. These figures confirm that the sample firms are
mostly large, established, and growing firms.
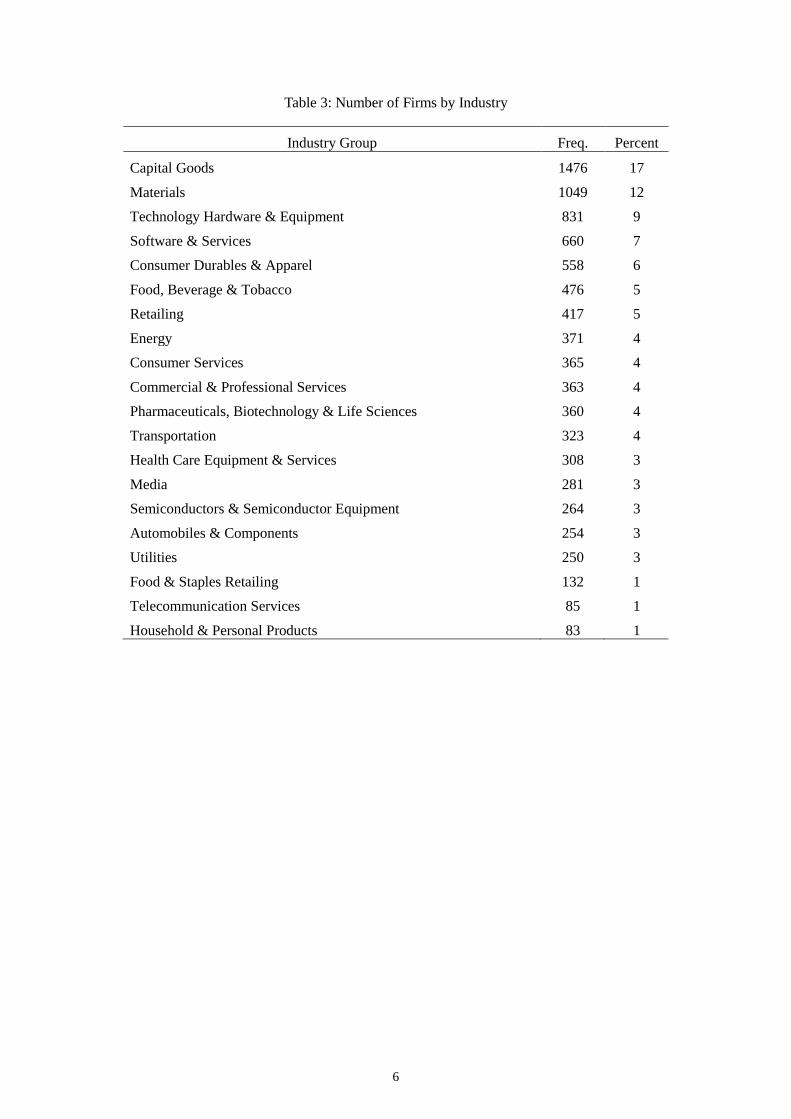
Table 3 reports the share of each of the four-digit industries classified by the GICS, as explained
in Section 3.2. The major industries in our sample are the capital goods, materials, and technology
hardware, and equipment industries.
11
4. Results
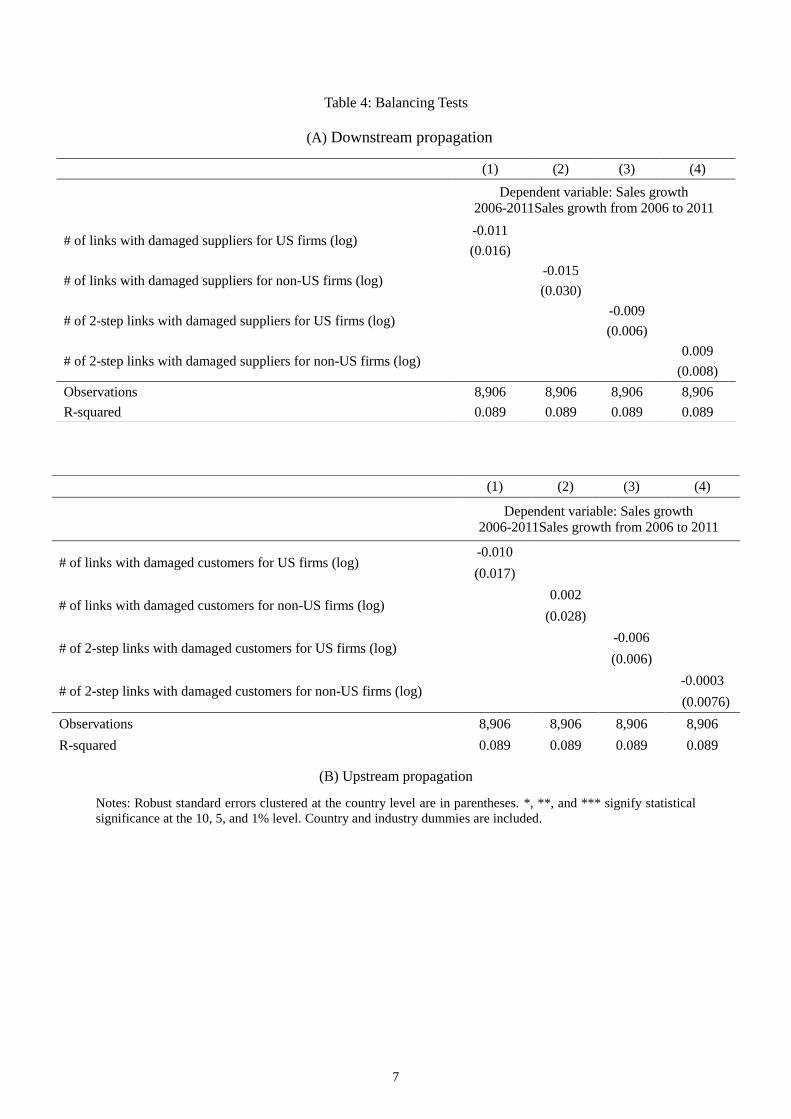
4.1. Balancing Tests
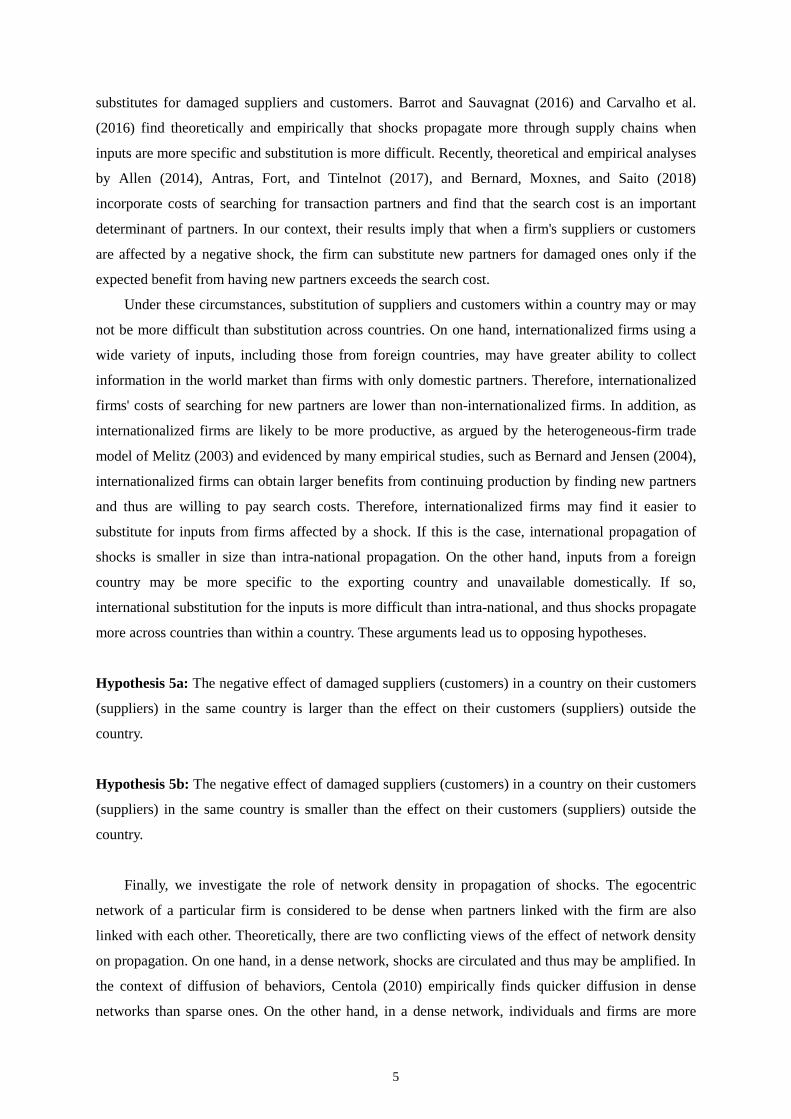
We first test the exogeneity of direct damages of the hurricane because our OLS estimations rely on
this assumption. For this purpose, we run OLS estimations to examine whether a firm’s supply chain
links to damaged suppliers or customers can predict sales growth before the disaster, including only
country and industry dummies as control variables. Panel (A) of Table 4 shows that neither the
number of suppliers nor two-step suppliers is correlated with sales growth before the hurricane. Panel
(B) indicates no correlation between the number of direct or two-step customers and pre-disaster
growth. These results suggest that direct and indirect supply-chain links with damaged firms are
randomly allocated to firms in our sample and hence our key variables of interest, the number of links
with damaged firms, should be uncorrelated with the error term in equation (2). Therefore, our use of
OLS estimations can be justified.
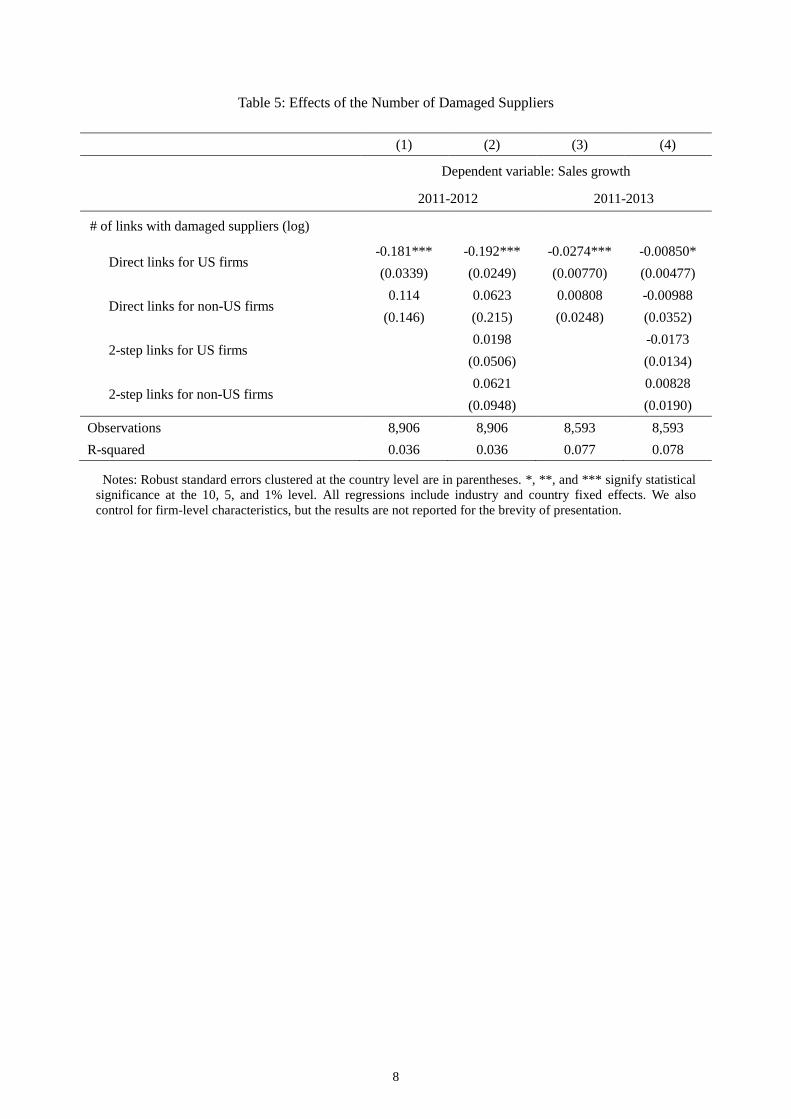
4.2. Benchmark Results
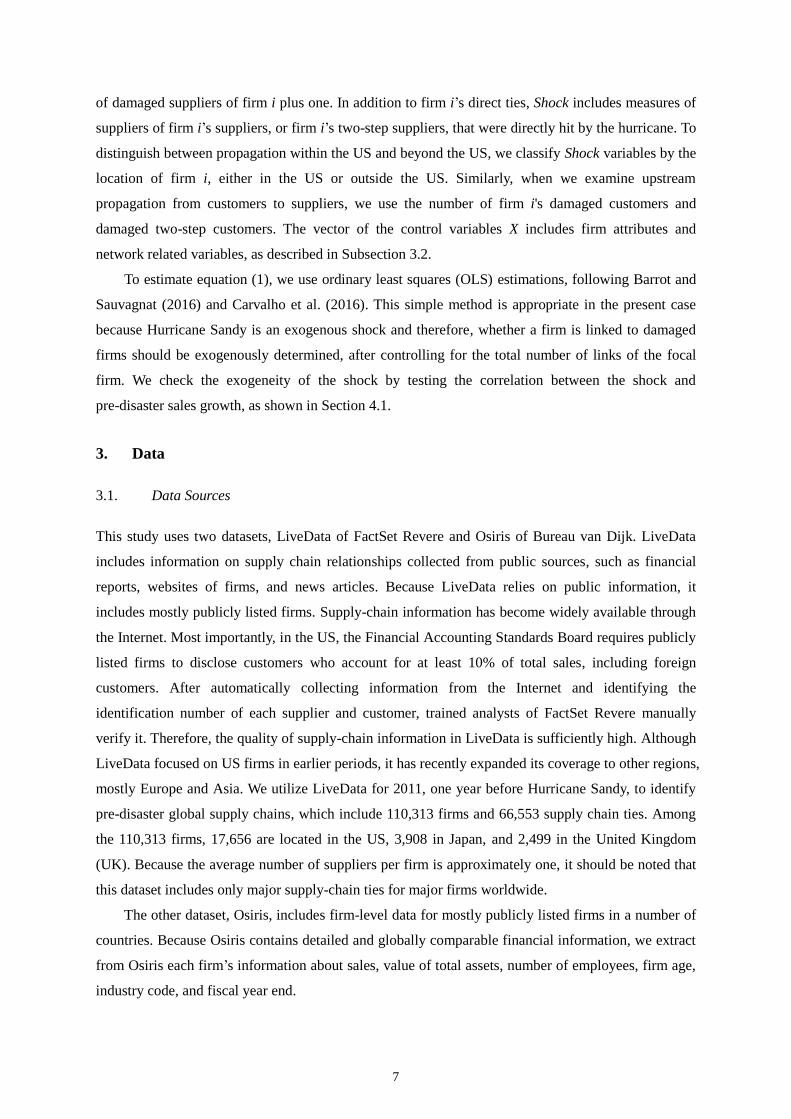
The benchmark results of downstream propagation of disaster shocks are presented in Table 5. In
columns (1) and (2), the dependent variable is sales growth of undamaged firms from 2011 to 2012 to
examine immediate propagation effects, whereas sales growth from 2011 to 2013 is used in columns
(3) and (4) to examine longer-term effects. In all estimations, we include the interaction terms
between each of the dummies for the end of the accounting period and the key independent variables
for links with damaged firms but do not present the results for the interaction terms for brevity of
presentation. Because the base case for the fiscal year end is December, the coefficient of the key
independent variable represents the effect on the change rate of sales from calendar year 2011 to
calendar year 2012 in the case of short-term effects and to calendar year 2013 in the case of long-term
effects.
Columns (1) and (2) of Table 5 show negative and significant effects of links with damaged
suppliers on sales growth of their customers in the US. This result suggests that negative shocks of the
hurricane propagated downstream along supply chains to US customers and supports hypothesis 1 in
Section 2.1. According to the size of the coefficient, US firms linked with a supplier damaged by the
hurricane experienced sales growth 13 percentage points lower (-0.181*[ln2-ln1] =-0.13) than those
not linked with damaged suppliers. Thus, the propagation effect is not only statistically significant but
also economically quite large. In columns (3) and (4) of Table 5, the effect of the number of damaged
suppliers on the longer-run sales growth of US firms is also negative and significant, while it is
substantially smaller in size and less significant than the immediate effects shown in columns (1) and
(2). This finding suggests that the negative propagation effect through supply chains diminished in a
year, probably either because of recovery of or substitution for damaged partners.
12
Furthermore, in columns (1) and (2) of Table 5, we observe that the coefficients of the links with
damaged suppliers for non-US customers are positive but statistically insignificant, indicating no
immediate effect on non-US customers. This evidence implies that the negative shock from the
hurricane did not propagate downstream beyond the US borders. Similarly, in columns (3) and (4),
there is no significant effect of the number of links with damaged suppliers on the sales growth of
non-US customers from 2011 to 2013, indicating no international propagation in the long run.
Therefore, hypothesis 5a is supported in the case of downstream propagation. These results are less
likely to be driven by the share of non-damaged suppliers because the average share of non-damaged
suppliers is not smaller for US customers linked with damaged firms (78%) than for non-US
correspondents (70%).
In addition, the coefficients of indirect two-step links with damaged suppliers in columns (2) and
(4) of Table 5 are insignificant for both US and non-US customers, both in the short and longer run.
This result does not support hypothesis 2, implying that there is no propagation of the negative shock
from the hurricane beyond direct customers. However, hypothesis 2 also states the effects on indirect
customers would be smaller than those on direct customers because negative shocks are absorbed
along supply chains due to substitution of partner firms. Our results indicate that negative shocks
substantially diminish along supply chains and disappear in two steps. Barrot and Sauvagnat (2016)
also find no downstream propagation beyond direct customers based on firm-level panel analysis for
the US. By contrast, Carvalho et al. (2016) find propagation beyond direct customers up to customers
four steps away from damaged suppliers after the Great East Japan Earthquake. One possible reason
for the variation among the three studies is that the direct impact of the Great East Japan Earthquake
was extremely large, the largest natural disaster worldwide since 2010 in terms of economic loss
(Center for Research on the Epidemiology of Disasters 2017) and the fourth largest earthquake in the
world since 1900 (Cabinet Office of Japan 2012), and thus did not fade away quickly.
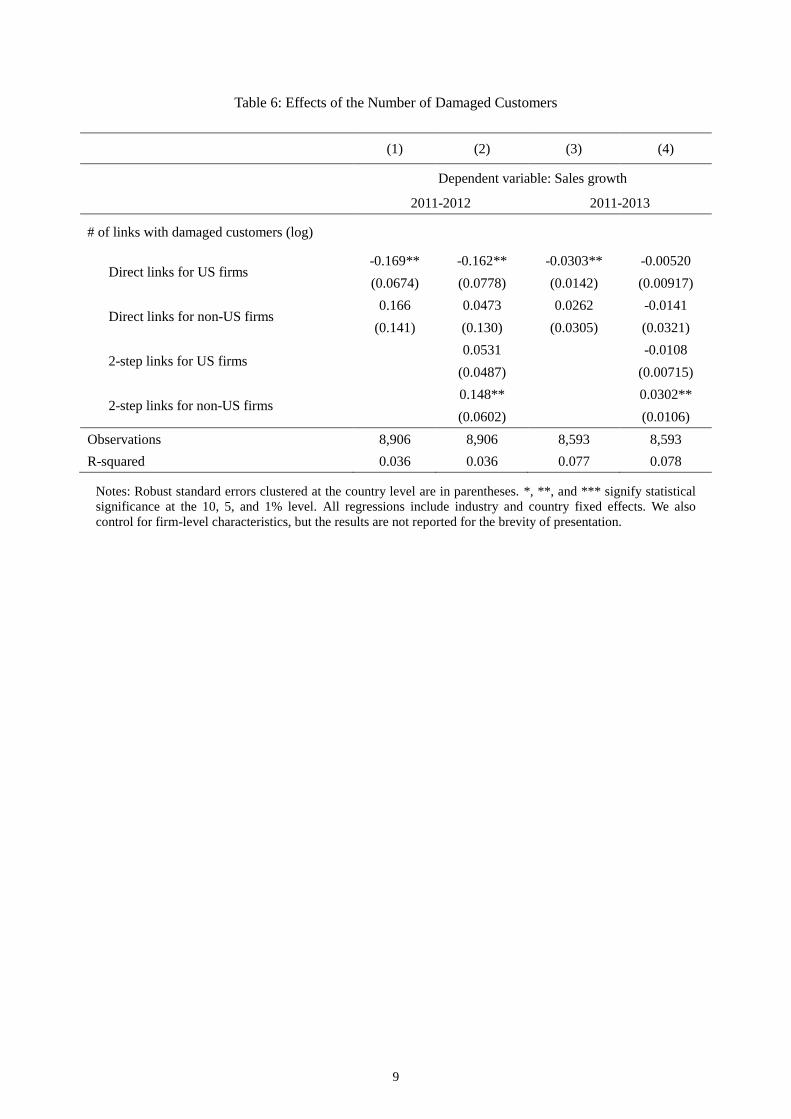
The results for upstream propagation from damaged customers to their suppliers in Table 6
demonstrate that upstream propagation is similar to downstream propagation. Columns (1) and (2) of
Table 6 show negative and significant effects of links with damaged customers on short-run sales
growth of US suppliers, which is consistent with hypothesis 3. Columns (3) and (4) of Table 6
indicate either a smaller effect or no significant effect in the longer run. The magnitude of the negative
and significant effect is large in the short run. If a firm with no link with damaged customers was
linked with a damaged customer, its sales growth rate would decline by 12 percentage points
(-0.169*[ln2-ln1]=-0.12) because of propagation of negative shocks. This finding suggests that
domestic suppliers of directly damaged firms are affected by a lack of demand from damaged
customers immediately after the earthquake, although the negative effect diminishes in a year either
through recovery or replacement of the damaged customers.
By contrast, we do not find any significant effect of links with damaged customers on non-US
suppliers in Table 6, as in the case of the effect of links with damaged suppliers in Table 5. This result
13
supports hypothesis 5a in the case of upstream propagation, suggesting that negative shocks did not
propagate from damaged customers in the US to their suppliers outside the US. The stark difference
between the presence of propagation within the US and absence of propagation beyond the US is our
major finding, and hence we examine the mechanism of this contrast further in Subsection 4.5.
Last, two-step links with damaged customers have an insignificant effect on US suppliers both in
the short and long run (columns [2] and [4], respectively, of Table 6) , partly supporting hypothesis 4.
For non-US suppliers, we find a substantial positive effect from two-step customers in the short run.
An increase from zero to one indirect link with a damaged two-step customer increases sales growth
by 10 percentage points within a few months. This result, a positive effect of disasters, is hard to
interpret. One possible reason is that damages from the hurricane lead to creative destruction, as
suggested by Skidmore and Toya (2002). However, as we cannot further examine the possibility of
creative destruction using our dataset, we simply conclude that damaged customers did not negatively
and substantially affect their indirect suppliers.
4.3. Robustness Checks
This subsection experiments with several alternative specifications to check the robustness of the
benchmark results presented in the previous subsection.
Dummies for supply-chain links
Although we have used the number of suppliers or customers in various types as the key independent
variables in our estimations, the effect of supply-chain links with damaged suppliers may not be
increasing in the number of such suppliers. Suppose, for example, that any material or part is
necessary for production of the focal firm's products and further that it cannot be substituted for
because of its specificity. Then, if any material or part is not supplied due to the hurricane, the firm
should completely stop its production. If this is the case, whether the firm is linked with any damaged
supplier, rather than the number of damaged suppliers of the firm, matters to sales growth. Therefore,
we experiment with dummy variables for the various types of supply-chain links examined in the
previous subsection.
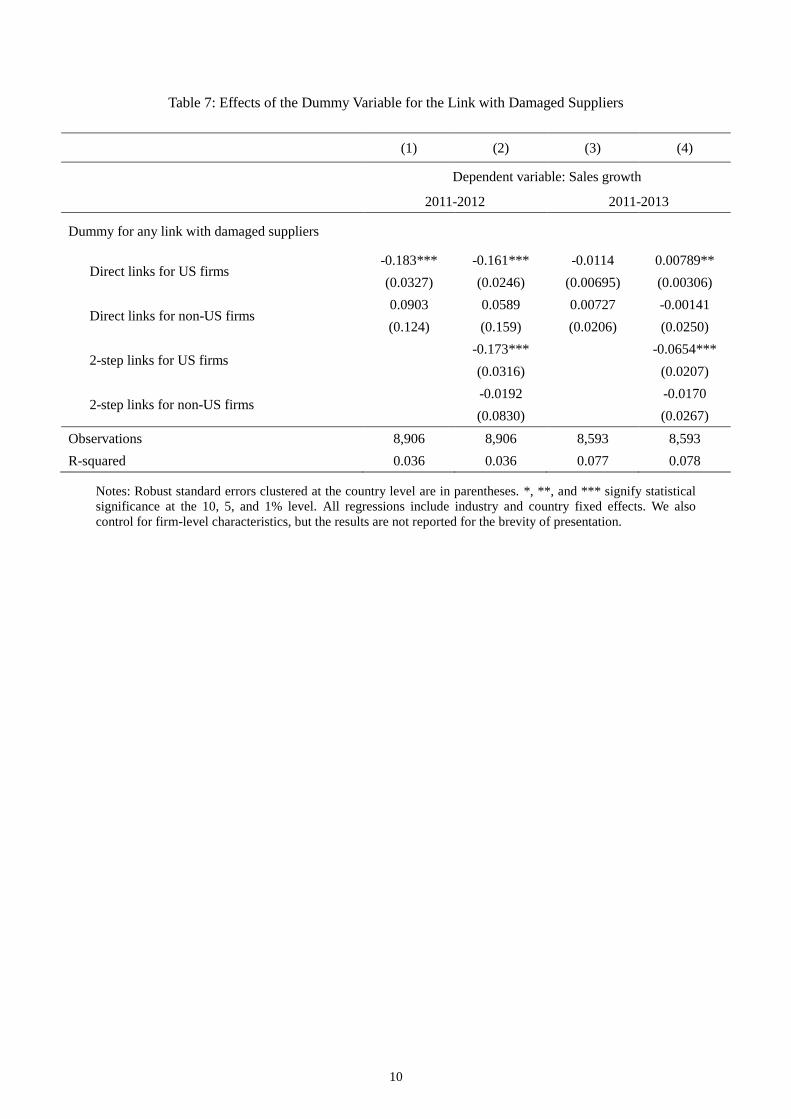
Table 7 presents the results from these alternative specifications. Columns (1) and (2) suggest
that when firms have a link with any damaged supplier, the sales growth of US firms is 16.1
percentage points lower than when they are not directly linked with any damaged supplier, while no
significant effect is observed for non-US firms. The results are qualitatively and quantitatively similar
to the baseline results in Table 5. However, some results in Table 7 differ from the benchmark results.
For example, the effect of the dummy for any direct link with damaged suppliers for US firms in the
long run is insignificant in column (3) of Table 7 and positive and significant in column (4), while the
corresponding effect using the number of links is negative and significant in columns (3) and (4) of

14
Table 5. In addition, the dummy for any two-step link with damaged suppliers for US firms has a
negative and significant effect both in the short and long run (columns [2] and [4], respectively, of
Table 7), while the number of such two-step links has no significant effect in either the short or long
run (columns [2] and [4], respectively, of Table 5). However, our main result showing the presence of
intra-national propagation in the short run and the absence of international propagation persists in
these alternative estimations.
Alternative definition of damaged firms
In the benchmark estimations, we define firms directly damaged by the hurricane as those in "very
highly damaged areas" identified by FEMA (2014) (Figure 2). However, in these "very highly
damaged areas," there must have been a variation in the level of damages across firms and households.
If this is the case, some of the firms defined as damaged in our data were not heavily damaged, and
accordingly, the effect of links with "damaged firms" in our data underestimates the effect of links
with truly damaged firms.
To identify links with truly damaged firms, we assume that when a firm is extremely damaged
and thus could not recover or needed a very long time to recover, supply-chain links with the firm
should have been lost after the hurricane. Therefore, we alternatively define links with damaged firms
as those with firms in the very highly damaged areas that were dropped after the hurricane. Then, we
conduct OLS estimations as before, using the number of damaged firms alternatively defined and
report the results in Table 8. Columns (1) and (2) indicate that the short-run effect of direct suppliers
and customers on sales growth of US firms is negative and significant, while their effect on firms
outside the US is insignificant. Columns (3) and (4) show damaged customers negatively affect
long-run sales growth of their suppliers in the US to a smaller extent than their short-run effect, while
no other effect is significant. These are mostly consistent with the benchmark results, confirming
propagation within the country but no propagation beyond the country.
Placebo tests
We confirmed the exogeneity of the negative shock from the hurricane using the balancing tests for
sales growth in the pre-disaster period, as shown in Table 4. However, we are still concerned about
whether our results are generated by the peculiar characteristics of damaged firms, because the
hurricane hit the industrial areas on the east coast of the US around New York City. To check whether
this is the case, we experiment with two sets of placebo tests. First, we estimate the effect of
supply-chain links with firms that are not in the damaged areas of the hurricane but are similar in
attributes to those in the damaged areas, which are selected from all US firms not directly damaged by
the hurricane using a propensity score matching (PSM) technique. That is, we estimate how the
dummy variable for damaged firms is correlated with the number of workers, amount of total assets,
and industry dummies using logit and match each damaged firm with another with the closest
15
predicted probability. Second, we estimate the effect of links with firms in neighboring states of the
very highly damaged areas, such as Vermont, New Hampshire, Maryland, the District of Colombia,
Ohio, Virginia, and West Virginia. In this placebo test, we assume that firms geographically close to
damaged firms are similar in attributes to damaged firms.
The results from the first and the second placebo tests are shown in Tables 9 and 10, respectively.
In the tables, some of the effects of the links with firms similar in attributes to or geographically close
to damaged firms are positive and significant, while no effect is negative and significant at the
5-percent level. These results suggest that because firms in the damaged areas around New York City
are likely to be more advanced than those in other areas in the world, a firm's links with firms similar
to the damaged firms are often positively correlated with the firm’s sales growth. Therefore, although
our benchmark results may underestimate the propagation effect, in other words, the true negative
effect of links with damaged firms may be larger in absolute terms than our estimates, it is unlikely
that our results overestimate the propagation effect.
4.4. Mechanism of No International Propagation
Our major finding in the previous sections is that the negative shock of the hurricane propagated
downstream and upstream within the country but not beyond the national borders. To examine the
mechanism behind this finding, we further test what firm attributes mitigate or amplify the
propagation and thus identify the source of the difference in the propagation effect between firms in
the same country and outside the country.
Geographic distance
A natural candidate for the source of the difference is geographic distance to damaged firms.
Therefore, we estimate whether the effect of links with damaged firms decays as the distance to the
damaged areas becomes greater, using a nonlinear equation following Keller (2002):
tan
(2011 ) , ,2011 , ,2011 2011
dis ce
i t US i US nonUS i nonUS i itSalesGrowth Shock e Shock X
, (2)
where distance is the distance from New York in kilometers, calculated from the address of each firm.
The results shown in Table 11 clearly indicate distance does not significantly affect propagation of the
shock, while the difference between propagation within and beyond the US is still present. Therefore,
we conclude that geographic distance itself does not play a major role in the absence of international
propagation.
Substitution of suppliers and customers
Another possible reason for the absence of international propagation is related to substitution of
supply-chain partners, as argued in Section 2.1 based on the finding of Barrot and Sauvagnat (2016).
16
When suppliers or customers of a particular firm are damaged by a disaster, the firm tries to seek
substitutes for the damaged partners. However, finding appropriate partners requires a certain search
cost, as suggested in an offshoring model in Antras, Fort, and Tintelnot (2017) and a production
networks model in Bernard, Moxnes, and Saito (2018). Hence, facing negative shocks to their
partners, only firms with sufficiently high productivity or with sufficiently high ability to gather
information can pay the search cost and find substitutes for damaged partners to mitigate the
propagation of shocks. This argument is analogous to that of the heterogeneous-firm models of trade
initiated by Melitz (2003), who concludes that only productive firms can export because of the initial
costs. Our argument is also in line with Allen (2014), who employs a search model and concludes that
larger producers can sell their products to destinations with higher prices because of the fixed search
cost.
These arguments suggest a possible reason for no international propagation. Because non-US firms
linked with damaged US firms are internationalized by definition and thus may be more productive
and have greater ability to collect information in the world market, they can substitute for damaged
partners more easily and mitigate the propagation of shocks. If this mechanism works, the same
mechanism should be applied to US firms, and thus we should observe smaller propagation to US
firms that can more easily substitute for damaged suppliers and customers.
For this purpose, we incorporate measures of the US firm's capability to substitute for damaged
partners, such as productivity and search costs. As we have no precise measure for productivity or
search costs, we experiment with two proxies. First, we employ the share of foreign firms in all
suppliers and customers, assuming that internationalized firms are likely to be more productive than
non-internationalized firms, following the theoretical consideration of Melitz (2003) and empirical
evidence of Bernard and Jensen (2004) and many others. Second, we utilize the number of workers,
following Allen (2014), who finds that firm size is negatively correlated with search costs. Then, we
include the interaction term between the number of damaged suppliers or customers for each US firm
and one of the two measures to examine whether firms' ability to substitute for supply-chain partners
mitigates propagation of shocks.
The results shown in columns (1) and (2) in panel (A) of Table 12 indicate that the negative effect
of links with damaged suppliers on their customers in the US is substantially alleviated when the US
firms' share of foreign links or number of workers is larger. As before, columns (3) and (4) indicate
that the long-run effect is less significant and smaller in size. Panel (B) of Table 12 presents results for
upstream propagation. The effect of the interaction term with the number of workers is positive and
significant only at the 10-percent level in the short run (column [2]), whereas the interaction term with
the share of international links has a significant effect at the five-percent level only in the long run
(column [3]). Although weaker, the results for upstream propagation are consistent with those for
downstream propagation in panel (A).
Overall, our results in Table 12 point to the important role of the capability of substituting for
17
damaged partners in mitigating propagation of shocks. Accordingly, we conclude that the negative
shock from the hurricane did not propagate internationally because internationalized firms are more
productive and have greater ability to collect information and thus can find new partners when current
partners are damaged by a disaster. This conclusion is consistent with Barrot and Sauvagnat (2016),
who find that the propagation effect is larger when inputs are more specific, because input specificity
implies difficulty substituting partners.
4.5. Network Density
Furthermore, we investigate the effect of network structure on propagation of shocks. In particular, we
focus on the density of each firm's egocentric network, as explained in Section 2.1 and summarized as
hypotheses 6a and 6b. Network density is measured by the local clustering coefficient defined by the
ratio of the actual number of links between the focal node's partners/neighbors to the number of all
possible pairs among the partners, representing how densely the focal node's partners/neighbors are
linked with each other (Section 3.2). Using network density and its interaction term with links with
directly damaged firms, we test how network density affects the propagation effect. Because we do
not observe clear inverted U-shape relationships between density and propagation of disaster shocks,
the results presented do not include the square term of density.
In columns (1) and (2) of Table 13, we find that the interaction term between the number of links
with damaged suppliers or customers for US firms and the local clustering coefficient is negative and
significant. This finding implies that the negative effects of damaged suppliers and customers are
circulated within dense networks in the US and intensified. This supports hypothesis 6a for US firms
and is consistent with the theoretical finding of Acemoglu, Ozdaglar, and Tahbaz-Salehi (2015) when
shocks are sufficiently large. By contrast, columns (1) and (3) of Table 13 show the interaction term
for non-US firms has a positive and significant effect, supporting hypothesis 6b. This contrasting
finding suggests that denser networks between US and non-US firms create social capital among them,
leading to higher sales growth, a finding that is consistent with the empirical results of Durlauf and
Fafchamps (2005) and Centola (2010).
5. Conclusions
In this study, we take Hurricane Sandy, which struck the east coast of the US in 2012, as a source of
negative economic shocks and examine whether the shock propagated to the world economy through
global supply chains. Specifically, using firm-level data on global supply chains, we analyze how
sales growth of firms in and outside the US is affected by their direct and indirect suppliers and
customers directly damaged by the hurricane.
Our results show that direct links with damaged suppliers and customers decreased the sales
growth of firms within the US, while we do not observe any negative effect on non-US firms.
18
Therefore, we conclude that negative economic shocks are less likely to propagate internationally than
within a country. Our further analysis shows a smaller propagation effect on US firms that are linked
with foreign firms or larger in size than other US firms. These results suggest that internationalized or
large firms can mitigate propagation of shocks through supply chains because they can substitute for
damaged partners more easily due to their high productivity and low search costs. In addition, we find
that the propagation effect on US firms is larger when their ego network is denser, that is, their
partners are connected with each other. All these findings imply that supply-chain links with diverse
partners, including foreign partners and partners that are not linked with each other, lead to economic
resilience to propagation of negative shocks.
Although our study is unique in that we investigate the difference between intra- and international
propagation, which has not been studied owing to the lack of data on global supply chains, there are
several limitations. First, our data are limited mostly to publicly listed firms and their major
supply-chain relationships because our major data source relies on public information such as
financial reports and websites. Thus, our results ignoring minor links may have underestimated
propagation of shocks. Second, because our data is not at the establishment level but at the firm level,
we identify firms directly damaged by the hurricane by the location of their headquarters. If a major
plant of a firm whose headquarters is not located in the disaster area is in the disaster area and heavily
damaged by the hurricane, we classify this firm as one not directly damaged by the hurricane. This
may also have resulted in underestimation of the true effect of the hurricane. However, it should be
emphasized that our major conclusion that negative shocks propagate to a lesser extent across
countries than within a country is not affected by the two caveats, because major links of US firms
with foreign firms are identified through their financial reports in the same way as those with US
firms and the two caveats affect intra-national and international propagation in the same way. Finally,
although our results imply benefits of internationalization and network diversification in terms of
economic resilience, we did not conduct any cost-benefit analysis. Thus, the investigation of the
optimal level of diversification is left for future study.
19
References
Acemoglu, Daron, Vasco M. Carvalho, Asuman Ozdaglar, and Alireza Tahbaz-Salehi. 2012.
"The Network Origins of Aggregate Fluctuations." Econometrica 80 (5):1977-2016.
doi: 10.3982/ECTA9623.
Acemoglu, Daron, Asuman Ozdaglar, and Alireza Tahbaz-Salehi. 2015. "Systemic risk and
stability in financial networks." The American Economic Review 105 (2):564-608.
Ahmadjian, Christina L, and James R Lincoln. 2001. "Keiretsu, governance, and learning:
Case studies in change from the Japanese automotive industry." Organization
Science 12 (6):683-701.
Allen, Franklin, and Douglas Gale. 2000. "Financial contagion." Journal of political
economy 108 (1):1-33.
Allen, Treb. 2014. "Information frictions in trade." Econometrica 82 (6):2041-2083.
Antras, Pol, Teresa C Fort, and Felix Tintelnot. 2017. "The margins of global sourcing:
Theory and evidence from US firms." American Economic Review 107 (9):2514-64.
Aoki, Masahiko. 1988. Information, incentives and bargaining in the Japanese economy: a
microtheory of the Japanese Economy. Cambridge: Cambridge University Press.
Baldwin, Richard. 2016. The Great Convergence. Boston: Belknap Press.
Barabási, Albert-László. 2016. Network Science. Cambridge: Cambridge University Press.
Barrot, Jean-Noël, and Julien Sauvagnat. 2016. "Input Specificity and the Propagation of
Idiosyncratic Shocks in Production Networks." The Quarterly Journal of Economics
131 (3):1543-1592.
Behrens, Kristian, Gregory Corcos, and Giordano Mion. 2013. "Trade crisis? What trade
crisis?" Review of economics and statistics 95 (2):702-709.
Bernard, Andrew B, J Bradford Jensen, Stephen J Redding, and Peter K Schott. 2009. "The
margins of US trade." American Economic Review 99 (2):487-93.
Bernard, Andrew B, Andreas Moxnes, and Yukiko U Saito. 2018. "Production networks,
geography and firm performance." Journal of Political Economy forthcoming.
Bernard, Andrew B., and J. Bradford Jensen. 2004. "Why Some Firms Export." Review of
Economics and Statistics 86 (2):561-569.
Bigio, Saki, and Jennifer La’O. 2016. "Financial Frictions in Production Networks."
National Bureau of Economic Research Working Paper Series No. 22212. doi:
10.3386/w22212.
Boehm, Christoph, Aaron Flaaen, and Nitya Pandalai-Nayar. 2015. "Input Linkages and the
Transmission of Shocks: Firm-Level Evidence from the 2011 Tōhoku Earthquake."
US Census Bureau Center for Economic Studies Paper No. CES-WP-15-28.
Bricongne, Jean-Charles, Lionel Fontagné, Guillaume Gaulier, Daria Taglioni, and Vincent
Vicard. 2012. "Firms and the global crisis: French exports in the turmoil." Journal

20
of international Economics 87 (1):134-146.
Cabinet Office of Japan. 2012. White Paper: Disaster Management in Japan 2012.
Cadot, Olivier, Céline Carrère, and Vanessa Strauss-Kahn. 2011. "Export diversification:
What's behind the hump?" Review of Economics and Statistics 93 (2):590-605.
Caliendo, Lorenzo, Fernando Parro, Esteban Rossi-Hansberg, and Pierre-Daniel Sarte. 2014.
The impact of regional and sectoral productivity changes on the US economy. In
NBER Working Paper, edited by National Bureau of Economic Research.
Carvalho, Vasco M, Makoto Nirei, Yukiko U Saito, and Alireza Tahbaz-Salehi. 2016. Supply
chain disruptions: Evidence from the Great East Japan earthquake. In Columbia
Business School Research Paper, edited by Columbia University.
Cavallo, Eduardo, Andrew Powell, and Oscar Becerra. 2010. "Estimating the direct economic
damages of the earthquake in Haiti." The Economic Journal 120 (546):F298-F312.
Center for Research on the Epidemiology of Disasters. 2017. CRED Emergency Events
Database, EM-DAT Database.
Centola, Damon. 2010. "The Spread of Behavior in an Online Social Network Experiment."
Science 329 (5996):1194-1197.
Clark, Todd E, and Eric Van Wincoop. 2001. "Borders and business cycles." Journal of
international Economics 55 (1):59-85.
Coleman, James S. 1988. "Social capital in the creation of human capital." American
journal of sociology 94:S95-S120.
De Mel, Suresh, David McKenzie, and Christopher Woodruff. 2012. "Enterprise Recovery
Following Natural Disasters." The Economic Journal 122 (559):64-91. doi:
10.1111/j.1468-0297.2011.02475.x.
Di Giovanni, Julian, and Andrei A Levchenko. 2010. "Putting the parts together: trade,
vertical linkages, and business cycle comovement." American Economic Journal:
Macroeconomics 2 (2):95-124.
Durlauf, SN, and M Fafchamps. 2005. "Social Capital." In Handbook of Economic Growth,
edited by P Aghion and SN Durlauf, 1673-1676. Amsterdam: Elsevier B.V.
Eaton, Jonathan, Samuel Kortum, and Francis Kramarz. 2004. "Dissecting trade: Firms,
industries, and export destinations." American Economic Review 94 (2):150-154.
Elliott, Matthew, Benjamin Golub, and Matthew O Jackson. 2014. "Financial networks and
contagion." American Economic Review 104 (10):3115-3153.
Federal Emergency Management Agency. 2013. Building Point Damage Determination
Estimates.
Federal Emergency Management Agency. 2014. FEMA Hurricane Sandy Impact Analysis
FINAL.
Felbermayr, Gabriel, and Jasmin Gröschl. 2013. "Natural disasters and the effect of trade on
income: A new panel IV approach." European Economic Review 58 (Supplement
C):18-30. doi: https://doi.org/10.1016/j.euroecorev.2012.11.008.
21
Freixas, Xavier, Bruno M Parigi, and Jean-Charles Rochet. 2000. "Systemic risk, interbank
relations, and liquidity provision by the central bank." Journal of money, credit and
banking:611-638.
Gassebner, Martin, Alexander Keck, and Robert Teh. 2010. "Shaken, Not Stirred: The Impact
of Disasters on International Trade." Review of International Economics 18
(2):351-368. doi: doi:10.1111/j.1467-9396.2010.00868.x.
Gilsing, Victor, Bart Nooteboom, Wim Vanhaverbeke, Geert Duysters, and Ad van den Oord.
2008. "Network embeddedness and the exploration of novel technologies:
Technological distance, betweenness centrality and density." Research policy 37
(10):1717-1731.
Jackson, Matthew O. 2010. Social and economic networks: Princeton University Press.
Keller, Wolfgang. 2002. "Geographic Localization of International Technology Diffusion."
American Economic Review 92 (1):120-142. doi: 10.1257/000282802760015630.
Lu, Yi, Yoshiaki Ogura, Yasuyuki Todo, and Lianming Zhu. 2017. Supply Chain Disruptions
and Trade Credit. In RIETI Discussion Paper, edited by Research Institute of
Economy Trade and Industry.
Martincus, Christian Volpe, and Andrea Molinari. 2007. "Regional business cycles and
national economic borders: what are the effects of trade in developing countries?"
Review of World Economics 143 (1):140-178.
Melitz, Marc J. 2003. "The Impact of Trade on Intra-Industry Reallocations and Aggregate
Industry Productivity." Econometrica 71 (6):1695-1725.
Oh, Chang Hoon, and Rafael Reuveny. 2010. "Climatic natural disasters, political risk, and
international trade." Global Environmental Change 20 (2):243-254. doi:
https://doi.org/10.1016/j.gloenvcha.2009.11.005.
Page, Lawrence, Sergey Brin, Rajeev Motwani, and Terry Winograd. 1999. The PageRank
citation ranking: bringing order to the web. In Technical Report, Stanford InfoLab.
Panteladis, Ioannis, and Maria Tsiapa. 2014. "Fragmented Integration and Business Cycle
Synchronization in the Greek Regions." European Planning Studies 22 (5):909-928.
Rauch, James E. 1999. "Networks versus markets in international trade." Journal of
International Economics 48 (1):7-35.
Rost, Katja. 2011. "The strength of strong ties in the creation of innovation." Research
Policy 40 (4):588-604.
Skidmore, Mark, and Hideki Toya. 2002. "Do natural disasters promote long‐run growth?"
Economic Inquiry 40 (4):664-687.
Todo, Yasuyuki, Kentaro Nakajima, and Petr Matous. 2015. "How Do Supply Chain
Networks Affect the Resilience of Firms to Natural Disasters? Evidence from the
Great East Japan Earthquake." Journal of Regional Science 55 (2):209-229. doi:
10.1111/jors.12119.
United States Census Bureau. 2017. USA Trade Online.
World Bank. 2018. World Developent Indicators.

22
Wynne, Mark A, and Jahyeong Koo. 2000. "Business cycles under monetary union: a
comparison of the EU and US." Economica 67 (267):347-374.
1
Figure 1: Exports from Seaports in New York and New Jersey
Data Source: United States Census Bureau (2017)
Notes: This figure shows the amount of monthly exports from New York and New Jersey from August to
December, 2012. Hurricane Sandy hit the east coast of the US, including New York city, in October 2012.
3,000,000,000
3,500,000,000
4,000,000,000
4,500,000,000
5,000,000,000
5,500,000,000
August-2012 September-2012 October-2012 November-2012 December-2012
US$
2
Figure 2: Area Damaged by Hurricane Sandy
Data Source: FEMA (2014).
Notes: This map is drawn by the author using ArcGIS Desktop. Red and yellow areas indicate counties that were
impacted by the hurricane at the "very high" and "high"-"moderate" level defined by FEMA (2014),
respectively.
3
Table 1: Number of Firms by Country of Location (Top 5 Countries)
(1) (2) (3) (4) (5)
Country
Number of
firms in the
sample
Share in the
sample (%)
Number of firms
in the disaster
areas dropped
from the sample
Number of
publicly
listed firms
in 2011
(1+3)/(4)
Japan 1,855 20.83 2,280 0.814
United States 1,660 18.64 1,709 4,171 0.808
China 1,559 17.51 2,342 0.666
United Kingdom 541 6.07 1,987 0.272
France 397 4.46 586 0.677
Data Source: World Bank (2018)
4
Table 2: Summary Statistics
Variable Mean S.D. Min. Median Max
Links with suppliers in 2011
# of suppliers 1.897 8.068 0 0 233
-- in logs 0.432 0.825 0 0 5.455
# of domestic suppliers 0.930 5.255 0 0 189
-- in logs 0.240 0.614 0 0 5.247
# of suppliers in 2 steps 22.921 91.05 0 0 1341
-- in logs 0.783 1.631 0 0 7.202
Links with damaged suppliers in 2011
# of links with damaged suppliers 0.090 0.631 0 0 25
Dummy 0.047 0.212 0 0 1
# of links with damaged suppliers for US firms 0.071 0.604 0 0 25
-- in logs 0.033 0.198 0 0 3.258
Dummy 0.032 0.177 0 0 1
# of links with damaged suppliers for non-US firms 0.019 0.188 0 0 7
-- in logs 0.012 0.100 0 0 2.079
Dummy 0.014 0.119 0 0 1
# of 2-step links with damaged suppliers for US firms 0.791 4.458 0 0 78
-- in logs 0.150 0.584 0 0 4.369
Dummy 0.076 0.265 0 0 1
# of 2-step links with damaged suppliers for non-US firms 0.353 2.523 0 0 71
-- in logs 0.083 0.410 0 0 4.277
Dummy 0.052 0.222 0 0 1
Links with customers in 2011
# of customers 2.535 7.822 0 0 196
-- in logs 0.507 0.953 0 0 5.283
# of domestic customers 0.974 3.715 0 0 108
-- in logs 0.277 0.659 0 0 4.691
# of customers in 2 steps 30.153 114.986 0 0 2297
-- in logs 0.919 1.780 0 0 7.740
Links with damaged customers in 2011
# of links with damaged customers for US firms 0.066 0.432 0 0 11
-- in logs 0.034 0.192 0 0 2.485
# of links with damaged customers for non-US firms 0.021 0.195 0 0 6
-- in logs 0.013 0.106 0 0 1.946
# of 2-step links with damaged customers for US firms 0.887 4.261 0 0 88
-- in logs 0.180 0.629 0 0 4.489
# of 2-step links with damaged customers for non-US
firms 0.359 2.408 0 0 60
-- in logs 0.090 0.419 0 0 4.111
Other networks measure in 2011
PageRank 0.000057 0.0001 0.000017 0.000026 0.003018
Firm attributes
Sales growth from 2006 to 2011 0.122 0.288 -0.925 0.078 10.111
Sales growth from 2011 to 2012 0.192 3.496 -1.000 0.014 180.563
Sales growth from 2011 to 2013 0.056 0.532 -1.000 0.014 19.456
Sales per worker in 2011 688 8268 0 237 496205
-- in logs 5.479 1.152 -6.302 5.466 13.115
# of workers in 2011 5416 30039 1 1162 2200000
-- in logs 6.978 1.853 0 7.058 14.604
Value of total assets in 2011 1837887 7910619 4 341532 270441984
-- in logs 12.695 1.886 1.495 12.741 19.416 Firm age 35.392 31.677 6 23 493

5
6
Table 3: Number of Firms by Industry
Industry Group Freq. Percent
Capital Goods 1476 17
Materials 1049 12
Technology Hardware & Equipment 831 9
Software & Services 660 7
Consumer Durables & Apparel 558 6
Food, Beverage & Tobacco 476 5
Retailing 417 5
Energy 371 4
Consumer Services 365 4
Commercial & Professional Services 363 4
Pharmaceuticals, Biotechnology & Life Sciences 360 4
Transportation 323 4
Health Care Equipment & Services 308 3
Media 281 3
Semiconductors & Semiconductor Equipment 264 3
Automobiles & Components 254 3
Utilities 250 3
Food & Staples Retailing 132 1
Telecommunication Services 85 1
Household & Personal Products 83 1
7
Table 4: Balancing Tests
(A) Downstream propagation
(B) Upstream propagation
Notes: Robust standard errors clustered at the country level are in parentheses. *, **, and *** signify statistical
significance at the 10, 5, and 1% level. Country and industry dummies are included.
(1) (2) (3) (4)
Dependent variable: Sales growth
2006-2011Sales growth from 2006 to 2011
# of links with damaged suppliers for US firms (log) -0.011
(0.016)
# of links with damaged suppliers for non-US firms (log) -0.015
(0.030)
# of 2-step links with damaged suppliers for US firms (log) -0.009
(0.006)
# of 2-step links with damaged suppliers for non-US firms (log) 0.009
(0.008)
Observations 8,906 8,906 8,906 8,906
R-squared 0.089 0.089 0.089 0.089
(1) (2) (3) (4)
Dependent variable: Sales growth
2006-2011Sales growth from 2006 to 2011
# of links with damaged customers for US firms (log) -0.010
(0.017)
# of links with damaged customers for non-US firms (log) 0.002
(0.028)
# of 2-step links with damaged customers for US firms (log) -0.006
(0.006)
# of 2-step links with damaged customers for non-US firms (log) -0.0003
(0.0076)
Observations 8,906 8,906 8,906 8,906
R-squared 0.089 0.089 0.089 0.089
8
Table 5: Effects of the Number of Damaged Suppliers
(1) (2) (3) (4)
Dependent variable: Sales growth
2011-2012 2011-2013
# of links with damaged suppliers (log)
Direct links for US firms -0.181*** -0.192*** -0.0274*** -0.00850*
(0.0339) (0.0249) (0.00770) (0.00477)
Direct links for non-US firms 0.114 0.0623 0.00808 -0.00988
(0.146) (0.215) (0.0248) (0.0352)
2-step links for US firms 0.0198
-0.0173
(0.0506)
(0.0134)
2-step links for non-US firms 0.0621
0.00828
(0.0948)
(0.0190)
Observations 8,906 8,906 8,593 8,593
R-squared 0.036 0.036 0.077 0.078
Notes: Robust standard errors clustered at the country level are in parentheses. *, **, and *** signify statistical
significance at the 10, 5, and 1% level. All regressions include industry and country fixed effects. We also
control for firm-level characteristics, but the results are not reported for the brevity of presentation.
9
Table 6: Effects of the Number of Damaged Customers
(1) (2) (3) (4)
Dependent variable: Sales growth
2011-2012 2011-2013
# of links with damaged customers (log)
Direct links for US firms -0.169** -0.162** -0.0303** -0.00520
(0.0674) (0.0778) (0.0142) (0.00917)
Direct links for non-US firms 0.166 0.0473 0.0262 -0.0141
(0.141) (0.130) (0.0305) (0.0321)
2-step links for US firms 0.0531
-0.0108
(0.0487)
(0.00715)
2-step links for non-US firms 0.148**
0.0302**
(0.0602)
(0.0106)
Observations 8,906 8,906 8,593 8,593
R-squared 0.036 0.036 0.077 0.078
Notes: Robust standard errors clustered at the country level are in parentheses. *, **, and *** signify statistical
significance at the 10, 5, and 1% level. All regressions include industry and country fixed effects. We also
control for firm-level characteristics, but the results are not reported for the brevity of presentation.
10
Table 7: Effects of the Dummy Variable for the Link with Damaged Suppliers
(1) (2) (3) (4)
Dependent variable: Sales growth
2011-2012 2011-2013
Dummy for any link with damaged suppliers
Direct links for US firms -0.183*** -0.161*** -0.0114 0.00789**
(0.0327) (0.0246) (0.00695) (0.00306)
Direct links for non-US firms 0.0903 0.0589 0.00727 -0.00141
(0.124) (0.159) (0.0206) (0.0250)
2-step links for US firms -0.173***
-0.0654***
(0.0316)
(0.0207)
2-step links for non-US firms -0.0192
-0.0170
(0.0830)
(0.0267)
Observations 8,906 8,906 8,593 8,593
R-squared 0.036 0.036 0.077 0.078
Notes: Robust standard errors clustered at the country level are in parentheses. *, **, and *** signify statistical
significance at the 10, 5, and 1% level. All regressions include industry and country fixed effects. We also
control for firm-level characteristics, but the results are not reported for the brevity of presentation.
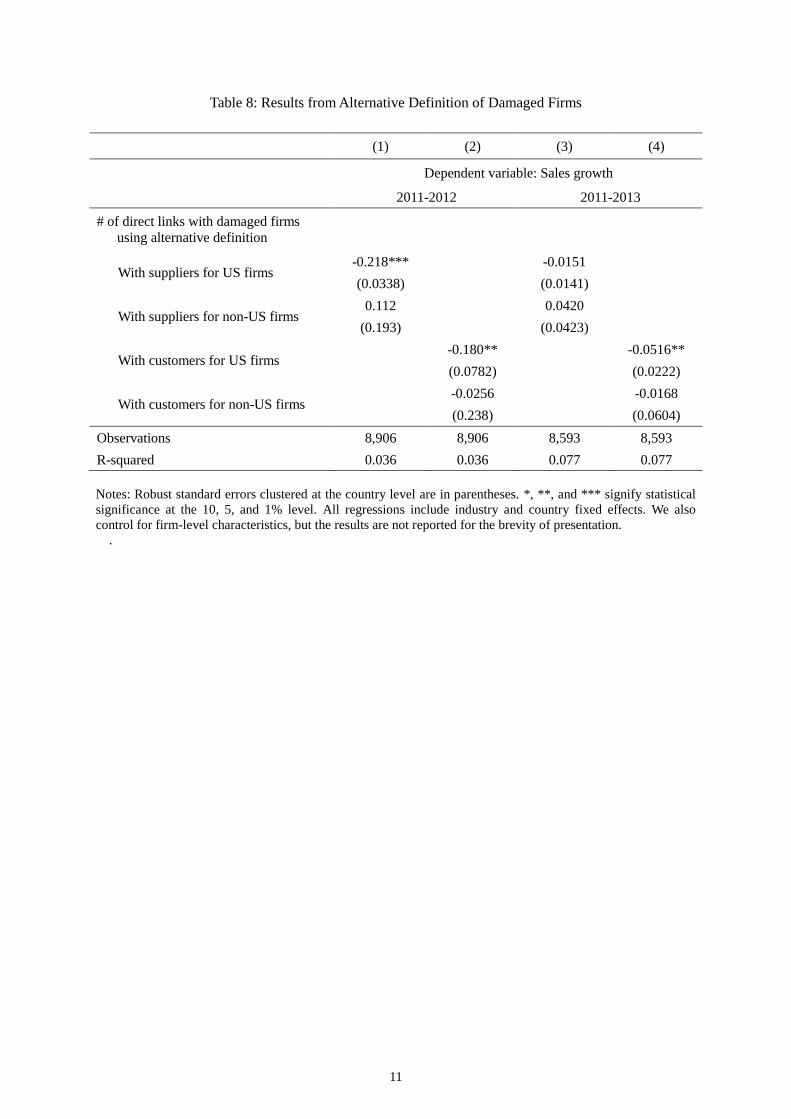
11
Table 8: Results from Alternative Definition of Damaged Firms
(1) (2) (3) (4)
Dependent variable: Sales growth
2011-2012 2011-2013
# of direct links with damaged firms
using alternative definition
With suppliers for US firms -0.218***
-0.0151
(0.0338)
(0.0141)
With suppliers for non-US firms 0.112
0.0420
(0.193)
(0.0423)
With customers for US firms -0.180**
-0.0516**
(0.0782)
(0.0222)
With customers for non-US firms -0.0256
-0.0168
(0.238)
(0.0604)
Observations 8,906 8,906 8,593 8,593
R-squared 0.036 0.036 0.077 0.077
Notes: Robust standard errors clustered at the country level are in parentheses. *, **, and *** signify statistical
significance at the 10, 5, and 1% level. All regressions include industry and country fixed effects. We also
control for firm-level characteristics, but the results are not reported for the brevity of presentation. .
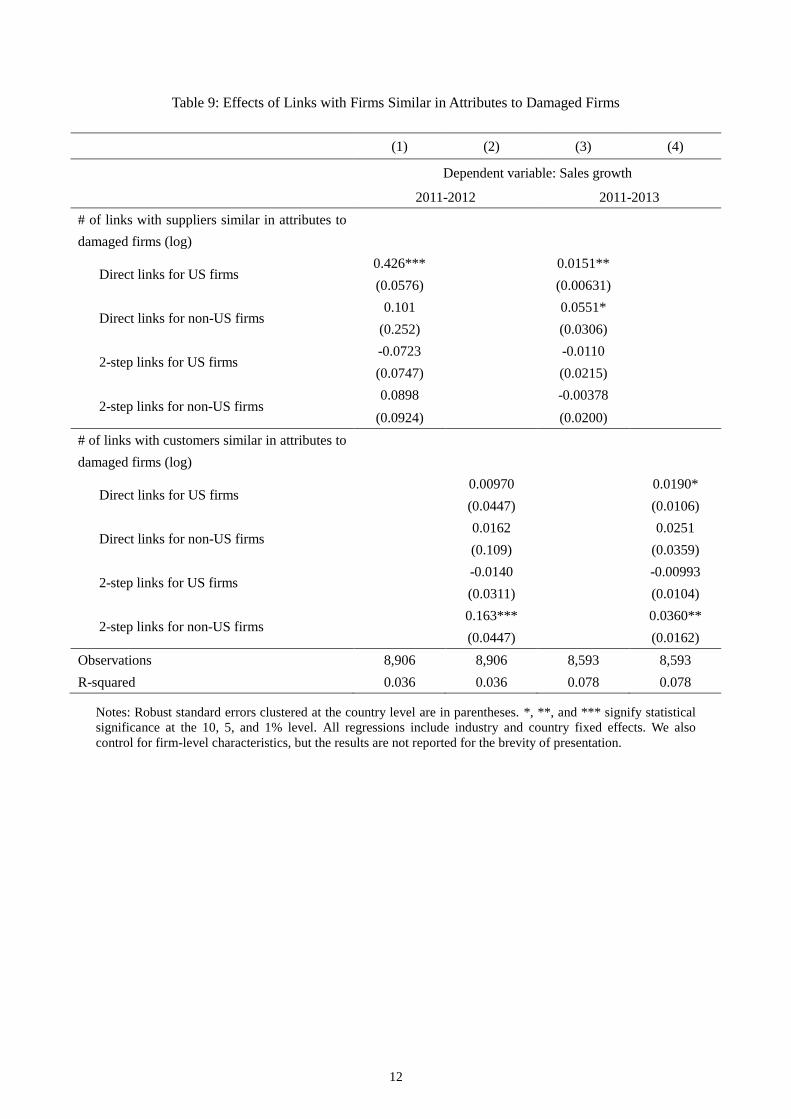
12
Table 9: Effects of Links with Firms Similar in Attributes to Damaged Firms
(1) (2) (3) (4)
Dependent variable: Sales growth
2011-2012 2011-2013
# of links with suppliers similar in attributes to
damaged firms (log)
Direct links for US firms 0.426*** 0.0151**
(0.0576) (0.00631)
Direct links for non-US firms 0.101 0.0551*
(0.252) (0.0306)
2-step links for US firms -0.0723 -0.0110
(0.0747) (0.0215)
2-step links for non-US firms 0.0898 -0.00378
(0.0924) (0.0200)
# of links with customers similar in attributes to
damaged firms (log)
Direct links for US firms 0.00970 0.0190*
(0.0447) (0.0106)
Direct links for non-US firms 0.0162 0.0251
(0.109) (0.0359)
2-step links for US firms -0.0140 -0.00993
(0.0311) (0.0104)
2-step links for non-US firms 0.163*** 0.0360**
(0.0447) (0.0162)
Observations 8,906 8,906 8,593 8,593
R-squared 0.036 0.036 0.078 0.078
Notes: Robust standard errors clustered at the country level are in parentheses. *, **, and *** signify statistical
significance at the 10, 5, and 1% level. All regressions include industry and country fixed effects. We also
control for firm-level characteristics, but the results are not reported for the brevity of presentation.
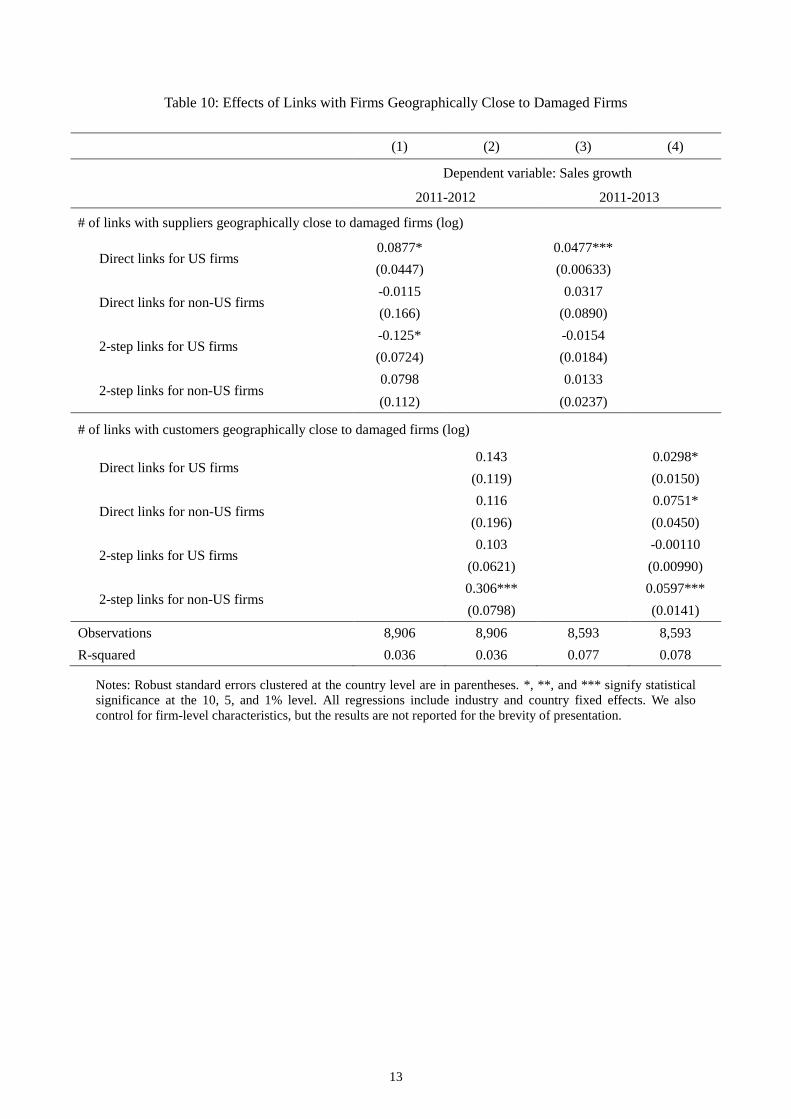
13
Table 10: Effects of Links with Firms Geographically Close to Damaged Firms
(1) (2) (3) (4)
Dependent variable: Sales growth
2011-2012 2011-2013
# of links with suppliers geographically close to damaged firms (log)
Direct links for US firms 0.0877* 0.0477***
(0.0447) (0.00633)
Direct links for non-US firms -0.0115 0.0317
(0.166) (0.0890)
2-step links for US firms -0.125* -0.0154
(0.0724) (0.0184)
2-step links for non-US firms 0.0798 0.0133
(0.112) (0.0237)
# of links with customers geographically close to damaged firms (log)
Direct links for US firms 0.143 0.0298*
(0.119) (0.0150)
Direct links for non-US firms 0.116 0.0751*
(0.196) (0.0450)
2-step links for US firms 0.103 -0.00110
(0.0621) (0.00990)
2-step links for non-US firms 0.306*** 0.0597***
(0.0798) (0.0141)
Observations 8,906 8,906 8,593 8,593
R-squared 0.036 0.036 0.077 0.078
Notes: Robust standard errors clustered at the country level are in parentheses. *, **, and *** signify statistical
significance at the 10, 5, and 1% level. All regressions include industry and country fixed effects. We also
control for firm-level characteristics, but the results are not reported for the brevity of presentation.
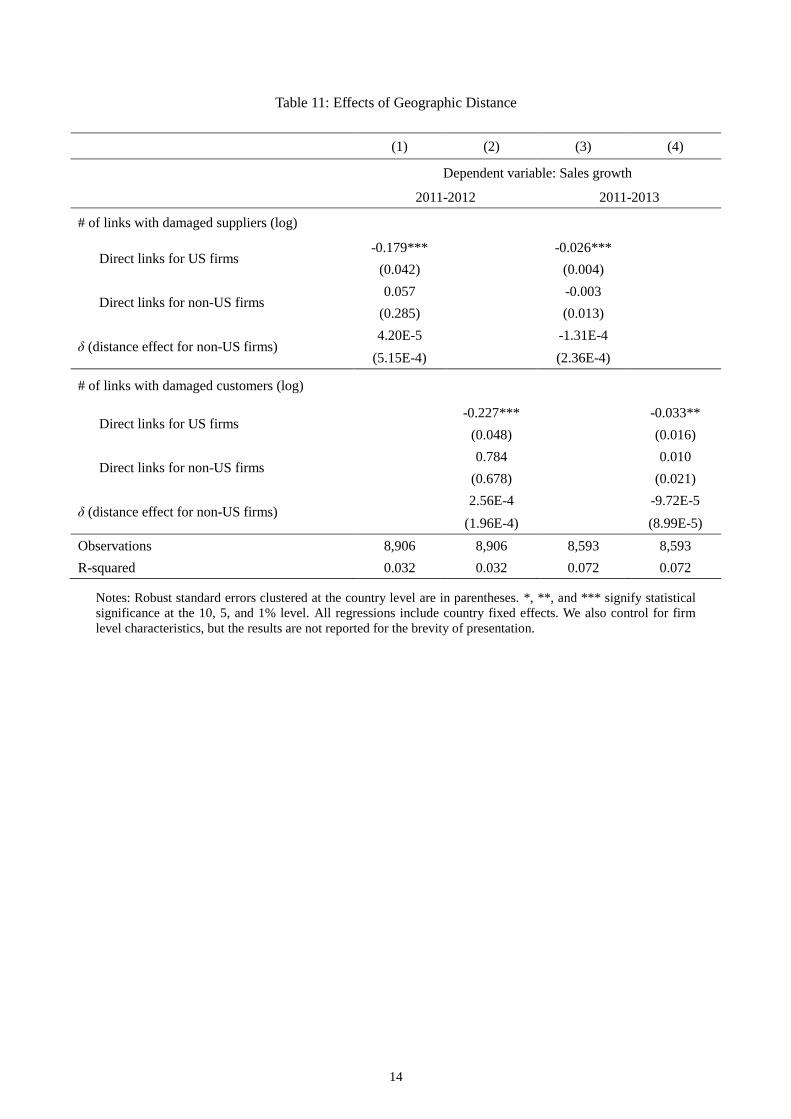
14
Table 11: Effects of Geographic Distance
(1) (2) (3) (4)
Dependent variable: Sales growth
2011-2012 2011-2013
# of links with damaged suppliers (log)
Direct links for US firms -0.179*** -0.026***
(0.042) (0.004)
Direct links for non-US firms 0.057 -0.003
(0.285) (0.013)
δ (distance effect for non-US firms) 4.20E-5 -1.31E-4
(5.15E-4) (2.36E-4)
# of links with damaged customers (log)
Direct links for US firms -0.227*** -0.033**
(0.048) (0.016)
Direct links for non-US firms 0.784 0.010
(0.678) (0.021)
δ (distance effect for non-US firms) 2.56E-4 -9.72E-5
(1.96E-4) (8.99E-5)
Observations 8,906 8,906 8,593 8,593
R-squared 0.032 0.032 0.072 0.072
Notes: Robust standard errors clustered at the country level are in parentheses. *, **, and *** signify statistical
significance at the 10, 5, and 1% level. All regressions include country fixed effects. We also control for firm
level characteristics, but the results are not reported for the brevity of presentation.
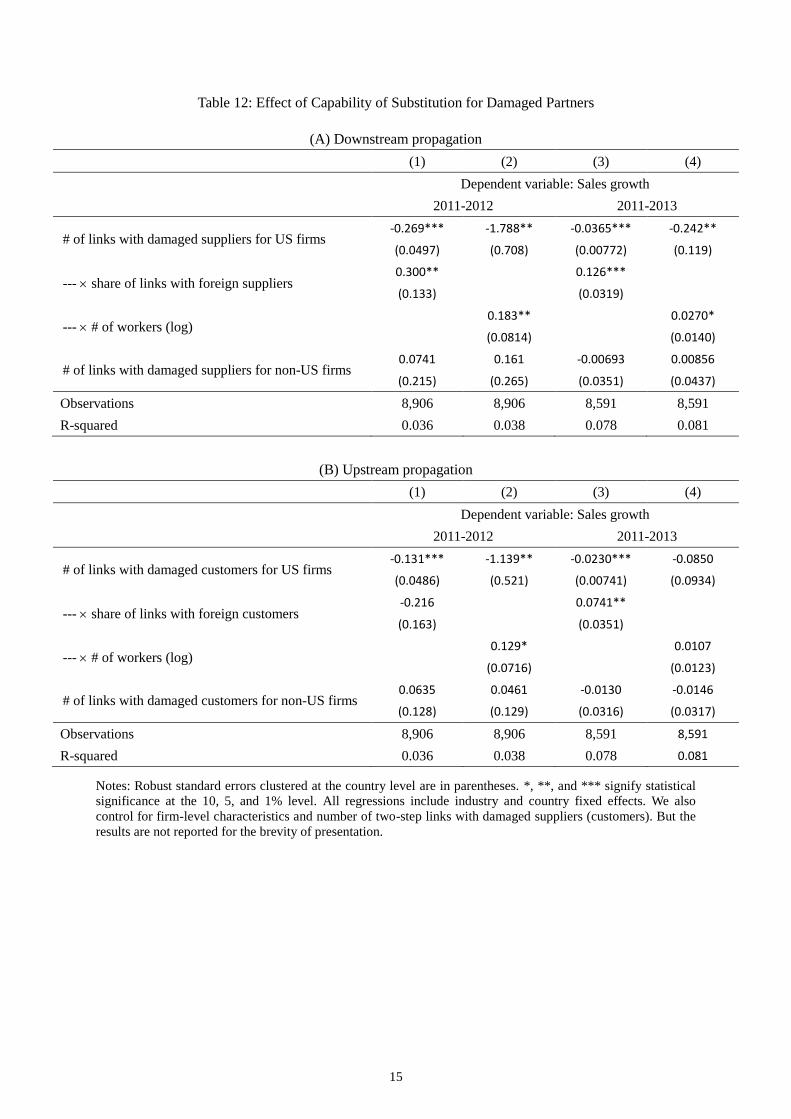
15
Table 12: Effect of Capability of Substitution for Damaged Partners
(A) Downstream propagation
(1) (2) (3) (4)
Dependent variable: Sales growth
2011-2012 2011-2013
# of links with damaged suppliers for US firms -0.269*** -1.788** -0.0365*** -0.242**
(0.0497) (0.708) (0.00772) (0.119)
--- share of links with foreign suppliers 0.300** 0.126***
(0.133) (0.0319)
--- # of workers (log) 0.183** 0.0270*
(0.0814) (0.0140)
# of links with damaged suppliers for non-US firms 0.0741 0.161 -0.00693 0.00856
(0.215) (0.265) (0.0351) (0.0437)
Observations 8,906 8,906 8,591 8,591
R-squared 0.036 0.038 0.078 0.081
(B) Upstream propagation
(1) (2) (3) (4)
Dependent variable: Sales growth
2011-2012 2011-2013
# of links with damaged customers for US firms -0.131*** -1.139** -0.0230*** -0.0850
(0.0486) (0.521) (0.00741) (0.0934)
--- share of links with foreign customers -0.216 0.0741**
(0.163) (0.0351)
--- # of workers (log) 0.129* 0.0107
(0.0716) (0.0123)
# of links with damaged customers for non-US firms 0.0635 0.0461 -0.0130 -0.0146
(0.128) (0.129) (0.0316) (0.0317)
Observations 8,906 8,906 8,591 8,591
R-squared 0.036 0.038 0.078 0.081
Notes: Robust standard errors clustered at the country level are in parentheses. *, **, and *** signify statistical
significance at the 10, 5, and 1% level. All regressions include industry and country fixed effects. We also
control for firm-level characteristics and number of two-step links with damaged suppliers (customers). But the
results are not reported for the brevity of presentation.

16
Table 13: Effect of Network Density
(1) (2) (3) (4)
Dependent variable: Sales growth
2011-2012 2011-2013
Downstream propagation
# of links with damaged suppliers for US firms -0.125*** -0.00909
(0.0255) (0.00864)
--- local clustering coefficient -0.724** 0.0285
(0.278) (0.0895)
# of links with damaged suppliers for non-US firms -0.0262 -0.0283
(0.222) (0.0344)
--- local clustering coefficient 1.676** 0.381***
(0.771) (0.117)
Upstream propagation
# of links with damaged customers for US firms -0.0846 -0.000808
(0.0822) (0.00970)
--- local clustering coefficient -1.475*** -0.0909
(0.203) (0.0647)
# of links with damaged customers for non-US
firms
0.0594 0.0137
(0.116) (0.0254)
--- local clustering coefficient -0.458 -0.553**
(1.190) (0.260)
Local Clustering Coefficient -0.281 -0.221 -0.109*** -0.0788**
(0.176) (0.187) (0.0318) (0.0362)
Observations 8,906 8,906 8,593 8,593
R-squared 0.035 0.035 0.077 0.078
Notes: Robust standard errors clustered at the country level are in parentheses. *, **, and *** signify statistical
significance at the 10, 5, and 1% level. All regressions include industry and country fixed effects. We also
control for firm-level characteristics and number of two-step links with damaged suppliers (customers), and
include one link dummy, but the results are not reported for the brevity of presentation.


![Propagation of Shocks due to Natural Disasters through Global …€¦ · Propagation of Shocks due to Natural Disasters through Global Supply Chains* [Preliminary. Do not cite.]](https://img.pdfslide.net/doc/110x75/600b2e9e05bc0301205de602/propagation-of-shocks-due-to-natural-disasters-through-global-propagation-of-shocks.jpg)