Embed Size (px)
Citation preview

October 2019 | International Reserves Management Report1
International Reserves Management ReportVolume 11 | October 2019
ISSN 2175-9251
ISSN 2175-9251
International Reserves Management ReportVolume 11 | October 2019
ISSN 2175-9251

October 2019 | International Reserves Management Report
International Reserves Management ReportYearly Publication by Banco Central do Brasil/Corporate Risks and Benchmarks Department
The text and corresponding tables and graphs were elaborated by the Corporate Risks and Benchmarks Department (E-mail: [email protected]).
Information about the report
Phone: +55 (61) 3414-2685
Reproduction permitted only if source is stated as follows: International Reserves Management Report, volume 11.
Citizen Service Division:
Banco Central do BrasilSBS – Quadra 3 – Bloco B – Edifício-Sede – 2º subsolo 70074-900 Brasília – DFPhone: 145 (in Brazil) Internet: <www.bcb.gov.br/?ATENDIMENTO>

October 2019 | International Reserves Management Report
SummaryExecutive Summary, 5
1 International Reserves Management, 7
1.1 Economic environment, 71.2 Financial and economic indicators, 9
1.2.1 Macroeconomic indicators, 91.2.2 Financial indicators, 111.3 Governance, 13
2 Investment Policy, 16
2.1 Currency allocation, 162.2 Distribution by asset class, 172.3 Average term of investment, 19
3 Risk Management, 20
3.1 Market risk, 203.1.1 Value at risk, 203.1.2 Stress tests, 21
3.2 Liquidity risk, 223.3 Credit risk, 233.4 Operational risk, 26
4 Returns, 28
4.1 Risk-return profile, 30
Annex, 31
Note, 31
Glossary, 37

October 2019 | International Reserves Management Report5
Over the years, the Banco Central do Brasil has sought to expand the transparency of the international reserves’ management process. This publication is the 11th volume of the International Reserves Management Report and it describes in detail the evolution of Brazil’s international reserves, as well as the changes in management throughout the year 2018.
The international reserves’ management is based on a sound governance framework, which comprises the hierarchy defined among the decision levels, as well as an IT system with daily performance control and evaluation, and investment monitoring. To this end, a framework based on three pillars was conceived: i) benchmark portfolio; ii) operational limits, and iii) performance evaluation. In addition, market risk, credit risk, liquidity risk, and operational risk are also monitored daily.
The Board of Governors is responsible for establishing the strategic goals and the risk-return profile of the international reserves. In accordance with the guidelines defined by the Board, the strategic allocation seeks an counter-cyclical behavior and protection against foreign exchange rate fluctuations.
On December 31st, 2018, the international reserves amounted to US$374.72 billion. The average yearly Value at Risk (VaR) of the investments, a market risk metric that takes into account both the interest rate and foreign exchange rate components, was 1.5% in 2018, slightly lower than in the previous year, reflecting a lower foreign exchange rate exposure. In fact, its interest rate component increased since 2017, from 0.8% to 1.1%, whereas the foreign exchange rate component fell from 1.5% to 1.0%. The average term of investment of the portfolio was at 2.23 years, showing an increase when compared to 2017, due mainly to the lengthening of the maturity of the US Treasury bond portfolio. Regarding credit risk, 90% of the exposure of the portfolio is rated Aaa, whereas 7% is rated Aa. In 2018, the liquidity risk of the reserves, which considers the bid-ask spread of the bonds in the portfolio, remained at low levels, comparable to those of 2017: 0.03%, 0.08% and 0.08% for sovereign, supranational and agency bonds respectively.
In 2018, the international reserves had a positive return of 1.17%. Over the last year, the US interest rates went up, a movement consistent with its economic performance and the monetary tightening cycle. This increase in interest rate had a smaller impact than the interest rate carry returns, and therefore the interest rate return amounted to 1.55%.
The International Reserves Management Report is divided into four chapters.
Executive Summary
October 2019 | International Reserves Management Report6
The first one presents the foundations on which the international reserves management is based. Chapter 2 describes the investment policy of the reserves. The third chapter discusses the several risks involved in these investments. The last chapter describes the aggregate results of the reserves, allowing us to verify the adequacy of the strategies vis-à-vis the long-term objectives defined by the BCB. The Report also contains an Annex with data from which the graphs are derived, as well as a glossary with the main terms used throughout the document.
October 2019 | International Reserves Management Report7
1.1 Economic environment
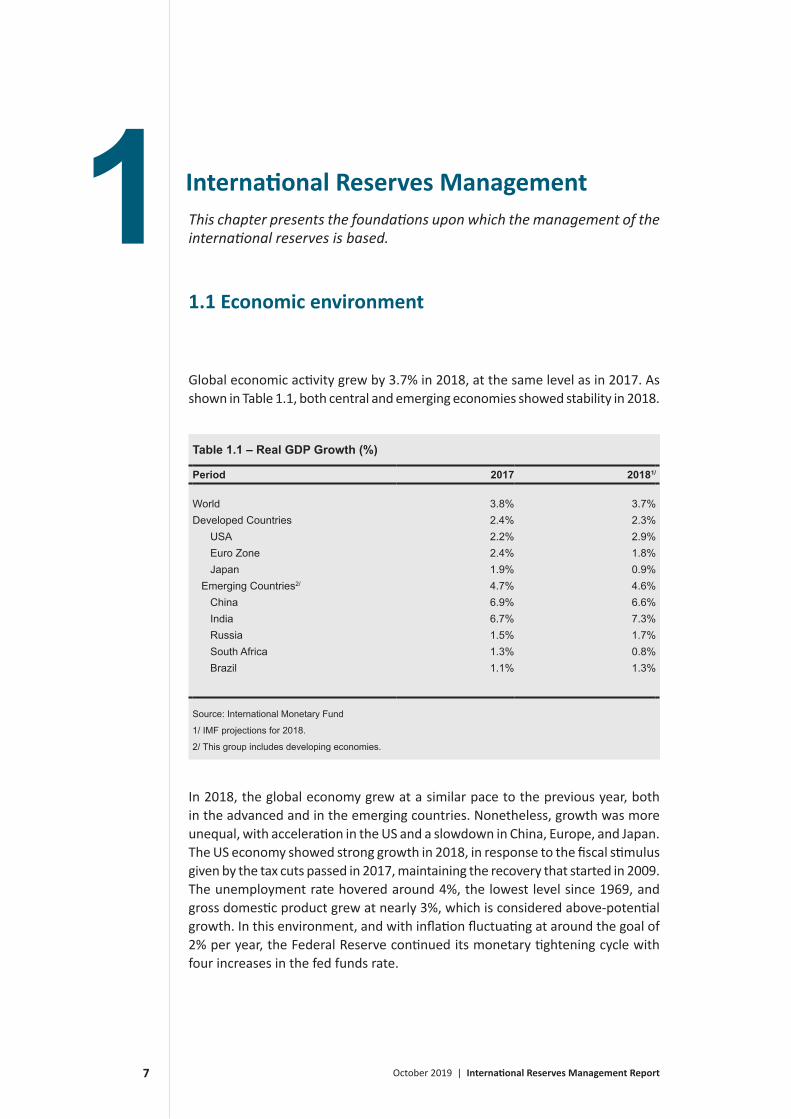
Global economic activity grew by 3.7% in 2018, at the same level as in 2017. As shown in Table 1.1, both central and emerging economies showed stability in 2018.
Table 1.1 – Real GDP Growth (%)
Period 2017 20181/
World 3.8% 3.7%Developed Countries 2.4% 2.3% USA 2.2% 2.9% Euro Zone 2.4% 1.8% Japan 1.9% 0.9% Emerging Countries2/ 4.7% 4.6% China 6.9% 6.6% India 6.7% 7.3% Russia 1.5% 1.7% South Africa 1.3% 0.8% Brazil 1.1% 1.3%
Source: International Monetary Fund
1/ IMF projections for 2018.
2/ This group includes developing economies.
In 2018, the global economy grew at a similar pace to the previous year, both in the advanced and in the emerging countries. Nonetheless, growth was more unequal, with acceleration in the US and a slowdown in China, Europe, and Japan.The US economy showed strong growth in 2018, in response to the fiscal stimulus given by the tax cuts passed in 2017, maintaining the recovery that started in 2009. The unemployment rate hovered around 4%, the lowest level since 1969, and gross domestic product grew at nearly 3%, which is considered above-potential growth. In this environment, and with inflation fluctuating at around the goal of 2% per year, the Federal Reserve continued its monetary tightening cycle with four increases in the fed funds rate.
1 International Reserves ManagementThis chapter presents the foundations upon which the management of the international reserves is based.

October 2019 | International Reserves Management Report8
In the first quarter, fear of an increase in inflation in the US that would lead to the need for further tightening caused the markets to become more volatile. This fear, however, was not realized over the course of the year. In the fourth quarter, when it was clear that there was no inflation pressure, short-term rates had risen substantially and a part of the yield curve was inverting, markets started to fear that monetary policy tightening had been excessive and this could lead to a recession in the US. Consequently, equity prices fell along with interest rates across the yield curve, putting into question the continuity of the tightening cycle in 2019.
In the Euro Zone, the optimism in the second half of 2017 waned as 2018 went by. In fact, the economy had been decelerating since the start of the year when it was hit by specific factors in the third quarter, such as a surge in oil prices and the implementation of new regulations in the automobile industry. These factors led to even lower growth, which slipped into negative territory in relevant countries such as Germany and Italy. The latter has gone through some turbulence due to the budget deficit proposed by its recently elected government, diverging from the Euro Zone rules and causing a sudden increase in its interest rates as well as market volatility.
The European Central Bank gradually reduced its asset purchase program over the year until its end in December, moderating the intensity of its monetary accommodation. However, with core inflation at around 1% and economic slowdown, no further additional changes are expected to its monetary stance in this direction, as was already stated by the ECB.
The Japanese economy also slowed down in 2018 when compared to the previous year, partly due to the lower external demand and partly due to the natural disasters recorded in the country. Its monetary policy remained stimulative, with asset purchases on the part of Bank of Japan, which keeps its goal of a 0% 10-year yield until its inflation rate hits 2% consistently. In fact, despite labor shortages and low unemployment rates, core inflation remains subdued at less than 1% per year. In 2019, an increase in its consumption tax rate is expected, which should cause an increase in the price level while at the same time contracting aggregate demand. The government has already announced a fiscal stimulus to counterbalance part of this contraction.
In 2018, China grew at a strong pace, although it slowed down from the previous year. This deceleration happened in the context of the Chinese transition from an economy based on investment to one in which domestic consumption is more relevant. In 2018, specifically, the Chinese government acted to mitigate problems with shadow banking, with stricter regulations in the credit market, leading to weaker growth. Since the slowdown was unexpectedly greater, fiscal and monetary stimulus measures have been taken over the course of the year. The possibility of a substantial slowdown in the Chinese economy in 2019 is a global risk, since China is responsible for a large part of the growth of the world economy directly as well as the demand for commodities, thus being of paramount interest to exporting countries such as Brazil.
The trade disputes primarily between the US and China have become more aggressive in 2018 and has affected the entire global economy. One of the pillars

October 2019 | International Reserves Management Report9
of the US president has been to renegotiate the terms of international trade, especially with regards to NAFTA and China.
In December, a new free trade deal was finalized in North America, named USMCA (United States-Mexico-Canada Agreement), without substantial changes in relation to NAFTA.
With regard to China, negotiations are underway, still without a deal, and protectionist measures have been taken on both sides. The US imposed 10% import tariffs on the equivalent of US$ 250 billion in Chinese goods, with the possibility of an increase to 25%. China retaliated with tariffs on US$ 100 billion on US imports.
On December 1st, 2018, The US and China declared a truce for 90 days, in order to resume negotiations, which, nonetheless have not yet had any concrete results.
The protectionist tendency of the current US administration has also raised tariffs on solar panels, as well as on steel and aluminum imported from several different countries. There were also threats to raise tariffs on automobiles and auto parts made in the European Union.
Risks arising from the escalation of trade tensions include: a more sudden slowdown of the Chinese economy; higher inflation in the US, requiring further monetary tightening; breakdown of globally integrated supply chains; a decrease in external demand in the European Union and Japan, causing even further slowdown in growth; collateral effects on commodity exporters such as Brazil.
The main short-term risks envisaged at the end of 2018 were: i) normalization of US monetary policy at a faster pace than what markets are pricing, leading to more global risk aversion and economic slowdown; ii) escalation in trade tensions with harmful effects on economic activity; iii) sudden slowdown in China with impacts on equity, currency and commodities markets; iv) volatility due to political events, such as Brexit,1 Italian budget negotiations, EU parliamentary elections, US debt ceiling, and; v) unexpected increase in inflation, leading to faster monetary tightening than what markets have already priced in.
1.2 Financial and economic indicators
The amount of international reserves depends on several factors, such as domestic and foreign macroeconomic variables, as well as elements that impact the financial return of its investment portfolio. In this section, some indicators that influence the reserves are discussed.
1.2.1 Macroeconomic indicators
Graph 1.1 shows the behavior of Brazilian imports and exports, as well as the
1 A portmanteau of “British” and “exit” that refers to the withdrawal of the United Kingdom from the European Union

October 2019 | International Reserves Management Report10
Brazilian Real/US dollar exchange rate, for the period from 2009 to 2018. Exports grew by 10.12%, while imports grew by 20.19% in 2018, when compared to 2017, in such a way that the Brazilian trade balance recorded a slightly smaller surplus than in the previous year. The nominal exchange rate was 17.13% higher at the end of 2018 than one year before and was up 14.51% when yearly averages are compared against each other.
Since commodities are a significant part of Brazilian exports, the impact of international commodity prices on the exchange rate is relevant. Graph 1.2 shows the high negative correlation between the US/Brazilian real exchange rate and the Commodity Research Bureau (CRB) commodity index.
Brazilian GDP grew at a slightly higher pace in 2018, with a projected growth of 1.3%. As shown in Graph 1.3, net public debt remained on the rise started by the recession, and reached 53.3% of the GDP, while the international reserves rose to 19.7%, due to Exchange rate effects. The ratio of international reserves to net public debt is also shown in the graph.
050100150200250300350400450500
1.5
2.0
2.5
3.0
3.5
4.0
4.5
2008 2009 2010 2011 2012 2013 2014 2015 2016 2017 2018
Exchange Rate R$/US$ CRB
Graph 1.2 – Exchange Rate (R$/US$) and CRB
Source: Bloomberg
R$/US$
0
50
100
150
200
250
300
1
2
3
4
2009 2010 2011 2012 2013 2014 2015 2016 2017 2018
Exports Imports Average exchange rate R$/US$
Graph 1.1 – Trade balance and exchange rate (R$/US$)
Source: Banco Central do Brasil
R$/US$ US$ billion

October 2019 | International Reserves Management Report11
The GDP in Brazil recovered in 2018, with a projected growth of 1.3%, after two years of recession. As shown in Graph 1.3, the net public debt continued its rise to a level of 53.3% of the GDP, while the international reserves rose slightly to 19.7% of the GDP, due to fluctuations in the exchange rate.
1.2.2 Financial indicators
Among the factors which affect the returns of the reserves, we highlight the currency, equity and interest rate market indicators.
In the currency markets, the value of the US dollar in relation to its counterparts is responsible for part of the international reserves returns. In Graph 1.4, the Dollar Index is plotted alongside the Brazilian real US dollar exchange rate, and the high correlation can be promptly noticed.
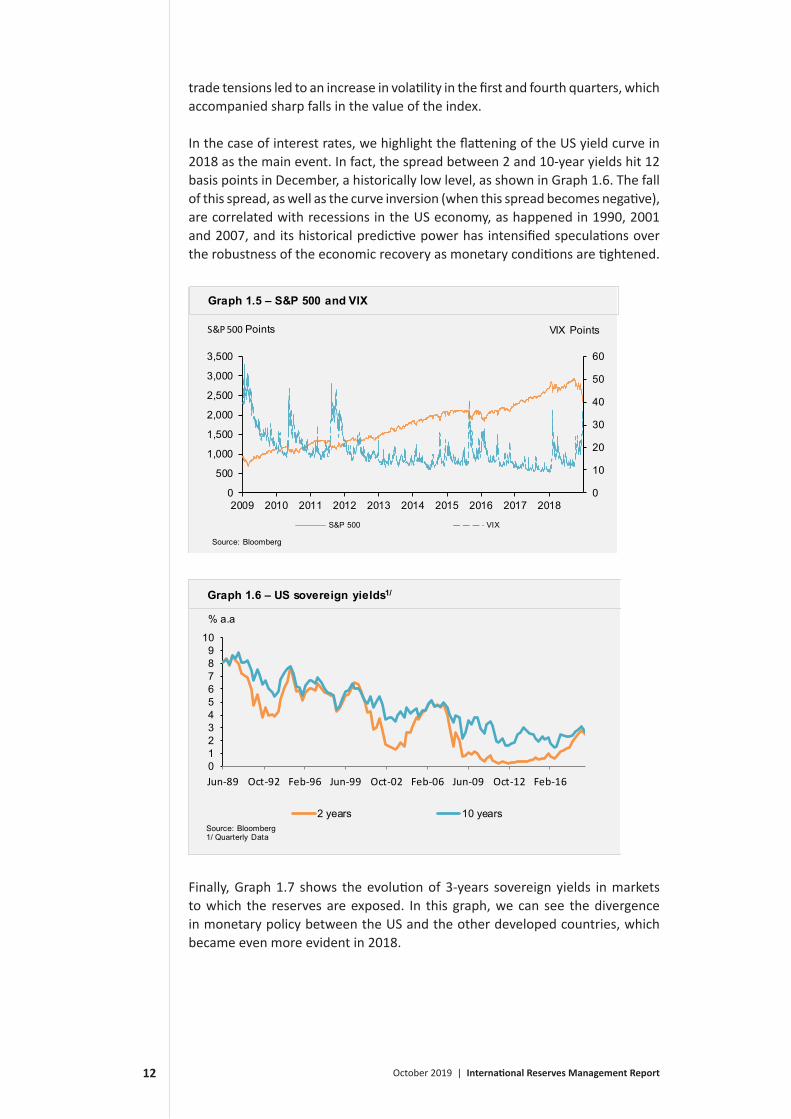
When it comes to the US equity market, represented in Graph 1.5 by the S&P 500 index, 2018 ended with a loss of 6.24% in value when compared to the end of 2017. Throughout 2018, the fact that the economy was near full employment levels with monetary tightening and fiscal stimulus, as well as the prospect of
70
80
90
100
1.5
2.0
2.5
3.0
3.5
4.0
2008 2009 2010 2011 2012 2013 2014 2015 2016 2017 2018
Exchange Rate R$/US$ Dollar Index
Graph 1.4 – Exchange rate (R$/US$) and Dollar Index
Source: Reuters
R$/US$
0
25
50
2008 2009 2010 2011 2012 2013 2014 2015 2016 2017
Net publ ic sector debt (% GDP) International Reserves (% GDP)
Source: Banco Central do Brasil
Graph 1.3 – Net public sector debt and international reserves (% GDP)
October 2019 | International Reserves Management Report12
trade tensions led to an increase in volatility in the first and fourth quarters, which accompanied sharp falls in the value of the index.
In the case of interest rates, we highlight the flattening of the US yield curve in 2018 as the main event. In fact, the spread between 2 and 10-year yields hit 12 basis points in December, a historically low level, as shown in Graph 1.6. The fall of this spread, as well as the curve inversion (when this spread becomes negative), are correlated with recessions in the US economy, as happened in 1990, 2001 and 2007, and its historical predictive power has intensified speculations over the robustness of the economic recovery as monetary conditions are tightened.
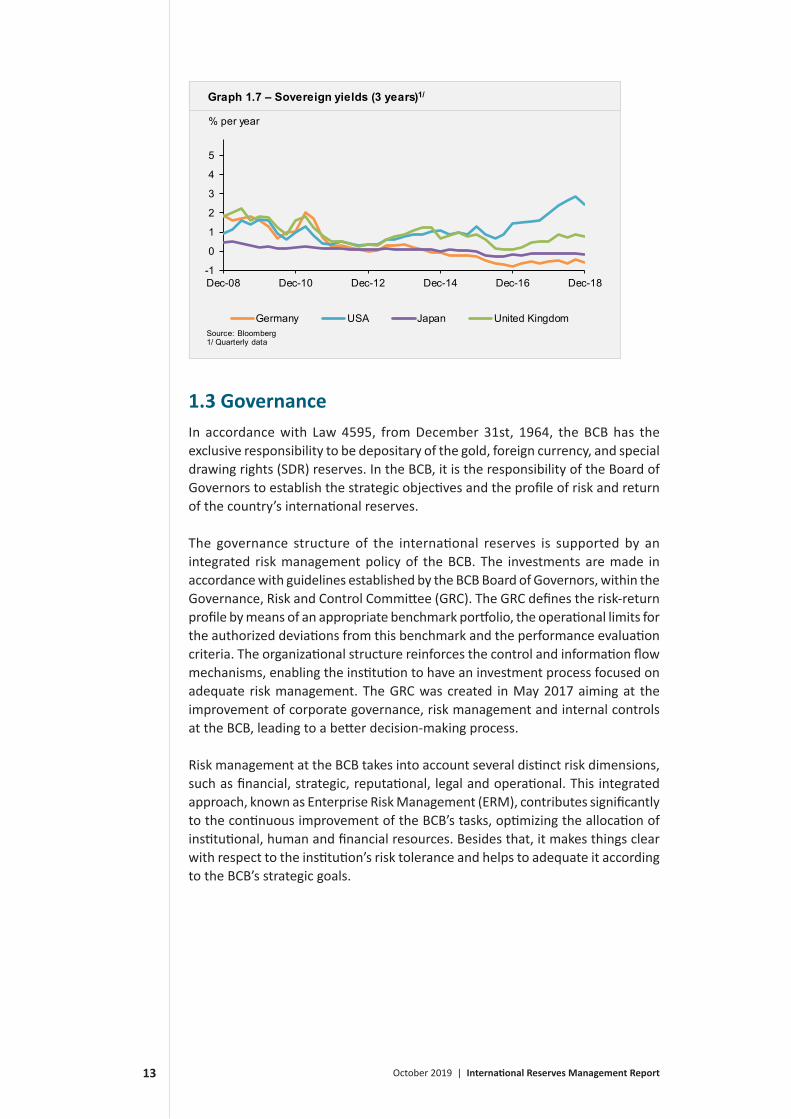
Finally, Graph 1.7 shows the evolution of 3-years sovereign yields in markets to which the reserves are exposed. In this graph, we can see the divergence in monetary policy between the US and the other developed countries, which became even more evident in 2018.
0
10
20
30
40
50
60
0
500
1,000
1,500
2,000
2,500
3,000
3,500
2009 2010 2011 2012 2013 2014 2015 2016 2017 2018
S&P 500 VIX
Graph 1.5 – S&P 500 and VIX
Source: Bloomberg
S&P 500 Points VIX Points
0123456789
10
Jun-89 Oct-92 Feb-96 Jun-99 Oct-02 Feb-06 Jun-09 Oct-12 Feb-16
2 years 10 yearsSource: Bloomberg1/ Quarterly Data
Graph 1.6 – US sovereign yields1/
% a.a
October 2019 | International Reserves Management Report13
1.3 GovernanceIn accordance with Law 4595, from December 31st, 1964, the BCB has the exclusive responsibility to be depositary of the gold, foreign currency, and special drawing rights (SDR) reserves. In the BCB, it is the responsibility of the Board of Governors to establish the strategic objectives and the profile of risk and return of the country’s international reserves.
The governance structure of the international reserves is supported by an integrated risk management policy of the BCB. The investments are made in accordance with guidelines established by the BCB Board of Governors, within the Governance, Risk and Control Committee (GRC). The GRC defines the risk-return profile by means of an appropriate benchmark portfolio, the operational limits for the authorized deviations from this benchmark and the performance evaluation criteria. The organizational structure reinforces the control and information flow mechanisms, enabling the institution to have an investment process focused on adequate risk management. The GRC was created in May 2017 aiming at the improvement of corporate governance, risk management and internal controls at the BCB, leading to a better decision-making process.
Risk management at the BCB takes into account several distinct risk dimensions, such as financial, strategic, reputational, legal and operational. This integrated approach, known as Enterprise Risk Management (ERM), contributes significantly to the continuous improvement of the BCB’s tasks, optimizing the allocation of institutional, human and financial resources. Besides that, it makes things clear with respect to the institution’s risk tolerance and helps to adequate it according to the BCB’s strategic goals.
-1
0
1
2
3
4
5
Dec-08 Dec-10 Dec-12 Dec-14 Dec-16 Dec-18
Germany USA Japan United KingdomSource: Bloomberg1/ Quarterly data
Graph 1.7 – Sovereign yields (3 years)1/
% per year

October 2019 | International Reserves Management Report14
With the adoption of a novel integrated and structured risk management model, the BCB is aligned with the best international practices, consolidating its excellence in this area.
As far as the structure of governance is concerned, reserve management at the BCB is organized according to Figure 1.1
Figure 1.1 – Governance structure of the international reserves
At the highest level is the BCB Board of Governors, within the GRC, which is responsible for: i) defining the long-term strategies by means of a benchmark portfolio; ii) evaluating the results of the international reserves investments; and iii) defining the operational limits to which the teams that implement the investment policy are subject.
Reserves management can be divided into two levels. The first level is the long-term strategic management, which is overall responsible for the investments that contribute the most to the returns of international reserves. The Strategic Allocation Subcommittee, which is composed of the Deputy Governor of International Affairs and Corporate Risks (Direx) as its president, as well as the Deputy Governor for Monetary Policy (Dipom) and the Deputy Governor for Economic Policy (Dipec), is responsible for proposing to the GRC the benchmark portfolio, the operational limits and the performance measurement criteria.
At the second level is short-term management. The Active Management Subcommittee, composed of the Dipom as president, as well as the Direx and the Dipec, meets quarterly to establish deviation strategies from the benchmark portfolio, within the limits set by the GRC. This type of management has the objective of improving the returns in the short-term by taking advantage of circumstantial market opportunities.
The investment parameters and criteria are monitored by an internally developed system. The controls run on a daily basis, and any breach in the operational limits is automatically reported to all members of the Board of Governors.
With regard to the operational aspects, the process of investing the international reserves is comprised of the investment, compliance and settlement tasks. Compliance and settlement are critical procedures since they affect security, liquidity, and profitability given that the reserves are traded in an environment of multiple currencies, regions and time zones.

October 2019 | International Reserves Management Report15
Finally, the international reserves management process is subject to five different types of control: i) internal control by the International Reserves Department (Depin), through its Internal Control Division (Dicoi); ii) internal control by The Corporate Risks and Benchmarks Department iii) internal control by the BCB’s Audit; iv) control by the Office of the General Comptroller (CGU), an agency that is external to the BCB, but part of the Federal Executive branch; v) external control by the Brazilian Court of Audit; and vi) external control by an independent auditor.

October 2019 | International Reserves Management Report16
The Board of Governors defines the investment policy, within the GRC, based on the long-term strategic goals of the international reserves, such as: to provide confidence to the market that the country is capable of honoring its international commitments and support the execution of its exchange rate and monetary policy. As the strategic consequences of these goals, the BCB seeks a strategic allocation that has a countercyclical behavior and reduces the country’s exposure to exchange rate fluctuations. With these principles in mind, the strategic allocation is determined with the help of risk-return optimization techniques, since the criteria of safety, liquidity, and profitability are considered, prioritized in this order.
The Board defines a benchmark portfolio as a reference for the allocation of the reserves according to a long-term strategic profile that reflects the institutional preferences of the BCB when it comes to risk and return. Short-term fluctuations in variables that affect asset prices, such as interest and exchange rates, are not considered in long-term decisions.
Intentional deviations from the benchmark portfolio as a function of oscillations in market conditions can be made and are monitored by internal control systems. In other words, the international reserves are actively managed, being allowed to marginally deviate from the benchmark portfolio within operational limits previously defined by the GRC.
In the following sections, we describe fundamental aspects of the investment policy of the international reserves. In general, this policy can be segmented in terms of currency allocation, distribution by asset class and average term of investment. The data presented here refer to the portfolio managed internally by the BCB, and do not consider specific instruments employed in the domestic markets, such as US dollar - real repurchase agreements. In addition to the internally managed portfolio, the BCB also invests in one fund managed by the Bank for International Settlements (BIS), known as a BIS Investment Pool (Bisip) fund. It invests in Yuan-denominated Chinese sovereign bonds. By the end of 2018, the total volume allocated to this Bisip fund was US$246.4 million.
2.1 Currency allocation
As previously mentioned, one of the goals of the international reserves management is the reduction of the country’s exposure to foreign exchange rate
2 Investment PolicyThe investment policy reflects the risk preference of the Banco Central do Brasil.

October 2019 | International Reserves Management Report17
risk. Thus, the BCB seeks to build a diversified portfolio with a countercyclical behavior that provides, as a priority, the hedging of the exchange rate risk of the gross external debt. In December 2018, the currency allocation of the reserves was the following: 89.93% in US dollars, 5.13% in euros, 1.92% in sterling pound, 1.49% in Japanese yen and 0.75% in gold, 0.47% in Canadian dollar and 0.30% in Australian dollar.
This currency allocation provides a full hedge of the gross external debt.2 Graph 2.1 shows the evolution of the currency allocation at the end of each year.
We can see in Graph 2.1 that, for the whole period, the US was the currency with the largest share. In 2009, the BCB initiated a policy of currency diversification in the international reserves. In 2015, there was a small adjustment regarding the currency distribution, aiming at the strengthening of the most significant positions that make up the currency coverage. In 2018, the allocation in procyclical currencies was reduced.
2.2 Distribution by asset classThe international reserves are invested primarily in fixed income assets, especially in sovereign bonds, agency bonds from several countries, bonds issued by supranational organizations and fixed-term bank deposits. Agencies are entities sponsored by a national government, created with the objective of promoting the development of certain sectors of the economy, and raising funds mainly through the issuance of bonds in the international markets. The central governments issue bonds in order to finance their fiscal deficits. Supranationals are multilateral organizations, such as the World Bank and the Bank for International Settlements (BIS), which issue bonds and, in some cases, act as financial intermediaries. In 2018, BCB started to use exchange-traded funds (ETFs) as instruments, in order to obtain exposure to fixed and variable income markets. Also in 2018, BCB started to invest in local government bonds (from provinces in countries with high credit ratings).
0%
50%
100%
2009 2010 2011 2012 2013 2014 2015 2016 2017 2018
Source: Banco Central do Brasil1/ Reserv es in cash concept (end of period data)
Others Gold AUD CAD GBP JPY EUR USD
Graph 2.1 – Foreign Currency Allocation1/
2 The values for the gross external debt can be found in the External Sector Statistics report, published monthly on the BCB wesite.

October 2019 | International Reserves Management Report18
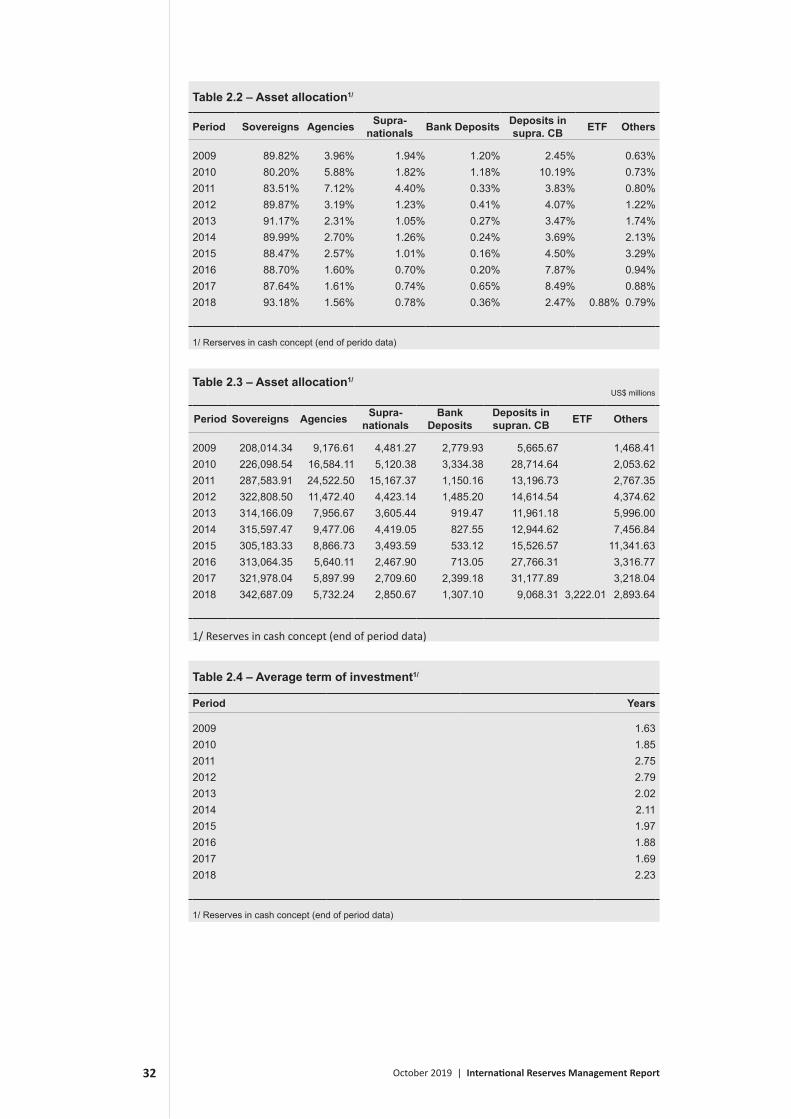
In December 2018, the reserves were allocated as follows: 93.18% in sovereign bonds; 2.47% in deposits in central banks and supranational organizations; 1.56% in agency bonds; 0.88% in ETFs; 0.78% in supranational bonds; 0.36% in deposits in commercial banks; and 0.79% in other asset classes, such as gold and local government bonds.
Graph 2.2 shows the asset class distribution, in percentage terms, in the period from December 2009 to December 2018 (end of period data). Graph 2.3 shows the same evolution in terms of US dollars.
In 2018, there was an increase in the allocation of the reserves on sovereign bonds. The allocation in ETFs can also be seen, appearing for the first time this year.
050,000
100,000150,000200,000250,000300,000350,000400,000
2009 2010 2011 2012 2013 2014 2015 2016 2017 2018
Source: Banco Central do Brasil1/ Reserv es in cash concept (end of period data). Values in US$ millions.
Sovereigns Agencies Supra-nationals Bank Deposits Deposits in supran. CB ETF Others
Graph 2.3 – Asset allocation1/
US$ millions
0%
50%
100%
2009 2010 2011 2012 2013 2014 2015 2016 2017 2018
Source: Banco Central do Brasil1/ Reserv es in cash concept (end of period data)
Sovereigns Agencies Supra-nationals Bank Deposits Deposits in supra. CB ETF Others
Graph 2.2 – Asset allocation1/
October 2019 | International Reserves Management Report19
2.3 Average term of investment
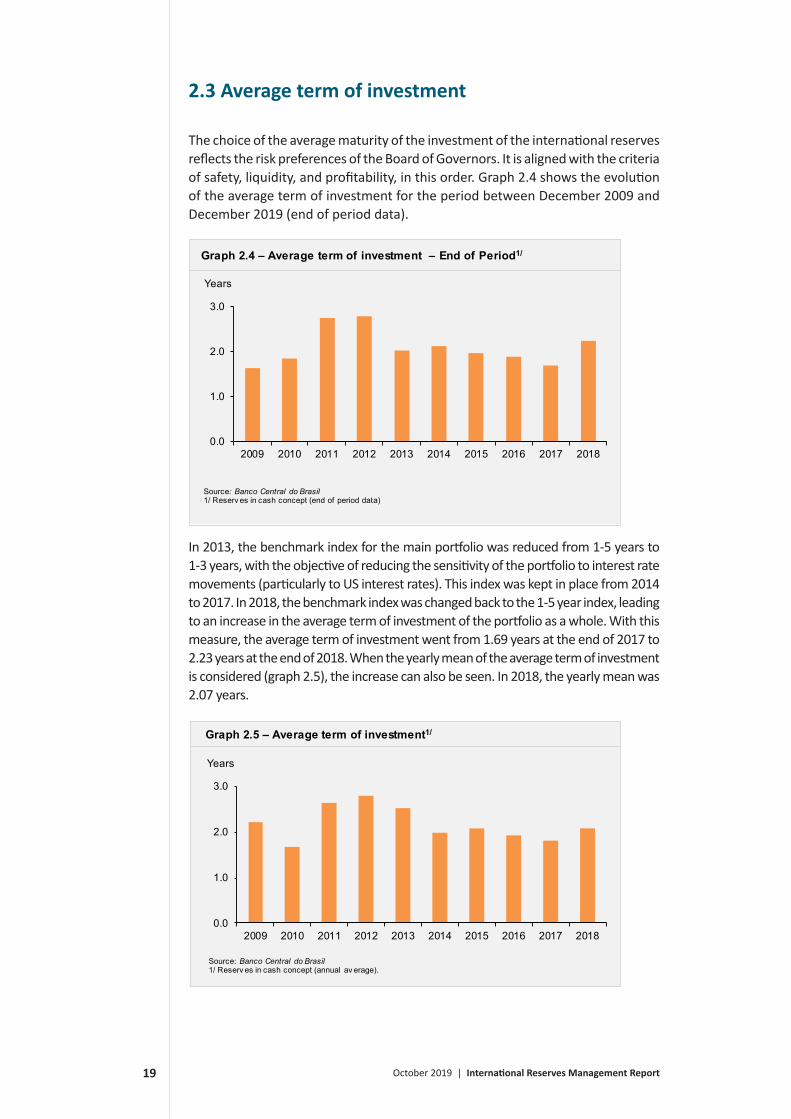
The choice of the average maturity of the investment of the international reserves reflects the risk preferences of the Board of Governors. It is aligned with the criteria of safety, liquidity, and profitability, in this order. Graph 2.4 shows the evolution of the average term of investment for the period between December 2009 and December 2019 (end of period data).
In 2013, the benchmark index for the main portfolio was reduced from 1-5 years to 1-3 years, with the objective of reducing the sensitivity of the portfolio to interest rate movements (particularly to US interest rates). This index was kept in place from 2014 to 2017. In 2018, the benchmark index was changed back to the 1-5 year index, leading to an increase in the average term of investment of the portfolio as a whole. With this measure, the average term of investment went from 1.69 years at the end of 2017 to 2.23 years at the end of 2018. When the yearly mean of the average term of investment is considered (graph 2.5), the increase can also be seen. In 2018, the yearly mean was 2.07 years.
0.0
1.0
2.0
3.0
2009 2010 2011 2012 2013 2014 2015 2016 2017 2018
Graph 2.5 – Average term of investment1/
Source: Banco Central do Brasil1/ Reserv es in cash concept (annual av erage).
Years
0.0
1.0
2.0
3.0
2009 2010 2011 2012 2013 2014 2015 2016 2017 2018
Graph 2.4 – Average term of investment – End of Period1/
Source: Banco Central do Brasil1/ Reserv es in cash concept (end of period data)
Years

October 2019 | International Reserves Management Report20
The risk analysis related to the investment process is a key aspect to understand the financial performance and to align the benchmark portfolio to the investment objectives.
As mentioned before, the different risks taken in international reserves investments are controlled daily by an IT system developed internally by the Banco Central do Brasil (BCB). This system includes the market, credit, and liquidity risks calculations, operational losses registration, and several other operational limit controls.
The market risk of a portfolio is the risk of financial loss due to market price variations of the portfolio’s assets.
Liquidity risk refers to the risk of not being able to sell an asset or closing a position when desired, without incurring in significant costs.
Credit risk is the risk of an institution not being able to meet payments due to the securities issuance, deposits or any other contractual obligation or financial commitments made to investors.
Operational risk may be defined as the risk of direct or indirect loss resulting from inadequate or failed internal processes, people and systems or from external events.
3.1 Market riskThere are several sources of market risk related to the international reserves management. The main sources are the risk of change in exchange rates and interest rates. It is important to highlight that the reference currency (numéraire) used by BCB for the international reserves management is the US dollar. In order to measure the reserves market risk, the BCB uses the Value at Risk – VaR, as can be seen in the next section. Additionally, stress tests are used for measuring the reserve’s sensitivity to risk factors, as can be seen in section 3.1.2.
3.1.1 Value at risk
The main market risk measure used by the BCB for the international reserves is the Value at Risk (VaR). The VaR is a statistical measure related to how volatile the prices of the assets held in a portfolio are, based on the recent history of the risk
3 Risk ManagementMarket, credit, liquidity and operational risk are monitored in the international reserves’ investment process.

October 2019 | International Reserves Management Report21
factors. For a given probability p, the VaR is an estimate of the p quantile of the return distribution of a portfolio for a given time horizon. This means that a loss greater than the VaR should be expected to happen only p fraction of the time.
The VaR is calculated on a daily basis for the reserves, with probability 5% for the time horizon of one day. That is, if the return distribution remains the same, a daily loss greater than the VaR should only happen 5% of the days. Besides the total VaR, the BCB also calculates its interest rate and exchange rate components, which are computed by taking into account these two types of risk factors separately.
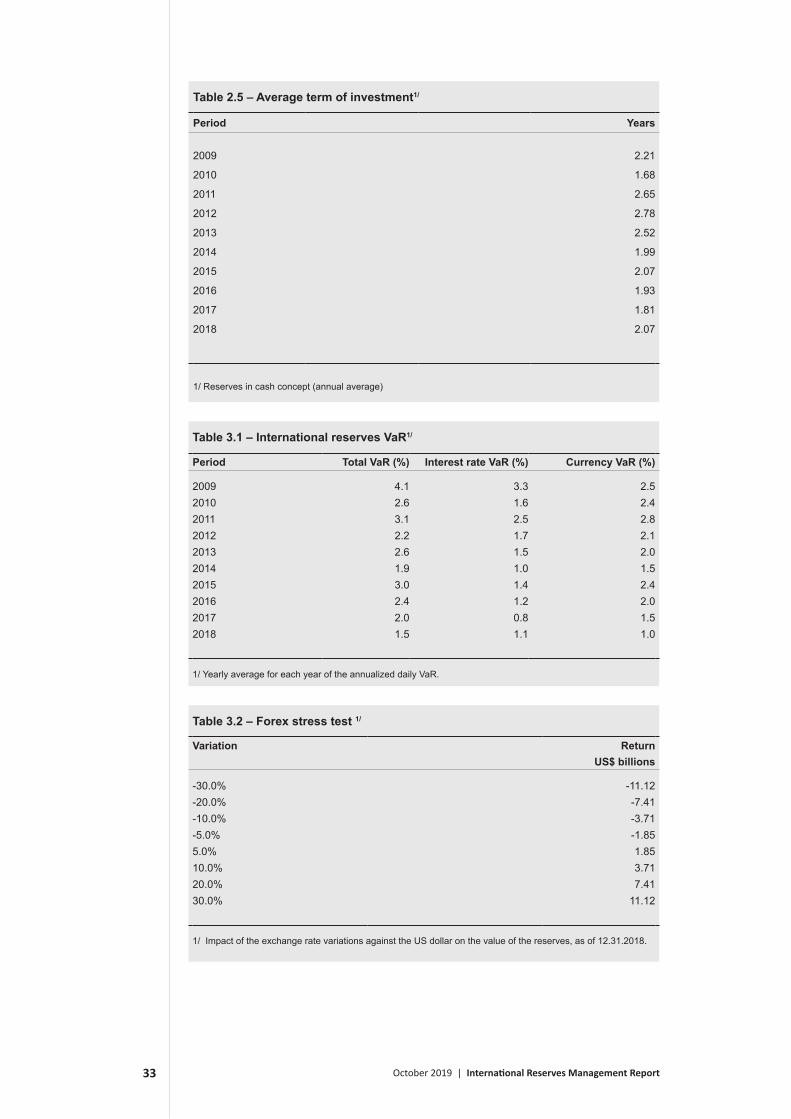
Graph 3.1 shows the mean annualized VaR of the international reserves in percentage terms. The graph also shows the interest rate and foreign exchange components. The total VaR was 1.5% a year on average in 2018, a value somewhat lower than in the previous year.
In 2018, the interest rate component of the VaR went up to 1.1% from 0.8% in 2017. The exchange rate component fell from 1.5% to 1.0% a year. These results are due primarily to changes in strategic asset allocation leading to higher duration and higher concentration in the US dollar.
In May of 2012, the international reserves started to carry exposure to risk factors related to stocks and commodities. However, since the volume invested in these asset classes was small, their contribution to overall market risk was very low throughout the year. In fact, the average of the equity/commodity component of the annualized VaR was lower than 0.24% during 2018.
3.1.2 Stress tests
The stress test is another tool used for measuring the market risk of the international reserves holdings. It seeks to quantify the negative impact of shocks and events that are unfavorable to the BCB’s positions. Thus, the stress/ crisis scenarios are designed to evaluate the potential financial losses caused by an adverse shock to each of the risk factors to which the reserves are exposed.
The tests are performed considering the BCB’s positions at the end of 2018, and the risk factors used in these tests are the exchange rates of the US dollar against
0.0
2.0
4.0
6.0
8.0
2009 2010 2011 2012 2013 2014 2015 2016 2017 2018
Total VaR Interest component VaR Currencies component VaRSource: Banco Central do Brasil1/ Yearly av erage f or each y ear of the annualized daily VaR.
%
Graph 3.1 – International reserves VaR1/

October 2019 | International Reserves Management Report22
the remaining currencies in the reserves, as well as the yield curves. Graph 3.2 shows the impact of the fluctuation of all the other currencies against the US dollar on the result of the reserves, varying in amplitude from 0% to 30%. Any appreciation of the US dollar against the remaining currencies on the reserves should have a negative impact on the returns.
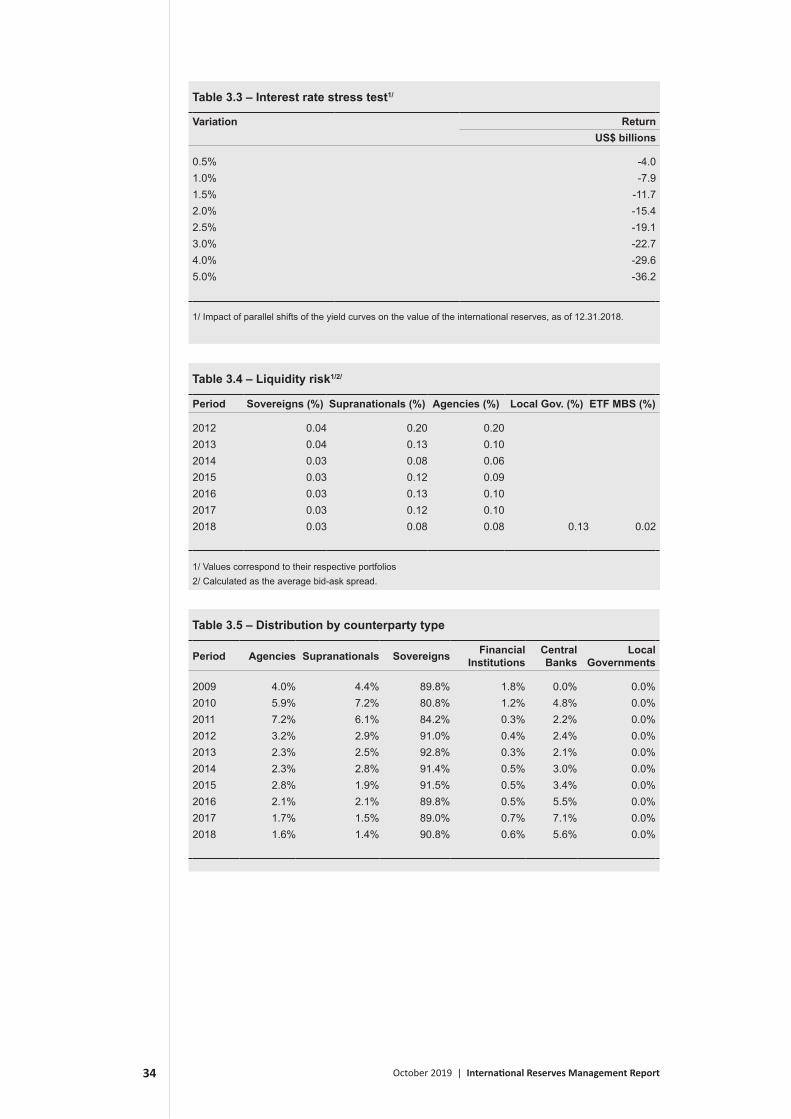
Graph 3.3 shows the results of parallel shifts of 0.5 to 5.0 percentage points to the yield curves of the markets where the reserves are invested. The larger the shift in the international interest rates, the larger the negative effect on the market value of the reserves.
3.2 Liquidity riskOne of the pillars of the investment policy of the international reserves is liquidity. Therefore, restrictions in terms of asset classes are taken into account in the allocation process in order to mitigate liquidity risk. Liquidity risk corresponds to the risk of not being able to sell an asset or to close a position without incurring significant costs.
-24-18-12
-606
121824
-30% -20% -10% -5% 5% 10% 20% 30%
Source: Banco Central do Brasil1/ Impact of the exchange rate v ariations against the US dollar on the v alue of the reserv es, as of 12.31.2018.
Graph 3.2 – Forex stress test
Exchange rate1/
US$ bilions
-40-35-30-25-20-15-10
-50
0.5 1.0 1.5 2.0 2.5 3.0 4.0 5.0
P/L
Source: Banco Central do Brasil1/ Impact of parallel shif ts of the y ield curv es on the v alue of the international reserv es, as of 12.31.2018.
Graph 3.3 – Interest rate stress test
Interest rate1/
US$ billions

October 2019 | International Reserves Management Report23
In order to guarantee an adequate level of liquidity for the international reserves, the BCB has guidelines that limit holdings’ size and investment maturity. For sovereign, supranational and agency securities, there is a maximum purchasing limit per issuance as well as a maximum share of the outstanding amount for each asset. These operational limits have the goal of: i) making sure that the eventual sale of these assets by the BCB will not affect their prices significantly; and ii) limit the impact of a given issuance in the portfolio return.
In addition to the controls already mentioned, the BCB also monitors the portfolio’s liquidity risk using some liquidity cost scores. These scores take into consideration the bid-ask spreads of all the portfolio holdings, and they are calculated for each type of bond issuer (sovereigns, supranationals and agencies).
As we can see in Graph 3.4, the liquidity risk computed as the difference between bid and ask prices of the bonds marginally decreased in 2018 in relation to 2017. We can also note that the liquidity risk of assets issued by sovereigns is consistently lower than that of assets issued by agencies and supranational organizations. Nonetheless, it is similar to that of the MBS ETFs recently incorporated into the reserves. The liquidity risk measured for sovereign issuers went from 0.0286% in 2017 to 0.0284% in 2018, while it was 0.115% for supranational issuers in 2017 and reached 0.079% in 2018, and for agencies it was 0.095% in 2017 and fell to 0.076% in 2018. In 2018, the liquidity risk measured for the MBS ETFs was at 0.023% and that of the local government bonds reached 0.132%.
3.3 Credit riskThe aim of this section is to present the annual evolution of the exposure of the international reserves to credit risk since 2009, as well as the control mechanisms for such exposure. In addition, we present some concepts concerning credit risk and the asset distribution according to three criteria: type of issuer or counterparty, geographic region, and creditworthiness.
Credit risk is defined as the uncertainty related to the occurrence of a credit event (downgrade or default of a counterparty), which results in a loss in value of
0.0
0.1
0.1
0.2
0.2
0.3
2012 2013 2014 2015 2016 2017 2018Sovereigns Supranationals Agencies Local Governments
Source: Banco Central do Brasil1/ Values ref er to the respectiv e portf olios.
Graph 3.4 – Liquidity risk1/
%

October 2019 | International Reserves Management Report24
holdings linked to this counterparty. A credit event occurs when a counterparty does not fulfill its payment commitments. The BCB’s counterparties considered to pose a credit risk are the ones on which the BCB has claims, such as: agencies, central banks, central governments, financial institutions and supranational organisms. The category of financial institutions includes both commercial and investment banks. The graphs in this section show that most of the reserves is allocated in sovereign bonds, and, within this group, in US treasuries.
The evolution of the distribution by type of issuer and counterparty is shown in Graph 3.5. In this graph, we observe that along the depicted period the increase in the share of the reserves allocated to sovereign bonds occurred as the share invested in financial institutions, agencies and supranationals fell. In 2018, the distribution was similar to that in 2017, with a small increase in sovereign bonds to the detriment of central bank deposits.
The portfolio’s credit risk level is due to the composition of the portfolio and the counterparties’ credit quality. The individual credit risks of agencies and supranational organisms authorized by BCB are low due to the limits established, which enable only investments in instruments of fixed income with high level of creditworthiness, according to a credit rating agency and an internal analysis.
As for the credit risk control of financial institutions, two types of limits were established: one per transaction and other for the portfolio as a whole. Each transaction is subject to operational limits that define the minimum credit quality, the maximum exposure per issuer or counterparty and the maximum term of each exposure. Market indicators and accounting information are also considered in the credit analysis of the counterparties and issuers of the bonds in the reserves’ portfolio. The aggregate limits for the portfolio aim at restricting the total credit exposure. Pursuing this goal, the BCB employs a statistical model of credit risk developed internally.
Graphs 3.6 and 3.7 refer to average exposure data for 2018. The distribution of assets with credit risk by geographic region is shown in Graph 3.6. Most of the
0%
20%
40%
60%
80%
100%
2009 2010 2011 2012 2013 2014 2015 2016 2017 2018
Source: Banco Central do Brasil
Local Governments Central Banks Financial InstitutionsSovereigns Supranationals Agencies
Graph 3.5 – Distribution by counterparty
October 2019 | International Reserves Management Report25
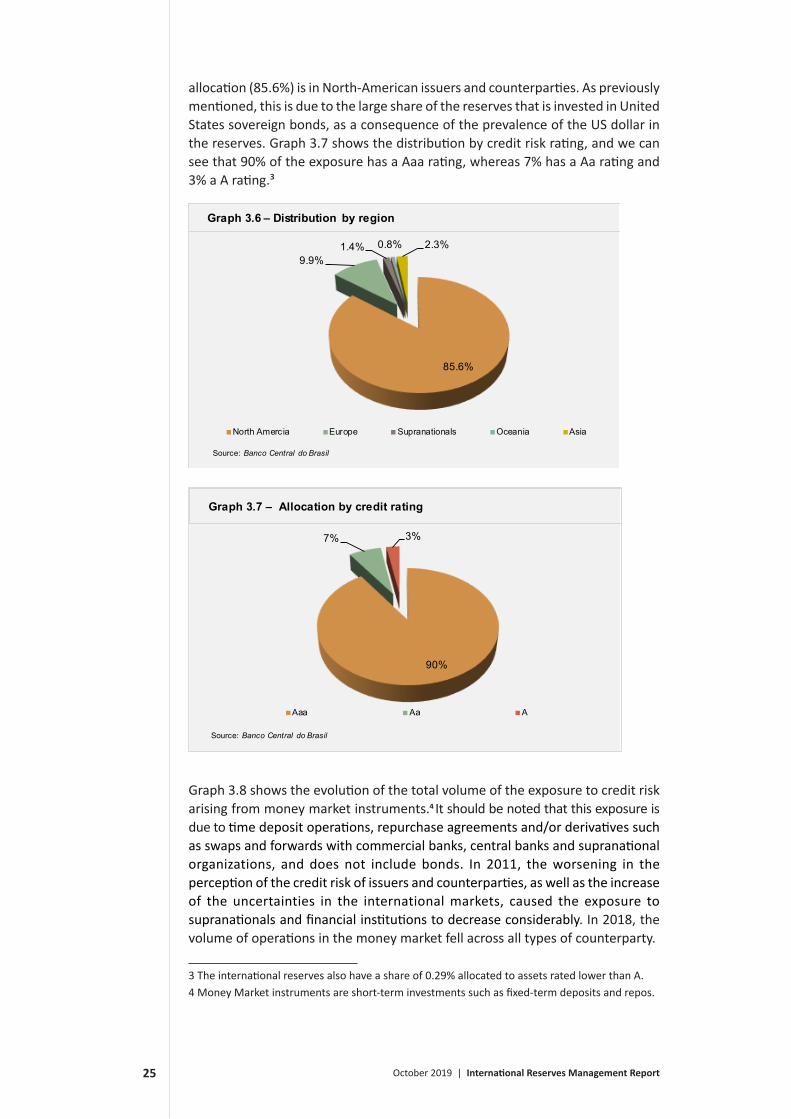
allocation (85.6%) is in North-American issuers and counterparties. As previously mentioned, this is due to the large share of the reserves that is invested in United States sovereign bonds, as a consequence of the prevalence of the US dollar in the reserves. Graph 3.7 shows the distribution by credit risk rating, and we can see that 90% of the exposure has a Aaa rating, whereas 7% has a Aa rating and 3% a A rating.³
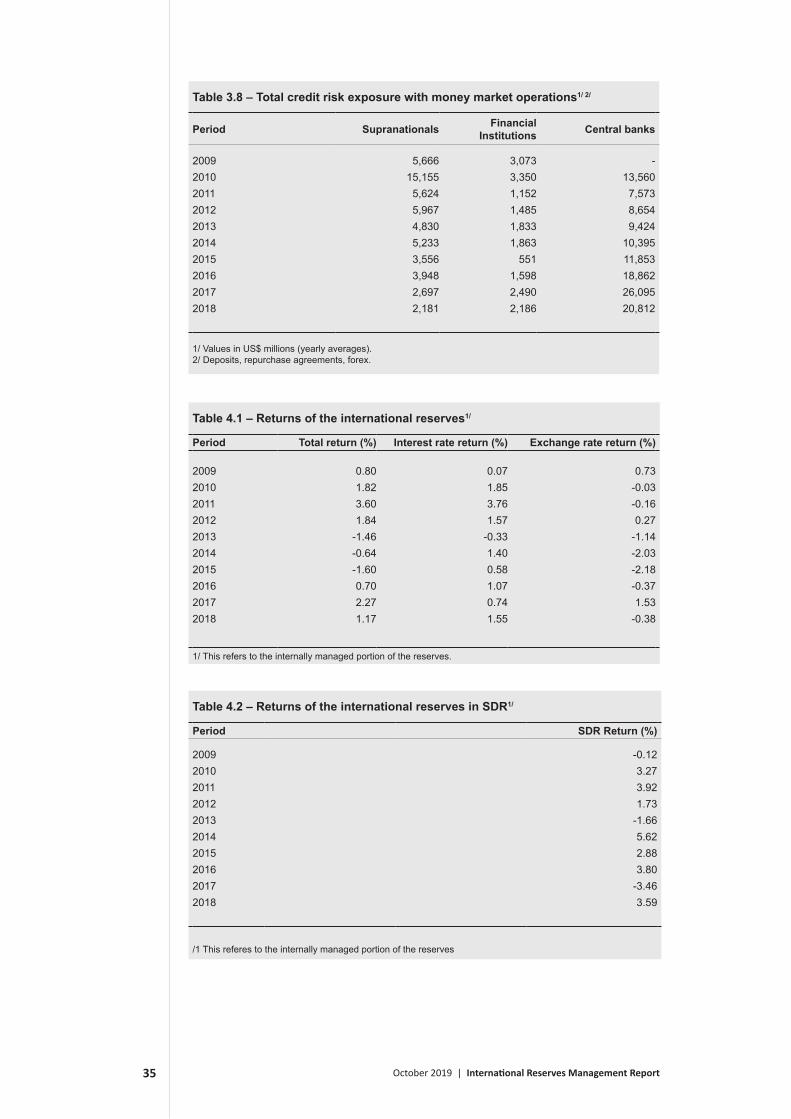
Graph 3.8 shows the evolution of the total volume of the exposure to credit risk arising from money market instruments.4 It should be noted that this exposure is due to time deposit operations, repurchase agreements and/or derivatives such as swaps and forwards with commercial banks, central banks and supranational organizations, and does not include bonds. In 2011, the worsening in the perception of the credit risk of issuers and counterparties, as well as the increase of the uncertainties in the international markets, caused the exposure to supranationals and financial institutions to decrease considerably. In 2018, the volume of operations in the money market fell across all types of counterparty.
85.6%
9.9%1.4% 0.8% 2.3%
North Amercia Europe Supranationals Oceania Asia
Graph 3.6 – Distribution by region
Source: Banco Central do Brasil
90%
7% 3%
Aaa Aa A
Graph 3.7 – Allocation by credit rating
Source: Banco Central do Brasil
4 Money Market instruments are short-term investments such as fixed-term deposits and repos.3 The international reserves also have a share of 0.29% allocated to assets rated lower than A.

October 2019 | International Reserves Management Report26
3.4 Operational riskOperational risk can be defined as the possibility of direct or indirect loss resulting from failure, deficiency or inadequacy of internal processes, systems or external events. In the past, this type of risk was controlled only with the use of qualitative management practices. Current practices, on the other hand, seek to measure operational risks by means of quantitative models as robust complements of internal controls. The Integrated Risk Management Policy of BCB is driven by guidelines and recommendations contained in main reference in risk management and business continuity such as, Committee of Sponsoring Organizations of the Treadway Commission (COSO), ISO 31000, AS/NZS 4360: 2004, ISO 22301, among others, and in Basel recommendations.
The tools of operational risk management (set out in this Policy) and used at BCB during the stages of survey, analysis, prioritization, treatment, monitoring and review of risk are: Risk and Control Self-Assessment (RCSA), the Key Risk Indicators (KRIs) and the Event History Log (RHE).
In the RCSAs, the risks associated to each process and their likely causes are identified through the perception of the business managers. They are classified according to the nature of the potential incidents with negative impacts. The initial approach to the risk self-assessment is performed through interviews where the most relevant risks associated to each business process are identified and classified according to an event-based taxonomy. The results of this identification and evaluation process of the operational risks allows a broad view of the processes, actions and projects as well as their interactions. This allows the design of risk mitigation measures by the organization.
With this procedure, the BCB has identified the risks in the processes related to the management of the international reserves and defined the corresponding risk mitigation measures.
The RHE consists in a database of operational risk incidents, which can be classified into two categories: events and quasi-events. This tool ensures that the incidents are being monitored and makes it possible to analyze the trends in order to
05,000
10,00015,00020,00025,00030,00035,000
2009 2010 2011 2012 2013 2014 2015 2016 2017 2018
Source: Banco Central do Brasil
Central Banks Financial Institutions Supranationals
Graph 3.8 – Total credit risk exposure to money market operations
US$ millions

October 2019 | International Reserves Management Report27
improve the controls. Taking into account the risk events that materialize is a powerful tool in the reassessment of processes, avoidance of new losses and correction of misleading risk perceptions.
With the implementation of an integrated non-financial risk model at the BCB, Key Risk Indicators (KRIs) were developed for evaluation and monitoring of risk. The KRIs, computed in an automated fashion from data generated in the day-to-day execution of tasks, aim to be predictive tools. Since the KRIs are highly correlated with the risks, they help in measuring the level of exposure and in managing the risks themselves. When associated with pre-defined thresholds, they can trigger an alarm, and thus allow a timely implementation of control measures for the risk in question as well as its consequences.
When it comes to operational aspects, international reserves management involves trading, compliance and operations settlement processes. Compliance and settlement are considered critical as they may affect security, settlement and profitability in a framework with different currencies, countries and time zones.
For compliance and settlement processes, transaction volume and asset diversification are uniquely important as they represent additional work flows, and thus more exposure to operational risk. In 2018, turnover reached US$ 9.85 trillion, with 15,032 transactions, an estimated 83,197 SWIFT messages and 767,965 accounting records. Differently from the values registered in the contracts, which consider the trade value, the compliance and settlement processes consider all flows related to the transactions due to the operational risks.
When it comes to the number of risk incidents relative to the international reserves management, a fall of 11% was recorded between 2017 and 2018, due to the automation of internal processes at the BCB and to improvements in the informational systems for external counterparties. Furthermore, the total number of incidents represented less than 1,7% of all the transactions.

October 2019 | International Reserves Management Report28
The analysis of returns arisen from international reserves investments must be done considering the BCB’s strategic objectives and the different mechanisms used for the calculation. BCB considers the accounting result for producing its balance sheet and the data from the managerial system developed internally to support the investment decisions and the internal controls.
The accounting result, however, is not the most appropriate metric from the point of view of investments decision making, as the returns are not calculated relatively to the amount invested, which changes due to purchases and sales of foreign currency. Besides, since the reserves are invested in the international markets, measuring the result in Brazilian Real incorporates the US dollar-Brazilian Real exchange rate fluctuations into the investment performance, which makes it hard to analyze the returns of each market. In order to solve these problems, the BCB calculates the returns on the reserves investments using a managerial system that allows the portfolio to be evaluated on a daily basis, according to international standards, making it possible to follow the investment strategies in each of the markets.
In 2018, the international reserves had a positive return of 1.17%. The US dollar appreciated against the other currencies in the reserves, leading to a forex return of -0.38%. Throughout the year, interest rates went up in the US, pushing down bond prices. This movement, however, was overtaken by the increased gains in carried interest and the final interest rate return was positive at 1.55%. This value includes the return of 0.265% of the Bisip fund.
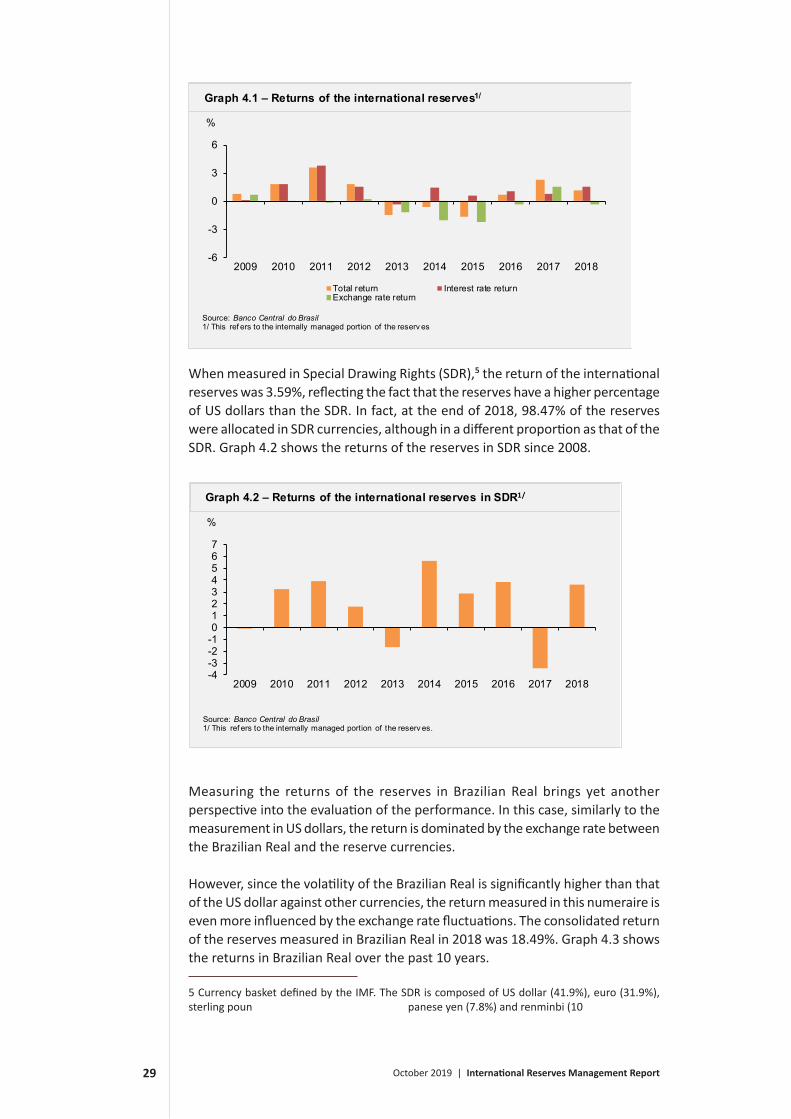
The returns of the internally managed reserves are shown in Graph 4.1. The interest rate and currency return components are also shown in Graph 4.1. The yield return corresponds to the component with no consideration of currency price variation, and it is highlighted due to the reserves’ predominantly fixed income character.
4 ReturnsThe performance evaluation allows for the verification of the strategy suitability vis-à-vis the defined strategic objectives.
October 2019 | International Reserves Management Report29
When measured in Special Drawing Rights (SDR),5 the return of the international reserves was 3.59%, reflecting the fact that the reserves have a higher percentage of US dollars than the SDR. In fact, at the end of 2018, 98.47% of the reserves were allocated in SDR currencies, although in a different proportion as that of the SDR. Graph 4.2 shows the returns of the reserves in SDR since 2008.
Measuring the returns of the reserves in Brazilian Real brings yet another perspective into the evaluation of the performance. In this case, similarly to the measurement in US dollars, the return is dominated by the exchange rate between the Brazilian Real and the reserve currencies.
However, since the volatility of the Brazilian Real is significantly higher than that of the US dollar against other currencies, the return measured in this numeraire is even more influenced by the exchange rate fluctuations. The consolidated return of the reserves measured in Brazilian Real in 2018 was 18.49%. Graph 4.3 shows the returns in Brazilian Real over the past 10 years.
-4-3-2-101234567
2009 2010 2011 2012 2013 2014 2015 2016 2017 2018
Retorno DES
Source: Banco Central do Brasil1/ This ref ers to the internally managed portion of the reserv es.
Graph 4.2 – Returns of the international reserves in SDR1/
%
-6
-3
0
3
6
2009 2010 2011 2012 2013 2014 2015 2016 2017 2018
Total return Interest rate returnExchange rate return
Source: Banco Central do Brasil1/ This ref ers to the internally managed portion of the reserv es
Graph 4.1 – Returns of the international reserves1/
%
5 Currency basket defined by the IMF. The SDR is composed of US dollar (41.9%), euro (31.9%), sterling pound (7.8%), Japanese yen (7.8%) and renminbi (10.6%) – as of 12.28.18.

October 2019 | International Reserves Management Report30
4.1 Risk-return profileThis section compares the risk-return profile of the international reserves investments in the period from July 2001 to December 2018 across some asset classes. The BCB has a long-term investment horizon and the analysis of the risk-return profile is performed based on monthly values obtained from the management system. Graph 4.4 shows the annualized average return and the standard deviation for several asset classes. The US treasury bonds are represented by the 1-3 year maturity bond index (USA 1-3), the 3-5 year maturity bond index (USA 3-5) and by the entire US yield curve (USA). Sovereign bond indices from Germany, the United Kingdom, Canada, Denmark, Sweden, Australia and Japan are also shown in the graph. In addition, the gold, S&P 500, Euro Stoxx 50 and DJ-UBS commodity (now known as S&P GSCI Total Return) indices were also included. The graph makes it possible to compare the risk-return profile of the reserves with that of these indices, using the US dollar as the base currency. The returns are consistent with the investment policies and with the risk- return preference of the Board of Governors.
USA 1-3
Reserves
USA 3-5USA
Australia
Canada
Japan
United KingdomSweden
Germany Denmark S&P 500
S&P GSCI Total Return
Euro Stoxx50
Gold
-2
0
2
4
6
8
10
12
0 5 10 15 20 25
Graph 4.4 – Risk (%) vs. return (%) profile1/2/
Source: Banco Central do Brasil1/ Av erage return compared to standard dev iation (% anually ) f rom Jul/2001 to Dec/2018. US Dollar is base currency .2/ Standard dev iation of monthly returns (%)
Risk (%)
Return (%)
-30-20-10
01020304050
2009 2010 2011 2012 2013 2014 2015 2016 2017 2018
Retorno Reais
Source: Banco Central do Brasil1/ This ref ers to the internally managed portion of the reserv es.
Graph 4.3 – Returns of the international reserves in Brazilian real1/
%

October 2019 | International Reserves Management Report31
Note
This annex presents tables with the data used for the graphs shown in this report. It does not include the data from chapter 1 and Section 4.1, as they can be obtained from historical series available to the public. The numbers of the tables are the same of the graphs presented in the report.
The tables use managerial data with respect to the operations performed in the international reserves management process.
Table 2.1 – Foreign currency allocation1/
Period USD EUR JPY GBP CAD AUD Gold Others
2009 81.90% 7.00% 0.80% 3.70% 3.50% 1.90% 0.50% 0.70%2010 81.80% 4.50% 0.90% 2.70% 6.10% 3.10% 0.50% 0.40%2011 79.61% 4.94% 0.99% 2.98% 6.01% 3.10% 0.50% 1.90%2012 77.40% 5.20% 2.30% 3.00% 6.00% 3.00% 1.00% 2.10%2013 77.70% 5.70% 2.00% 3.20% 5.80% 2.70% 0.80% 2.10%2014 79.70% 4.50% 1.25% 3.08% 5.98% 2.73% 0.74% 2.02%2015 82.95% 4.62% 1.81% 3.01% 4.29% 2.65% 0.66% 0.01%2016 83.46% 4.42% 2.13% 2.60% 4.35% 2.59% 0.70% -0.25%2017 82.25% 4.97% 1.83% 2.82% 4.49% 2.88% 0.76% 0.00%2018 89.93% 5.13% 1.49% 1.92% 0.47% 0.30% 0.75% 0.00%
1/ Reserves in cash concept (end of period data)
Annex
October 2019 | International Reserves Management Report32
Table 2.2 – Asset allocation1/
Period Sovereigns Agencies Supra-nationals Bank Deposits Deposits in
supra. CB ETF Others
2009 89.82% 3.96% 1.94% 1.20% 2.45% 0.63%2010 80.20% 5.88% 1.82% 1.18% 10.19% 0.73%2011 83.51% 7.12% 4.40% 0.33% 3.83% 0.80%2012 89.87% 3.19% 1.23% 0.41% 4.07% 1.22%2013 91.17% 2.31% 1.05% 0.27% 3.47% 1.74%2014 89.99% 2.70% 1.26% 0.24% 3.69% 2.13%2015 88.47% 2.57% 1.01% 0.16% 4.50% 3.29%2016 88.70% 1.60% 0.70% 0.20% 7.87% 0.94%2017 87.64% 1.61% 0.74% 0.65% 8.49% 0.88%2018 93.18% 1.56% 0.78% 0.36% 2.47% 0.88% 0.79%
1/ Rerserves in cash concept (end of perido data)
Table 2.3 – Asset allocation1/
US$ millions
Period Sovereigns Agencies Supra-nationals
Bank Deposits
Deposits in supran. CB ETF Others
2009 208,014.34 9,176.61 4,481.27 2,779.93 5,665.67 1,468.412010 226,098.54 16,584.11 5,120.38 3,334.38 28,714.64 2,053.622011 287,583.91 24,522.50 15,167.37 1,150.16 13,196.73 2,767.352012 322,808.50 11,472.40 4,423.14 1,485.20 14,614.54 4,374.622013 314,166.09 7,956.67 3,605.44 919.47 11,961.18 5,996.002014 315,597.47 9,477.06 4,419.05 827.55 12,944.62 7,456.842015 305,183.33 8,866.73 3,493.59 533.12 15,526.57 11,341.632016 313,064.35 5,640.11 2,467.90 713.05 27,766.31 3,316.772017 321,978.04 5,897.99 2,709.60 2,399.18 31,177.89 3,218.042018 342,687.09 5,732.24 2,850.67 1,307.10 9,068.31 3,222.01 2,893.64
1/ Reserves in cash concept (end of period data)
Table 2.4 – Average term of investment1/
Period Years
2009 1.632010 1.852011 2.752012 2.792013 2.022014 2.112015 1.972016 1.882017 1.692018 2.23
1/ Reserves in cash concept (end of period data)
October 2019 | International Reserves Management Report33
Table 2.5 – Average term of investment1/
Period Years
2009 2.21
2010 1.68
2011 2.65
2012 2.78
2013 2.52
2014 1.99
2015 2.07
2016 1.93
2017 1.81
2018 2.07
1/ Reserves in cash concept (annual average)
Table 3.1 – International reserves VaR1/
Period Total VaR (%) Interest rate VaR (%) Currency VaR (%)
2009 4.1 3.3 2.52010 2.6 1.6 2.42011 3.1 2.5 2.82012 2.2 1.7 2.12013 2.6 1.5 2.02014 1.9 1.0 1.52015 3.0 1.4 2.42016 2.4 1.2 2.02017 2.0 0.8 1.52018 1.5 1.1 1.0
1/ Yearly average for each year of the annualized daily VaR.
Table 3.2 – Forex stress test 1/
Variation ReturnUS$ billions
-30.0% -11.12-20.0% -7.41-10.0% -3.71-5.0% -1.855.0% 1.8510.0% 3.7120.0% 7.4130.0% 11.12
1/ Impact of the exchange rate variations against the US dollar on the value of the reserves, as of 12.31.2018.
October 2019 | International Reserves Management Report34
Table 3.3 – Interest rate stress test1/
Variation ReturnUS$ billions
0.5% -4.01.0% -7.91.5% -11.72.0% -15.42.5% -19.13.0% -22.74.0% -29.65.0% -36.2
1/ Impact of parallel shifts of the yield curves on the value of the international reserves, as of 12.31.2018.
Table 3.4 – Liquidity risk1/2/
Period Sovereigns (%) Supranationals (%) Agencies (%) Local Gov. (%) ETF MBS (%)
2012 0.04 0.20 0.202013 0.04 0.13 0.102014 0.03 0.08 0.062015 0.03 0.12 0.092016 0.03 0.13 0.102017 0.03 0.12 0.102018 0.03 0.08 0.08 0.13 0.02
1/ Values correspond to their respective portfolios2/ Calculated as the average bid-ask spread.
Table 3.5 – Distribution by counterparty type
Period Agencies Supranationals Sovereigns Financial Institutions
Central Banks
Local Governments
2009 4.0% 4.4% 89.8% 1.8% 0.0% 0.0%2010 5.9% 7.2% 80.8% 1.2% 4.8% 0.0%2011 7.2% 6.1% 84.2% 0.3% 2.2% 0.0%2012 3.2% 2.9% 91.0% 0.4% 2.4% 0.0%2013 2.3% 2.5% 92.8% 0.3% 2.1% 0.0%2014 2.3% 2.8% 91.4% 0.5% 3.0% 0.0%2015 2.8% 1.9% 91.5% 0.5% 3.4% 0.0%2016 2.1% 2.1% 89.8% 0.5% 5.5% 0.0%2017 1.7% 1.5% 89.0% 0.7% 7.1% 0.0%2018 1.6% 1.4% 90.8% 0.6% 5.6% 0.0%
October 2019 | International Reserves Management Report35
Table 3.8 – Total credit risk exposure with money market operations1/ 2/
Period Supranationals Financial Institutions Central banks
2009 5,666 3,073 - 2010 15,155 3,350 13,560 2011 5,624 1,152 7,573 2012 5,967 1,485 8,654 2013 4,830 1,833 9,424 2014 5,233 1,863 10,395 2015 3,556 551 11,853 2016 3,948 1,598 18,862 2017 2,697 2,490 26,095 2018 2,181 2,186 20,812
1/ Values in US$ millions (yearly averages).2/ Deposits, repurchase agreements, forex.
Table 4.1 – Returns of the international reserves1/
Period Total return (%) Interest rate return (%) Exchange rate return (%)
2009 0.80 0.07 0.732010 1.82 1.85 -0.032011 3.60 3.76 -0.162012 1.84 1.57 0.272013 -1.46 -0.33 -1.142014 -0.64 1.40 -2.032015 -1.60 0.58 -2.182016 0.70 1.07 -0.372017 2.27 0.74 1.532018 1.17 1.55 -0.38
1/ This refers to the internally managed portion of the reserves.
Table 4.2 – Returns of the international reserves in SDR1/
Period SDR Return (%)
2009 -0.122010 3.272011 3.922012 1.732013 -1.662014 5.622015 2.882016 3.802017 -3.462018 3.59
/1 This referes to the internally managed portion of the reserves

October 2019 | International Reserves Management Report36
Table 4.3 – Returns of the international reserves in Brazilian real1/
Period Return in BRL (%)
2009 -24.912010 -2.572011 16.642012 10.952013 12.962014 12.672015 44.682016 -15.952017 3.802018 18.49
/1 This referes to the internally managed portion of the reserves

October 2019 | International Reserves Management Report37
Active management
Particular way of financial management in which it is tried to anticipate movements of market, variations of liquidity and other dynamic facts, with the objective of obtaining a better risk adjusted return in relation to the benchmark.
Basis point (b.p.)
One basis point corresponds to 0.01 percentage point.
Benchmark
It is a reference portfolio that is typically used as representation of the choice of risk and return of the investor.
CDS
Credit Default Swap. Financial instrument through which it is possible to buy or sell insurance against default of assets issued by companies or countries.
CRB
Commodity Research Bureau. Commodities index price daily evaluated by Thomson Reuters/Jefferies.
Default
Technical situation in which the debtor does not fulfill a contractual obligation.
ETF (Exchange Traded Funds)
Index funded traded like stocks in exchanges. The indices can be composed of either fixed income (e.g. MBS) or equity (e.g. S&P 500)
Government agencies
They are agencies sponsored by governments with the objective of supporting strategic areas of the economy as construction, education etc.
GlossaryThe definitions present the unique objective of helping the general understanding of the concepts described in the report.

October 2019 | International Reserves Management Report38
MBS (Mortgage-Backed Securities)
Fixed-income securities guaranteed by bundled mortgages or real estate loans.
Money market
Segment of the financial market composed of short-term assets (until one year) and usually of major liquidity, such as commercial papers, certificates of negotiable deposits (CDs), treasury bills, buybacks agreements (repos), etc.
Rating
Grade given by a risk agency that expresses the credit risk of institutions, countries and assets.
Rating agencies
They are agencies, usually private, which rate the credit risk of institutions, countries and assets.
Spread
Price difference between the quotations for buying and selling an asset or between quotations of two different assets.
Supranationals
Bonds issued by multilateral organisms, such as the International Monetary Fund (IMF), the Interamerican Bank for Development (IDB), the Bank for International Settlements (BIS), the World Bank (Bird) etc.
Swift
Society for Worldwide Interbank Financial Telecommunications. It is a global system of telecommunications whose main objective is to provide message service, which enables the Banco Central do Brasil to settle operations with international reserves.
Treasuries/T-bills
Debt instruments issued by the North American Treasury. Treasury bills (T-bills) are issued with up to one-year term and do not pay coupons before maturity. The other treasuries (bonds and notes) are issued with a higher term and pay coupons periodically.
Value at Risk
Estimated value for the investment loss, in a certain time horizon, with a given confidence level.

October 2019 | International Reserves Management Report39
VIX
Implicit volatility index, based upon S&P500 calls.
Volatility
Degree of prices variability or assets returns.
Yield
Profitability. Dividend or interests paid as percentage of the current value.

October 2019 | International Reserves Management Report40