Embed Size (px)
Citation preview

International Trade Miami-Dade County
Robert D. Cruz, PhD, Chief Economist 2013
Robert Hesler, Sr. Economic Analyst
…. International Trade, 2013 Page 1
Regulatory & Economic Resources Dept., Economic Analysis and Policy www.miamidade.gov/business/economic-development.asp
Regulatory & Economic Resources Dept., Economic Analysis and Policy www.miamidade.gov/business/economic-development
SUMMARY OF MIAMI-DADE INTERNATIONAL TRADE IN GOODS: 2013
After a sharp decline in international trade
activity during the global recession of late 2007-
mid-2009, Miami-Dade international trade sector
began its robust recovery in 2009, with significant
growth in both imports and exports through 2012.
Significant decelerations in the pace of economic
growth in the county’s major export markets lead
to a decline in the current value of exports and
total trade in 2013. Total trade through Miami
International Airport and PortMiami topped
$93.1 billion for the 2013, representing a 3.3%
decrease from 2012. Imports, however,
increased 4.5% to $41.4 billion, while exports
decreased by -8.8% to $51.7 billion. Trade
activity declined further near the end of 2013.
Total imports serviced through Miami-Dade ports
in the fourth quarter of 2013 (2013:Q4) fell -10.8%
to $10.2 billion, compared to 2012:Q4. Fourth
quarter exports totaled $13.1 billion, representing
a -10.2% decrease from 2012:Q4.
The total volume trade, measured in terms of
tonnage, decreased -2.2% to 7.4 million tons of
cargo from 2012 to 2013. Imports measured by
weight increased 4.7% over the year while exports
of goods decreased -9.3% over the year.
TRADE BY REGION
The data on Miami-Dade’s regional trading
partners shows large differences in the County’s
international trade with various world regions. In
particular, Europe was the County’s 4th largest
For additional information visit our website at: www.miamidade.gov/business/economic-development.asp Dr. Robert D. Cruz, Chief Economist (305) 375-1879 Mr. Robert Hesler, Sr. Economic Analyst (305) 374-4811
International Trade Report, 2013
Economic Analysis & Policy
International Trade, 2013 Page 2
Regulatory & Economic Resources Dept., Economic Analysis and Policy www.miamidade.gov/business/economic-development.asp
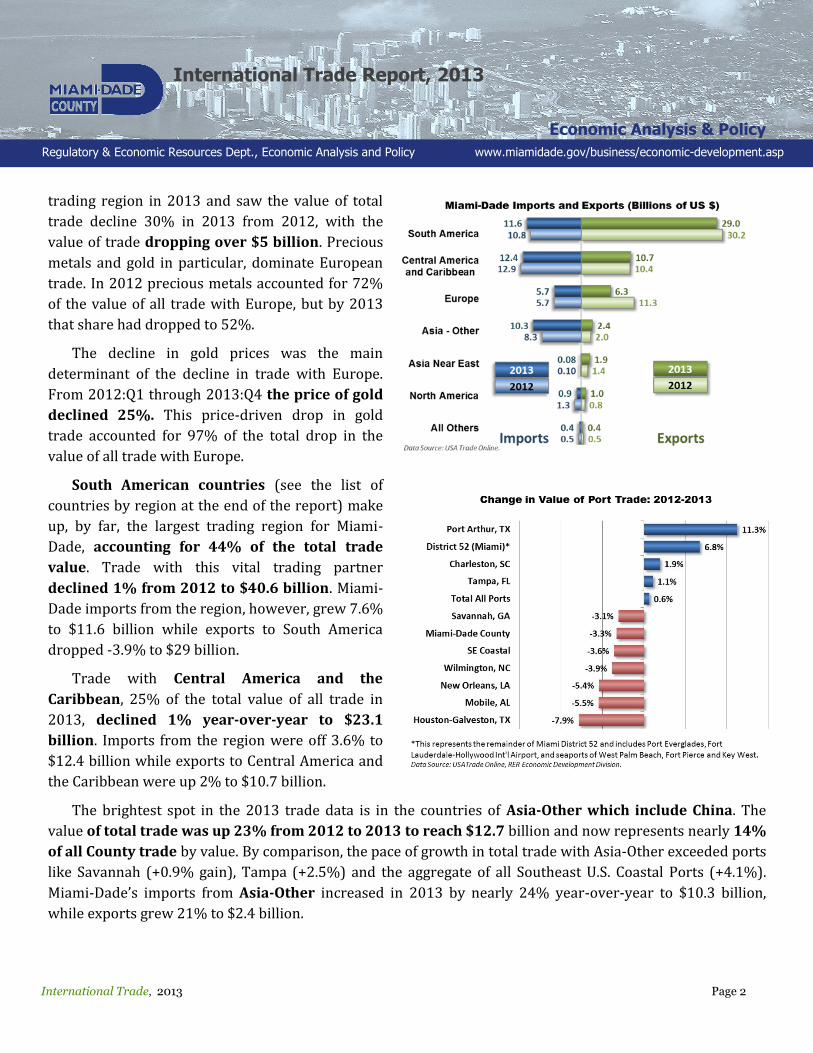
trading region in 2013 and saw the value of total
trade decline 30% in 2013 from 2012, with the
value of trade dropping over $5 billion. Precious
metals and gold in particular, dominate European
trade. In 2012 precious metals accounted for 72%
of the value of all trade with Europe, but by 2013
that share had dropped to 52%.
The decline in gold prices was the main
determinant of the decline in trade with Europe.
From 2012:Q1 through 2013:Q4 the price of gold
declined 25%. This price-driven drop in gold
trade accounted for 97% of the total drop in the
value of all trade with Europe.
South American countries (see the list of
countries by region at the end of the report) make
up, by far, the largest trading region for Miami-
Dade, accounting for 44% of the total trade
value. Trade with this vital trading partner
declined 1% from 2012 to $40.6 billion. Miami-
Dade imports from the region, however, grew 7.6%
to $11.6 billion while exports to South America
dropped -3.9% to $29 billion.
Trade with Central America and the
Caribbean, 25% of the total value of all trade in
2013, declined 1% year-over-year to $23.1
billion. Imports from the region were off 3.6% to
$12.4 billion while exports to Central America and
the Caribbean were up 2% to $10.7 billion.
The brightest spot in the 2013 trade data is in the countries of Asia-Other which include China. The
value of total trade was up 23% from 2012 to 2013 to reach $12.7 billion and now represents nearly 14%
of all County trade by value. By comparison, the pace of growth in total trade with Asia-Other exceeded ports
like Savannah (+0.9% gain), Tampa (+2.5%) and the aggregate of all Southeast U.S. Coastal Ports (+4.1%).
Miami-Dade’s imports from Asia-Other increased in 2013 by nearly 24% year-over-year to $10.3 billion,
while exports grew 21% to $2.4 billion.

International Trade Report, 2013
Economic Analysis & Policy
International Trade, 2013 Page 3
Regulatory & Economic Resources Dept., Economic Analysis and Policy www.miamidade.gov/business/economic-development.asp
COMPARISONS WITH U.S. AND SOUTHEAST
COASTAL PORTS
The total value of trade in goods from all world regions increased at the national level (all U.S. ports
combined) by 0.6% from 2012 to 2013, but Miami-Dade total trade trailed the nation with a decrease
of -3.3%. Exports across the nation were up 2.1% in 2013, but export shipments from Miami-Dade were down
by -8.8%. Nationally, imports were down -0.4% compared to an increase of 4.5% in Miami-Dade. There were
two significant distinctions between Miami-Dade and national trade. The first was in the increase in national
exports of refined petroleum which actually decreased in Miami-Dade’s port. The second was the large
relative decrease in the value of gold exports from Miami-Dade, which represent a much larger component of
county trade compared to its significance at the national trade level.
Miami-Dade’s trade performance in 2013 was very much like that of other U.S. Southeast coastal ports.
Total trade of goods decreased by a little more than Miami’s, down -3.6% for all SE ports combined. Exports
from SE coastal ports fell -0.2% year-over-year while imports were off -6.3%. The ports in Broward, Palm
Beach and Monroe Counties, (District 52 excluding Miami-Dade) grew, in terms of trade value, at faster

International Trade Report, 2013
Economic Analysis & Policy
International Trade, 2013 Page 4
Regulatory & Economic Resources Dept., Economic Analysis and Policy www.miamidade.gov/business/economic-development.asp
pace than in Miami-Dade (+6.8% vs. -3.3% in Miami-Dade). The increase in the quantity of petroleum shipped
through Port Everglades and the increase in the value of aircraft shipped overseas from Fort Lauderdale-
Hollywood International Airport were the main factors for the comparatively faster growth the rest of District
52.
Although Miami-Dade’s total trade with South America declined by -1%, all the SE coastal ports combined
saw trade with South America decrease by -3.6%. Imports from South America to all Southeastern coastal
ports were down -8% while exports to South America were up slightly, 0.2%. All U.S. ports saw South
American trade decrease by -4%, with imports off -7.5% and exports dropping -0.4%. Miami-Dade County
handled 16.5% of all U.S. trade in goods with South America in 2013, up from 16% of the national total in
2012. County airport and seaport (combined) also expanded its share of South American trade shipped
through all SE Coastal ports, accounting for 22.6% of all South American trade through SE Coastal ports in
2013, up from 22% the previous year.
Miami-Dade County trade in goods with Central America and the Caribbean was down -1.1% from 2012.
Imports from the region were off -3.6%, but exports increased 2.1%. By comparison, southeast coastal trade
with the region was down -3.5% with imports down -9.8% and exports up 1.5%. U.S. total trade with Central
America and the Caribbean was off -2.1% with imports from the region down -8.6%, but exports up 2.9%.
Miami-Dade County accounted for 23.8% of all U.S. trade in goods with this region in 2013, up slightly from
23.5% in 2012. Miami-Dade again increased its share of total trade to the region from SE coastal ports
modestly to 31% in 2013 from 30% a year earlier.
Miami-Dade’s next largest region in terms of the value of total trade in 2013 was Asia-Other. The value of
total trade increased 23% ($2.4 billion) from 2012 to 2013. Imports were up 24% and exports were up 21%
year-over-year. Nationally the value of trade with this region was up 2.5% (imports -1.7%; exports – 4.3%)
over the same time period. Miami-Dade County’s share of national trade with this region grew to 1.1% in
2013 from 0.9% in 2012. Southeast coastal ports saw trade with Asia-other grow 4.1% (imports +4%; exports
+4.4%) over last year and the county’s share of the total to 6.9% in 2013 from 5.8% the previous year.
The values of trade with Europe experienced the greatest divergence in trends between Miami-Dade and
southeastern coastal and national ports occur. Total trade of goods between Miami-Dade and Europe
decreased nearly 30% from 2012 to 2013. The value of imports was down -0.3% while exports were off -44%.
As noted above, nearly all of this decrease resulted from a drop in the price of gold. Nationally, trade with
Europe increased slightly, 0.4%, (imports – 1.1%; exports - -0.6%). Miami-Dade’s share of European trade of
goods declined from 2.2% in 2012 to 1.5% in 2012. Trade between Europe and all southeast coastal ports
decline -1.1% (imports – 0.9%; exports - -3.7%) and the county’s share decreased to 5% in 2013 from 7% the
previous year.
Although trade with the top regional trading partners slowed for Miami-Dade County in 2013, Miami-Dade
performed as well or better than the southeastern regional and national ports did collectively. The only

International Trade Report, 2013
Economic Analysis & Policy
International Trade, 2013 Page 5
Regulatory & Economic Resources Dept., Economic Analysis and Policy www.miamidade.gov/business/economic-development.asp
exception was the price effect of gold on trade with Europe. Trade with South America and Central America
and the Caribbean dropped slightly in Miami-Dade but the declines were greater across the southeast coastal
ports and nationally. Trade with Asia–other increased dramatically in Miami-Dade and also increased
somewhat at the other SE coastal ports. And, while European trade dropped dramatically in Miami-Dade, the
data does not suggest that it moved to other competing ports.
TRADE BY COMMODITY
There were few notable shifts in the value
of trade by commodities from Miami-Dade’s
airport and seaport viewed in terms of broad
commodity groups. The top three categories
of commodities account for 60% of all Miami-
Dade trade. All three categories were down
year over year. Machinery, which is mostly
data processing and communications
equipment, circuit boards and office
equipment and parts, accounted for 37% of
traded goods in 2013 ($34.9 billion).
Machinery shipments fell -0.5% from 2012 to
2013. Shipments of transportation
commodities accounted for 13% of exports
from Miami-Dade and 8% of total traded
goods ($7.5 billion). Over 70% of this
category’s total exports in 2013 were
aircraft, engines, and parts. Exports of
transportation commodities fell by nearly 7%
while imports increased by approximately
15%..
The third category of traded commodities
was the aforementioned stone & glass group that includes gold and other precious metals. This accounts for
14% of total trade and 11% of exports ($13.5 billion). The total value fell over -24% in 2013 as gold prices
took a sharp decline.
While total trade of machinery declined in Miami-Dade County, it increased for both the southeastern coastal
ports and nationally. While it decreased by approximately $150 million (-0.5%) in Miami-Dade, it increased
for the nation as whole (+$4.3 billion, +0.5%). Among the aggregate of SE coastal ports, trade shipments of

International Trade Report, 2013
Economic Analysis & Policy
International Trade, 2013 Page 6
Regulatory & Economic Resources Dept., Economic Analysis and Policy www.miamidade.gov/business/economic-development.asp
machinery increased about $1.6 billion (+0.9%). Nationally the trade of transportation commodities increased
approximately $24 billion (+4.7%) while falling about $425 million (-5.4%) in Miami-Dade. Southeastern
ports saw trade of transportation commodities drop about $3.2 billion (-3.4%).
Trade shipments of stone and glass commodities increased at the national level by about $3.6 billion (+2.2%).
Among SE coastal port trade in stone and glass decreased about $3.6 billion, and fell by about $4.3 billion in
Miami-Dade. Looking only at precious metals and stone, within this category, nationally there was a decrease
of about $130 million (-0.2%) compared to a drop of nearly $4 billion among SE ports and about $3.9 billion in
Miami-Dade.

International Trade Report, 2013
Economic Analysis & Policy
International Trade, 2013 Page 7
Regulatory & Economic Resources Dept., Economic Analysis and Policy www.miamidade.gov/business/economic-development.asp
The following pages show tables and charts of the trade data in a variety of ways: weight
by region and commodity, top countries by export and import, comparisons with regional
and national ports, and general overview graphic of the trade data for Miami-Dade County.

International Trade Report, 2013
Economic Analysis & Policy
International Trade, 2013 Page 8

International Trade Report, 2013
Economic Analysis & Policy
International Trade, 2013 Page 9

International Trade Report, 2013
Economic Analysis & Policy
International Trade, 2013 Page 10

International Trade Report, 2013
Economic Analysis & Policy
International Trade, 2013 Page 11

International Trade Report, 2013
Economic Analysis & Policy
International Trade, 2013 Page 12

International Trade Report, 2013
Economic Analysis & Policy
International Trade, 2013 Page 13
International Trade Report, 2013
Economic Analysis & Policy
International Trade, 2013 Page 14

International Trade Report, 2013
Economic Analysis & Policy
International Trade, 2013 Page 15

International Trade Report, 2013
Economic Analysis & Policy
International Trade, 2013 Page 16

International Trade Report, 2013
Economic Analysis & Policy
International Trade, 2013 Page 17

International Trade Report, 2013
Economic Analysis & Policy
International Trade, 2013 Page 18
International Trade Report, 2013
Economic Analysis & Policy
International Trade, 2013 Page 19

International Trade Report, 2013
Economic Analysis & Policy
International Trade, 2013 Page 20
Countries by region defined by the Census Bureau
Africa Algeria, Angola, Benin, Botswana, British Indian Ocean Territories, Burkina Faso, Burundi, Cameroon, Cape Verde, Central African Republic, Chad, Comoros, Congo (Brazzaville), Congo (Kinshasa), Cote d'Ivoire, Djibouti, Egypt, Equatorial Guinea, Eritrea, Ethiopia, French Southern and Antarctic Lands, Gabon, Gambia, Ghana, Guinea, Guinea-Bissau, Kenya, Lesotho, Liberia, Libya, Madagascar, Malawi, Mali, Mauritania, Mauritius, Mayotte, Morocco, Mozambique, Namibia, Niger, Nigeria, Reunion, Rwanda, Sao Tome and Principe, Senegal, Seychelles, Sierra Leone, Somalia, South Africa, South Sudan, St Helena, Sudan, Swaziland, Tanzania, Togo, Tunisia, Uganda, Western Sahara, Zambia, Zimbabwe
Asia Near East Bahrain, Gaza Strip Administered by Israel, Iran, Iraq, Israel, Jordan, Kuwait, Lebanon, Oman, Qatar, Saudi Arabia, Syria, United Arab Emirates, West Bank Administered by Israel, Yemen
Asia - South
Afghanistan, Bangladesh, India, Nepal, Pakistan, Sri Lanka
Asia - Other Bhutan, Brunei, Burma, Cambodia, China, Hong Kong, Indonesia, Japan, Korea, North, Korea, South, Laos, Macau, Malaysia, Maldives, Mongolia, Philippines, Singapore, Taiwan, Thailand, Timor-Leste, Vietnam
Australia and Oceania Australia, Christmas Island, Cocos (Keeling) Islands, Cook Islands, Fiji, French Polynesia, Heard and McDonald Islands, Kiribati, Marshall Islands, Micronesia, Nauru, New Caledonia, New Zealand, Niue, Norfolk Island, Palau, Papua New Guinea, Pitcairn Islands, Samoa, Solomon Islands, Tokelau, Tonga, Tuvalu, Vanuatu, Wallis and Futuna
Europe Albania, Andorra, Armenia, Austria, Azerbaijan, Belarus, Belgium, Bosnia and Herzegovina, Bulgaria, Croatia, Cyprus, Czech Republic, Denmark, Estonia, Faroe Islands, Finland, France, Georgia, Germany, Gibraltar, Greece, Hungary, Iceland, Ireland, Italy, Kazakhstan, Kosovo, Kyrgyzstan, Latvia, Liechtenstein, Lithuania, Luxembourg, Macedonia, Malta, Moldova, Monaco, Montenegro, Netherlands, Norway, Poland, Portugal, Romania, Russia, San Marino, Serbia, Serbia and Montenegro, Slovakia, Slovenia, Spain, Svalbard, Jan Mayen Island, Sweden, Switzerland, Tajikistan, Turkey, Turkmenistan, Ukraine, United Kingdom, Uzbekistan, Vatican City
North America
Canada, Greenland, Mexico, St Pierre and Miquelon
Central America and Caribbean Anguilla, Antigua and Barbuda, Aruba, Bahamas, Barbados, Belize, Bermuda, British Virgin Islands, Cayman Islands, Costa Rica, Cuba, Curacao, Dominica, Dominican Republic, El Salvador, Grenada, Guadeloupe, Guatemala, Haiti, Honduras, Jamaica, Martinique, Montserrat, Netherlands Antilles, Nicaragua, Panama, Sint Maarten, St Kitts and Nevis, St Lucia, St Vincent and the Grenadines, Trinidad and Tobago, Turks and Caicos Islands
South America Argentina, Bolivia, Brazil, Chile, Colombia, Ecuador, Falkland Islands (Islas Malvinas), French Guiana, Guyana, Paraguay, Peru, Suriname, Uruguay, Venezuela