Embed Size (px)
Citation preview

International Trade Statistics of Sri Lanka - 2017
Department of Commerce
Ministry of Industry and Commerce

ii
Preface
International Trade Statistics of Sri Lanka – 2017, annual publication is a product of successful team
effort of the officers of Statistics Division of the Department of Commerce (DoC) under the guidance of
Director General of Commerce and other officers of the DoC.
The main objective of this publication is to provide trade statistics with ready-to-use reference guide on
the details of export and import statistics to national and international users. The adoption of the
methodology indicated in this report will assist in facilitating data aggregation, data compilation both
at national and international level.
The data presented in this publication is designed to meet the interest of the users of trade statistics
including planners, policy makers, administrators, researchers, international traders and industrialists
etc.
The services of Mrs. D.P.W.D. Warnasooriya (Statistician), Ms. Dilini Fernando (Development
Officer) in preparation of this publication are very much appreciated.
Any suggestions and comments for improvement of this publication are most welcome.

iii
Contents Page No.
Preface by the Director General of Commerce ii
Abbreviation iv
Chapter - I Selected Economic Indicators of Sri Lanka v Summary on International Trade vi-xiv
Chapter - II Statistical Tables
Table 1 Exchange Rates 1 Table 1.1 Total exports, total imports, balance of trade of Sri Lanka (1950 – 2017) 2 Table 1.2 Export values of top 25 countries 2008- 2017 3 Table 1.3 Import values of top 25countries 2008 - 2017 4
Table 1.4 Summary of exports to the world 2013 - 2017 5-6 Table 1.5 Summary of imports from the world 2013 - 2017 7-8 Table 1.6 Export and Import values in Economic Unions 2013 - 2017 9 Table 1.6 A Percentage of Export and Import values in Economic Unions 2013 - 2017 10
Table 1.7 Major Exports to EU Countries 2013 - 2017 11 Table 1.8 Major Imports from EU Countries 2013 - 2017 12-14 Table 1.9 Major Exports to Middle East Countries 2013 - 2017 15
Table 1.10 Major Buyers of Sri Lankan Tea 2013 - 2017 16-17 Table 1.11 Major Buyers and Suppliers of Tea 2013 - 2017 18 Table 1.12 Major Buyers and Suppliers of Rubber and Articles thereof 2013 - 2017 19 Table 1.13 Import and Export of Rubber and Articles thereof @ 4 digit 2013 - 2017 20
Table 1.14 Major Buyers of Sri Lankan Apparel 2013 - 2017 21 Table 1.15 Export and Import of Apparel by Countries 2013 - 2017 22 Table 1.16 Major Export and Import items of Sri Lanka with India 2013 - 2017 23
Table 1.17 Major Export and Import items of Sri Lanka with Japan 2013 - 2017 24 Table 2.1.1 Export and Import 2013-2017 – African Countries 25-26 Table 2.1.2 Export and Import 2013-2017 – Andean Countries 26 Table 2.1.3 Export and Import 2013-2017 – ASEAN Countries 27
Table 2.1.4 Export and Import 2013-2017 – BRICS Countries 27 Table 2.1.5 Export and Import 2013-2017 – Central and Eastern Europe Countries 28 Table 2.1.6 Export and Import 2013-2017 – Central European Free Trade Agreements(CEFTA) Countries
28
Table 2.1.7 Export and Import 2013-2017 – European Free Trade Association (EFTA) Countries 29
Table 2.1.8 Export and Import 2013-2017 – Common Market for Eastern and South African (COMESA) Countries
29
Table 2.1.9 Export and Import 2013-2017– Commonwealth of Independent States (CIS)Countries 30
Table 2.1.10 Export and Import 2013-2017 – G 15 Countries 30 Table 2.1.11 Export and Import 2013-2017 – European Union (EU) Countries 31
Table 2.1.12 Export and Import 2013-2017 – Mercosur Countries 32 Table 2.1.13 Export and Import 2013-2017 – Middle East Countries 32 Table 2.1.14 Export and Import 2013-2017 – Latin American Countries 33
Table 2.1.15 Export and Import 2013-2017 – Oceania Countries 34 Table 2.1.16 Export and Import 2013-2017 – South Asian Countries 34 Table 2.1.17 Export and Import 2013-2017 – North American Free Trade Agreement (NAFTA)
Countries
34
Table 2.1.18 Export and Import 2013-2017 – Asia Pacific Trade Association (APTA) Countries 35 Table 2.1.19 Export and Import 2013-2017 – Indian Ocean RIM Association (IROA) Countries 35 Table 2.1.20 Export and Import 2013-2017 – Bay of Bengal Initiative for Multi Sectoral
Technical and Economic Cooperation (BIMSTEC) Countries
36
Table 2.1.21 Export and Import 2013-2017 – Asian Trade Promotion Forum (ATPF) Countries 36 Table 2.2 Export and Import @ 2 digit 2013-2017 37-39
Table 2.3 Export value and share by countries 2013 -2017 40-45 Table 2.4 Import value and share by countries 2013-2017 46-51 Table 2.5 Top 200 items of exports to the world @4 digit 2013 -2017 52-57 Table 2.6 Top 100 items of exports to the world @8 digit 2013 -2017 58-60
Table 3.1 Import @2 digit 2013-2017 61-63 Table 3.2 Top 100 items of imports from the world @4 digit 2013 -2017 64-66 Table 3.3 Top 200 items of imports from the world @8 digit 2013 -2017 67-72

iv
Abbreviations
ANZCERTA - Australia New Zealand Closer Economic Relations Agreement
APEC - Asia Pacific Economic Cooperation
APTA - Asia Pacific Trade Agreement
ASEAN - Association of South-East Asian Nations
ATPF - Asian Trade Promotion Forum
BIMST – EC - Bay of Bengal Initiative for Multi-sectoral Technical and Economic Cooperation
CEFTA - Central European Free Trade Agreement
CIF - Cost, Insurance and Freight
CIS - Common Wealth of Independent States
COMESA - Common Market for Eastern and Southern Africa
COO - Certificate of Origin
CUSDEC - Customs Declaration
DOC - Department of Commerce
EFTA - European Free Trade Association
E. U. - European Union
FOB - Free On Board
FTAs - Free Trade Agreements
G. C. C. - Gulf Cooperation Council
GSP - Generalized System of Preference
GSTP - Generalized System of Trade Preferences
HS CODE - Harmonized System for Classification of Commodities
ITC - International Trade Centre
IOR-ARC - Indian Ocean Rim Association for Regional Cooperation
ISFTA - India - Sri Lanka Free Trade Agreement
MERCOSUR - Southern Common Market
NAFTA - North American Free Trade Agreement
OECD - Organization for Economic Cooperation and Development
OPEC - Organization for Petroleum Exporting Countries
PSFTA - Pakistan - Sri Lanka Free Trade Agreement
RTAs - Regional Trade Agreements
SAARC - South Asian Association for Regional Cooperation
SAFTA - South Asian Free Trade Area
SAPTA - SAARC Preferential Trade Agreement
SATIS - SAARC Agreement on Trade in Services
SLC - Sri Lanka Customs
UNCTAD - United Nations Conference on Trade and Development
WTO - World Trade Organization

v
20
10
20
11
20
12
20
13
20
14
20
15
20
16
20
17
Eco
no
mic I
nd
ica
to
rs
GN
I a
t C
urren
t M
arket P
rices, R
s. M
illon
6
,34
3,8
92
7,1
47
,06
58
,57
7,5
74
9,3
66
,03
91
0,1
25
,07
81
0,6
70
,35
81
1,5
06
,21
71
2,9
33
,18
5
GN
I a
t C
on
stan
t (
20
10
) P
rices, (R
s. M
illion
)6
,34
3,8
92
6,8
85
,23
27
,45
3,5
71
7,6
62
,00
48
,04
9,0
85
8,4
13
,89
78
,76
1,2
21
9,0
63
,44
8
GD
P a
t C
urren
t M
arket P
rices (
Rs. M
illion
)6
,41
3,6
68
7,2
19
,10
68
,73
2,4
63
9,5
92
,12
51
0,4
48
,47
91
1,1
83
,22
01
1,8
38
,97
51
3,2
89
,46
6
GD
P a
t C
on
stan
t (
20
10
) P
rices (
Rs. M
illion
)6
,41
3,6
68
6,9
52
,72
07
,58
8,5
17
7,8
46
,20
28
,22
8,9
86
8,6
22
,82
59
,01
2,0
26
9,3
15
,48
8
GD
P a
t C
on
stan
t (
20
10
) P
rices, (U
S$
)5
6,1
08
.51
62
,27
3.0
55
8,4
12
.01
59
,34
4.8
26
1,5
74
.21
61
,98
6.6
66
1,8
95
.10
61
,10
2.2
0
GD
P a
t C
urren
t M
arket P
rices, (U
S$
)5
6,7
25
.64
65
,29
2.7
56
8,4
34
.41
74
,29
4.2
68
0,0
24
.56
82
,26
7.1
88
1,3
10
.75
87
16
8.3
3
Sectoral C
om
position
of G
DP
at C
urren
t
Factor C
ost P
rices (
Rs.M
n.)
Ag
ricu
ltu
re
54
4,9
14
63
7,5
67
65
0,5
10
73
5,3
82
83
3,8
89
90
1,5
79
89
0,6
59
1,0
24
,11
7
In
du
stry
1,7
08
,86
72
,02
1,0
37
2,6
30
,76
62
,79
7,3
28
2,9
86
,19
93
1,0
90
,00
63
,20
8,4
76
3,6
14
,91
6
Serv
ices
3,5
04
,32
33
,98
0,5
00
4,8
58
,29
25
,40
6,5
44
5,9
24
,43
36
,29
5,8
53
6,7
43
,34
67
,41
2,0
33
Real G
DP
Grow
th
Rate, %
88
.26
.37
.34
.94
.84
.43
.1
In
flation
6.2
6.7
7.6
6.9
3.3
0.9
4.6
6.6
31
.21
So
cio
-E
co
no
mic I
nd
ica
to
rs
Mid
-Y
ear P
op
ulation
(0
00
’)
20
,67
52
0,8
69
20
,42
42
0,5
79
20
,77
12
0,9
66
21
,20
32
1,4
44
Un
em
ploy
men
t R
ate %
4.9
4.2
44
.44
.34
.3*
4
.2*
4
.0*
Labor F
orce %
48
.15
35
2.6
53
.85
3.6
53
.6*
54
.15
4.7
*
Tra
de I
nd
ica
to
rs
Total e
xp
orts (
US
$ M
n)
8,2
93
.71
10
,03
0.5
89
,18
0.5
91
0,0
09
.41
11
,04
4.3
81
0,2
11
.92
10
,21
7.2
81
14
11
.23
Ex
port v
alu
e a
s a
percen
tag
e o
f G
DP
(at
Con
stan
t (
20
10
) P
rices, (U
S$
. M
n.)
14
.78
16
.11
15
.72
16
.87
17
.94
16
.47
16
.51
18
.68
Ex
port G
row
th
Rate %
20
.94
-8
.47
9.0
31
0.3
4-8
.45
0.0
51
1.6
9
Total i
mp
orts (
US
$ M
n)
12
,34
0.3
41
9,7
03
.02
17
,88
8.6
41
7,9
49
.09
19
,24
5.7
11
8,9
89
.31
19
,51
4.7
82
1,3
23
.77
Cov
erag
e o
f i
mp
orts b
y e
xp
orts %
67
.21
50
.91
51
.32
55
.76
57
.39
53
.78
52
.36
9.2
7
Balan
ce o
f T
rad
e (
US
$ M
n)
-4
,04
6.6
1-9
,68
5.3
9-8
,70
8.1
1-7
,93
9.6
8-8
,20
1.3
3-8
,77
7.3
9-9
,29
7.5
0-9
,91
2.5
4
*F
or fo
urth
qu
arter *
*P
rov
ision
al
0.9
1.1
31
.14
An
nu
al g
row
th
rate o
f p
op
ulation
%1
10
.90
.80
.9
4,0
65
In
vestm
en
t a
s %
of G
DP
27
.62
9.9
30
.62
9.6
29
.73
53
6.5
14
5.6
01
61
52
.45
75
Per C
ap
ita G
DP
at m
arket p
rices (
US
$)
2,7
44
3,1
29
3,6
10
3,8
21
3,8
21
3,8
42
3,8
57
US
Dollar/R
s. R
ate
11
3.0
64
71
10
.56
52
12
7.6
03
41
30
.56
59
13
5.9
37
81
29
.10
99
Se
le
cte
d E
co
no
mic I
nd
ica
to
rs o
f S
ri L
an
ka

vi
Introduction
The Origin of the Department of Commerce
Department of Commerce (which was formally known as ‘Bureau of Commerce & Industry’) has its
origin which goes back to 1931. The Ceylon (State Council) Order in 1931 replaced the Ceylon
(Legislative Council) Order in 1923 as the new Constitution of Ceylon in 1931, which was introduced
under ‘Donoughmore Commission’. This became one of the prime instruments of constitutional reform
in ‘Ceylon’.
The Executive Committee on “Labour, Industry and Commerce” was one of the seven Committees
created under Section 32 of the new Constitution in 1931. This State Council of Labour, Industry and
Commerce was assigned the subjects of Commerce that include the functions of the Registrar General,
Industrial welfare and Labour. The ‘Bureau of Commerce & Industry’ that was under the State Counsil
of Labour, Industry and Commerce, , functioned as a key institution dealing with foreign trade policy
formulation of ‘Ceylon’.
In 1938 the Department of Commerce (and Industry) was created and the Ministry of Commerce and
Trade was established in 26th Septemebr 1947 with the inauguration of new Constitution having
Department of Commerce as a nodal Department of the that Ministry..
, the Department functions exclusively as the national focal point for the UNCTAD, GATT/ WTO,
UNESCAP, and other international organizations such as Common Fund for Commodities, ITC, WTO
Law Reference Centre.
Functions of the Department of commerce
A) MULTILATERAL AFFAIRS:
Promoting and safeguarding Sri Lanka’s foreign trade interests within the WTO-led
multilateral trading system. This includes several tasks, inter-alia (a) representing Sri Lanka at the Doha Round of Trade negotiations, (b) addressing any bottlenecks/obstacles, which hamper Sri Lankan exports in the international market due to restrictive trade policies introduced by other countries, (c) negotiation of special and differential treatment for Sri Lankan products and (d) facilitating measures for prevention of any unexpected injuries to domestic industries.
Securing trade-related technical assistance from international institutions such as International Trade Center (ITC), WTO, and UNCTAD for trade-related capacity building in Sri Lanka.
DoC is also the focal point in Sri Lanka for UNCTAD, which has a mandate to provide support to developing countries on policy and development issues and promoting South-South trade.

vii
B) REGIONAL AFFAIRS:
DoC is the focal point for negotiation and implementation of Sri Lanka’s regional trade
agreements (RTAs). The RTAs make a significant contribution in integrating Sri Lanka to different regional markets. At present, Sri Lanka is a member of the SAARC Preferential Trading Agreement (SAPTA), the South Asian Free Trade Area (SAFTA) and the Asia-Pacific Trade Agreement (APTA). Since Sri Lanka gains a much better market access to both India and Pakistan, the two largest markets in the SAARC region, under its FTAs with them, Sri Lankan exports under SAFTA/SAPTA have remained rather modest. A brief description about exports under SAFTA in 2017. China and South Korea are the main markets for Sri Lankan exports under APTA. Sri Lanka has exported a total of US$ 151 million worth of goods to APTA member countries in 2017, consisting of tea, coconut, activated carbon, apparel, rudder products, etc.
C) BILATERAL AFFAIRS
DoC is the focal point for Sri Lanka’s FTAs with India (ISFTA) and Pakistan (PSFTA). Sri
Lanka has been able to diversify its exports in an impressive manner under these FTAs, particularly under the ISFTA. Brief description on exports under ISFTA and PSFTA in 2017.
The EU is the largest export destination of Sri Lanka. Consequently, any changes to the EU trade policy can have a significant impact on Sri Lankan exports, both directly and indirectly. In the circumstances, the DoC has been playing an increasingly important role in monitoring the constant EU trade policy changes for the purpose of ensuring sustainable access for Sri Lankan products in the European market. EU trade preference arrangements (GSP, GSP+ EBA), Rules of Origin, Control Measures on fishery products and other commodities, EU’s FTAs with other countries are some of the examples in this context. Brief description on exports under EU, GSP/ GSP+ in 2017.
DoC also conducts Joint Commissions with Bangladesh, Belarus, China, Egypt, EU, Iran, Iraq, Jordan, Kuwait, Thailand and Turkey. These joint commissions provide an effective mechanism for enhancing inter-governmental cooperation, which is extremely beneficial for the development and expansion of Sri Lanka’s economic interest in the countries concerned.

viii
The Activities undertaken by Commercial Officers of the DoC 2017
Activity Total
1 Staged Sri Lanka specific (single-country) promotional campaigns in host
countries
102
2 Delegations to Sri Lanka Number of delegations 68
Number of delegates 466
3 Delegations to the host country Number of delegations 137
Number of delegates 1,438
4 Individual visits to Sri Lanka 210
5 Individual visits to the host country 207
6 Exhibitions promoted in the host country 92
7 Promotional fair participation from the host
in Sri Lanka
Number of fairs 47
Number of exhibitors /
visitors
499
8 Number of inquiries served (Trade/ investment/tourism) 1,918
9 Number of trade complaints attended 178
10 Number of product sector promoted 46
11 No of trade fairs visited by trade officers 54
12 Sri Lanka's participation in Trade Fairs and Business Network meetings at host country
77
13 Representing Sri Lanka at International Organizations/Fora 17
14 Promotion of Investment and Tourism 109
Table 2: COOs Issued by the Department of Commerce (2010-2017)
Agreement No. of Certificates of Origin Issued
2012 2013 2014 2015 2016 2017
EU GSP 114,029 79,454 83,898 72,675 74,003 80,867
GSP Other Countries 13,909 13,410 12,706 11,985 11,981 12,468
GSP-CIS Countries 1,009 929 842 480 514 -
ISFTA 9,742 11,088 10,852 11,494 12,621 12,864
PSFTA 8,057 8,190 7,069 7,320 6,673 6,703
APTA 2,781 3,482 4,131 4,025 4,508 6,038
SAFTA 26 74 388 231 149 679
SAPTA 253 243 309 304 288 277
GSTP 136 147 107 150 143 100
Total 149,942 117,017 120,302 108,664 110,830 120,277

ix
Overview of the International Trade in Sri Lanka – 2017
The total value of exports in 2017 was reported as US$ million 11,411.23 which was a 11.69 percent
increase compared to 2016 with US$ million 10,217.28 export value. The total value of exports has been
fluctuating during the last three years and recorded the highest value in 2017. The USA was the largest
buyer of Sri Lankan products in 2017, which had a share of 25.5 percent of total export value followed
by UK, India, Germany and Italy. The above five export destinations covered 50 percent of total value
of exports in 2017. Major export product to the world was Apparel (HS 61 and 62),which was the main
foreign exchange earner covering 41.5 percent of total export value followed by Tea (0902), Ships, boats
and floating structures (89), Fuel oil (27101960) and Cinnamon and cinnamon-tree flowers (0906) in
2017.
The total value of import was US$ million 21,323.77 in 2017 which was a 9.3 percent increase compared
to 2016 with US$ Mn 19,514.78 import value. The major supplier of Sri Lanka was India which covered
21 percent of total import value in 2017 followed by China, U.A.E, Singapore, Japan, and USA. Iron
and Steel (72 and 73), Knitted or crocheted fabrics (60), Plastics and articles thereof (39), Cotton (52)
and Gas oil/Diesel (27101940) were the major five products imported to Sri Lanka in 2017.
EU GSP67%
GSP Other Countries
10%
ISFTA11%
PSFTA6%
APTA5%
SAFTA1%
SAPTA0%
GSTP0%
Other1%
Figure 1: No. of Certificates Issued in 2017
0
20,000
40,000
60,000
80,000
100,000
120,000
140,000
160,000
2012 2013 2014 2015 2016 2017
Figure 2: No. of Certificates of Origin Issued in 2017
x
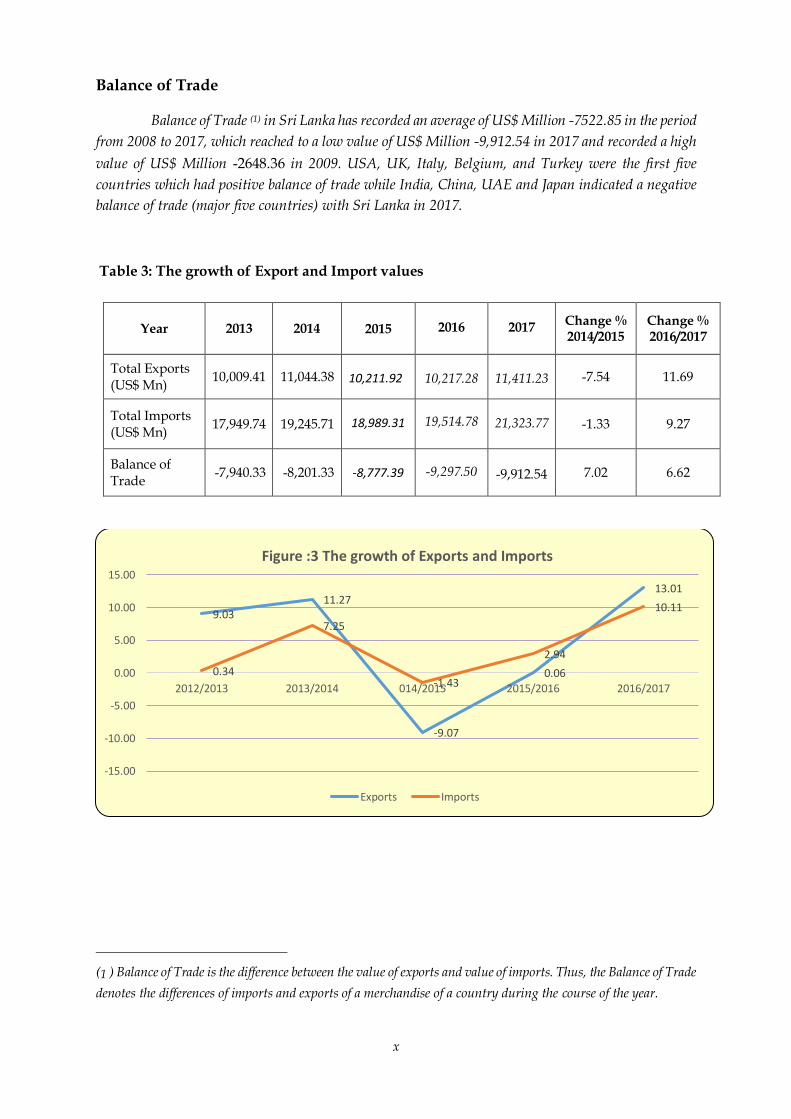
Balance of Trade
Balance of Trade (1) in Sri Lanka has recorded an average of US$ Million -7522.85 in the period
from 2008 to 2017, which reached to a low value of US$ Million -9,912.54 in 2017 and recorded a high
value of US$ Million -2648.36 in 2009. USA, UK, Italy, Belgium, and Turkey were the first five
countries which had positive balance of trade while India, China, UAE and Japan indicated a negative
balance of trade (major five countries) with Sri Lanka in 2017.
Table 3: The growth of Export and Import values
Year 2013 2014
2015
2016
2017 Change % 2014/2015
Change % 2016/2017
Total Exports (US$ Mn)
10,009.41 11,044.38
10,211.92
10,217.28
11,411.23 -7.54 11.69
Total Imports (US$ Mn)
17,949.74 19,245.71
18,989.31
19,514.78
21,323.77 -1.33 9.27
Balance of Trade
-7,940.33 -8,201.33
-8,777.39
-9,297.50
-9,912.54 7.02 6.62
(1 ) Balance of Trade is the difference between the value of exports and value of imports. Thus, the Balance of Trade
denotes the differences of imports and exports of a merchandise of a country during the course of the year.
9.0311.27
-9.07
0.06
13.01
0.34
7.25
-1.43
2.94
10.11
-15.00
-10.00
-5.00
0.00
5.00
10.00
15.00
2012/2013 2013/2014 014/2015 2015/2016 2016/2017
Figure :3 The growth of Exports and Imports
Exports Imports

xi
Changes of Dollar Rate in Sri Lanka
Basic understanding of the dynamic behavior of exchange rates, specially Dollar rate is extremely
important to various parties relating to international trade such as policy makers, investors, traders
etc. Dollar rate of Sri Lanka has been fluctuating during the last ten years. The highest rate was recorded
in 2012 while the lowest was recorded in 2008. Table - 4 indicates the Dollar rates during the last ten
years and the percentage of change. Figure - 5 clearly shows the fluctuations of Dollar rate over the
years. In 2012 there was a drastic change where the Dollar rate increased by 15.41%. The Dollar rate
has decreased in 2008, 2010 and 2011.
Table 4: Changes of Dollar Rate
Year 2008 2009 2010 2011 2012 2013 2014
2015
2016
2017
USD 108.333 114.944 113.064 110.565 127.603 129.109 130.565
135.938
145.601
152.457
Change -4.42 6.1 -1.64 -2.21 15.41 1.18 1.13
5.37
9.66
6.86
Source: Central Bank of Sri Lanka
(12,000.00)
(10,000.00)
(8,000.00)
(6,000.00)
(4,000.00)
(2,000.00)
-
2008 2009 2010 2011 2012 2013 2014 2015 2016 2017
Figure 4 : Balance of Trade Sri Lanka
-10
-5
0
5
10
15
20
2008 2009 2010 2011 2012 2013 2014 2015 2016 2017
Figure 5 : Changes in Dollar rates

xii
Direction of International Trade of Sri Lanka
USA and UK remained the largest export destinations for Sri Lanka while India and China were the
foremost import originations of Sri Lanka during the last five years (see figure 6 and 7). While USA
and UK covered 25.5 and 9.07 percent of total exports repectively in 2017, while China and India
covered 21.1 and 19.7 percent of total imports of Sri Lanka repectively in 2017. India, Germany, Italy,
China, Belgium and UAE were the influential buyers of Sri Lanka while UAE, Singapore, Japan,
Malaysia and USA were the dominant suppliers to Sri Lanka in 2017.
Table 5 : Major Destinations of Exports (US$ Mn)
Country 2013 2014 2015 2016
2017
U.S.A. 2,496.78 2,720.19 2,800.27 2,807.76 2,911.81
U.K. 1,077.18 1,115.30 1,028.31 1,043.53 1,035.14
INDIA 543.37 624.81 643.03 551.21 689.48
GERMENY 467.82 496.69 473.95 505.60 538.70
ITALY 510.46 613.95 434.07 428.16 529.86
CHINA 121.63 173.48 293.05 199.15 415.14
BELGIUM 463.37 318.43 282.28 337.93 346.73
U.A.E. 236.58 276.07 273.55 274.87 274.16
TURKEY 191.51 259.66 180.27 154.40 232.92
NETHERLANDS (HOLAND) 190.84 242.69 220.03 207.79 220.48
0.00
500.00
1000.00
1500.00
2000.00
2500.00
3000.00
3500.00
2013 2014 2015 2016 2017
Figure 6: Major Destination of Exports

xiii
Table 6 : Major Originations of Imports (US$ Mn)
Country 2013 2014 2015 2016
2017
CHINA 2,962.60 3,414.40 3,731.64 4,273.58
4,191.22
INDIA 3,128.86 3,977.76 4,273.30 3,827.50
4,495.99
U.A.E. 1,225.58 1,755.98 1,074.30 1,067.98
1,564.56
SINGAPORE 1,800.14 1,270.09 923.85 1,031.00
1,292.63
JAPAN 670.21 941.11 1,389.24 950.46
1,038.52
MALAYSIA 570.09 715.8 511.94 642.46
641.37
U.S.A. 352.56 492.54 470.79 539.59
810.49
THAILAND 428.44 462.04 497.75 514.80
518.54
TAIWAN 455.03 443.32 459.77 496.26
481.05
U.K. 281.34 290.7 482.79 446.02
267.91
Table 7: Sri Lanka’s Preferential Exports under APTA (Value in US$ Mn)
Year India Bangladesh China South Korea Total exports
2007 13.1 0.5 9.0 4.4 27.0 2008 10.4 0.7 19.0 5.2 35.3
2009 13.1 1.3 28.9 6.1 49.4
2010 21.6 0.2 41.4 6.5 69.7
2011 7.9 0.2 44.8 16.9 69.8
2012 8.0 0.2 36.2 17.3 61.7
2013 4.9 0.3 53.1 16.8 75.1
2014 3.1 4.5 86.0 26.0 119.6 2015 1.5 0.1 89.2 28.0 118.7 2016 1.6
0.4
91.9
31.7
125.6 2017 2.6
0.2
117.5
30.5
150.8

xiv
Table 8: Sri Lanka’s Preferential Exports under PSFTA (Value in US$ Mn)
Year Total Exports (US$ Mn.) Under PSFTA (US$ Mn.) Percentage %
2012 82.75 60.41 73.00
2013 83.05 59.20 71.28
2014 74.25 51.78 69.74
2015 73.10 58.84 80.49
2016 63.80
51.52
80.75 2017 74.01 60.33 81.52
Table 9: India – Sri Lanka Free Trade Agreement (ISFTA)
Exports (US$ Mn) Imports (US$ Mn)
Year Total
Exports to India
under the ISFTA
Percentage under the
ISFTA
Total Imports from
India
under the ISFTA
Percentage under the
ISFTA
2001 70.12 15.90 23 601.00 113.10 19
2002 168.81 114.20 68 834.00 81.70 10
2003 241.14 238.80 99 1,076.00 150.40 14
2004 385.49 339.90 88 1,342.00 394.70 29
2005 559.21 543.00 97 1,399.43 246.20 18
2006 494.06 431.10 87 1,822.07 459.30 25
2007 516.40 398.20 77 2,785.04 385.30 14
2008 418.08 309.30 74 3,006.93 541.40 18
2009 324.87 218.50 67 1,709.93 371.70 22
2010 466.60 358.40 77 2,546.23 573.70 23
2011 521.59 391.50 75 4.349.43 579.60 13
2012 566.37 379.50 67 3,517.23 156.40 4
2013 543.37 368.77 65 3,092.67 393.40 13
2014 624.81 375.80 60 3,977.76 540.10 14
2015 643.03 407.20 63 4,273.30 253.30 6
2016 551.21
375.16
68 3,827.50
186.73
5
2017 689.48 442.29 64
4,495.99 257.04 6
Table 10: Sri Lanka’s Preferential Trade under SAFTA (Value in US$ ‘000)
Year Bangladesh Bhutan India Maldives Nepal Pakistan Total
2007 NE NE 19.83 NE NE NE 19.83
2008 NE NE 31.49 NE NE 9.30 40.79
2009 NE NE 29.20 NE NE 579.42 608.62
2010 NE NE 425.04 NE NE 92.53 517.57
2011 NE NE 34.68 NE NE 67.71 102.39
2012 76.01 NE 28.81 69.55 29.04 26.00 229.41
2013 NE NE 1,057.46 616.37 64.49 NE 1,738.32
2014 80.05 NE 10,986.11 250.53 19.90 1,254.82 12,591.41
2015 6.41 9.67 14,640.87 85.62 NE 655.49 15,398.06
2016 2,194.18 0.00 4,170.01 4.95 395.46 129.19 6,893.79
2017
5,978.67
NE 34,652.20
25.28
286.79
133.04
41,075.98
41,075.98
*No exports to Afghanistan under SAFTA
N.B. NE- No Exports