Embed Size (px)
Citation preview


InternationalJournalofScience,EngineeringandTechnology
ISSN(Online):2348‐4098
ISSN(Print):2395‐4752
PrintVersion
Volume3Issue3:2015
Volume3Issue4:2015
PublishedBy:
IJSETJOURNALPUBLICATION
Website:www.ijset.in | Email:[email protected]

COPYRIGHT
Copyright©2015IJSETJournalPublication
All the respective authors are sole owner and responsible of published research and researchpapersarepublishedafterfullconsentofrespectiveauthororCo‐author(s).
ForanydiscussiononResearchsubjectormatter,thereadershoulddirectlycontacttorespectiveauthors.
AllRightsReserved.Nopartofthispublicationmaybereproduced,storedinaretrievalsystem,ortransmitted, in any form or by any means, electronic, mechanical, photocopying, recording,scanning or otherwise, except as described below, without the permission in writing of thePublisher.
Copyingofarticlesisnotpermittedexceptforpersonalandinternaluse,totheextentpermittedbynationalCopyright laworunder the termsofa license issuedby aNationalReproductionRightsOrganization.
Allthepublishedresearchcanbereferencedbyreaders,scholarsandresearchersintheirfurtherresearchwithproperCitationgiventoOriginalAuthor(s).
DISCLAIMER
Statementsandopinionsexpressedinthepublishedpapersarethoseoftheindividualcontributorsand not the statements and opinion of IJSET. We assumes no responsibility or liability for anydamage or injury to persons or property arising out of the use of any materials, instructions,methods or ideas contained herein. We expressly disclaim any implied warranties ofmerchantabilityorfitnessforaparticularpurpose.Ifexpertassistanceisrequired,theservicesofacompetentprofessionalpersonshouldbesought.
CONTACTINFORMATION
Dr.KavitaSharma
Editor‐in‐Chief
E‐mail:[email protected]
Website:http://www.ijset.in
EDITORIALBOARD
Editor‐in‐Chief
Dr.KavitaSharma
DeputyEditor‐inChief
Dr.RGuruprasad
Affiliation‐ Scientist, Knowledge and TechnologyManagement Division, CSIR‐National AerospaceLaboratories,Bangalore
Dr.SubhaGanguly
Affiliation‐ BVSc & AH (Gold Medal), MVSc (1‐Rank), PhD (Microbiol.), EMBA (HRM), DSc(Hons.Causa)
Scientist (Food Microbiology) & Scientist In‐charge, Sub‐Projects, AICRP On Post HarvestTechnology (ICAR),DepartmentofFishProcessingTechnology,FacultyofFisherySciences,WestBengalUniversityofAnimalandFisherySciences,5,BudherhatRoad,P.O.Panchasayar,Kolkata–700094,WB,India
EditorialBoardMembers
Dr.Mohd.Hamraj
Professor, Civil Engineering, MJ College ofEngineering and Technology, Telangana,India
Dr.MdEnamulHoque
AssociateProfessor,UniversityofNottinghamMalaysiaCampus
Dr.S.KishoreReddy
Professor, Adama Science & TechnologyUniversity,Adama,Ethiopia
Dr.DeborahOlorode
UniversityofLagos,Nigeria
Prof.(Dr.)ShamamaAhmed
Director,SchoolofEngineering&Technology,NoidaInternationalUniversity
ChandreshKumarChhatlani
Director (Dept. of Computer Sc & IT), JRNRajasthanVidyapeethUniversity,Udaipur
MohammedIrfaan
Assistant Professor, Adigrat University,Ethiopia
HariKumarSingh
Associate Professor, Department ofMechanical Engineering, Suresh Gyan ViharUniversity,Jaipur,India
S.K.Nagaraju
Assistant Professor in Department ofConstructionofTechnologyandManagement,AdigratUniversity(ADU),Ethiopia
SaurabhShukla
Scientist, Defence Research & DevelopmentOrganisation(DRDO)

TABLEOFCONTENTS
S.No. ManuscriptTitleandAuthor(s) PageNo. 1. Community Analysis of Collembola In A Natural Forest and Jhumland
EcosystemofMokokchung,NagalandKruolalieTsurho,BendangAo,VetseloDuolo
1‐ 6
2. ChaetomorphaLinumExtractAsAGreenInhibitorForCorrosionOfBrassIn0.1NPhosphoricAcidSolutionSelvaKumarR.,ChandrasekaranV
7‐ 16
3. Multi‐WalledCarbonNanotube(Mwcnt)BasedCompositeMaterial:AReviewAbdulRahman Sanad,M.N.M.Ansari, JamalO.Sameer,AbdulbasitAbdullah,BassamAlaseel
17‐ 26
4. AMethodologyOfOptimalSizingForWindSolarHybridSystemAvinashNathTiwari,NavnitDubey
27‐ 31
5. Fishing Trails With Modified Two–Seam Overhang Trawl‐ IntraspecificSelectivityStudiesN.A.Talwar,B.Hanumanthappa,M.T.Laxmipathi
32‐38
6. ExperimentalStudyOfLocalScourAroundCircularCompound BridgePier
Prof.P.T.Nimbalkar,S.S.Thorat
39‐ 42
7. DesignAndDevelopmentOfVerificationEnvironmentToVerify SpiMasterCoreUsingUvmRajeshC,Shivananda,Mrs.ShanthiVA
43‐45
8. Estimation Of Domestic, Crop Water Requirements And Estimation OfGroundwater,SurfaceWaterResourcesOfReniaCity‐IraqAhmedTalibAbduljaleelAl‐Alikhan,Prof.P.T.Nimbalkar
46‐ 48
9. EffectOf Filler ConcentrationOn PropertiesOfGraphite CompositeBipolarPlateMohammedA.M.,El‐NafatyU.A.,BugajeI.,M.MuktharB.
49‐ 61
10. SeismicPerformanceEvaluationOfRcBuildingsWithVertical IrregularitiesSubjectedToBiaxialExcitationDr.Mohd.Hamraj,MohammedMoizKhan
62‐ 69

11. StudyOf The IodinationOf Indole‐3‐Butyric Acid By Aqueous Iodine UsingHydrodynamicVoltammetryRajendraP.Yadav,BharatB.Bahule,VitthalT.Borkar,VijayT.Dangat, KanchanG.Shinde
70‐73
12. De‐EmbeddingOfTestFixture:ANecessaryStepInPostSilicon ValidationForAccurateCharacterizationOfHighSpeedDevicesSurendraKumarDadore,LalitaGupta,SiyaramSahu
74‐ 77
13. ImplementationOfDoubly‐FedWindTurbineAlongWithPid ControllerToMaintainTheDesiredOutputLevelsAndControlThePitchAccordingToWindDirection AjayShukla,AnilGupta
78‐ 83
14. Diversity,PrevalenceAndRoleOfSuperoxideDismutaseIn CyanobacteriaKanuPriya,NamitaSingh,InderjeetSingh
84‐ 91
15. Synthesis, Characterization And Antimicrobial Efficacy Of Cyanobacterial(Polymer)SilverNanoParticleConjugatesRitikaChanan,MinakshiLalit,Naveen,NamitaSingh
92‐ 99

COMMUNITYANALYSISOFCOLLEMBOLAINANATURALFORESTANDJHUMLANDECOSYSTEMOFMOKOKCHUNG,NAGALAND
1KRUOLALIETSURHO,2BENDANGAO,3VETSELODUOLO
1AssistantProfessor,DepartmentofZoology,FazlAliCollege,Mokokchung,Nagaland.India,Email:[email protected]
2AssistantProfessor,DepartmentofZoology,NagalandUniversity,Lumami,Zunheboto,Nagaland,India,Email:[email protected]
3AssistantProfessor,DepartmentofZoology,KohimaScienceCollege,Jotsoma,Kohima.Nagaland,India.
ABSTRACT
ThepresentstudywascarriedoutintwoadjacentareasofanaturalforestandjhumlandecosystemsinMopungchuketvillageandChuchuyimpangvillagerespectively,underMokokchungdistrict,Nagaland,whichliesat26o11'36''Northlatitudeandinbetween94o17'44'' to94o45'42’’ (E) longitude.The studywas conductedduring January2009 toDecember2011.TheverticaldistributionandabundanceoftotalCollembolawerefoundtobemoreinanaturalforestecosystem(324.69x10²m‐
2)thanjhumlandecosystem(222.42x102m‐2)andshowedasignificantdecreasefromupperlayertodeeperlayersfrom0cmto30cmdepth.Inanaturalforestecosystem,theCollembolarecordedhigherpopulationduringrainyseason(143.29x10²m‐2),followedbysummer(108.06x10²m‐2)andwinterseason(73.34x10²m‐2)thanjhumlandecosystemrespectively.Thephysico‐chemicalfactors,exceptsoilpotassiumexhibitedsignificantcorrelation.ThecommunityanalysiswascarriedoutforCollembolabeingoneofthemajorgroupsofsoilmicroarthropodsastheircontributionsaremaximumintermofspecies,abundanceanddistribution.
Keywords:Communityanalysis,Collembola,microarthropods,naturalforestandjhumland.
1. INTRODUCTION
Collembolansarewinglessinsectsorapterygotes,whichcan be placed under three sub‐groups viz.Entomorbryomorpha,Poduromorpha andSymphypleona.Theyarelargelydetritusorfungalfeeders‐mostofthemfeeding on decaying vegetation, bacteria, fungi, algae,pollenandotherformsoforganicmaterialandhavewelldeveloped mouthparts capable of fragmenting plantmaterial (Seastedt, 1984). Thesemicroarthropodsplayan important role in nurturing or maintaining thesustainabilityofanecosystemthroughdecompositionoforganic matter (Christensen & Bellinger, 1980) andmineralization of leaf litter thus enriching the soilfertility. They also maintain soil physical structure,nutrient cycling, energy flow and enhance primaryproductivity (Badejo and Staalen, 1993; Hofer et al.,2001; Yang and Chen, 2009). Thus Hagvar (1984)considers them good indicators of soil qualityparticularly because of their relationship withminerals/chemicalslikeNa,KandNofsoil.
In India, studies on different aspects of soilmicroarthropods have been conducted by Harza andChoudhuri (1983),HattarandAlfred (1986)andAlfredet.al.(1991)etc.InNorthEasternIndia,someprominentworks have been conducted by Vatauliya & Alfred(1980),Darlong&Alfred (1982), Paul&Alfred (1986),Sarkar (1991), Singh et. al. (1998), Chitrapati et. al.(2002) etc. In case of Nagaland, works onmicroarthopods are scarce, except for some works by
Alemla (1987), Duolo andKakati (2009), Kruolalie andBendang(2014)etc.
InNagaland,jhumcultivationaccountsforabout73%ofthenet croppedarea,whilewet terrace rice cultivation(WTRC) accounts for about 27%. Jhum cultivationessentially entails the process of “slash and burn” andthis would naturally disturb the ecological balancebecauseofdestructionoffloraandfauna.Therefore,itisimportanttounderstandtheeffectsofdeforestationandthe practice of jhumming on soil microarthropodpopulations. In thisconnection, it isworthwhile tonotethat Duolo and Kakati (2009) recorded a higherpopulation of microarthropods in natural forest ascomparedtoadegradedforest.
The present studywas taken up to study the effects ofdeforestation,theeffectsofclimaticandedaphicfactorsonCollembolanabundance,distributionanddiversityina natural forest and jhum land ecosystem inMokokchungdistrictofNagaland.
2. MATERIALSANDMETHODS
2.1STUDYSITES
Thepresentstudywascarriedoutintwoadjacentareasof natural forest and jhum land ecosystems inMopongchuketvillageandChuchuyimpangvillageunderMokokchung district, Nagalandwhich lies at 26°11'36’’North latitude and in between 94°17'44’’ to 94°45’42’’(E) longitude. The forest site comprised of rich
Volume 3 Issue 3: 2015 Volume 3 Issue 4: 2015
www.ijset.in ISSN (O): 2348-4098 ISSN (P): 2395-4752
International Journal of Science, Engineering and Technology Page 1

vegetationwhichhadnotbeendisturbedformorethantwenty years while the jhum land had almost novegetation due to frequent human activities andinterference.
The natural forest comprised of rich vegetationwith adistinct vertical stratification. The canopy layer has anaverage height of 20 metres or more, comprising ofAlbizia procera, Schima wallichii, Alnus nepalensis,Castinopsis indica, Lithocarpus elegans, Michelliachampaca and Persia villosa. Emergent trees thatovershoot the canopy layers were not present. ThesmallertreesmostlybelongtothefamiliesofLauraceae,Euphobiaceae, Araliaceae, Ficaseae and Rubiaceae. Theaverageheightof thesemembers is foundtobe5to15mts.Thegroundfloraisrichandepiphytes,climbersandlianas were also found to be growing abundantly. Thejhumland,ontheotherhandwasnotaswellstratifiedasthe natural forest. The tree species present are thespeciesthatwereleftuncutwhileclearingtheforest,andthe stumps that survived the jhum cultivation.Quercusserrata, Erythrina striata, Albizia procera, Schimawalichiiwerethedominantspeciespresent inthe jhumareas.
2.2CLIMATE
Theclimateof thearea ismonsoonal,withwarmmoistsummersandcooldrywinters.Themeteorologicaldatabasedonthreeyears(2009‐2011)asshownintabularaswell as graphical forms (tables 1‐3 and figures 1‐3)revealsthatJunetoOctoberconstituteswetmonthsandNovembertoMaythedrymonths.Thedryperiodcanbefurther divided into summer (March to May) and cooldry season (November to February). Thus there isdistinctsummer(MarchtoMay),rainy(JunetoOctober)and winter (November to February) seasons. Marchconstitutes the transitionalmonth betweenwinter andsummer whereas October is the transitional monthbetweenrainyandwinterseason.
Themaximumandminimumairtemperaturewas21.4°C(August) and 6.3°C (January) respectively in 2010(Average:Max=21.4 °C Min=8.1 °C).Themaximumand minimum relative humidity was 85% (August) in2009 and 35.55 (December) in 2011 respectively(Average:Max = 83.3% Min = 54.5%). Themaximumandminimumtotalrainfallwas972.5cms(July)in2011and the minimum was 3.7 cms (March) in 2009(Average:Max=572.5cmMin=11.3cm,totalaveragerainfall=1859.93cms).
2.3SAMPLINGANDEXTRACTION
In both the forest and jhumland ecosystems, thesampling collection sites were divided according toelevationbecauseoftheterrainviz.upperelevationsite,middle elevation site and lower elevation site. In eachelevationsite,threedifferentplotshavingasizeof10mx10meachspaced25‐30metersapartwereselectedfromwhere soil samples were collected. Soil samples weretakenatonemonthintervalsinthemiddleweekofeachmonth between 10:00 and 11:00 AM. The soil sampleswerecollectedwiththehelpofironcylindricalcorewithsamplersizeof3.925cm,whichare10cmindepthand
5cm in diameter. Three replicates were collected fromeach area or collection site.The samples wereimmediately bound in polytene bags, labelled andbroughttothelaboratoryforanalysiswithinanaverageofonehourafterthefieldcollection.Ineachstudysiteatotal of 1944 soil samples were collected during thewholestudyperiod.
Thesampleswerethendividedintosectionsandplacedin aTullgren funnel as describedbyCrossley andBlair(1991). The soil microarthropods were extracted intocollectingvialscontaining70%alcohol.Afterextraction,the vials and the contents were transferred into apetridish ‐ the vials being washed several times with70% alcohol. The extracted soil microarthropods werepreserved in 70% alcohol to which few drops ofglycerine were added to prevent desiccation.Identificationandcountingwasdoneunderabinocularmicroscope,anddensitycalculated.
2.4SOILANALYSIS
Physico‐chemical factors of the soil like temperature,moisture, pH, organic carbon, total nitrogen, availablephosphorus, and potassiumwere analyzed during eachsampling period in order to study the impact of thesefactors in the population changes of soilmicroarthropods. The methodologies utilized for eachareasfollows:Soiltemperature(soilthermometer),Soilmoisture content (gravimetric method according toMisra, 1968 andWilde et al., 1985), Soil pH (portableglass electrode pHmeter (according to Jackson, 1958),Soil organic carbon (oxidation calorimetricmethod i.e.,modified Walkey and Black method according toAnderson and Ingram, 1993), Soil total nitrogen (aciddigestion Kjeldahl procedures according to Andersonand Ingram,1993),Phosphorus (ammoniummolybdatestannous chloride method according to Sparling et al.,1985), Potassium (flame photometer according toSteward,1971).
2.5COMMUNITYANALYSIS
Incommunityanalysis,speciesdiversityandcommunitysimilarity were analyzed for Collembola using thefollowingformulae:
(i) Species diversity (number of species) or speciesrichnesswascalculatedafterMargalef(1968).
Da=( S ‐ 1)/l o gN
Where,
Da =MargalefsIndex
S =No.ofSpecies
N =TotalNo.ofIndividuals.
(ii) Measure of species diversity based on informationtheory or related to the concept of uncertainty wascalculatedafterShannonandWiener(1949),
Where,
Volume 3 Issue 3: 2015 Volume 3 Issue 4: 2015
www.ijset.in ISSN (O): 2348-4098 ISSN (P): 2395-4752
International Journal of Science, Engineering and Technology Page 2
s
H’=‐∑Pilogpi
i=1
H’=MeasureofShannon‐WienerDiversity
S=TotalNo.ofSpeciesinasample
Pi = Proportion of the total number of individualsoccurringinspeciesi.
(iii)ThemaximumpossiblediversityofH'orHmax'wascalculatedusingthefollowingformula:
Hmax’=Log2S
Where,S=Numberofspeciesorcategory
3.RESULTANDDISCUSSION
Community analysis of Collembola populations in bothforest and jhumland ecosystems showed maximumabundance, and species diversity in rainy season andslowly decreased in summer and winter seasons.Seasonaldifferencesintheabundanceofsoilarthropodshavebeendemonstratedbyvariousworkers(Salt,1952;Davis, 1963; Block, 1966; Nijima, 1971; Usher, 1975).Theseworkers reported thatmicroarthropods undergoenormous fluctuations in numbers, these beingsusceptible to small changes factor influencingpopulationsize.Wallwork(1970),Fujikawa(1970)andAnderson (1988) suggest that the temporal pattern isrelatedtotransitionfromoneseasontoanotherwhichismostlyduetoshiftinsoilmoistureandtemperature.
TheDataanalysisofCollembola(Tableno.1&2)usingMargalefs index (Da) and Shannon‐Wiener diversityindex (H') showmorediversity in forest than the jhumlandecosystem. In forestecosystem,maximumvalueofdiversity (Da = 8.246, H' = 3.775) was shown duringsummer season and minimum during winter season.While in jhumland ecosystem, maximum value ofdiversity (Da =7.433, H’ = 3.875) were recorded insummerseason.Hmax'ofCollembola(Tableno.1&2)wasfoundtobehigherinforestecosystemascomparedwith jhumland ecosystem. In forest ecosystem, Hmax'valuewashighest inrainyseason(4.000)andlowest inwinter seasons (2.587) respectively.While in jhumlandecosystem,Hmax'valuewashighest insummer season(3.751) and lowest in winter (2.773) respectively. Thehigherdiversityindicesinboththestudysiteshavebeenrecordedhigherduringsummerandrainyseason inalldepths i.e., at 0‐10 cm, 10‐20cm and 20‐30cm. Whilelesser diversity indices have been recorded duringwinterseasoninallthesoillayersofthetwostudysites.TheHmax'i,ethemaximumdiversitywasalsorecordedwith higher value in summer and rainy season thanwinterseasoninalllayers.
A totalof fifteen (15)Collembola specieswere identifiedfrom the two study sites (Tableno.3&4).The resultfrom the two study sites showed variation in itscommunitystructure.Overallthenumberofindividuals,species and the value of diversity were found to be
higherandmoreconsistentintheforestecosystemthanthatof jhumlandecosystem. Itwasalsoseen that someofthespeciesofCollembolathatwerefoundinanaturalforestecosystemweretotallyabsentinjhumlandwhichbrings about a decrease or disappearance of the leastabundant species, while the most abundant speciespersist(Gurreaetal.,2000).
In the natural forest ecosystem, the concentration ofCollembola was higher which is due to canopy andvegetative cover, accumulation of litter and optimumphysico‐chemical factors favouring thesemicroarthropods, but in the jhumland ecosystemshowednegative impactdue to disturbance in the typeof vegetative cover, lack of canopy, physico‐chemicalproperties of soil and depth of litter etc. (Price, 1973;Seastedt, 1984; Badejo and Staalen, 1993; Wardle andGiller,1996).
REFERENCES
1. Anderson, J.M., 1988. Spatiotemporal effects ofinvertebratesonsoilprocesses.Biol.Fertil.Soils.6,216‐227.
2. Anderson,J.H.andIngram,J.S.(1993).Tropicalsoil biology and fertility. A handbook of method. UK.C.A.B.Int.
3. Alfred, J. R. B., Darlong V.T., Hattar, S. J. S andPaul,D.(1991).Microarthropodsandtheirconservationin some North East Indian soil, In “Advances inmanagement and conservation of soil fauna” (Eds, G.K.Vecresh, D. Rajagopal and C.A. virak Tamath) Bangalore.
4. Ao, M, Alemla. (1987). Ecological investigationon the soil arthropods communities with particularreference to insects of two 'Jhum' agro‐ecosystems ofNagaland,North‐ Eastern India. Ph. D. thesis,NorthEasternHillUniversity,Shillong.
5. Badejo, M. A. and Van Straalen, N. M. (1993).Seasonal abundance of Springtails in two contrastingEnvironments.Biotropica.25:222‐228.
6. Bhandari, S. C. and Somani, L. L. (1994). In“Ecology and Biology of soil organisms”, AgrotechpublishingAcademy,Udaipur.
7. Block, W. C. (1966). Seasonal fluctuations anddistributionofmitepopulationsinmoorlandsoilwithanoteonbiomass.J.Anim.Ecol.35:487‐503.
8. Crossley, D. A., Blair, J. M. (1991). A high‐efficiency, low‐technology Tullgren‐type extractor forsoil microarthropods. Agric. Ecosyst. Environ. 34, 187–192.
9. Davis,B.N.K.(1963).Astudyofmicroarthropodcommunities in mineral soils near Corby Northants. J.AnimalEcol.32:49‐71.
10. Fujikawa,T.(1970).DistributionofsoilanimalsinthreeforestsofNorthernHokkaidoI I Horizontal
Volume 3 Issue 3: 2015 Volume 3 Issue 4: 2015
www.ijset.in ISSN (O): 2348-4098 ISSN (P): 2395-4752
International Journal of Science, Engineering and Technology Page 3

and vertical distribution of Oribatid mites (Acarina:Cryptostigmata).App.Ent.Zool.5(40):208‐212.
11. Gurrea,P.,Ferrin, J.M.,Martin, J.,Perez,F.,Ruiz,M.andSimon,J.C.(2000).Lossof biodiversitydue to reforestation in central Spain (LepidopteraPapilionoidea; Coleoptera Curculionidae; Collembola).BelgianJournalofEntomology.2:149‐170.
12. Hofer H, Hanagarth W, Garcia M, Martius C,Franklin,RombkeJandBeckL(2001).Structureandfunction of soil fauna communities in Amazoniananthropogenic and natural ecosystems. EuropeanjournalofsoilBiology37.229–235.
13. Jackson, M. L. (1958). Soil chemical analysis.PrenticeHallInc,NewJersey,USA.
14. Kruolalie Tsurho and Bendang Ao (2014).Vertical distribution and abundance of Collembola in anaturalforestandjhumlandecosystemofMokokchung,Nagaland.IJSET2(6):1‐17.
15. Margalef, R. (1968). Perspectives in ecologicaltheory.UniversityofChicagoPress,Chicago.
16. Misra,R.(1968).Ecologyworkbook.OxfordandIBHPub.Co.Calcutta,India.
17. Nijima, K. (1971). Seasonal changes inCollembolanpopulationinawarmtemperate forestofJapan.Pedobiologia.1 1 : 1 1 ‐26.
18. Price, D. W. (1973). Abundance and verticaldistributionofmicroarthropodsinthesurface layersofaCaliforniapineforestsoil.Hilgardia.42:121‐174.
19. Seastedt, T. R. (1984). The role ofmicroarthropods in decomposition andmineralization processes. Ann. Rev. Entom. 29: 25‐46.
20. Shannon, C. E. and Wiener, W. (1949). Themathematicaltheoryofcommunication.UrbanaIII;Univ.IllionisPress.pp.117.
21. Sorensen, T. (1948). A method of establishinggroupofequalamplitudeinplantsociologybasedonthesimilarity of species content and its application toanalysisof thevegetationDanishcommons.Biol.Skr.5:1‐34.
22. Sparling, G. P. and Shale, K. N. (1985).Quantifying the contribution from the soil microbialbiomass to the extractable levels of fresh and air driedsoils.Aust.J.ofsoilRes.23:613‐621.
23. Steward, E. A. (1971). Chemical analysis ofecological materials. Blackwell Scientific Publication,Oxford.
24. Usher, M. B. (1975). Some properties of theaggregations of soil arthropods, Cryptostigmata.Pedobiologia.15:355‐363.
25. Wardle,D.A.&Giller,K.E.(1996).Thequestforacontemporaryecologicaldimensionto soil biology.Discussion.SoilBiologyandBiochemistry.28:1549‐1554.
26. Wilde,S.A.,Corey,R.B., Iyer, J.G.andViogt,G.K.(1985).Soilandplantanalysisfortreeculture.OxfordandIBHPub.Co.
27. Yang X and Chen J (2009). Plant litter qualityinfluences the contribution of soil fauna to litterdecomposition in humid tropical forests, southwesternChina.SoilBiologyandChemistry41:910‐918.
Volume 3 Issue 3: 2015 Volume 3 Issue 4: 2015
www.ijset.in ISSN (O): 2348-4098 ISSN (P): 2395-4752
International Journal of Science, Engineering and Technology Page 4

Table1:SpeciesdiversityofthetotalindentifiedCollembolaindifferentsoildepthinforestecosystem.
Area Soillayers
Season Dataanalysis
Margalef’s Index(Da)
Diversity(H’) Hmax'
Forestecosystem
0‐10cm Summer 8.246 3.775 3.344
0‐10cm Rainy 7.552 3.221 3.558
0‐10cm Winter 6.533 2.885 2.735
10‐20cm Summer 7.991 3.595 3.441
10‐20cm Rainy 7.323 3.353 3.237
10‐20cm Winter 5.626 2.336 2.587
20‐30cm Summer 6.557 3.325 3.444
20‐30cm Rainy 7.224 3.651 4.000
20‐30cm Winter 4.616 3.215 3.101
Table2:SpeciesdiversityofthetotalidentifiedCollembolaindifferentseasonsatdifferentsoildepthinJhumlandecosysystem.
Area Soillayers
Season Dataanalysis
Margalef’s Index(Da)
Diversity(H’) Hmax'
Jhumlandecosystem
0‐10cm Summer 7.443 3.875 3.751
0‐10cm Rainy 7.112 3.550 3.661
0‐10cm Winter 5.636 3.664 3.223
10‐20cm Summer 7.113 3.993 3.622
10‐20cm Rainy 6.995 3.000 3.229
10‐20cm Winter 5.312 2.887 2.773
20‐30cm Summer 6.335 3.559 3.559
20‐30cm Rainy 6.223 3.441 3.636
20‐30cm Winter 5.000 3.111 3.005
Table3:DistributionofCollembolaspeciesindifferentseasonsofforestecosystem
Sl.No Species Summer Rainyseason Winter
1 Cyphoderusalbinos +++ ++ ‐
2 Entomobryatriangularis ++ ‐ ‐
3 Entomobryaclitellaria +++ ++ ‐
4 Isotomodesproductus ++ +++ ‐
Volume 3 Issue 3: 2015 Volume 3 Issue 4: 2015
www.ijset.in ISSN (O): 2348-4098 ISSN (P): 2395-4752
International Journal of Science, Engineering and Technology Page 5

5 Isotomurusunifasciatus ‐ +++ +
6 Lepidocyrtuskauriensis ++ ++ ++
7 Lepidocyrtuscurvicollis ++ +++ ‐
8 Lepidocyrtusrataensis ++ +++ ‐
9 Odontellaminutudentata ‐ +++ ++
10 Proisotomasubminuta ++ +++ ‐
11 Pseudofolsomiasp ‐ +++ ‐
12 Pseudosinellaorba ++ +++ ‐
13 Pachytullbergiascabra ++ ++ +++
14 Scutisotomamillimetrica ++ ‐ ‐
15 Weberacantha ‐ ++ +++
Table4:DistributionofCollembolaspeciesindifferentseasonsofJhumlandecosystem.
Sl.No Species Summer Rainyseason Winter
1 Entomobryaclitellaria ‐ ++ ‐
2 Isotomodesproductus +++ +++ ‐
3 Isotomeillaminor ‐ +++ ‐
4 Pseudofolsomiasp. ‐ ++ ‐
5 Proisotomasubminuta +++ ‐ ‐
6 Lepidocyrtuskauriensis ++ ++ ‐
7 Lepidocyrtusrataensis ++ +++ ++
8 Pseudosinellaorba ‐ ++ ‐
9 Pachytullbergiascabra ++ +++ ‐
10 Bourletiellaarvalis ‐ ‐ ++
11 Dicyrtomamelitensis ++ ++ ‐
12 Deuterosminthuruspallipes ‐ +++ ‐
13 Weberacantha +++ ++ ‐
14 Scutisotomamillimetrica ++ ‐ ‐
15 Entomobryatriangularis ++ ‐ ‐
+++ = High
++ = Moderate
+ = Low
‐ = Absent
Volume 3 Issue 3: 2015 Volume 3 Issue 4: 2015
www.ijset.in ISSN (O): 2348-4098 ISSN (P): 2395-4752
International Journal of Science, Engineering and Technology Page 6

CHAETOMORPHALINUMEXTRACTASAGREENINHIBITORFORCORROSIONOFBRASSIN0.1NPHOSPHORICACIDSOLUTION
SELVAKUMARR.12*ANDCHANDRASEKARANV.3
1ResearchScholar(PT),DepartmentofChemistry,BharathiarUniversity,Coimbatore‐641046,TamilNadu,India,[email protected]
2Lecturer,DepartmentofChemistry,SreeKrishnaPolytechnicCollege,Nagercoil‐629003,TamilNadu,India.
3AssistantProfessor,DepartmentofChemistry,Govt.ArtsCollege(Autonomous),Salem–636007,TamilNadu,India,[email protected]
ABSTRACT
TheeffectofmarinealgaeChaetomorphalinumextractoncorrosioninhibitionofbrassinphosphoricacidwasinvestigatedbyweight‐lossmethod,potentiodynamicpolarizationandelectrochemical impedancespectroscopystudies.The inhibitionefficiencyisfoundtoincreasewithincreasingconcentrationofextractanddecreaseswithriseintemperature.TheinhibitiveeffectcouldbeattributedtothephytochemicalconstituentspresentintheinhibitorcontainingN,S,Oatoms.Theactivationenergy,thermodynamicparameters(freeenergy,enthalpyandentropychange)andkineticparameters(rateconstantandhalf‐life) for inhibitionprocesswerecalculated.Thesethermodynamicandkineticparameters indicateastrong interactionbetweentheinhibitorandthebrasssurface.Theinhibitionisassumedtooccurviaadsorptionofinhibitormoleculesonthebrass surface, which obeys Temkin adsorption isotherm. The adsorption of inhibitor on the brass surface is exothermic,physical,andspontaneous,followsfirstorderkinetics.Thepolarizationmeasurementsshowedthattheinhibitorbehavesasamixedtypeinhibitorandthehigherinhibitionsurfacecoverageonthebrasswaspredicted.Inhibitionefficiencyvalueswerefound to show good trend with weight‐loss method, potentiodynamic polarization and electrochemical impedancespectroscopystudies.Surfaceanalyticaltechniques(FT‐IRandSEM)werecarriedouttoascertaintheinhibitivenatureofthealgalextractonthebrasssurface.
IndexTerms:Brass,Phosphoricacid,Chaetomorphalinum,Inhibition,Polarization,andIsotherm.
1. INTRODUCTION
Phosphoric acid (H3PO4) is a major chemical product,which has many important uses especially in theproduction of fertilizers. Most of the acid is producedfromphosphaterockbywetprocess.Brassandstainlesssteelarefrequentlyusedinmanypartsofthewetprocessand a considerable quantity of data has been publishedabout the resistance of these materials to corrosion byacid solutions [1,2]. Most of the previous studies werefocused on the inhibition of metals in HCl or H3PO4solutions using organic compounds containing N, S, Oatomsascorrosion inhibitors [3‐5].A lotofresearchhasbeendonewithnaturallyoccurringsubstancessincetheyare known to be eco‐friendly and with little or no sideeffect on the humans. Among the naturally occurringsubstancesreportedinthecorrosionstudyofmetalslikebrass,aluminium,tinandmildsteel,thereleaveextracts,gumsandexudates,dyes,oils fromplantmaterials,plantseeds and fruits, and anti‐bacterial drugs. Plant extractsliketheextractofcocosnucifera‐coconutpalm‐petiole[6];Musa Paradisiaca [7]; Mentha Pulegium [8]; TreculiaAfricana leaves [9] and Lupinus varius leaves [10] havebeen studied and established their corrosion inhibitioneffects. They were all found to be good corrosioninhibitorswithnoeffectontheenvironment.
Inthepresentstudy,theeffectofadditionofmarinealgaeChaetomorpha linum extract on corrosion inhibition of
brass in 0.1 N phosphoric acid solutions at differenttemperatures and various time intervals have beeninvestigated by weight‐loss method, potentiodynamicpolarizationandelectrochemicalimpedancespectroscopystudies. Theweight lossmeasurements aimed topredictthe inhibition efficiency on brass corrosion and theadsorption isotherm, thermodynamic and kineticfeasibility of inhibition via surface coverage on brass byadsorbed Chaetomorpha linum extract. The inhibitiontype and inhibition efficiencywere determined from thepolarizationmeasurements and impedance spectroscopystudies. Surface analytical techniques (FT‐IR and SEM)werecarriedouttoascertain the inhibitivenatureof thealgalextractonthebrasssurface.
2.METERIALANDMETHODS
2.1MATERIALS
The chemical composition (weight percent) of the brassusedinthepresentstudywas71.5%Cu,28.38%Zn,0.07%Pb,and0.05%Fe.Thegeometryofthespecimensforweight‐loss experiments was as follows: The brassspecimens were polished mechanically with differentgradesofemerypapers(1/0to4/0)andwerethoroughlywashed with double distilled water then degreased inacetone and dried. The solutions were prepared fromanalar grade chemicals using double distilled water.Phosphoric acid solution (H3PO4) was used as a
Volume 3 Issue 3: 2015 Volume 3 Issue 4: 2015
www.ijset.in ISSN (O): 2348-4098 ISSN (P): 2395-4752
International Journal of Science, Engineering and Technology Page 7

corrosion medium. The inhibitor Chaetomorpha linumextract (CLE) was extracted with ethanol using soxheltextractorfrommarinealgaeChaetomorphalinum.
2.2WEIGH‐LOSSMEASUREMENT
Measurements of weight changes were performed withrectangular brass specimens (length: 5 cm,width: 1 cm,and thickness: 0.3 cm). The specimens with samedimensions were immersed in 100 ml of 0.1 N H3PO4solutions with and without different concentrations(0.0001%to0.0005%)ofCLEandallowedstandfor3hand6hatvarious temperatureswereas follows:300K,318 K, 328 K, and 338 K. At 300 K the specimenswereimmersed for immersion time of 24, 48, 72, and 96 h.Then,thespecimenswererinsedwithdistilledwaterandadherentcorrosionproductsfor20s.thenthespecimenswere rinsedwithwater, cleanedwithacetoneanddried.The percentage of inhibition efficiency (IE) over theexposure period was calculated using the followingequation(1)[11]:
Inhibitionefficiency(%)=Wo
WiWo x100(1)
whereWoandWiaretherateofcorrosionforbrasswithandwithoutinhibitor,respectively.
2.3POTENTIODYNAMICPOLARIZATIONSTUDIES
The potentiodynamic polarization studies were carriedoutwithbrassstripshavinganexposedareaof1cm2.Thecell assembly consisted of brass asworking electrode, aplatinumfoilascounterelectrodeandasaturatedcalomelelectrode as a reference electrode. Polarization studieswerecarriedoutusingapotentiostat/galvanostat(ModelBAS‐100A).Theworkingelectrodewasimmersedina0.1N H3PO4 and allowed to stabilize for 30 min. Eachelectrodewasimmersedina0.1NH3PO4inthepresenceand absence of different concentrations of inhibitor towhich a current of 1.5 mA/cm2 was applied for 20minutes to reduce oxides. The cathodic and anodicpolarizationcurvesforbrassspecimeninthetestsolutionwithandwithoutvariousconcentrationsof the inhibitorwererecordedbyscanningthepotentialrange+200fromthe corrosion potential at a sweep rate of 1 mV/s. Theinhibition efficiencies were determined from corrosioncurrents using the Tafel extrapolation method. Thecorrosion inhibition efficiency (IE) was calculated fromthefollowingequation(2):
100i
i- i (%) IE
corr
(i)corr corr X (2)
Where icorr and icorr(i) are the corrosion current densityvalueswithoutandwithinhibitor,respectively.
2.4 ELECTROCHEMICAL IMPEDANCE SPECTROSCOPYSTUDIES
Awellpolishedbrasselectrodewas introduced into100mloftestsolutionandallowedtoattainasteadypotentialvalue.ACsignalofamplitudeof10mVwasappliedandthefrequency was varied from 10 MHz to 10 KHz usingSolartron electrochemical measurement unit (1280B).The real and imaginary parts of the impedance wereplotted inNyquistplotsas shown inFigure5. FromtheNyquist plot, the charge transfer resistance (Rct) anddoublelayercapacitance(Cdl)valueswerecalculated.
ThechargetransferresistancevalueswereobtainedfromtheplotsofZ’vsZ”.Thevaluesof(Rs+Rct)correspondtothepointwheretheplotscutsZ’axisatlowfrequencyandRscorrespondstothepointwheretheplotcutsZ’axisathighfrequency.ThedifferencebetweenRctandRsvaluesgive the charge transfer resistance (Rct) values. The Cdlvalueswereobtainedfromthefollowingequation(3):
ctmaxdl Rf2
1C
(3)
where Cdl is double layer capacitance, Rct is chargetransfer resistance and fmax is frequency at Z” valuemaximum.
TheinhibitionefficiencieswerecalculatedfromRctvaluesusingthefollowingequation(4):
100R
RR%IE
)i(ct
ct)i(ct
(4)
where Rct and Rct(i) are the charge transfer resistance intheabsenceandpresenceofinhibitorrespectively.
2.5SURFACESTUDY
Thebrassspecimenwasimmersedin0.1NH3PO4inthepresence of inhibitor for 6 h at 300 K. After 6 h thespecimenwastakenoutanddried.ThenatureofthefilmformedonthebrasssurfacewasanalyzedbyFT‐IRPerkinElmer‐1600 spectrometer. SEM images were recordedwith a Hitachi 3000 H Microscope from the dried filmformedonthesurfaceofthebrassspecimenstakenfrom0.1 N H3PO4 in the presence and absence of inhibitorimmersedfor6hat300K.
3.RESULTSANDDISCUSSION
3.1WEIGH‐LOSSMETHOD
Table‐1showstheinhibitionefficiencyvaluesofbrassbyweight‐loss measurements at different inhibitorconcentrations in 0.1 N H3PO4 for different immersiontimes and temperatures. It has been observed that theinhibition efficiency increases with increase inconcentrationofinhibitoranddecreaseswithincreaseintemperature and immersion time. The maximum IE(78.95 %) of inhibitor was achieved at 0.0005 % ofinhibitorat300Kfor3h.
Volume 3 Issue 3: 2015 Volume 3 Issue 4: 2015
www.ijset.in ISSN (O): 2348-4098 ISSN (P): 2395-4752
International Journal of Science, Engineering and Technology Page 8
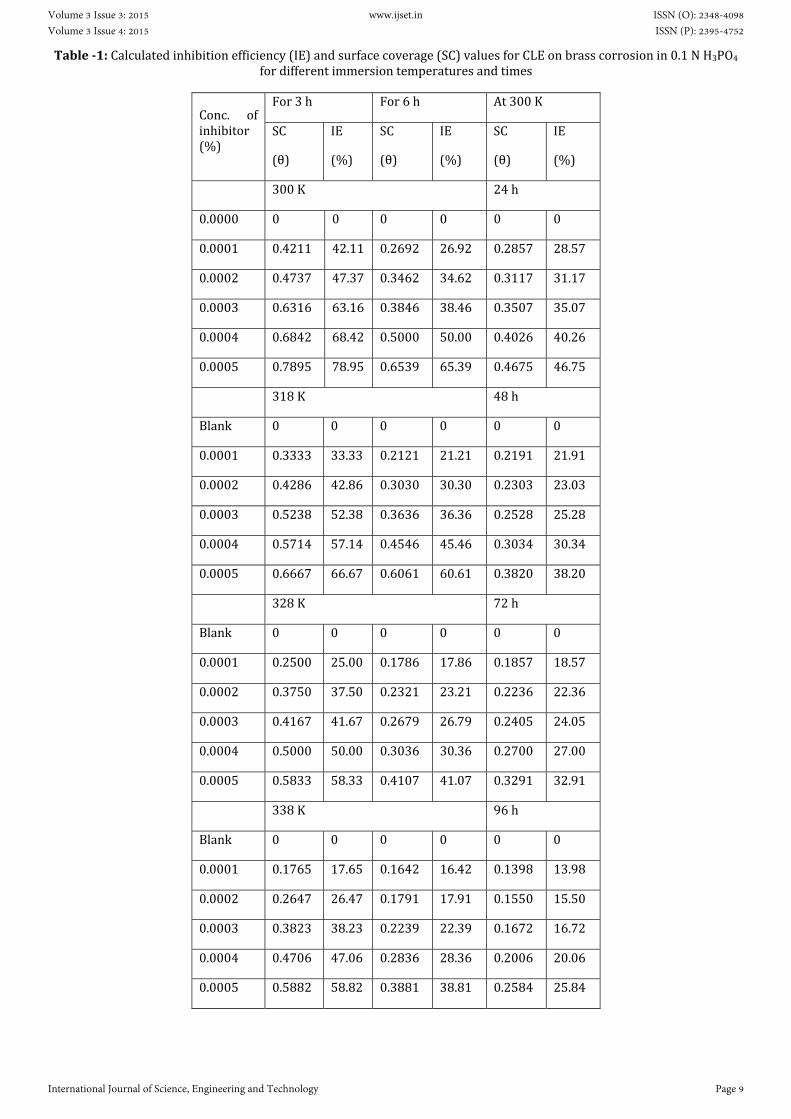
Table‐1:Calculatedinhibitionefficiency(IE)andsurfacecoverage(SC)valuesforCLEonbrasscorrosionin0.1NH3PO4fordifferentimmersiontemperaturesandtimes
Conc. ofinhibitor(%)
For3h For6h At300K
SC
(θ)
IE
(%)
SC
(θ)
IE
(%)
SC
(θ)
IE
(%)
300K 24h
0.0000 0 0 0 0 0 0
0.0001 0.4211 42.11 0.2692 26.92 0.2857 28.57
0.0002 0.4737 47.37 0.3462 34.62 0.3117 31.17
0.0003 0.6316 63.16 0.3846 38.46 0.3507 35.07
0.0004 0.6842 68.42 0.5000 50.00 0.4026 40.26
0.0005 0.7895 78.95 0.6539 65.39 0.4675 46.75
318K 48h
Blank 0 0 0 0 0 0
0.0001 0.3333 33.33 0.2121 21.21 0.2191 21.91
0.0002 0.4286 42.86 0.3030 30.30 0.2303 23.03
0.0003 0.5238 52.38 0.3636 36.36 0.2528 25.28
0.0004 0.5714 57.14 0.4546 45.46 0.3034 30.34
0.0005 0.6667 66.67 0.6061 60.61 0.3820 38.20
328K 72h
Blank 0 0 0 0 0 0
0.0001 0.2500 25.00 0.1786 17.86 0.1857 18.57
0.0002 0.3750 37.50 0.2321 23.21 0.2236 22.36
0.0003 0.4167 41.67 0.2679 26.79 0.2405 24.05
0.0004 0.5000 50.00 0.3036 30.36 0.2700 27.00
0.0005 0.5833 58.33 0.4107 41.07 0.3291 32.91
338K 96h
Blank 0 0 0 0 0 0
0.0001 0.1765 17.65 0.1642 16.42 0.1398 13.98
0.0002 0.2647 26.47 0.1791 17.91 0.1550 15.50
0.0003 0.3823 38.23 0.2239 22.39 0.1672 16.72
0.0004 0.4706 47.06 0.2836 28.36 0.2006 20.06
0.0005 0.5882 58.82 0.3881 38.81 0.2584 25.84
Volume 3 Issue 3: 2015 Volume 3 Issue 4: 2015
www.ijset.in ISSN (O): 2348-4098 ISSN (P): 2395-4752
International Journal of Science, Engineering and Technology Page 9
3.2THERMODYNAMICANDKINETICANALYSIS
The adsorption of the organic compounds can bedescribed by two main types of interactions: physicaladsorption and chemisorptions. They are influenced bythe nature of the charge of the metal, the chemicalstructure of the inhibitor, pH, the type of the electrolyteandtemperature[6].
3.2.1ACTIVATIONENERGY
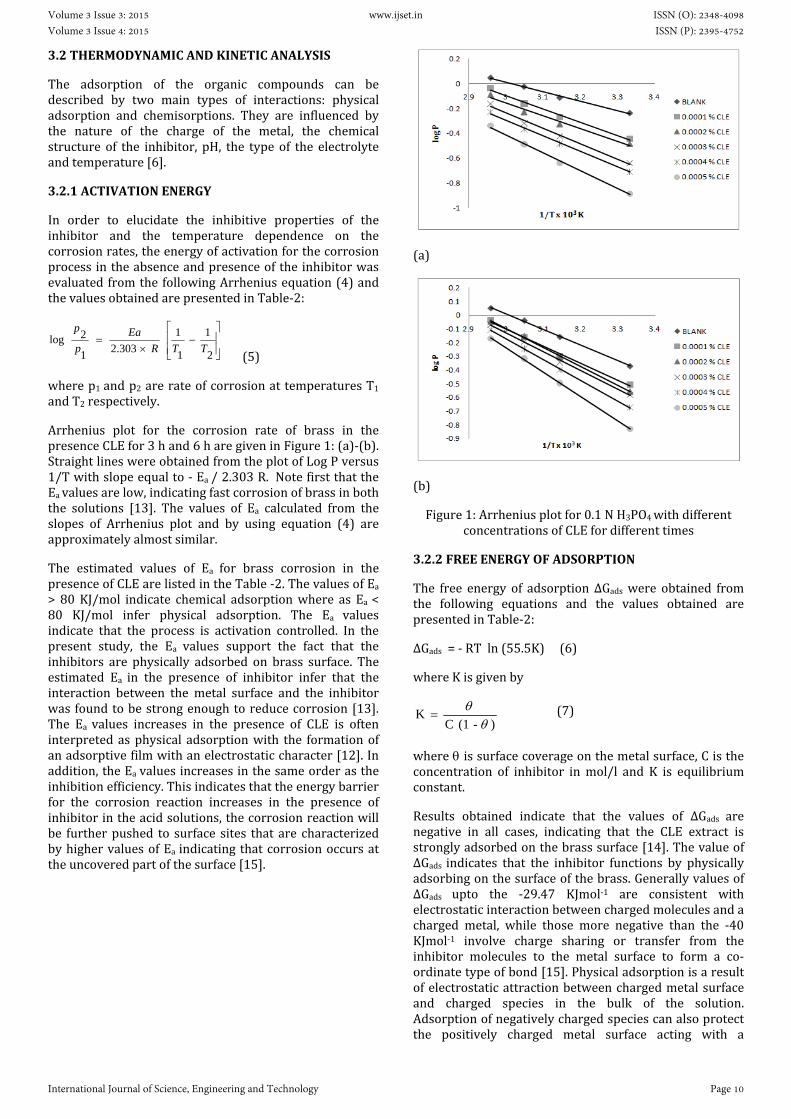
In order to elucidate the inhibitive properties of theinhibitor and the temperature dependence on thecorrosionrates,theenergyofactivationforthecorrosionprocessintheabsenceandpresenceoftheinhibitorwasevaluatedfromthefollowingArrheniusequation(4)andthevaluesobtainedarepresentedinTable‐2:
2
1
1
1
303.21
2logTTR
Ea
p
p
(5)
wherep1andp2arerateofcorrosionattemperaturesT1andT2respectively.
Arrhenius plot for the corrosion rate of brass in thepresenceCLEfor3hand6haregiveninFigure1:(a)‐(b).StraightlineswereobtainedfromtheplotofLogPversus1/Twithslopeequalto‐Ea/2.303R. NotefirstthattheEavaluesarelow,indicatingfastcorrosionofbrassinboththe solutions [13]. The values of Ea calculated from theslopes of Arrhenius plot and by using equation (4) areapproximatelyalmostsimilar.
The estimated values of Ea for brass corrosion in thepresenceofCLEarelistedintheTable‐2.ThevaluesofEa> 80KJ/mol indicate chemical adsorptionwhere as Ea <80 KJ/mol infer physical adsorption. The Ea valuesindicate that the process is activation controlled. In thepresent study, the Ea values support the fact that theinhibitors are physically adsorbed on brass surface. Theestimated Ea in the presence of inhibitor infer that theinteraction between the metal surface and the inhibitorwasfoundtobestrongenoughtoreducecorrosion[13].The Ea values increases in the presence of CLE is ofteninterpretedasphysical adsorptionwith the formationofanadsorptivefilmwithanelectrostaticcharacter[12].Inaddition,theEavaluesincreasesinthesameorderastheinhibitionefficiency.Thisindicatesthattheenergybarrierfor the corrosion reaction increases in the presence ofinhibitorintheacidsolutions,thecorrosionreactionwillbe furtherpushed to surface sites that are characterizedbyhighervaluesofEa indicating thatcorrosionoccursattheuncoveredpartofthesurface[15].
(a)
(b)
Figure1:Arrheniusplotfor0.1NH3PO4withdifferentconcentrationsofCLEfordifferenttimes
3.2.2FREEENERGYOFADSORPTION
The free energy of adsorption ΔGadswere obtained fromthe following equations and the values obtained arepresentedinTable‐2:
ΔGads=‐RTln(55.5K) (6)
whereKisgivenby
)-(1 CK
(7)
whereissurfacecoverageonthemetalsurface,Cistheconcentration of inhibitor inmol/l and K is equilibriumconstant.
Results obtained indicate that the values of ∆Gads arenegative in all cases, indicating that the CLE extract isstronglyadsorbedonthebrasssurface[14].Thevalueof∆Gads indicates that the inhibitor functions by physicallyadsorbingonthesurfaceofthebrass.Generallyvaluesof∆Gads upto the ‐29.47 KJmol‐1 are consistent withelectrostaticinteractionbetweenchargedmoleculesandacharged metal, while those more negative than the ‐40KJmol‐1 involve charge sharing or transfer from theinhibitor molecules to the metal surface to form a co‐ordinatetypeofbond[15].Physicaladsorptionisaresultofelectrostaticattractionbetweenchargedmetalsurfaceand charged species in the bulk of the solution.Adsorptionofnegativelychargedspeciescanalsoprotectthe positively charged metal surface acting with a
Volume 3 Issue 3: 2015 Volume 3 Issue 4: 2015
www.ijset.in ISSN (O): 2348-4098 ISSN (P): 2395-4752
International Journal of Science, Engineering and Technology Page 10

negatively charged intermediate such as acid anions adsorbedonthemetalsurface[6].
Table‐2:Calculatedactivationenergy(Ea),freeenergyofadsorption(∆Gads),enthalpychange(∆H),entropychange(∆S)valuesforCLEonbrasscorrosionin0.1NH3PO4at300K
3.2.3ENTROPYANDENTHALPY
Kinetic parameters such as enthalpy (ΔH) and entropy(ΔS)ofactivationofcorrosionprocess iscalculated fromthe following thermodynamic basic equations and thevaluesobtainedarepresentedinTable‐2:
ΔH=Ea–RT (8)
ΔGads=ΔH–TΔS (9)
Enthalpyofactivationofabsolutevalueslowerthanthe‐24.75 KJmol‐1 indicates physical adsorption, and thevalues approaching 100 KJmol‐1 indicate chemicaladsorption.Inthisstudy,thevaluesofΔHarelowerthanthe ‐24.75KJmol‐1confirmingphysicaladsorptionontheacid solutions [10].Thenegative valuesofΔH also showthat theadsorptionof inhibitor isanexothermicprocess[14].
TheΔSvaluesarepositivefortheacidicbath.Thisimpliesthat the activation complex is the rate determining steprepresenting association rather than dissociation,indicatingthatadecreaseindisordertakesplaceongoingfromreactanttotheactivatedcomplex[10].
3.2.4RATECONSTANTANDHALFLIFE
Figure 2: show the plots of log Wf (final weight loss)obtained in weight‐loss studies vs. time in days for thebrass dissolution. From the plots, the values of rateconstantandhalf‐lifewereevaluatedusing the followingequations [16,17]and thevaluesobtainedarepresentedinTable‐3:
Rateconstant(k)=2.303xslope(sec‐1) (10)
(sec)k
0.693 t period life-Half 1/2 (11)
Conc. ofinhibitor
(%)
Eafrom
equation
(kJ/mol)
Ea fromArrheniusPlot
(kJ/mol)
∆Gads
(kJ/mol)
∆H
(kJ/mol)
∆S
(mol/kJ)
For3Hours
Blank 12.91 12.98 0 0 0
0.0001 20.73 19.15 ‐29.47 ‐24.75 0.0157
0.0002 20.33 21.28 ‐27.80 ‐24.73 0.0102
0.0003 24.37 22.68 ‐26.61 ‐24.72 0.0063
0.0004 24.38 23.94 ‐25.71 ‐24.70 0.0034
0.0005 27.79 27.36 ‐24.50 ‐24.67 0.0006
For6Hours
Blank 21.00 16.76 0 0 0
0.0001 23.99 23.94 ‐28.94 ‐24.70 0.0141
0.0002 26.05 25.53 ‐27.56 ‐24.69 0.0096
0.0003 26.15 29.93 ‐26.66 ‐24.64 0.0067
0.0004 28.98 28.16 ‐26.08 ‐24.66 0.0047
0.0005 33.65 31.92 ‐25.27 ‐24.62 0.0022
Volume 3 Issue 3: 2015 Volume 3 Issue 4: 2015
www.ijset.in ISSN (O): 2348-4098 ISSN (P): 2395-4752
International Journal of Science, Engineering and Technology Page 11

Figure2:PlotoflogWfvs.time(days)for0.1NH3PO4withdifferentconcentrationsofCLE
In thisstudy, linearplotswereobtained,which indicatesfirst order kinetics [9]. In this study the rate constantvaluesweredecreasedwhereasthehalf‐lifevalueswereincreasedwithincreasingconcentrationofCLE.
Table‐3:Calculatedrateconstant(k)andhalf‐lifeperiod(t1/2)valuesforCLEonbrasscorrosionin0.1NH3PO4at300K
Conc. ofinhibitor
(%)
Rateconstant(sec‐1)
Half‐lifePeriod(sec)
0.0001 0.5117 1.3542
0.0002 0.5117 1.3542
0.0003 0.5117 1.3542
0.0004 0.5315 1.3038
0.0005 0.5758 1.2037
3.2.5ADSORPTIONISOTHERMS
The values of surface coverage Ѳ for differentconcentrations of the CLE at 300 K have been used toidentify the best isotherm to determine the adsorptionprocess. The adsorption of organic adsorbate on thesurface of copper is regarded as substitutional processbetween the organic compound in the aqueous phaseorgaq and the water molecules adsorbed on the coppersurface(H2O)ads[18].
Org(aq)+x(H2O)(ads)→Org(ads)+xH2O(aq)
where x is the size ratio, that is the number of watermoleculesdisplacedbyonemoleculeoforganicinhibitor.AttemptsweremadetofitѲvaluesofvariousisotherms,including Langmuir, Freundlich, Temkin and Frumkinisotherms.By far the resultswerebest fittedbyTemkinadsorption isotherm.TheTemkinadsorption isotherm isgivenbythefollowingequation.
LnkC=aѲ
where k is the equilibrium constant of the adsorptionreaction,Cistheinhibitorconcentrationinthebulkofthesolution and a is the molecule interaction parametersdependinguponmolecularinteractionsintheadsorptionlayerandthedegreeofheterogeneityofthemetalsurface.TheplotofѲagainst logCforalladditivesgivesstraightlines, as shown in Figure 3: (a)‐(b). This indicates thatthese compounds are adsorbed on the surface of brassaccordingtoTemkinadsorptionisotherm[19,20].
(a)
(b)
Figure3:Temkin'sadsorptionisothermplotfor0.1NH3PO4withdifferentconcentrationofCLEfordifferent
times
3.3POTENTIOSTATICPOLARIZATIONSTUDIES
Polarizationmeasurement is an important research toolin the investigation of a variety of electrochemicalphenomena. Such measurements permit studies of thereaction mechanism and the kinetics of corrosionphenomenaonthemetaldeposition.Figure4:showsthecathodicandanodicpolarizationcurvesofbrass in0.1NH3PO4 with and without addition differentconcentrations of CLE. Table‐4 gives the values ofassociated electrochemical parameters. The icorr valuesdecreasedwithincreasingconcentrationofinhibitor.ThevaluesofanodicTafelslope(ba)andcathodicTafelslope(bc) of CLE added solutions are found to change withinhibitor concentration, which clearly indicates that theinhibitors controlled both the anodic and cathodicreactions. The IE of CLE attained a maximum value at0.0005 % concentration of inhibitor. The values of IEincreased with increasing concentration of inhibitor,indicatingthatahighersurfacecoveragewasobtainedinsolution with optimum concentration of inhibitor. The
Volume 3 Issue 3: 2015 Volume 3 Issue 4: 2015
www.ijset.in ISSN (O): 2348-4098 ISSN (P): 2395-4752
International Journal of Science, Engineering and Technology Page 12

effectoftheanodicpolarizationbehaviorofbrass(Figure4) suggests that protective films formed on the metalsurfacecanalteranodicdissolutioninsolutionshowsthat
CLE formed a film that acted as a barrier to protect themetalsurface[19‐21].
Table‐4:Electrochemicalparametersandinhibitionefficiency(IE)forcorrosionofbrassin0.1NH3PO4containingdifferentconcentrationsofCLE
Figure4:Polarizationcurvesforbrassin0.1NH3PO4withdifferentconcentrationsofCLE
3.4ACIMPEDANCEMEASUREMENTS
AC impedance spectroscopy has been shown to be apowerfultooltostudythecorrosionprocessofmetalsindifferentenvironmentsandtocharacterizetheinhibitionability of a corrosion inhibitor, which is related to thecharge transfer resistance (Rct). The double layercapacitance (Cdl) can also be used to determine theinhibition ability. The inhibition performance of anorganicornaturalsubstanceonametal surfacedependsnot only on the chemical structure of the organicsubstance and the nature of the metal, but also on theexperimentalconditionssuchas the immersiontimeandconcentrationoftheadsorbent.Thecorrosionbehaviorofbrass, in acidic solution with and without CLE, is alsoinvestigated by AC impedance measurements at 300 K(Figure5).TheimpedanceparametersandtheIE%
derived from the investigation are mentioned given inTable‐5. As it can be seen from Figure 5:, impedancediagramsshowasemi‐circularappearance,indicatingthatachargetransferprocessmainlycontrolsthecorrosionofbrass.Fromtheimpedancedata,wenoticeanincreaseinthechargetransferresistanceanddecreaseofthedoublelayer capacitance with increasing the inhibitorconcentration, indicating that PPE inhibits the corrosionrateofbrassbyanadsorptionmechanism.Therefore,thedecreaseintheCdlvaluecanbeattributedtoadecreaseinthe local dielectric constant and/or an increase in thethickness of the electrical double layer, suggesting thatthe inhibitor molecules act by adsorption at themetal/solution interface as a consequence of thereplacement of water molecules by the inhibitormolecules[8].
A comparison may be made between the inhibitionefficiency values obtained by different methods (weightloss, potentiostatic polarization and AC impedancemethods).Wecanseethatwhateverthemethodused,nosignificant changes are observed in IE%values.We canthen conclude that there is a good agreement with thethree methods used in this study at all testedconcentrationsandthattheacidextractofChaetomorphalinumactsasagreeninhibitorforacidcorrosionofbrass.
Table ‐5: Impedance measurements and inhibitionefficiency (IE) for corrosion of brass in 0.1 N H3PO4containingdifferentconcentrationsofCLE
Conc. ofinhibitor
(%)
Rct
(ohmcm2)
Cdl
(F/cm2)
IE
(%)
Blank 150.60 5.74 00.00
Conc. ofinhibitor
(%)
OCP(mV)
vs.SCE
Ecorr
(mV)
vs.SCE
Tafelconstantsicorr
(A/cm2)
IE
(%)
ba
(mV/dec)
bc
(mV/dec)
Blank ‐193 ‐190 300 100 310 0
0.0001 ‐200 ‐198 300 95 290 6.45
0.0002 ‐220 ‐222 280 160 240 22.58
0.0003 ‐228 ‐230 160 150 180 41.94
0.0004 ‐236 ‐236 90 140 160 48.39
0.0005 ‐245 ‐240 50 150 89 71.29
Volume 3 Issue 3: 2015 Volume 3 Issue 4: 2015
www.ijset.in ISSN (O): 2348-4098 ISSN (P): 2395-4752
International Journal of Science, Engineering and Technology Page 13

0.0001 520.18 2.21 71.05
0.0002 685.18 1.80 78.02
0.0003 1300.17 1.01 88.42
0.0004 1910.68 0.73 92.12
0.0005 7370.33 0.19 97.96
Figure5:Nyquistplotofbrassin0.1NH3PO4withdifferentconcentrationsofCLE
3.5SURFACEEXAMINATIONS
3.5.1FT‐IRSPECTROSCOPY
Figure6:showstheFT‐IRspectrumrecordedintherange400‐4000cm‐1toidentifythefunctionalgroupspresentinCLE.FromFT‐IR,Itwasobservedthataromaticmoleculeswith following functional groups, intermolecularhydrogen bonding and O‐H stretching (3448.77 cm‐1), ‐C≡Ninnitrile(2347.84cm‐1),–C≡Cdisubstitutedalkyne(2099.34 cm‐1), ‐C‐H and C=O stretching in aldehyde(1640.73cm‐1),‐C=Ostretchinginester(1398.92cm‐1),‐C‐H stretching ‐C‐O‐C‐ (1115.08 cm‐1), and ‐C‐Hdeformation in alkyne (658.02 cm‐1) are present in CLE.Further found that CLE inhibits the corrosion of brassspecimen with high efficiency due to the presence of NandOintheorganicmoleculesofCLE[22,23].
Figure6:FT‐IRspectraofthesurfaceofbrassformedbyimmersingsamplein0.1NH3PO4withCLEfor6h
3.5.2SCANNINGELECTRONMICROSCOPY
SEMmicrogramsofthepolishedsurfaceofbrassexposedfor6hin0.1NH3PO4inabsenceandpresenceofCLEareshowninFigure7:(a)‐(b)showsthesurfacemorphologyofbrassformedin0.1NH3PO4withoutandwithCLEfor6h.InthecomparisonoftheSEMmicrograms,therewerea rough surface on brass in absence of extract and asmoothsurfacewithdepositedextract inpresenceoftheCLE.Thisconfirmsthattheextractinhibitedcorrosionofbrass through adsorption of the inhibitor molecules onmetalsurface.Afterimmersingintheinhibitorcontainingsolution,theentiremetalsurfacewascoveredwithalayerformed with inhibitor as a barrier to corrosion, asdenoted by rougher over abrasions. The inhibiting layerwas possibly consisting of Cu2+ and Zn2+ complexesformedwith theCLEderivativesarementioned inFT‐IR[24,25].
(a)
(b)
Figure7:SEMimagesofbrasssurfaceafter6himmersionin0.1NH3PO4intheabsence(a)andpresence(b)ofCLE
4.CONCLUSIONS
The inhibition efficiency of CLE on corrosion of brass in0.1 N H3PO4 increases on increasing of concentration ofthe extract and decreases with rise in temperature.Adsorptionof inhibitormoleculesof theextractonbrasssurface is found to obey Tempkin adsorption isotherm.The increase in the values of activation energies of thecorrosionprocessinthepresenceofextractindicatesthatCLE creates a physical barrier to charge and masstransfer,leadingtoreductionincorrosionrateofbrassin0.1NH3PO4.ThenegativevaluesofΔGadsandΔHhighlightthat the inhibition of corrosion of brass throughadsorption is spontaneous and exothermic. Their values
Volume 3 Issue 3: 2015 Volume 3 Issue 4: 2015
www.ijset.in ISSN (O): 2348-4098 ISSN (P): 2395-4752
International Journal of Science, Engineering and Technology Page 14

also reveal that physical adsorption is involved in theadsorption process. Potentiodynamic polarizationmeasurements show that CLE acts as a mixed typeinhibitor.Inhibitionefficiencyvalueswerefoundtoshowgood trend with weight‐loss method, potentiodynamicpolarizationandelectrochemicalimpedancespectroscopystudies. SEM and FT‐IR studies confirm that corrosioninhibitionofbrassin0.1NH3PO4isduetoadsorptionoftheCLEextractonbrass.
REFERENCES
[1].ChandrasekaranV.;KannanK.;NatesanM.,“Inhibitingpropertiesofsomeaminesoncorrosionbehaviourofmildsteel in phosphoric acid solution at varioustemperatures”.AsianJournalofChemistry,Vol.17,No.3,2005,pI921‐1934.
[2]. Chandrasekaran V.; Kannan K.;Natesan M.,“Electrochemical behaviour and inhibiting properties ofisopropyl amine on mild steel corrosion in phosphoricacidsolution”.OrientalJournalofChemistry,Vol.21,No.1,2005,p81‐88.
[3]. Ranjana; Nandi M. M., “Evaluating two newsulphonamidoimidazolines on the corrosion of brass in0.6Naqueoussodiumchloridesolution”.IndianJournalofChemicalTechnology,Vol.18,2011,p29‐36.
[4]. Ranjana; Ranu Banerjiee; Nandi M. M., “Corrosioninhibition of brass in presence of 1,4,5,6‐tetrahydropyridimine derivatives in chloride solution”.Indian Journal of Chemical Technology, Vol. 20, p 237‐244.
[5]. Ravichandran R.; Rajendran N., “Electrochemicalbehavior of brass in artificial seawater: effect of organicinhibitors”. Applied Surface Science, Vol. 241, 2005, p449‐458.
[6]. Vijayalakshmi P. R.; Rajalakshmi R.; Subhashini S.,“Corrosioninhibitionofaqueousextractofcocosnucifera‐coconutpalm‐petioleextractfromdestructivedistillationfor the corrosion of mild steel in acidic medium”.PortugaliaeElectrochimicaActa,Vol.29,No.1,2011,p9‐21.
[7]. Ramananda; Mayanglambam S.; Vivek Sharma;Gurmeet Singh, “Musa Paradisiaca Extract as a greeninhibitor for corrosion of mild steel in 0.5 M sulphuricacid solution”. Portugaliae Electrochimica Acta, Vol. 29,No.6,p405‐417.
[8]. Khadraoui A.; Khelifa A.; Boutoumi H.; Mettai B.,KarzaziY.;HammoutiB., “Corrosion inhibitionof carbonsteel in hydrochloric acid solution by Mentha PulegiumExtract”. Portugaliae Electrochimica Acta, Vol. 32, No. 4,2014,p271‐280.
[9].EjikemeP.M.;UmanaS.G.;OnukwuliO.D.,“Corrosioninhibition of aluminium by Treculia Africana leavesextractinacidmedium”.PortugaliaeElectrochimicaActa,Vol.30,No.5,2012,p317‐328.
[10]. Muna K. Irshedat; Eyad M. Nawafleh; Tareq T.Bataineh; Riyadh Muhaidat; Mahmoud A. Al‐Qudah;Ahmed A. Alomary, “Investigation of the inhibition of
aluminium corrosion in 1 M NaOH solution by Lupinusvariusl.extract”.PortugaliaeElectrochimicaActa,Vol.31,No.1,2011,p1‐10.
[11]. Ravichandran R.; Rajendran N., “Electrochemicalbehavior of brass in artificial seawater: effect of organicinhibitors”. Applied Surface Science, Vol. 241, 2014, p449‐458.
[12].ChandrasekaranV.;SaravananJ.,“EffectofS‐AITAonmildsteelCorrosioninAcidicMedium”.CorrosionScienceandTechnology,Vol.5,No.5,2006,p160‐167.
[13].MahmoudS.S.,“CorrosioninhibitionofMuntz(63%Cu, 37% Zn) alloy in HCl solution by some naturallyoccurring extracts”. PortugaliaeElectrochimicaActa,Vol.24,2006,p441‐455.
[14]. Elmsellem H.; Basbas N.; Chetouani A.; Aouniti A.;Radi S.; Messali M.; Hammouti B., “Quantum chemicalstudies and corrosion inhibitive properties ofmild steelby some pyridine derivatives in 1 N HCl solution”.PortugaliaeElectrochimicaActa,Vol.32,No.2,2014,p77‐108.
[15]. Tadeja Kosec; Ingrid Milosev; Boris Pihlar,“Benzotriazole as an inhibitor of brass corrosion inchloride solution”. Applied Surface Science, Vol. 253,2007,p8863‐8873.
[16]. Chandrasekaran V.; Kannan K.; Natesan M., “TheEffect of Imidazole and 2‐Methyl Imidazole on theCorrosion of Mild Steel in Phosphoric acid solution”.Corrosion Science andTechnology,Vol. 4,No. 5, 2005, p191‐200.
[17]. Nnaemeka J. N. Nnaji; Nelson O.Obi‐Egbedi;Chukwuma O. B. Okoye, “Cashew nut testa tannin:assessingitseffectsonthecorrosionofaluminiuminHCl”.Portugaliae Electrochimica Acta, Vol. 30, No.2, 2014, p157‐182.
[18].MegahedH.E.,“Ethoxylatedfattyestersascorrosioninhibitorsforcopperinnitricacidsolutions”.PortugaliaeElectrochimicaActa,Vol.29,No.4,2011,p287‐294.
[19].Chandrasekaran V.; Gokulalakshmi K., ”Corrosionstudies on brass in H3PO4 with Benzamide”. Bulletin ofElectrochemistry,Vol.22,2006,p379‐384.
[20]. Chandrasekaran V.; Kannan K.; Natesan M.,“Synergistic effect of Isopropyl aminewith Cl‐ and SO42+on inhibitionofmild steel corrosion inphosphoricacid”.InternationalJournalofPureandAppliedChemistry,Vol.l,No.1,2006,p101‐115.
[21].GaikwadA.B.;PatilP.P.;SudeshnaChaudhari,”Poly(o‐anisidine) coatings on brass: synthesis,characterization and corrosion protection”. CurrentAppliedPhysics,Vol.9,2009,p206‐218.
[22].RavichandranR.;NanjudanS.;RajendranN.,“Effectof benzotriazole derivatives on the corrosionof brass inNaClsolutions”.Appliedsurfacescience,Vol.236,2004,p241‐250.
Volume 3 Issue 3: 2015 Volume 3 Issue 4: 2015
www.ijset.in ISSN (O): 2348-4098 ISSN (P): 2395-4752
International Journal of Science, Engineering and Technology Page 15

[23].DuX.S.;SuY.J.;LiJ.X.,QiaoL.J.;ChuW.Y.,“Inhibitiveeffects and mechanism of phosphates on the stresscorrosion cracking of brass in ammonia solutions”.Corrosionscience,Vol.60,2012,p69‐75.
[24]. Ramananda; Mayanglambam S.; Vivek Sharma andGurmeet Singh, “Musa Paradisiaca Extract as a greeninhibitor for corrosion of mild steel in 0.5 M sulphuricacid solution”. Portugaliae Electrochimica Acta, Vol. 29,No.6,2011,p405‐417.
[25]. Khadraoui A.; Khelifa A.; Boutoumi H.; Mettai B.;Karzazi Y.; Hammouti B., “Corrosion inhibition of carbonsteel in hydrochloric acid solution by Mentha PulegiumExtract”. Portugaliae Electrochimica Acta, Vol. 32, No. 4,2014,p271‐280.
BIOGRAPHIES
R. SELVA KUMAR, Research Scholar(PT), Department of Chemistry,BharathiarUniversity,Coimbatore‐641046, TamilNadu, India.He is Lecturerin Chemistry, Department ofChemistry, Sree Krishna PolytechnicCollege, Nagercoil‐629 003, TamilNadu, India. Email:[email protected]
Dr. V. CHANDRASEKARAN, AssistantProfessor inChemistry,DepartmentofChemistry, Govt. Arts College(Autonomous),Salem–636007,TamilNadu, India. Email:[email protected]
Volume 3 Issue 3: 2015 Volume 3 Issue 4: 2015
www.ijset.in ISSN (O): 2348-4098 ISSN (P): 2395-4752
International Journal of Science, Engineering and Technology Page 16

MULTI‐WALLEDCARBONNANOTUBE(MWCNT)BASEDCOMPOSITEMATERIAL:AREVIEW
ABDULRAHMANSANAD1,M.N.M.ANSARI2,JAMALO.SAMEER3,ABDULBASITABDULLAH4,BASSAMALASEEL5
CenterforAdvanceMaterials,CollegeofEngineering,UniversitiTenagaNasional,Malaysia
ABSTRACT
This work discusses multiple applications of multi walled carbon nanotube (MWCNT) based compositematerials.Carbonmaterialsareknown topossesssuitableelectricalconductivity,due to itsof layered structureandelevated surfacearea,whichresultsinappliancesthathaveinternalelectrodesforrecharging,suchasbatteriesandcomponentsforfuelcell,ordevicesthatworkwithnano‐electronicssuchascomputerchips,storagemediaforfuelcellforon‐boardhydrogensupply,and superconductors. This study will shed light on the production, sharing, and storage of energy within these carbonmaterials (multi‐walledcarbontubes).Multiwalled carbonnanotubesare regardedasamoreuseful strengthening factorcomparedtotheshortermultiwalledcarbonnanotubes.Theresultsagreewiththeexperimentalresults,whichconfirmsthevalidity of the model. Thecurrent research oncarbonmaterials (multi‐walledcarbontubes) focuses on the production,distribution,andstorageofenergy.
KeyWords:multiwalledcarbonnanotube;compositematerialproperties;nanostructure;matrixandfibercomposite.
1.INTRODUCTION
When carbonnanotubeswerediscovered in1991 [1], itbecamethesubjectoffascinationandresearch,duetoitslowdensity,veryhighrigidity,flexibility,andstrength[2].Due to these factors, they are regarded as suitablestrengthening agent in nano combinations. It was alsoconfirmed that adding 1 wt. % CNTs into a matrixincreases the resulting composite’s rigidity by 36‐42%,and the tensile strength by 25% [3]. Both experimentsand simulations confirmed the fact that CNTs possessextremely high moduli[4], in the neighborhood of 100GPa, surpassing carbon fibers. CNTs also possess highgeometric fraction, rigidity‐to‐weight, and strength‐to‐weight fractions. These properties are transferrable tothematrixviatheinclusionofCNTs[5].Polymermatricesare widely used, but metals and ceramics are currentlyseeing an upsurge. TEM images ofMWCNT–Polystyrenecampsite, where nanotubes were dispersed within thepolystyrenematrix, isshowninFig.1[6].CNTsarequiteeasily dispersed into matrices, rendering them suitablestructural additions. The properties of the resultingcombination relies on workable load shift mechanismbetween constituents and the matrix. However, anypurported advantages from the CNT will be renderedinapplicable if the resulting bonds are negligible. Thismeans that the formation of an interfacial interactionbetweenCNTsanditspolymermatrixisvital[7].
Andrews et al. [8] synthesized a PS/MWCNT compositevia shear amalgamation, which resulted in a 15%improvement to the tensile strength from 5% volumefractionofMWCNTsinthematrix[9].
Figure1:TEMimageofMWCNT–Polystyrenefilminwhichthenanotubesarehomogeneouslydistributedin
thepolystyrenematrix[6].
Amongallcarbonmaterials,carbonnanotubes(CNTs)areregarded as the best inclusive assets, as they providemany different benefits, such as strengthening andimprovements to the performance cementationscompared to traditionalfibers.The scientific communityhas been enamoredwith CNTs and their correspondingapplications to the addition of of new nanocomposites.CNTs possesses hexagonal carbonwalls of tubes, whichhave a graphite‐like structure; they are long, have thinfullerenes, and the end caps are madeup of pentagonalrings [10]. These benefits lead to the potential for theutilization for different applications such asstrengtheningmaterials[11],orhydrogencontainers[12].
MWCNTs were scattered using surfactant‐ultrasonictechnique with GA, which is a commercially availablesurfactant. Based on the outcomes of the previousexperiment[25],themassratioofMWCNTstodispersantwas 1:6, while the pertinent dispersant was firstdissolved by four‐fifths of the total water in everycombination. Later on, the measured MWCNTs were
Volume 3 Issue 3: 2015 Volume 3 Issue 4: 2015
www.ijset.in ISSN (O): 2348-4098 ISSN (P): 2395-4752
International Journal of Science, Engineering and Technology Page 17

placedintoanaqueousdispersantsolutionsandscatteredadequately in an ultrasound processor (DS‐3510DT) for30 min at room temperature. Finally, 0.13 wt% ofdeformer was used for the purpose of decreasing theamount of air bubbles within the solution. Matrixmaterials,suchasceramicsandmetals,arealsoincluded.TEMimageofMWCNT–Polystyrenecomposite,wherethenanotubes were homogenously distributed within thepolystyrenematrix,weretaken.
The current work shows the influence of dispersedMWCNTs on the flexural strength of cement‐basedcomposites. Simultaneously, the microstructures of thecomposites were studied. Field emission scanningelectron microscope (FESEM) was used to analyze themorphology and microstructure of cement‐composites,whiletheporositywasanalyzedusingmercuryintrusionporosimetry(MIP).
Thetwomostimportanttypesofnanotubesarethesinglewalled nanotubes (SWNT) and the multi‐wallednanotubes (MWNT). The SWNTs[13, 14]contain onesinglesheetofseamlesslyrolledgrapheme,whichformsadiameter of 1 nm, and a length of less than a fewcentimeters cylinder, while the MWNTs falls within therange of these cylinders, with 0.35 nm separation,organized into a concentric configuration, similar to thegraphite’s basal plane separation[15]. Its diameter fallswithin2‐100nm,whileitslengthistensofmicrons.
Nowadays,themostwidelyusedsynthetic techniquestomanufacture SWNTs are the ones based on chemicalvapordeposition[17,18],especiallythedecompositionofCO[19]and laser ablation[16]. However, certainimperfectionsofitsproductioninthecontextofchemicalandphysicalcharacteristicsofthenanotubescanstillbeimproved.
Therearemanyapproachestorollingupasinglewallednanotube for the purpose of forming grapheme sheets.When rolling, the symmetry of the planar system isaltered, which prompts it to change its directionalalignmentcomparedtoitshexagonallattice.
The semi‐conducting, metallic, and semi‐metallic tubetypes are distinguished based on the relationshipbetweentheunitvectorsofthehexagonallatticeandtheaxial direction. The band gap of the semi‐conductingnanotubesvariesbetween1.8eVinthecaseofthetubeswithminordiameter,to0.18eVforthetubeswithmajordiameter[20].
The conductivity of the pristine carbon nanotubes isparticularlyhigh.Owingtotheirone‐dimensionalnature,charge carriers canpass through thenanotubeswithoutany scattering,whichmeans that due to the diminishedJoule heating, thenanotubes can transport huge currentdensities of up to 100 MA/cm2[21]. With this notableexception, the semi‐conducting nanotubes present acarrier mobility of up to 105cm2/Vs[22]. SWNTs arepredisposedtohighconductivityaswell,but inorder torealize this, a transition temperature of 5 K isrequired[23].
2.METHODOFCOMPOSITEMWCNT
N. Venkatesan Prabhu &D. Sangetha [24] studied multipartitioned carbon nanotube (MWCNT) in an oxygencrossover,waterabsorption,andfunctioningofChitosan(CHIT) in a single chambermicrobial fuel cell (SCMFC).CHI T non‐covalently performed MWCNT with CHIT(CHIT–MWCNT), arranged in the shape of membranes,and typified via FTIR,XRD,DRSUV, CD,Raman,SEM, andTEM to rehash the relationship between MWCNT andchitosan. Research outcomes indicated that theMWCNTintegrated chitosan compositemembrane influenced theassets and functions of CHIT within micro biofuelcellHence, CHIT–MWCNT is regarded as a suitablecandidateformicrobiofuelcell.
A.K. Singh [25] pointed out that crystallization kineticsarefunctionalrestrictionstothematerial,thus,thestudydefined the kinetics of Se96Zn2Sb2 (SZS) chalcogenidealloy and its combinations with 0.05% (MWCNT) and0.05% grapheme (GF). The crystallization of kineticrestrictions was obtained from Differential ScanningCalorimetric (DSC) measurement at 5, 10, 15 and 20_C/minheatingratesfromadiversifiedestimateupontheglass transition, onset crystallization, and peakcrystallization temperatures. Afterwards, the Hruby Hrglass shaping capacity parameter, thermal constancy,nucleation and growth order parameter (n), anddimensional parameter (m) of the materials wereinvestigated. The resultswere indicative of the fact thattheobjectswerewithinmultiplekineticparametersfromthe inclusion of MWCNT and GF in SZS. It was alsoconfirmed that MWCNT composite’s glass transitionactivationenergy (Eg), onset crystallization temperature(Ec), and peak crystallization (Ep) exceeded the GFcomposite,whileitwaslessinthecaseoftheparentalloy.However, multiple values for the Hr and thermalconstancy were derived for the composites. Generally,two‐to‐one dimensional nucleation and growthmechanismwereapproximatedfortheseobjects.
P.Jindaletal.[26]experimentallystudiedthemechanicalproperties of (MWCNT‐PC). The composites ofMWCNT‐PC were synthesized via a two‐step method of solutionblending and compression molding. The (MWCNTs)compositions within polycarbonate (PC) were 0.5% to10%wt%.Mechanicalpropertiessuchaselasticmodulusand hardness were determined using thenanoindentation technique. The improvements to themechanical propertieswere in agreementwithpreviouswork on Split Hopkinson Pressure Bar (SHPB). Theimprovementsareassumedtobefromtheenhancedloadtransfer, increased surface area, and optimizedinteraction between the reinforcement and its basematrix.
Superior mechanical properties, such as increasedstrength, stiffness, and aspect ratioof carbonnanotubesrender them the perfect support material fornanocomposites [27]. Load transfer in the context ofcompositeswerestudiedundercompressionand tensileloading conditions in this work. To gauge the materialproperties using representative volume element (RVE)approach, the continuum mechanics model was used.NumericalanalysiswasdonebyFiniteElementModeling(FEM), with the results validated using the rule ofmixture. Both results were in agreement. The influence
Volume 3 Issue 3: 2015 Volume 3 Issue 4: 2015
www.ijset.in ISSN (O): 2348-4098 ISSN (P): 2395-4752
International Journal of Science, Engineering and Technology Page 18

ofthe width and the length of MWCNTs upon theflexibility of the nanocompositeswas analyzed as well.MWCNT was seen as more effective in strengtheningcompositescompared to shorter MWCNTs. This isconfirmed via FEM analysis. The dispersion of 5%MWCNT‐PCwithin thecomposite isdemonstrated inFig2,showingexcellentlevelsofdispersion.
Figure2:SEMimagefor5%MWCNT‐PCcompositeindicatingdispersion[27].
Arash Montazeri [28] fabricated MWNT with hydroxylgroups (MWNT‐OH), while non‐functionalized MWNTwereutilizedtosynthesizeMWNT/epoxycompositesviasonication.Theviscoelasticpropertiesof thecompositesweredeterminedusingthedynamicmechanical,thermalanalysis (DMTA)equipment.Theoutcome indicatedthatadding nanotubes to epoxy alters the viscoelasticproperties. The models of fabricated nanotubes weredeterminedtohaveamoreinfluentialeffectupontheTgcompared to the composites,which incidentally possesssimilar sums of non‐functionalized nanotubes. Theviscoelastic response was plottedusingthe COLE–COLEdiagram from the results gleamed from the DMTA. Theoutcome of the Perez model and the viscoelasticbehaviorsofthecompositearesimilarandfallswithintherangeofagreement.
J.‐C. Zhao et al. [29] discuss the integration of hyperbranched poly (urea‐urethane)‐grafted multi‐walledcarbon nanotubes (HPU‐MWCNTs) into polyurethane(PU)matrix upon poly (ethylene oxide‐tetrahydrofuran)and aliphatic polyisocyanate resin via remedial means.The 9–12 mm thick HPU shell on the MWCNTs werecreated by dispersing MWCNTs and enhancing theinterfacial bond of the PU matrix and MWCNTs,improving thestoragemodulusandTgof thecompositewhile enhancing the thermal constancy of PU. It issurmised that MWCNT composites enhanced thermalconductivity while maintaining electrical resistivity, asopposedtoneatPU.Fig3showstheTEMimagesofHPU‐MWCNT.
Figure3:TEMimagesof(a)HPU‐MWCNTsand(b)magnificationofwhiteframein(a)[29].
D.Silambarasanetal. [30]presentedexperimentalworkon hydrogen uptake of single‐walled carbon nanotubes(SWCNTs‐Ti)‐titanium metal composite. The compositecontains both SWCNTs and Ti powder,fabricated into atabletviacoldpressing.Thecampsitehasbeenpreparedand hydrogenated by evaporating the tablet in ahydrogen‐ambientenvironmentonglasssubstratesusingthe electron beam (EB) evaporation technique. Theobtained hydrogen uptake is due to the cumulativeabsorption of hydrogen by CNTs and Ti nanostructuredmaterials.
K.K.Awasthietal.[31]incorporatedmultiwalledcarbonnanotubes (MWCNTs) via chemical vapor deposition(CVD).Themicehavebeenautopsiedon7,14,21,and28days after contact. The liver has been removed, andpieces of it secured in Bouin’s solution forhistopathological tests. The remaining liver wassubmerged incoldsaline, spotteddry,weighed fast,andhomogenizedinicecoldbuffer.Theactivityofsuperoxidedismutase (SOD) and catalase (CAT) has been quicklyestimated in the supernatant. The MWCNT in the liverwasredirectedtomedicinalissues,suchasdamageinthemacrophages, cellular abscess, ambiguous infection,deathof thecells, andbloodcoagulation.Theevaluationof SOD and CAT is indicative of altered stages withininvestigated groups, as opposed to the directions. Thisbasically means that MWCNTs derived from ignitionwithin the environment might be disastrous to humanhealth.
J. Zhang & D. Jiang [32] adapted a technique that linksMWCNTs, which results in the combination of ethylchloride and amino sets. SEM shows the formation ofhetero‐junctionsofMWCNTswithdiversemorphologies.Afterwards, samples of unspoiled MWCNTs werechemically fabricated and linked, which strengthens theepoxy resin composite produced via cast molding.Malleablepropertiesandthecrack inthesurfacesof thesamples have been looked into as well. The outcomesreflected that comparing unspoiled MWCNTs andchemically fabricated MWCNTs, the chemically linkedMWCNTsdevelopedthecrackdamage,andasaresultofthis, the harshness of the combinations wereconsiderablydeveloped.
J. Zhang et al. [33] posited that inter‐tube bridging ofcarbon nanotubes (CNTs) enhances inter‐tube stresstransfer abilities. It was also mentioned that theinterfacial interactions provided by awall‐to‐wall inter‐tube bridging between two single‐walled carbonnanotubes (SWCNTs) embedded in a polyethylene (PE)
Volume 3 Issue 3: 2015 Volume 3 Issue 4: 2015
www.ijset.in ISSN (O): 2348-4098 ISSN (P): 2395-4752
International Journal of Science, Engineering and Technology Page 19

matrix.Moleculardynamics(MD)modelsoftubepulloutphenomenawasrepresentedbytheembedding(10,10)–(10, 10) SWCNT with interconnections into anamorphousPEmatrix.Thesimulationsdemonstratedthatinter‐tubebridgingimprovesthepulloutenergies,mostlydue to three micro‐mechanics: stress‐induced tubedeformation with localized auxetic effect, ‘‘cuttingthrough’’ (penetration) between linker and matrix, andtheaccompanyingtubepullout.Moreover,theresultsalsopredicted that linkers with long aliphatic chains oraromatic ringsprovide a further increasein the levels ofthe nanotube pullout energies. These are of potentialimportance in guiding the design of CNT/polymercompositesthroughinter‐tubelinkage.
X. Jiang & L.T. DrzalHigh [34] analyzed High DensityPolyethylene (HDPE) compositesbeing strengthenedviaexfoliatedgrapheneandplatelets.Lowmolecularweightparaffinwaxwasused tocoatbothGNPandMWCNT toenhance scattering within HDPE.Wax‐covered GNP andMWCNTwereproducedbycombiningwaxwithGNPandMWCNT in hot xylene, followed by solvent evaporation,andvacuumdrying. It isassumedthat coveredGNPandMWCNT are more proficient in the development ofelectrical conductivity and the flexural properties ofHDPE composites. The description of morphologyconfirmedthatthescatteringofGNPandMWCNTwithinthe polymermatrixwas enhanced via thewax coveringtechnique, which also accounts for the improvedelectrical and mechanical properties in the nanocomposites.
M.R.Ayatollahietal. [35] studied the influenceofmulti‐walled carbonnanotubes (MWCNTs)on themechanizedproperties of epoxy/MWCNT nano‐combinations, andfocused on crack toughness under bending and cut‐offloadingstates.Theyconductedseveralfiniteelement(FE)analysestodecideasuitablecutoffloadinglimitedstatesfor a single‐edge notch, bend sample (SENB),moreover,anequationwasderived inorder toestimate thecut‐offloading crack toughness from the crack load. They sawthat the augmentation in crack toughness of nano‐composite relies on the style of loading. This outcomeindicatedthatthepresenceofMWCNTsinfluencedcracktoughness of nano combinations under cut‐off loadingcompared to the usual loading. They scanned severalelectronmicroscopy(SEM)picturesfromthecrackonthesurfaces in order to focus on its mechanisms. Theoutcomes indicated that the link between thedistinctiveness of crack surface and the mechanicalbehaviorsaremonitoredinthecrackexperiments.
A. Martone et al. [36] analyzed the influence of thebending modulus of dispersed multi‐walled carbonnanotube (MWCNT) within epoxy. The enhancement instrength is divided into two restrictive responses;transition regions alongside the development of apercolate network of nanotubes. The introduction ofCNTsresultedinmaximumstrength,whichissuggestiveofarelationshipbetweenpercolationandstresstransfertheory for large aspect ratio fillers. Fig 4 shows theconductivityofMWCNT/epoxycomposites.
Figure4:ConductivityofMWCNT/epoxycompositespreparedbysonicationaidedDispersionat120_Cvs.
MWCNTwt.%content[36].
J.Zhang&D.Jiang[37]obtainedlinkedMWCNTsfromthefeedbackofethylchlorideandaminosets.SEMindicatesthat hetero‐junctions of MWCNTs with differentmorphologies were shaped. Afterwards, samples ofunspoiled MWCNTs were chemically fabricated andlinked to MWCNTs, strengthening the epoxy resincombinations made by cast molding. Tensile propertiesandcracksurfacesofthesampleswereanalyzedaswell.ComparingMWCNTsandchemicallyfabricatedMWCNTs,the chemically linkedMWCNTs developed crack strains,whichincreasesthetoughnessofthecomposites.
M.N.Akhtaretetal.[38]expandedanewaluminumbasedEMtransmitterandNiZn(Ni0.8Zn0.2Fe2O4)ferritewithand without Multiwall carbon nanotubes (MWCNTs)polymer combinations in the form of magnetic feederswithin a scaled tank. Nano crystalline NiZn(Ni0.8Zn0.2Fe2O4) ferrite and novel Ni0.8Zn0.2Fe2O4‐MWCNTs combinations were synthesized via the solgelmethod. The models were analyzed using XRD, FESEM,HRTEM, and Raman spectroscopy. FESEM micrographsshowed increased grain sizes post‐sintering. The resultsfrom FESEM and HRTEM demonstrated a coating ofNi0.8Zn0.2Fe2O4 on MWCNTs, showing a bettermorphologywhensinteredat750C.Due to its superiormagneticproperty;itwasutilizedasmagneticfeedersforthe the EM transmitter. The wave magnitude wasenhanced when Ni0.8Zn0.2Fe2O4‐MWCNTs polymercompositewasutilized.
H.Choietal.[39]synthesizedacounterelectrodeindyesensitized solar cells (DSSCs) via the formation of(GMWNTs). They created the grapheme layers by dropthrowing on a aSiO2/Si substrate,while (MWNTs)weremanufactured in grapheme layers from iron catalyst bychemical vapor deposition (CVD). The GMWNTs sheetswere displaced from the substrate via buffered oxideetching, and placed on fluorine‐doped oxide glass, withthe van der Waals force acting as a counter electrode.Among all electrochemical impedance spectroscopy andenergy conversion adaptabilities, the electrochemicalproperties of GMWNTs are comparable to those of anMWNTscounterelectrode.TheyproposedGMWNTsasanalternative counter electrode for dye‐sensitized solarcells.
Volume 3 Issue 3: 2015 Volume 3 Issue 4: 2015
www.ijset.in ISSN (O): 2348-4098 ISSN (P): 2395-4752
International Journal of Science, Engineering and Technology Page 20

Sheng‐Hao Hsu et al. [40] expanded upon multi‐walledcarbon nanotube/liquid crystalline epoxy combinationsand focused on the influence of incorporating carbonnanotubes (CNTs) on the morphology, thermal, andmechanicalpropertiesofthecombinations.TheCNTsarefabricated by liquid crystalline (LC) 4, 40‐bis (2, 3‐epoxypropoxy)biphenyl(BP)epoxyresin,asitiseasytodispersetoshapeforlong‐rangepreparedstructures.TheepoxyfabricatedCNT(ef‐CNT)weredispersedwithintheLC BP epoxy resin, and thermally cured using 4, 40‐diamino‐diphenylsulfone for thepurpose ofmolding thecomposite. The curing procedure was observed usingpolarizedopticalmicroscopy.TheresultsshowedthattheLC resin was fabricated to be in parallel with the CNTspossessingdendritic structure firstly togainmicro‐sizedspherical crystalline alongwith fibrous crystalline.Withconsistent scattering and well‐built relations betweennanotubesandmatrix,thecombination,including2.00wt% ef‐CNT, displays excellent thermal and mechanicalproperties.Theoutcomeindicatedthatasthequantityofef‐CNT surpasses 2.00 wt %, the confirmation stage ofcuring has been attained quickly, which decreases thedegree of conversion. Compared to neat resin, thecomposite of 2.00 wt % ef‐CNT enhances the glasstransition temperature by 70.0 _C, the decompositiontemperature by 13.8 ºC, the storagemodulus by 40.9%,andthemicrohardnessby63.3%.
Niraj Nayan et al. [41] fabricated pure aluminum,strengthenedwithcarbonnanotube(CNT)compositebyhigh‐energy attritor milling of up to 48 hrs. The DSCoutcomes showed that an exothermic reaction occurredprior to the thawing of aluminum. They focused on theinfluence of milling time at the start of the exothermicfeedback. The climax temperature of the feedback ofcarbon nanotubes and aluminum is known to bedependent on the heating rate via incessant heating.Noticeableamountsofcommencementenergyisdoubledsubsequent tomilling for 36 hours, compared to 24 hrsmilled models. The method of the feedback kinetics,whichreliedon feedbackorder, is immediatenucleationandonedimensionalincreaseforbothmodels.ShapingofAl4C3hasbeenvalidatedby(XRD)ofas‐milledpowders,and subsequent to acting upon DSC of the milledpowders.
P. Joshi & S.H. Upadhyay [42] studied pack removalinmulti‐walled carbon nanotube (MWCNT) combinationsunder tension and compression packing states. Theyutilized the continuummechanicsmodel toestimate theefficientmaterialpropertiesbymeansofarepresentativevolumeelement(RVE)method.Statisticaloutcomeshavebeen attained by means of Finite Element Modeling(FEM), and these outcomes confirmed the rule ofcombinedoutcomes.ThestudydemonstratedthatMWNTcomposite possesses superior Young’s modulus incompression as opposed to tension, due to the higherinter‐tube load transfer in compression. Proportionally,they also estimated the material properties with singlewalled carbon nan combination. They observed thatmulti‐walledcarbonnanotubecombinationofferabetterresistance against compression compared to singlewalledcarbonnanotubes.TheresultsshowedthatlongerMWNTs strengthen the composite at higher marginscompared to its shorter counterpart. The results from
FEMagreeswiththeexperimentalresults,confirmingitsvalidity.
Ashorietal.[43]studiedtheinfluenceof(MWCNTs)asastrengthening agent upon bothmechanical and physicalproperties. In order to enhance the interfacial bonds,maleic anhydride attached polyethylene (MAPE) wasinserted as a coupling to all the combinations beingstudied. In thisresearch,MWCNTsandMAPEwereusedinterchangeably. The morphology of the samples wasdetermined using scanning electron microscopy (SEM).AtthehighestlevelofMWCNTsloading(3or4wt%),itenhanced the population of MWCNTs as a result ofagglomeration and the blockage to stress transfer. TheadditionofMWCNTs filler, toacertainextent,decreasesthe impact of the combinations in terms of mechanicaland physical properties of the MAPE. The SEMmicrographs also showed the unevenness of the surfacewas the result of MAPE loading from 0 to 4 wt%. Thephysical andmechanical properties of the combinationsconfirmed that MWCNTs resulted inexcellentstrengthening,whiletheoptimumsynergisticoutcomeofMWCNTs andMAPEwere realized at themixture of 1.5and4wt%,correspondingly.
G.Y. Li et al. [44] adjusted carbon nanotubes usingsolutionsofH2SO4andHNO3,scatteredhomogeneouslyinto cement paste via ultrasonic energy. Electricalresistivity and the sensitivity to pressure on theproperties under cyclical compressive packing of thecombinationhavebeenstudiedandplacedside‐by‐sidetothatoftheuntreated‐CNTtoughenedcementpaste.Theoutcomes indicate that the addition of changed orunchanged CNTs towards cement paste resulted in aremarkable reduction in the volume of electricalresistivityandanincreaseincompressivesensitivity.Thesmall structures of these cement combinations werestudied through a scanning electron microscope (SEM).Themicroscopic observation indicates that not only thechanged, but unchanged CNTs were scatteredhomogeneouslywithinthecementmatrix.ForunchangedCNT‐toughenedcementcombinations,CNTswithaglossysurfacewerecrisscrossedandstucktothecementmatrix;the bridging of fractures and a well three‐dimensionalmesh‐workwere also examined. For treating‐CNTtoughenedcementcombinations,thesurfaceofCNTswascoated by C–S–H, resulting in an advanced automaticpower. The contact points of the changed‐CNTs in thecombinations were lesser than that of the unchanged‐CNTs in cement matrix combinations, resulting in ahigher compressive sensitivity and lower electricalconductivity.
S.Konsta‐Gdoutosetal.[45]proposedthatthesignificantautomatic assets of carbonnanotubes (CNT) are perfectcandidates for the high presentation cementationscomposites. However, the most imperative test for theamalgamation of CNTs within cement is its poordispersion. In this work, the effective dispersion of thediversified length of Multiwall carbon nanotubes(MWCNTs) within water was done using ultrasonicenergyandsurfactantscombinations.Theinfluenceofthemethodsuponan0.08‐wt%MWCNTcementcombinationwere studied. The results confirmed the necessity of
Volume 3 Issue 3: 2015 Volume 3 Issue 4: 2015
www.ijset.in ISSN (O): 2348-4098 ISSN (P): 2395-4752
International Journal of Science, Engineering and Technology Page 21

ultrasonicininducingexcellentparticledispersionwithinthe optimal weight ratio of surfactant‐to‐CNTs. Theinfluence ofmultiple properties suchas length, fracture,andmicrostructure was analyzed to derive a composedratioofsurfactant‐to‐MWCNT.Itwasprovenherethattheaddition of MWCNT enhances both the nano andmicromechanicalpropertiesofcementpaste.
Chewaetal.[46]analyzedimprovementsofalternativestoinjectablecalciumphosphatecement(CPC)compositefororthopedic application.ThenewCPC composite ismadeup of β‐tri‐calcium phosphate (β‐TCP) and di‐calciumphosphate anhydrous (DCPA), combined with bovineserumalbumin(BSA)andmulti‐walledcarbonnanotubes(MWCNTs) or fabricated MWCNTs (MWCNTs–OH andMWCNTs–COOH). Scanning electron microscopy (SEM),compressive power experiments, inject abilityexperiments, Fourier change infrared spectroscopy, andX‐ray diffraction were utilized to analyze the results.Compressive power experiments and SEM micrographsshowed that admixtureofBSAandMWCNTstrengthensCPC combinations. MWCNTs and BSA affects themorphology of the hydroxyapatite (HA) crystals in theCPC matrix. BSA promotes the growth of HA fromitssuperficial bonds to the CPC grains. MWCNT–OH andany corresponding combinations showed maximumcompressivepowers (16.3MPa) fallingwithin the rangeoftrabecularbone(2–12MPa).
A. Sobolkina et al. [47] attempted to determine a viablescatteringofcarbonnanotubes(CNTs)thatarebeneficialto cement‐based composites. Currently, (CNTs) withdiversified morphologies are being studied. For ahomogenous dispersion of CNTs in cement matrix, theinfluence ofsanctionson agglomeration of mixed CNTs(anionic/nonionic surfactants) inmultiple settingswerequantitatively examined, alongwith the configurationofaqueousscatteringsofCNTsforusewithincementpaste.The relationship between the quality of CNT‐scattering,sonication time, and surfactant concentration weredetermined using UV–vis spectroscopy. After beingdispersed, nitrogen‐doped CNTswere determined to beindividually broken CNTs. Contrarily, and after thetreatmentofcombinedsingle‐,double‐,andmultiwalledCNTs, a net‐like configuration was found, which isattributed to sonication, making it impossible todifferentiate. The replacement of cement paste that aredispersedwithCNTsincreasedthecompressivemodeby40%, and in certain select cases, tensile modes at highstrain rates were improved as well. However, powerdevelopmentwas lacking,andthis isespeciallypoignantin the case of quasistatic loading. The results frommicroscopyanalysisshowedthat theconfigurationofC–S–HphasesvaryfromonetypetoanotherCNTs.Thisfact,andother supportingdata, confirms the influenceof thebenefitsofadditionofCNTs.
F. Azhari et al. [48] analyzed electrically conductivecombinationsof cementsbyobtainingcarbon fibersandnanotubes and their respective capacities in detectingcompressive load from resistivity modifications. Thereare currently two cement‐based sensors; carbon fibers,andhybridfibers/nanotubes.Conventionalstraingaugeswere also directly compared in the context ofaccumulationof thesensorsamples.Theresultsshowed
that under cyclic loading, resistivity changes will bemirrorsinbothloadandmeasuredmaterialstrainunderhighfidelityforthesensors.Feedbacksarehowever,ratedependentandnonlinear.Inthecaseofrandomloadingsrates,hybridsensors,suchascombinedcarbonfibersandnanotubes, gave better outcomes and are morerepeatable.
H. Li et al. [49] analyzed a current self‐deicing roadstructureutilizingsolarenergy.Itismadeupofacarbonnano‐fiber polymer (CNFP) thermal source, an AlN‐ceramicinsulatedencapsulationlayer,aMultiwallcarbonnanotube (MWCNT)/cement‐based thermal conductivelayer, and a thermally insulated substrate. The electricand thermo‐electric properties of a CNFP, consisting ofindividual carbon nano‐fibers (10–200 NM), wereexaminedaswell.Theadvantageofhighthermo‐electriceffectiveness was confirmed, while of its resistivityproves a piecewise linear temperature‐reliant featureswithin(0–280°C).Onewaytodeterminewhetherornotthe CNFP is well organized is to utilize an AlN‐ceramicwafer(0.5mm)intheformofanelectro‐insulatinglayer.Theresultingstructureisutilizedinbothdeicingandfieldsnow‐melting, and the effect of ambient temperature,heat flux density, and ice thickness were analyzed indetail. The effectiveness, repeatability, charge, and thepossibility of the self‐deicing road structure in bothdeicingand snowmeltingapplicationswereanalyzedaswell. Deicing or snow‐melting performance of the self‐deicingroadstructurewereproposedinthecontextofitsrespectiveindices,withtheoptimalsignificancesforeachparameterbeingdemonstrated.
B. Wang et al. [50] modified multi‐walled carbonnanotubes (MWCNTs) using anionic Arabic gum, whichwasmixedintoPortlandcementpastestostudyitseffecton flexural roughness. The flexural roughness of thecement combinations was analyzed, and the resultsshowed that the presence of nanotubes significantlyenhancesboththefractureenergyandflexuralroughnessindex of Portland cement pastes. The porosity and poresizeofthecombinationsweredeterminedusingmercuryintrusionporosimetry.CementpastewithMWCNTsareoflower porosity, however, it possesses a uniformdistributionofporesize.Themicrostructurewasviewedusing analyzed using FESEM. MWCNT’s flexuraltoughnessplayedtheroleasastrengthenerinthecaseofcement‐basedcombinations,alongsideroughness.
O. Mendoza et al. [51] analyzed the influence of superplasticizer and CA (OH) 2 on the constancy of OHAfabricated multi walled carbon nanotube(MWCNT)/water scatterings manufactured viasonication. The dispersion of MWCNT/water/superplasticizer was quantified using UV–vis spectroscopy.Meanwhile the negative influence of MWCNT wasexaminedwithRAMANspectroscopy,whiletheinfluenceof CA (OH) 2 steadiness within the dispersion wasconfirmedusingZetapotentialandFTIRspectroscopy.Inthis case, it was surmised that Ca(OH)2 influences theconstancy of MWCNT dispersion from the interactionsbetweenthenegativealterationsfromtheOHAfunctionalsets,andthedelaywithinelectrostaticrepulsionbetweenMWCNT and super plasticizer molecules, which willprompttheMWCNTtore‐agglomerate.
Volume 3 Issue 3: 2015 Volume 3 Issue 4: 2015
www.ijset.in ISSN (O): 2348-4098 ISSN (P): 2395-4752
International Journal of Science, Engineering and Technology Page 22

R.Siddique&A.Mehta[52]areoftheopinionthat(CNTs)aremadeupofmajorityelementalcarbonthatconsistofcurved graphene layer, which is asingle layer of carbonatoms in a honeycomb configuration possessinginterchangeablemetalimpuritiesthatarereliantuponitsprocessing parameters. CNT manufacturing is currentlyexperiencing an upheaval of improvement andinnovation,translatingintomassivemarketpresenceanddecreasedcosts.CNTsarewellknownfortheirstrength,determined to be 100 times stronger than the tensilestrength of steel at one‐sixth itsweight, alongside otherexcellent properties. It was proven that CNTs areapplicable in the manufacture of concrete and mortars.Thisworkincludedsomeofthereviewspertainingtotheutilization of CNTs within concrete and mortars. Theinfluence of CNTs upon compressive strength, tensilestrength,modulusofelasticity,flexuralstrength,porosity,electrical conductivity and autogenesis shrinkage arepointedouthereaswell.
H.K. Kim et al. [53] used fumes of silica withinCNT/cement composites to improve the dispersion ofCNTs and its interfacial bondswith hydration products.TheirworkinvolvestheanalysisoftheinfluenceofCNTsupon both mechanical and electrical properties cementcompositeswithsilicafumeinclusion.TheSEMwasusedforqualitativeanalysistoimagesurfacemorphologyandmicrostructure upon multiple loadings of CNTs. Silicafume’s influence upon properties such as porosity,compressive power, and electrical resistance of theCNT/cement combinations were studied as well. It issurmised thatCNTsdispersionvia silica fumespreventsany automated or electrical properties ofCNT/cementcombinations, while CNTs within cement combinationlacking silica fume failed to develop automatic andelectricalbenefitsofthecementcombinations.
3.CONCLUSION
This study analyzed the influence of MWCNTs uponmultiple materials in strengthening the physical,mechanical, thermal, and electrical properties, on top ofanalyzingthe nanostructure of composites. Thecomposites’ mechanical and electrical properties wereimproveddue to the introductionof coupling agents andenhancedinterfacialbonding.TheaddingofMWCNTsasfillers, to some extent,decreased the influence ofcombinations,notonlyonthemechanicalaspect,butalsoupon the developed physical properties. The improvedmechanical properties are proof that MWCNTs aresuitablestrengtheningagentsduetothesynergisticaffectinduced byMWCNT. The results showed that comparedto unspoiled MWCNTs and chemically fabricatedMWCNTs, chemically linked MWCNTs induce crackdamages, and as a result of this, the harshness of thecombinations were considerably enhanced. Electricalresistivity and the sensitivity to pressure upon theproperties under cyclical compressive packing of thecombinationwere analyzed and comparedto that of theuntreated‐CNTtoughenedcementpaste. ItwaspointedoutthattheadditionofalteredorunalteredCNTstowardcement paste results in the reduction of volume andelectrical resistivity, while it increases compressivesensitivity.Theelectricandthermo‐electricpropertiesofaCNFP,consistingof individualcarbonnano‐fibers (10–
200nm),showedthatthebenefitsofhighthermo‐electriceffectiveness were suitable, while the resistivity of theCNFP proved the presence of piecewise lineartemperature‐reliant features within a specifictemperaturerange(0–280°C).Furthermore,aneffectivereinforcement is reliant upon shorter MWCNTs areneeded, while lower amounts of longer MWCNTs areneeded to maintain similar levels of mechanicalperformance. Models of fabricated nanotubes showed amore profound effect upon thin as opposed tocombination models, which have similar values to non‐functionalized nanotubes. Malleable properties andsurfacecracksonthesampleswereanalyzedaswell.
REFERENCES
[1] Peigney, A., Laurent, C., Dobigeon, F., & Rousset, A.(1997). Carbon nanotubes grown in situ by a novelcatalytic method.Journal of materialsresearch,12(03),613‐615.
[2] Li, C., & Chou, T. W. (2004). Modeling of elasticbucklingofcarbonnanotubesbymolecularstructuralmechanics approach.MechanicsofMaterials,36(11),1047‐1055.
[3] Ruoff,R.S.,Qian,D.,&Liu,W.K. (2003).Mechanicalproperties of carbon nanotubes: theoreticalpredictions and experimentalmeasurements.ComptesRendusPhysique,4(9),993‐1008.
[4] Coleman, J. N., Khan, U., Blau, W. J., & Gun’ko, Y. K.(2006).Smallbutstrong:areviewofthemechanicalproperties of carbon nanotube–polymercomposites.Carbon,44(9),1624‐1652.
[5] Thostenson, E. T., Li, C., & Chou, T. W. (2005).Nanocomposites in context.Composites Science andTechnology,65(3),491‐516.
[6] Qian, D., Dickey, E. C., Andrews, R., & Rantell, T.(2000). Load transfer and deformationmechanismsin carbonnanotube‐polystyrene composites.Appliedphysicsletters,76(20),2868‐2870.
[7] Cadek, M., Coleman, J. N., Barron, V., Hedicke, K., &Blau, W. J. (2002). Morphological and mechanicalproperties of carbon‐nanotube‐reinforcedsemicrystalline and amorphous polymercomposites.Applied Physics Letters,81(27), 5123‐5125.
[8] Barber, A. H., Cohen, S. R., &Wagner, H. D. (2003).Measurement of carbon nanotube–polymerinterfacial strength.Applied Physics Letters,82(23),4140‐4142.
[9] Andrews,R.,Jacques,D.,Qian,D.,&Rantell,T.(2002).Multiwall carbon nanotubes: synthesis andapplication.Accounts of Chemical Research,35(12),1008‐1017.
[10] Iijima, S. (1991). Helical microtubules of graphiticcarbon.nature,354(6348),56‐58.
Volume 3 Issue 3: 2015 Volume 3 Issue 4: 2015
www.ijset.in ISSN (O): 2348-4098 ISSN (P): 2395-4752
International Journal of Science, Engineering and Technology Page 23

[11] YuMF, LourieO,DyerMJ,MoloniK, Kelly TF, RuoffRS. Strengthandbreakingmechanismofmultiwalledcarbon nanotubes under tensile load.Science2000;287:637–40
[12] LiuC,FanYY,LiuM,CongHT,ChengHM,DresselhausMS. Hydrogen storage insingle‐walled carbonnanotubes at room temperature. Science1999;286:1127
[13] Bethune,D.S.,Klang,C.H.,DeVries,M.S.,Gorman,G.,Savoy, R., Vazquez, J., & Beyers, R. (1993). Cobalt‐catalysed growth of carbon nanotubes with single‐atomic‐layerwalls.
[14] Iijima, S., & Ichihashi, T. (1993). Single‐shell carbonnanotubesof1‐nmdiameter.
[15] Iijima, S. (1991). Helical microtubules of graphiticcarbon.nature,354(6348),56‐58.
[16] Puretzky,A.A.,Geohegan,D.B.,Fan,X.,&Pennycook,S. J. (2000). In situ imaging and spectroscopy ofsingle‐wall carbon nanotube synthesis by laservaporization.Applied Physics Letters,76(2), 182‐184.
[17] Fonseca,A.,Hernadi,K.,Piedigrosso,P.,Colomer,J.F.,Mukhopadhyay,K.,Doome,R.,...&Nagy,J.B.(1998).Synthesisof single‐andmulti‐wall carbonnanotubesover supported catalysts.Applied Physics A,67(1),11‐22.
[18] Che, G., Lakshmi, B. B., Fisher, E. R., &Martin, C. R.(1998). Carbon nanotubule membranes forelectrochemical energy storage andproduction.Nature,393(6683),346‐349.
[19] Zhou,W.,Ooi,Y.H.,Russo,R.A.A.,Papanek,P.,Luzzi,D. E., Fischer, J. E., ... & Smalley, R. E. (2001).Structural characterization and diameter‐dependentoxidative stability of single wall carbon nanotubessynthesized by the catalytic decomposition ofCO.ChemicalPhysicsLetters,350(1),6‐14.
[20] Elliott,J.A.,Sandler,J.K.,Windle,A.H.,Young,R.J.,&Shaffer, M. S. (2004). Collapse of single‐wall carbonnanotubes is diameter dependent.Physical reviewletters,92(9),095501.
[21] Wei,B.Q.,Vajtai,R.,&Ajayan,P.M.(2001).Reliabilityand current carrying capacity of carbonnanotubes.Applied Physics Letters,79(8), 1172‐1174.
[22] KimBM,FuhrerAMS.Propertiesandapplicationsofhigh‐mobility semiconducting nanotubes. J Phys:CondensMatter2004;16(18):R553–80.
[23] Yao, B., Fleming, D.,Morris,M. A., & Lawrence, S. E.(2004). Structural control of mesoporous silicananowire arrays in porous aluminamembranes.Chemistry of materials,16(24), 4851‐4855.
[24] Prabhu Narayanaswamy Venkatesan, SangeethaDharmalingam, Characterization and performance
studyonchitosan‐functionalizedmultiwalledcarbonnanotubeasseparator inmicrobialfuelcell. JournalofMembraneScience435(2013)92–98
[25] A.K. Singh,Crystallizationkineticsof Se–Zn–Sbnanocompositeschalcogenidealloys.JournalofAlloysandCompounds552(2013)166–172.
[26] Prashant Jindal , Meenakshi Goyal , Navin Kumar ,Mechanical characterization of multiwalled carbonnanotubes‐polycarbonate composites. Materials andDesign54(2014)864–868.
[27] Preeti Joshi, S.H. Upadhyay, Evaluation of elasticproperties of multi walled carbon nanotubereinforced composite. Computational MaterialsSciencexxx(2013)xxx–xxx..
[28] ArashMontazeri , The effect of functionalization onthe viscoelastic behavior of multi‐wall carbonnanotube/epoxycomposites.MaterialsandDesign45(2013)510–517.
[29] Jin‐ChaoZhao,Fei‐PengDu,Xing‐PingZhou,WeiCui, Xiao‐MeiWang ,HongZhu ,Xiao‐LinXie ,Yiu‐WingMai,Thermalconductiveandelectricalpropertiesofpolyurethane/hyperbranched poly(urea‐urethane)‐grafted multi‐walled carbon nanotube composites.Composites:PartB42(2011)2111–2116.
[30] D. Silambarasan , V.J. Surya , V. Vasu , K. Iyakutti ,Investigation of single‐walled carbon nanotubestitanium metal composite as a possible hydrogenstorage medium, international journal of hydrogenenergy38(2013)14654‐14660.
[31] Kumud Kant Awasthi, P.J. John, Anjali Awasthi,KamlendraAwasthi.Multiwalledcarbonnanotubesinduced hepatotoxicity in Swiss albinomice.Micron71(2011)466–470.
[32] Jianwei Zhang, Dazhi Jiang, Interconnected multi‐walled carbonnanotubes reinforcedpolymer‐matrixcomposites. Composites Science and Technology 55(2013)188–194.
[33] JianweiZhang,Dazhi Jiang, Fabrizio Scarpa,Hua‐XinPeng. Enhancement of pullout energy in a single ‐walled carbon nano tube ‐polyethylene compositesystem via auxetic effect. Composites Part A(2013)188‐194.
[34] X. Jiang, L.T. DrzalHigh 2011. Improving electricalconductivity and mechanical properties of highdensity polyethylene through incorporation ofparaffin wax coated exfoliated grapheme nanplatelets and multi‐wall carbon nano‐tubes.Composites:PartA42(2011)1840–1849.
[35] M.R. Ayatollahi ,S. Shadlou, M.M. Shokrieh 2010.Fracture toughness of epoxy/multi‐walled carbonnanotubenano‐compositesunderbendingandshearloading conditions. Materials and Design 32 (2011)2115–2124.
[36] A. Martone, C. Formicola, M. Giordano, M. Zarrelli2010. Reinforcement efficiency of multi‐walled
Volume 3 Issue 3: 2015 Volume 3 Issue 4: 2015
www.ijset.in ISSN (O): 2348-4098 ISSN (P): 2395-4752
International Journal of Science, Engineering and Technology Page 24

carbon nanotube/epoxy nano composites.CompositesScienceandTechnology70(2010)1154–1160.
[37] Jianwei Zhang, Dazhi Jiang 2010. Interconnectedmulti‐walled carbon nanotubes reinforced polymer‐matrix Composites. Composites Science andTechnology71(2011)466–470.
[38] Majid Niaz Akhtar , Noorhana Yahya, KrzysztofKoziol, Nadeem Nasir.2011. Synthesis andcharacterizations of Ni0.8Zn0.2Fe2O4‐MWCNTscomposites for their application in sea bed logging.CeramicsInternational37(2011)3237–3245.
[39] Hyonkwang Choi, HyunkookKim, SookhyunHwang,WonbongChoi, MinhyonJeon 2010.Dye‐sensitizedsolar cells using graphene‐based carbon nanocomposite as counter electrode. Solar EnergyMaterials&SolarCells(2011)323‐325.
[40] Sheng‐HaoHsu,Ming‐ChungWu,SharonChen,Chih‐Min Chuang, Shih‐Hsiang Lin, Wei‐Fang Su 2011.Synthesis, morphology and physical properties ofmulti‐walled carbon nanotube/biphenyl liquidcrystallineepoxycomposites.Carbon50(2012)896‐905.
[41] Niraj Nayan, S.V.S.N. Murty, S.C. Sharma, K. SreeKumar, P.P. Sinha 2011. Calorimetric study onmechanicallymilledaluminumandmultiwallcarbonnanotubecomposites.Sciverse(2011)1087‐1093.
[42] PreetiJoshi,S.H.Upadhyay2013.Evaluationofelasticproperties of multi walled carbon nanotubereinforced composite. Computational MaterialsSciencexxx(2013)xxx–xxx.
[43] Alireza Ashori, Shabnam Sheshmani,Foad Farhanic2012.Preparation and characterization ofbagasse/HDPEcompositesusingmulti‐walledcarbonnanotubes.CarbohydratePolymers(2013)865‐871.
[44] G.Y.Lietal(2007)Pressure‐sensitivepropertiesandmicrostructure of Carbon nanotube reinforcedcement composites. Cement & Concrete Composites29(2007)377–382.
[45] M.S.Konsta‐Gdoutos(2010).Highlydispersedcarbonnanotubereinforcedcementbasedmaterials.CementandConcreteResearch40(2010)1052–1059.
[46] Kean‐Khoon Chewa et al (2011). Reinforcement ofcalciumphosphatecementwithmulti‐walledcarbonnanotubes and bovine serum albumin for injectablebone substitute applications Journal of themechanicalbehaviorofbiomedicalmaterials4(2011)331–339.
[47] A. Sobolkina et al (2012). Dispersion of carbonnanotubes and its influence on the mechanicalpropertiesof thecementmatrix.Cement&ConcreteComposites34(2012)1104–1113.
[48] F. Azhari, N. Banthia (2012). Cement‐based sensorswith carbon fibers and carbon nanotubes for
piezoresistive sensing . Cement & ConcreteComposites34(2012)866–873.
[49] H. Li et al. (2013) Self‐deicing road system with aCNFP high‐efficiency thermal source andMWCNT/cement‐based high‐thermal conductivecomposites / Cold Regions Science and Technology86(2013)22–35.
[50] B. Wang et al (2013). Effect of highly dispersedcarbon nanotubes on the flexural toughness ofcement‐based composites.Construction and BuildingMaterials46(2013)8–12.
[51] O. Mendoza et al (2013). Influence of superplasticizer and Ca(OH)2 on the stability offunctionalized multi‐walled carbon nanotubesdispersions for cement compositesapplication.Construction and Building Materials 47(2013)771–778.
[52] R. Siddique, A. Mehta (2013). Effect of carbonnanotubes on properties of cement mortar /ConstructionandBuildingMaterials50(2014)116–129s.
[53] H.K. Kim et al (2013).Enhanced effect of carbonnanotubeonmechanical and electrical properties ofcementcompositesby incorporationof silica fume/CompositeStructures107(2014)60–69.
BIOGRAPHIES
AbdulRahmanSanadwasborn inIraq. He obtained his bachelors inGeneral ofMechanical Engineeringfrom Iraq.Officerinthe Ministry ofElectricity/Iraq. He is currentlypursuing hisMaster in the field ofapplied mechanics at UniversitiTenaga Nasional, Kajang, Selangor,Malaysia
Email:[email protected]
MohamedAnsariM.NainarPhD*department of MechanicalEngineering, Center for AdvanceMaterials, Universiti TenagaNasional, Kajang, Selangor,Malaysia
JamalO.SameerwasborninIraq.He obtained his bachelors inGeneral ofMechanical EngineeringfromIraq.Heiscurrentlypursuinghis Master in the field of appliedmechanics at Universiti TenagaNasional, Kajang, Selangor,Malaysia.
Email:[email protected]
Volume 3 Issue 3: 2015 Volume 3 Issue 4: 2015
www.ijset.in ISSN (O): 2348-4098 ISSN (P): 2395-4752
International Journal of Science, Engineering and Technology Page 25

AbdulbasitAbdullahwas born inIraq. He obtained his bachelors inGeneral ofMechanical Engineeringfrom Iraq. Officerinthe Ministry ofElectricity/Iraq .He is currentlypursuing hisMaster in the field ofapplied mechanics at UniversitiTenaga Nasional, Kajang, Selangor,Malaysia
Bassam Alaseelwas born in Iraq.He obtained his bachelors inGeneral ofMechanical EngineeringfromIraq.Heiscurrentlypursuinghis Master in the field of appliedmechanics at Universiti TenagaNasional, Kajang, Selangor,Malaysia
Volume 3 Issue 3: 2015 Volume 3 Issue 4: 2015
www.ijset.in ISSN (O): 2348-4098 ISSN (P): 2395-4752
International Journal of Science, Engineering and Technology Page 26

AMETHODOLOGYOFOPTIMALSIZINGFORWINDSOLARHYBRIDSYSTEM
1AVINASHNATHTIWARI,2NAVNITDUBEY
1,2DepartmentofMechanicalEngineering,JagannathUniversity,Jaipur,India
ABSTRACT
Thispaperproposesamethodologytoperformtheoptimalsizingofawindsolarhybrid system.Themethodology focusatfindingtheconfiguration,betweenasetofsystemscomponentstosatisfythedesiredsystemreliabilityrequirements,withthelowestpossiblecost.Due to largenumberofdesign settingand the sporadiquenatureof solarandwindenergy sources itbecomeverychallenging. In the first stepmodellingawind solarhybrid system isconsidered in theprocedureofoptimalsizingmethodology.While in second step optimum sizing of a system is done according to the loss of power supplyprobability(LPSP).
KEYWORDS:optimumsystemsizing;lossofpowersupplyprobability;wind;solar;hybridsystem
1. INTRODUCTION
The rapid depletion and high capital cost of fossil fuelresourcesattractedmuchattentiontowardsurgentsearchforalternativeenergysource.Alternativeenergysourceaswind and solar energy are themost favourable option. Acommandrawbackofwindandsolarenergyistheirwindspeed characteristic and intermittent solar radiation.Theproblem is partially overcome by using these systemstogetherwithastoragecomponent.Thesekindofsystemareknownashybridsystem.
In order to efficiently and economically utilize therenewable energy source, an optimum mixture andselectionofeachcomponentofawindsolarhybridsystemis important. The sizing optimizationmethod canhelp toguarantee the lowest investment and full use of a PVsystem,WG system and battery bank, so that the hybridsystem can work at optimum condition with selectedconfiguration.
Various optimization technique such as probabilisticapproach, graphical construction and iteration techniquehavebeenrecommendedbyresearchers.
Yang el at (2003, 2007) have proposed an iterativeoptimization technique for the loss of power supplyprobabilitymodel for the wind solar hybrid system. Thenumber selected of the PV modules, wind turbine, andbatteriesensurestheloaddemandaccordingtothepowerreliabilityrequirementandthesystemcostisminimised.
Genetic algorithm is introduced by Xu, Kang, Chang, Caofor selecting type and number of PV,WG and battery tosatisfyaconstantloaddemand.
Inthiscontext, thepresentstudypresentsamethodologyfor the optimal sizing of wind solar hybrid system withstoragebatteries.Themethodologyadopted, takenas theideal approach to suggest, between a set of systemcomponents, the type of units and optimal number interms of economic and technical concepts; the loss ofpowersupplyprobability(LPSP).
2. MODELLING OF THE WIND SOLAR HYBRIDSYSTEMCOMPONENTS
A wind solar hybrid system consists of PV array, Windturbine, battery bank, inverter, controller and otherdevicesandcable.TosatisfytheloaddemandPVarrayandwind turbine works togther. The maximum availablepower can be extracted from the PV and Wind powersourcesdependingonbatterychargertechnology. Incaseoflowwindspeedorirradiationconditionbatterybankisusetostoretheenergysurplusandtosupply. .Forawindsolar hybrid system, as shown in Fig.1, three principalsubsystems are included, the PV generator, the windturbineandthebatterystorage.
Figure1:SchematicdiagramofhybridPV/windsystemwithbatterystorage
2.1MODELLINGOFPVGENERATOR
Weather data play as important role in PV moduleperformance, especially solar radiation and PV moduletemperature. The models describing the PV module’smaximumpoweroutputbehavioursaremorepracticalforPV system assessment, as the operation and theperformanceofPVgeneratorisinterestedtoitsmaximumpower.Inthispaper,amathematicalmodelforestimatingthepoweroutputofPVmodulesisused.
Using the solar radiation available on the tilted surfaces,theambienttemperatureandthedatafrommanufacturersfor thePVmodulesasmodel inputs, thepoweroutputof
Volume 3 Issue 3: 2015 Volume 3 Issue 4: 2015
www.ijset.in ISSN (O): 2348-4098 ISSN (P): 2395-4752
International Journal of Science, Engineering and Technology Page 27

the PV generator, PVP , can be calculated with the
followingequations(Markvard,2000):
tmgPV GANP
Where, g ‐ InstantaneousPVgeneratorefficiency, mA ‐
Areaofasinglemoduleusedinasystem(m2), tG ‐Global
irradiance incident on the titled plane (W/m2) , N ‐
Numberofmodules.
All the energy losses in a PV generator, includingconnection losses, wiring losses and other losses, areassumedtobezero.
TheinstantaneousPVgeneratorefficiencyisexpressedbythefollowingequation(Habibetal.,1999)
.)]TT(1[ rctptrg
Where, r ‐ PV generator reference efficiency, pt ‐
Efficiencyofpowertrackingequipmentwhichisequalto1if a perfect maximum power point tracker is used, cT ‐
TemperatureofPVcell(°C),
rT ‐ PV cell reference temperature, t ‐ Temperature
coefficientofefficiency,rangingfrom0.004to0.006per°Cforsiliconcells.
Based on the energy balance proposed by (Duffie et al..,1991), the PV cell temperature can be represented asfollows:
800
20NOCTGTT tac
Where, aT ‐ ambient temperature (°C), (Chedid et al.,
1996;Duffieetal.,1991)
Consequently, the instantaneous PV generator efficiencycanbeexpressedasfollows:
.)1(800
20NOCTG)TT(1 ptrttratptrg
pt , t ,NOCT , mA are parameters that depend on
the typeofmodule,andgivenbythemanufacturerof themodules.
2.2MODELLINGOFWINDGENERATOR
Itisveryimportantforwindsolarhybridsystemtochooseasuitablewindturbine.Therearethreemainfactorsthatdetermine the power output of a wind turbine, ie, thepoweroutputcurve(determinedbyaerodynamicspowerefficiency, mechanical transmission and convertingelectricity efficiency) of a chosen WG, the wind speed
distribution of a selected site where the wind turbine isinstalled, and the tower height.(H. Yang et al. 2008).(Yangetal.,2002;Chedidetal.,1998;Eftichiosetal.,2006;Lysen,1983)takenonthattheturbinepowercurvehasalinear,quadraticorcubicform.(Troenetal.,1989;Bueno,2005) approximate the power curve with a piecewiselinearfunctionwithafewnodes.
As the installation height of thewind turbine has a largeeffectontheenergyavailablefromthesystem,theprocessofadoptingofthewindprofileforheightcanbetakenintoaccountbyusinganequationofheightadjustment.Inthisstudy,thepowerlawisappliedfortheverticalwindspeedprofile,asshowninequationbelow(Ilinkaetal.,2003).
1
H
HV
V
Vr
rr
Where,V ‐WindspeedathubheightH , rV ‐Windspeedmeasured at the reference height rH and 1 ‐ Windspeedpowerlawexponent.
Wind speed power law expansion which varies from (>0.10)forveryflatland,wateroricetomorethan0.25forheavily forested landscape. The one‐seventh powerlaw(0.14) is a good reference number for relatively flatsurfacessuchasopenterrainofgrasslandsawayfromtalltreesorbuilding(Gipe,1995).
2.3 MODELLINGOFBATTERYSTORAGE
Toregulatesystemvoltageandtosupplypowertoloadincase of lowwind speed or low solar radiation, a batterybankisusedwhichisusuallymadeofthelead‐acidtypetostore surplus electrical energy. During the chargingprocess,whenthetotaloutputofPVandwindgeneratorsisgreaterthantheloaddemand,iewhenpowergenerationcannot satisfy load demand requirement, the availablebattery bank capacity at hour t can be described by(Bogdanetal.,1996:,Binetal.,2003):
batinv
LWGPVbatbat
)t(E)t(E)t(E)1).(1t(C)t(C
Ontheotherhand,whentheloaddemandisgreaterthanthe available energy generated, the battery bank is indischarging state. Therefore, the available battery bankcapacityathourtcanbeexpressedas:
)t(E)t(E
)t(E)1).(1t(C)t(C WGPV
inv
Lbatbat
Where, )t(Cbat and )1t(Cbat aretheavailablebattery
bankcapacity(Wh)athourtandt‐1,respectively; bat =
the battery efficiency (during discharging process, thebatterydischargingefficiencywassetequalto1andwhilecharging, the efficiency is 0.65 to 0.85 depending on thechargingcurrent)(Binetal.,2003), =self‐dischargerateofthebatterybank.
Themanufacturerdocumentationgivesaself‐dischargeof25%oversixmonthsforastoragetemperatureof20°C,thatistosay0.14%perday(Markvartetal.,2003).
Volume 3 Issue 3: 2015 Volume 3 Issue 4: 2015
www.ijset.in ISSN (O): 2348-4098 ISSN (P): 2395-4752
International Journal of Science, Engineering and Technology Page 28

)t(EPV and )t(E WG aretheenergygeneratedbyPVand
windgenerators, respectively; )t(E L = the loaddemand
athourtand inv =theinverterefficiency(inthisstudyit
isconsideredasconstant,92%).
Atanyhour,thestoragecapacityissubjecttothefollowingconstraints:
maxbatbatminbat C)t(CC .
Where maxbatC and minbatC are the maximum and
minimumallowablestoragecapacity.
Using for maxbatC the storage nominal capacity batnC ,
then
batnminbat C.DODC
Where DOD (%) represents the maximum permissibledepthofbatterydischarge.
3. MODELLINGOFSYSTEMRELIABILITY
Power reliability analysis has been considered as animportant step in system design process, because of theintermittent solar radiation and wind speedcharacteristics.Severalapproachesareusedtoachievetheoptimal configurations of hybrid systems in term oftechnical analysis. Between these methods, we find theleast square method applied by (Kellogg et al., 1996;Borowyetal.,1994),thetrade‐offmethod(Elhadidyetal.,1999;Gavanidouetal.,1993)and the technicalapproachalso called loss of power supply probability (LPSP)(Abouzahretal.,1990,1991;Hongxingetal.,2002;Yangetal.,2002;).
LPSP is defined as the probability that an insufficientpowersupplyresultswhenthehybridsystem(PVmodule,wind turbineandbatterystorage) isunable tosatisfy theload demand (Yang et al., 2003).A LPSP of 0 means theloadwillalwaysbesatisfied,andLPSPof1meansthattheloadwillneversatisfied(H.Yangalet.2008).Lossofpowersupply probability (LPSP) is a statistical parameter tomeasure of the system performance for an assumed orknownloaddistribution.
Inthispapertheprobabilisticapproachisusedtocalculatethe LPSP in order to avoid computational burden thusPLSP isdefinedas follows: (Mr.SandeepVKaremore,MrShubhashYKamdi).
T
retimePowerfailuLPSP
T
t 0
T
dPowerneedeblePoweravailLPSP
T
t
0
Where
T = No. of hours in the study with hourly weather datainput. The power failure time is defined as that time theloadisnotsatisfiedwhenthepowergeneratedbyboththewind turbine and PV array is insufficient and batterystorageisdepleted.
3.1SYSTEMSIZEOPTIMIZATION
TherequirednumberofWGs,PVmoduleandbatteriesforagivenloaddemandarecalculatedasfollows:
Calculate the hourly energy output from individual windgenerator and PV module for a typical year using windspeedandsolarinsolationofthesite
In order to match the generation with the given hourlyloadofayear,differentcombinationofwindgeneratorandPV module is used. There will be energy deficit duringseveralconsecutivehours inbetween thehoursofexcessenergygenerationforeachofthecombination.Thisclusterofenergydeficitcannotbesuppliesbyrenewablesources.
The combination of wind generator and PV module isselected which minimizes the maximum deficit. Theamount of maximum deficit is used to determine thestoragesizeie.thesizeofthebattery.
Lossofpowersupplyprobability(LPSP)and10‐yearstotalcostofthehybridrenewablepowersystemarecalculatedforeachofthesecombination.
Optimal combination is selected based on desired LPSPandminimumtotalcostofthesystem.
3.2SPECIFICATIONOFPVMODULE
Type Monocrystalinesilicon
Shortcircuitvoltage 37.8V
Shortcircuitcurrent 8.89A
Maximumpowervoltage 31.2V
Maximumpowercurrent 8.18A
Maximumpowerrating 255W
NOCT 45.7C
3.3SPECIFICATIONOFWINDTURBINE
Power 1000W
Cutinwindspeed 2.5m/s
Ratedwindspeed 10m/s
Maximumwindvelocity 40m/s
Hlow 11m
Hhigh 35m
Volume 3 Issue 3: 2015 Volume 3 Issue 4: 2015
www.ijset.in ISSN (O): 2348-4098 ISSN (P): 2395-4752
International Journal of Science, Engineering and Technology Page 29

3.4SPECIFICATIONOFBATTERY
3.5HOURLYLOADOFADAY
4. RESULTSANDDISCUSSION
AcombinationofdifferentwindgeneratorandPVmodulewas used to match the energy generation with the load.There was energy deficit in each group of consecutivehoursofexcessgeneration,foreachofthesecombinations.Maximumamountofdeficit inaclusteramongthesewasdetermined by calculating the total amount of energydeficit in each of these clusters throughout the year. Asimple table was created for this calculation. The firstcolumnshowstheenergygenerationofPVmodule,secondcolumn shows the energy generation of WG and thirdcolumnshowsthedemand.Inthenextcolumntotalenergygeneration byWG and PVmodule is shown. In the nextcolumn difference between generation and demand isfoundnegativesignbeforetheenergydifferenceindicatesthe deficit. In the last column total energy deficit in thisgroup is calculated. It is impossible for renewableenergytomeet thesedeficit directly, for thispurposeweneedastoragesystemie..Batteries.Theexcessenergygeneratedbythissystemcouldstorebychargingthebattery.
4.1CALCULATIONOFTOTALENERGYDEFICIT
4.2COMBINATIONOFWG,PVANDBATTERYBANK
Total cost (including capital cost and maintenance cost,replacement cost and operation cost) and LPSP werecalculatedforeachofthesecombinations.Totallifetimeofthe system is calculated to be 20 years. The systemwassized for loss of power supply probability of zero ie. theloadwill always satisfy the demand. The number ofWG,PV,andbatterywerefound1,33and4thatsatisfyLPSPofzerovaluewithminimumcost.
5. CONCLUSION
The optimal sizing of wind solar hybrid system withbattery storage, using an optimization model has beenpresented in thiswork. Loss of power supply probabilityLPSP concept is used to configure the system reliability.Thecombinationofcomponentswiththelowest levelisedcost of energy is considered as the economical optimalconfiguration.
REFERENCE
1. Abouzahr, I., Ramakumar. R. 1990. Loss of powersupply probability of standalone electric conversionsystems: a closed form solution approach. IEEETransactiononEnergyConv.5(3),445‐452.
2. Abouzahr, I., Ramakumar. R. 1991. Loss of powersupplyprobabilityofstandalonephotovoltaicsystems:aclosedformsolutionapproach.IEEETransactiononEnergyConv.6(1),1‐11.
3. Akai TJ. 1994. Applied numerical methods forengineers,seconded,JohnWileyandSons,NewYork.
4. Athanasia A. Lazou, Anastassios D. Papatsoris. 2000.The economics of PV stand‐alone residentialhouseholds: A case study for various European andMediterranean locations; Solar Energy Materials andSolarCells.62411‐427.
5. Bagul AD, Salameh ZM, Borowy B. 1996. Sizing ofstand‐alone hybrid PV/wind system using a three‐event probabilistic density approximation. SolarEnergy56(4),323‐335.
6. Beyer HG, Langer C. 1996. A method for theidentification of configurations of PV/wind hybridsystems for the reliable supply of small loads. SolarEnergy57(5),381‐391.
7. Bin, A., Hongxing, Y., Shen, H., Xianbo, L.2003.Computer aided design for PV/Wind hybrid system.RenewableEnergy28,1491‐1512.
Batterymodel FullriverAGM
Voltage 12V
Capacity 415Ah
Price 1032($)
Volume 3 Issue 3: 2015 Volume 3 Issue 4: 2015
www.ijset.in ISSN (O): 2348-4098 ISSN (P): 2395-4752
International Journal of Science, Engineering and Technology Page 30

8. Bogdan, S. B. and Salameh, Z. M. 1996. Methodologyforoptimallysizingthecombinationofabatterybankand PV array in a wind/PV hybrid system. IEEETransactionsonEnergyConv.11(2),367‐375.
9. Borowy, B. S., Salameh., Z. M. 1994. Optimumphotovoltaic array size for ahybridwind/PV system.IEEETransactionsonEnergyConv.9(3),482‐488.
10. BuenoC,Carta JA.2005.Technical‐economicanalysisofwind‐poweredpumpedhydrostoragesystems.PartI:Modeldevelopment.SolarEnergy78,382‐395.
11. ChedidR, SalibaY.1996.Optimizationandcontrolofautonomous renewable energy systems. Int J EnergyRes.20,609‐624.
12. Chedid, R., Rahman, S. 1998. A decision supporttechnique for the design of hybrid solarwind powersystems.IEEETransactionsonEnergyConv.13(1),76‐83.
13. DuffieJ.A.andBeckmanW.A.1991.Solarengineeringof thermal of thermal process, the second ed., JohnWileyandSons,Inc.,NewYork.
14. Eftichios K., Dionissia K., Antonis P., Kostas K. 2006.Methodology for optimal sizing of stand alonephotovoltaic/wind generator systems using geneticalgorithms.SolarEnergy80,1072‐1088.
15. Elhadidy,M.A.,Shaahid,S.M.,1999.Optimalsizingofbattery storage for hybrid (wind + diesel) powersystems.RenewableEnergy18,77‐86.
16. Gavanidou,E.S.,BakirtzisA.G.1993.Designofastandalone system with renewable energy sources usingtradeoffmethods.IEEETransactionsonEnergyConv.7(1),42‐48.
17. Gipe, Paul, 1995. Wind energy comes of Age. JohnWiley&sons,p.536.
18. Gomma, S., Seoud, A. K. A., Kheiralla., H. N., 1995;Design and analysis of photovoltaic andwind energyhybrid systems in Alexandria, Egypt. RenewableEnergy6(5‐6),643‐647.
19. Habib MA, Said S.1999. El‐Hadidy MA, Al‐Zaharna I.Optimizationprocedureofahybridphotovoltaicwindenergysystem.Energy24,919‐29.
20. Hongxing,Y;Lu,L.,Burnett.L.J.2002.Probabilityandreliability analysis of hybrid PV/wind powerconversion system in Hong Kong. WREC. cologneGermany.
21. H.Yungelat.2008.Optimalsizingmethod frostand‐alonehybridsolar‐windsystemwithLPSPtechnologybyusinggeneticalgorithm.
22. Ilinka,A.,McCarthy,E.,Chaumel,JL.,Retiveau,JL.2003.Wind potential assessment of Quebec Province.RenewableEnergy28(12),1881‐1897.
23. Johnson GL. 1985. Wind energy systems. EnglewoodCliffs,NJ,:Prentice‐Hall.USA.
24. Karaki, SH., Chedid RB., Ramadan R. 1999.Probabilisticperformance assessmentof autonomoussolar‐wind energy conversion systems. IEEE TransEnergyConv.14(3),766‐772.
25. Kellogg,W.,Nehrir,M.H., Venkataramanan,G.,Gerez.,V. 1996. Optimal unit sizing for a hybrid PV/windgeneratingsystem.Electricpowersystemresearch39,35‐38.
26. Lysen, E. H. 1983. Introduction to Wind Energy,seconded.,SWD82–1Holland.
27. Markvard T. 2000. Solar electricity, the second ed,USA.Willey.
28. Markvart,T.,Castaner.,L.2003.PracticalhandbookofPhotovoltaicFundamentalsandapplications.
29. M. Shafiqur RAhman Tito, Tek Tjing Lie, TimothyAndersen. A simple optimization method for wind‐photovoltaic‐battery hybrid renewable energysystems.
30. Mr. Sandeep V Karemore, Mr. Shubhash Y Kamdi.OptimalsizingofautonomousWind‐PVhybridsystembygeneticalgorithmwithLPSPtechnology.
31. Musgrove ARD. 1988. The optimization of hybridenergy conversion system using the dynamicprogrammingmodel–RAPSODY.Int.JEnergyRes.12,447‐457.
32. Nelson,D.B,Nehrir,M.H.,Wang.C.2005.UnitSizingofStand Alone Hybrid Wind /PV/Fuel Cell PowerGeneration Systems.IEEE Power Engineering SocietyGeneralMeeting(3),2116‐2122.
33. ProtogeropoulosC,BrinkworthBJ,MarshallRH.1997.Sizingandtechno‐economicaloptimizationforhybridsolarPV/windpowersystemswithbatterystorage.IntJ.EnergyRes.21,465‐479.
34. Ramakumar, Nicholas, R., Butler, G., Alonso,Rodriguez, P., Mani, S. 1993. Economic Aspects ofAdvanced Energy Technologies. Proceedings of theIEEE.81(3).317‐333.
35. Troen,I,Petersen,EL.1989.Europeanwindatlas.Firsted.,Roskilde:RisoNationalLaboratory.
36. Yang, H.X., J. Burnett. L. Lu, 2003.Weather data andprobability analysis of hybrid photovoltaic windpower generation systems in Hong Kong. RenewableEnergy28,1813‐1824.
37. Yokoyama R, Ito K, Yuasa Y. 1994. Multi‐objectiveoptimal unit sizing of hybrid power generationsystemsutilizingPV andwind energy. J SolarEnergyEng.116,167‐173.
38. YangLu,L.,Burnett,J.H.X.2002.Investigationonwindpower potential onHongKong islands‐an analysis ofwind power and wind turbine characteristics.RenewableEnergy27,1‐12.
Volume 3 Issue 3: 2015 Volume 3 Issue 4: 2015
www.ijset.in ISSN (O): 2348-4098 ISSN (P): 2395-4752
International Journal of Science, Engineering and Technology Page 31

FISHING TRAILS WITH MODIFIED TWO–SEAM OVERHANG TRAWL- INTRA-SPECIFIC SELECTIVITY STUDIES
1, *N.A.TALWAR, 2B.HANUMANTHAPPA, 1M.T.LAXMIPATHI
1Associate Professor, Dept. of Fishery Engineering, Faculty of Fishery Sciences, W.B.U.A.F.S. Kol-94
2 Professor, Dept. of Fishery Engineering, College of Fisheries (KVAFSU), Mangalore-575002.
*Correspondence author: - [email protected]
ABSTRACT
A two–seam overhang trawl is modified by incorporating the square mesh panels of 45mm mesh size in forward part of upper belly and 28mm mesh size in codend and fishing trails were carried out during day time, off Karwar coast to study the intra-specific selectivity of some important finfishes and shellfishes. The fishing ground was chosen at random, based on the operation of the other commercial trawlers in the vicinity. The retention lengths (L50%,) of some important different finfishes such as Mackerels, Pomfrets, Soles and Ribbon fishes (Trichiurus spp.), clupeids (Sardinella spp.) and Silver bellies (Leiognathus spp.) and some shell fishes such as Metapenaens sp.and Parapenopsis sp. were estimated and compared those with their size at sexual maturity for intra-specific selectivity .
Key words: Two–seam over hang trawl; Square mesh; Finfishes, shellfishes 50% of retention length (i.e.L50%).and sexual maturity
1. INTRODUCTION
Selective fishing refers to a fishing method’s ability to target and capture organisms by size and species during the fishing operation allowing non-targets to be released unharmed. The mesh size and shape of codend meshes are selected so as to exploit the desired size groups and avoid capture of smaller ones in order to conserve the fishery resources. Chun Chun et al. (1991) observed that the diamond mesh becomes narrow at the middle of the codend causing the mesh lumen to be almost closed during trawling and hence the probability of escapement of undersized and juveniles are in remote. Similar Robertson & Stewart (1988) observed that the codend when filed assumes bulbous shape and the fish escape through a small area of open meshes in front of the bulb, while forward of this point most of the meshes are stretched and closed. Pope (1966) stated that the shape of mesh affects the selectivity of codend. Further; the flow of water also depends on the shape of mesh. Hence for improving the filtering efficiency of mesh, the mesh has to remain open, facilitating more water flow and easy escape of young ones of fish. This can be achieved by using square mesh codends as this will remain open while in operation. The superiority of square mesh over diamond mesh in facilitating escapement of smaller ones has been proven by many workers (Robertson, 1982; 1983; 1986a, & b; Robertson et.al., 1986; Robertson & Stewart, 1988; Kunjipalu & Varhese, 1989; Kunjipalu et.al., 1994; Talwar & Sheshappa, 1996 and Talwar.et al., 2006)
The present fishing trials were carried out to study the intra-specific selectivity of some important finfishes and shellfishes by estimating their 50% of retention lengths (i.e.L50%) caught in modified two–seam over hang trawl and compared those with their size at sexual maturity.
2. MATERIALS AND METHODS
A two-seam over hang trawl of size 25.26m/35.76m (headline/fishing line) was modified by rigging with square mesh panels of 45mm mesh size in forward part of upper belly and 28mm at codend. The specifications of this modified trawl were represented in data sheet and the dimensions and construction characteristics of net was shown in figure.1
The 13.36m OAL wooden stern trawler, fitted with Ruston engine developing 102 BHP at 1800r.p.m.was used for fishing trials. Flat rectangular otter doors measuring 1500mm x 750mm and weighing 65kg each made up of wood and iron were used. A set of nine spherical aluminum floats each of 18.2cm diameter and 2.62kgf buoyancy force and equal number of sinkers weighing 50kgs each were used for the trawl to get the adequate buoyancy force and sufficient sinking force respectively.
Fishing cruises were conducted randomly off Karwar between 24 and 34 isobaths. The towing duration of one and half hour, towing speed of 2knots and scope ratio of 5: 1 was maintained throughout the course of study for all samples.
Total twelve hauls were made throughout season. The catch composition as well as lengths of individuals of different dominant finfishes and shellfishes obtained during each haul and their co-efficient of variations were recorded.
In order to determine the 50% of retention lengths (i.e.L50%) of dominant fin fishes and caught, the length frequency distribution were calculated, where the median lengths of the dominant finfishes and shellfishes were considered instead of mean lengths because any chances of occurrence of few large size fishes in the catch will not affect the medial length.
Volume 3 Issue 3: 2015 Volume 3 Issue 4: 2015
www.ijset.in ISSN (O): 2348-4098 ISSN (P): 2395-4752
International Journal of Science, Engineering and Technology Page 32

The total catch was recorded during different hauls and efficiency was judged by Mann Whitney ‘U’ test (Weber,
1973, Daniel 1977).
DATA SHEET: Specifications of modified Two-Seam overhang trawl
LINES AND ROPES
PARTICULAR OF OTHERACCESSORIES
Volume 3 Issue 3: 2015 Volume 3 Issue 4: 2015
www.ijset.in ISSN (O): 2348-4098 ISSN (P): 2395-4752
International Journal of Science, Engineering and Technology Page 33

Figure 1: The Dimensions and Construction Characteristics of modified Two-seam overhang Trawl.
3. RESULTS AND DISCUSSION
Result of Mann Whitney ‘U’ test for total catch during different hauls in modified two-seam overhang trawl shown that there was no significant difference between the average catches obtained during different hauls at 5% level.
Table 1 shows the length ranges with their co-efficient variation of some finfishes and shellfishes caught in modified two-seam trawl with square mesh panels of 45mm mesh size in forward part of upper belly and 28mm at codend. Figure 2a,b,c and 3 gives the percentage cumulative frequency curves for the some important finfishes and shellfishes respectively from which the median lengths (L50%,) are measured. All these curves are of sigmoid or S-shape indicating the normal distribution of finfishes and shellfishes in the length range.
3.1 FINFISHES
Mackerels (Rastrelliger kanagurtha):
The length range of mackerel caught in modified two seam over hang trawl codend was from 12 to 26cm (Table 2).The ogive curve indicates the median length of mackerels (L50%,) caught in square mesh codend was 15.8cm (Fig.2a).Bal and Rao (1990) have reported that, the size of Indian mackerel (R. kanagurtha) at first sexual
maturity in 22.4 cm and all fish below size are to regarded as juvenils.The mackerel fishery is mostly supported by juveniles. However, from its median lengths (L50%,) , it is evident that the modified two seam trawl is not regarded as suitable for caching mackerel and cannot be judged as index of size selectivity for this species. In other words it can be concluded that the square mesh openings of45mm at forward part of upper belly and of 28mm at codend are not enough to escape the juveniles of mackerels.
Clupeids (Sardinella spp.):
The length range of clupeids (i.e.Sarinella spp.) caught in two- seam trawl with square mesh panels of 45mm mesh size in forward part of upper belly and 28mm at codend ranging from 10 cm to 18 cm .It can be seen from the table 2 that the 50% retention of fishes caught in codend was around 10.5 cm (Fig.2a).
Mature and spawning individual of clupeids are of the size range of 10-10.9 cm in length (Nair, 1951). Attainment of sexual maturity at even smaller length of 8 cm or 9 cm has been reported (Chidambaram and Venkataraman, 1946). The length ranges as well as the median lengths (L50%,) caught in the gear indicates that, the modified two-seam overhang trawl catches matured clupeids only which shown better selectivity of this species.
Pomfrets (Pampus spp.):
Good numbers of pomfrets (Pampus spp.) were caught in two-seam over hang trawl with square mesh panels of 45mm mesh size in forward part of upper belly and 28mm at codend. The length ranges recorded were i.e.10-26 cm and their co-efficient variation is 27.2% (Table 2). The medial lengths (L50%,) of fishes are found to be 16.4cm. (Fig.2b). Kuthalingum (1963) has reported that size at maturity of Pampus argentus ranges from 16 to 18 cm and matured specimens have a length range of 10-21 cm .Thus, the trawl with square mesh panels of 45mm mesh size in forward part of upper belly and 28mm at codend is not selective on these species because body shape is oval and escapement through this mesh size is difficult.
Silver bellies (Leiognathus spp.):
The length ranges of silver bellies (Leiognathus spp) were caught in this trawl with square mesh panels of 45mm mesh size in forward part of upper belly and 28mm at codend are i.e.8-16cm. (Table 1 and 2).and median lengths (L50%,) are around 9.2cm (Fig.2b).
Balan (1967) has reported that the minimum size at first sexual maturity for Silver bellies (L.bindus) is 8.7 cm.Form the present investigation, it is clear that the gear with square mesh panels of 45mm mesh size in forward part of upper belly and 28mm at codend catch matured size of Silver bellies (Leiognathus spp.).In other words it could interpret that there will be enough openings of square meshes of 45mm size at forward part of upper belly and at codend of 28mm size to escape the juveniles.
Volume 3 Issue 3: 2015 Volume 3 Issue 4: 2015
www.ijset.in ISSN (O): 2348-4098 ISSN (P): 2395-4752
International Journal of Science, Engineering and Technology Page 34

Soles (Cynoglossus.spp):
The length ranges of soles caught in the trawl with square mesh panels of 45mm mesh size in forward part of upper belly and 28mm at codend are 10-24cm (Table 1). But the 50% retention lengths (median lengths) of these species are 11 cm (Fig.2c).Sheshappa and Bhichachar (1954) reported that the minimum size at first maturity of Malabar sole is12cm.Hence, it is evident that this gear has tendency to catch immature ones and it may be concluded that modified two seam overhang trawl with its openings of 45mm square meshes at forward part of upper belly and 28mm at codend are not ideal for selectivity of this species.
Ribbon fishes (Trichiurus.spp):
The maximum size of Trichiurus.spp.caught in modified two-seam overhang trawl. The median length (L50%,) of fishes caught in this gear with square mesh panels in forward part of upper belly and codend is 28.6cm (Table 1 and Fig2c).Bal and Rao (1990) have reported that the minimum size at maturity is 47-48 cm for Trichiurus lepturus.This tends to show that ribbon fishes caught in this gear are not of matured size. Hence 45mm square meshes at forward part of upper belly and 28mm at codend is not selective of Trichiurus.spp.
3.2 SHELL FISHES
Metapenaeus sp.:
The length of Metapenaeus sp. caught in two-seam overhang trawl with square mesh panels of 45mm mesh size in forward part of upper belly and 28mm at codend
ranges from 70mm to 140mm and its median length (L50%) is 9.8cm (Fig. 3). Bal and Rao (1990) have reported that the minimum size of sexual maturity of Metapenaeus sp. is 8.86 cm. Hence it is evident that in modified trawl by incorporating the square mesh panels of 45mm mesh size in forward part of upper belly and 28mm at codend catches mature species of Metapenaeus sp.So it may be concluded that this gear with square mesh openings at forward part of upper belly and codend could be selective for this species of peneaids
Parapenopsis sp:
The length of Parapenopsis sp. caught in modified two-seam overhang trawl ranges from 70mm to 150mm and its median length (L50%) is 10.0cm (Fig. 3).Bal and Rao (1990) have reported that the minimum size of sexual maturity of Parapenopsis sp. is 6.5cm in males and 7.0cm for females and their maximum growth rate is 9-10 cm in the first year. Hence it clear that this trawl with square mesh panels of 45mm mesh size in forward part of upper belly and 28mm at codend catches matured and maximum sized shrimp of Parapenopsis sp. Therefore this gear has well selective for Parapenopsis sp.
However, further studies covering all commercially important species of finfishes and shellfishes are required for optimisation of square mesh size with respect to their size at first sexual maturity as well as fishing areas, in order to provide recommendations and informations to the users like fishermen, scientific community, policy makers etc that use the square meshes in different parts of trawl and in codend as management measure.
Volume 3 Issue 3: 2015 Volume 3 Issue 4: 2015
www.ijset.in ISSN (O): 2348-4098 ISSN (P): 2395-4752
International Journal of Science, Engineering and Technology Page 35

Table 1: Length Ranges (in cms) of few important fin fishes and shell fishes caught in Modified Two-Seam overhang Trawl.
Table 2: Length frequency distribution of few imp. finfishes and shell fishes caught in Modified Two-Seam overhang Trawl.
Volume 3 Issue 3: 2015 Volume 3 Issue 4: 2015
www.ijset.in ISSN (O): 2348-4098 ISSN (P): 2395-4752
International Journal of Science, Engineering and Technology Page 36

Mackerels (Rastrelliger kanagurtha) Clupeids (Sardinella spp.):
Figure 2a: Percentage cumulative frequency curves for some important fin fishes caught in modified two-seam overhang trawl.
Pomfrets (Pampus spp.) Silver bellies (Leiognathus spp.)
Figure 2b: Percentage cumulative frequency curves for some important fin fishes caught modified in two-seam overhang trawl.
Soles (Cynoglossus.spp) Ribbon fishes (Trichiurus.spp
Figure 2c: Percentage cumulative frequency curves for some important fin fishes caught modified in two-seam overhang trawl.
Volume 3 Issue 3: 2015 Volume 3 Issue 4: 2015
www.ijset.in ISSN (O): 2348-4098 ISSN (P): 2395-4752
International Journal of Science, Engineering and Technology Page 37

Metapeneaus spp Parapenopsis sp
Figure 3: Percentage cumulative frequency curves for some important shellfishes caught in modified two-seam overhang trawl
REFERENCE
Bal, D.V. and Rao, K.N., 1990. Marine Fisheries Tata McGraw Hill publishing company (Books) Ltd, New Delhi 20 (4th edition): 459pp.
Balan, V., 1967.Biology of silver belly Leiognathus bindus (val) of Calicut Coast: Indian J.Fish.10 (1):118-134.
*Chidambaram.K and Venkataraman,R.S. 1946.Tabular Statements on the fishery of certain marine food fishes of the Madras Presidency-West Coast.Govt.Press.:1-26.
*Chun-Chun-Te, Matuda, K and Honda, M.1991.Bull.Jap.Soc.Fish.57 (7):1313pp.
Daniel.W.W.1977. Introductory statistics with Application. Houghton Miffon Company London: pp 473.
*Kuthalingum, M.D.K., 1963.Observations on the fishery and Biology of the Silver Pomfret Pampus argentus (Euphrasen) from the Bay of Bengal: Indian J.Fish.10 (1):59-73.
Kunjipalu, K.K and Varghese, M.D.1989. Paper presented at the First Kerala Science Congress, 26-28February, 1989.Cochin, India.
Kunjipalu, K.K., Varghese, M.D and Nair, A.K.K. 1994. Studies on square mesh codend in trawls-I. Studies with 30mm mesh size .Fish Technol.Kochi.31 (2): 112-117p.
*Nair, R.V.1951.Proc.Indo.Pacif.Fish.Coun., Sec.2.p.103
Pope, J.A.1966.Manual of Methods for Fish Stock Assessment-Part III. Selectivity of Fishing Gear. FAO, Fisheries Technical Paper.No.41.
Robertson, J.H.B.1982. Square mesh codends Scottish Fisheries Working Paper, 3:11p
Robertson, J.H.B. 1983 Square net help young fish escape.Fish.News, (3652):10-11p
Robertson, J.H.B.1986a Design and construction of square mesh cod ends. Scott.Fish.
Information.Pam. (12):10pp.
Robertson, J.H.B.1986b. Square mesh codends Scott. Fish. Bull., (49):15-16
Robertson, J.H.B., Emslie, D.C., Ballantyne, K.A.and Chapman, C.J. 1986. Square and diamond mesh trawl codend selection trials on Nephrops norvegiucus Copenhagen-Denmark-ICES-1986/B: 12 (12):14pp
Robertson, J.H.B. and Stewart P.A.M.1988 .A comparison of size selection of haddock and whiting by square and diamond mesh codends. J.Counc.CIEM 44 (2):148-161.
*Sheshappa.G and Bhichachar.B.S.1954.Indian.J.Fish. I: 145-62.
Talwar.N.A and Sheshappa.D.S. 1996 .Effect of square mesh panels in trawls on shrimp fishery off Mangalore. In: The Fourth Indian Fisheries Forum Proceed. 24-26.November, 1996, Kochi: 445-447 p.
Talwar.N.A ., Sheshappa. D.S. and Hanumanthappa. B. 2006. Reduction of by-catch in two–seam over hang trawl using a square mesh panels in forward part of upper belly and codend. J.Environ. & Sociobiol.: 3(2): p 143-146.
Weber.R.1973. Non-parametric methods, In: Bio-statistics in Pharmacology: Vol-2, Dehaunois, A.L. (Ed) and Pergamum .press (New York): 675-716.
* Not refer to original
Volume 3 Issue 3: 2015 Volume 3 Issue 4: 2015
www.ijset.in ISSN (O): 2348-4098 ISSN (P): 2395-4752
International Journal of Science, Engineering and Technology Page 38

EXPERIMENTALSTUDYOFLOCALSCOURAROUNDCIRCULARCOMPOUNDBRIDGEPIER
1PROF.P.T.NIMBALKAR,2S.S.THORAT
1Professor,DepartmentofCivilEngineering,BharatiVidyapeethDeemedUniversity,CollegeofEngineering,Pune,INDIA
2M.Tech.Scholar,HydraulicEngineering,BharatiVidyapeethDeemedUniversity,CollegeofEngineering,Pune,INDIA
ABSTRACT
Localscouraroundthecircularbridgepierinalluvialchannelismainfactorforfailureofhydraulicsstructuressuchasbridgepier,abutmentetc.Itisacomplexphenomenon.Localscouraroundbridgepierisdependsuponthedepthofflow,Discharge,GeometryofPier,Typesofsedimentparticles.Manyresearchershavestudiesonscourarounduniformcrosssectionofpierwithoutconsideringtheeffectoffootingofbridgepier.Butthestudyonscourundersteadyconditionforcompoundbridgepiersislimited.Inpresentstudy,theexperimentalworkwascarriedoutondifferentgeometryofcompoundbridgepierunderclearwater scour conditionwithuniformandnonuniform sediments.The compoundbridgepierwasplacedatavariouslocationwithrespecttoinitialbedlevel.i.e.thetopleveloffoundationatbedlevel,topleveloffoundationbelowbedlevelandtopleveloffoundationabovebedlevel.Itisobservedthatthemaximumscouroccurswhenthefoundationtopaboveinitialbed leveland it isreduceatbed levelandbelowbed level. It isalsoobserved thatthere isreductionscour innonuniformsedimentascompareuniformsediment.
KEYWORDs:‐Bridgepier,Sediment,Scour,Compoundpier,Foundationetc.
1. INTRODUCTION
The process around the bridge pier in which reduceselevationofinitialbedlevelofstreamduetodegradationof bed soil due to flowing water. It is main factor forfailureofhydraulicsstructures i.e.bridgepier, abutmentetc.Localscourisathreedimensionalprocesscausedbyvariousagentslikechangestheflowconditionofchanneldue to construction of bridge pier, flood , humaninterferences etc. Out of 500 bridges collapsing in theunited state since 1951, it was reported that 60% ofbridgecollapsingduetobridgepierscour.Therefore thestudy of phenomenon of local scour around the bridgepier has become the important topic in hydraulicengineering.
Todeterminethemaximumdepthofscouraroundbridgepier is important frompointof viewbydesignofbridgepier foundation.Local scour is complicatedphenomenondue to three dimensional flow separation on upstreamside of bride pier and sediment load transport. Lots ofresearchworkhasbeendoneonthistopicforbasicallytoderivingtherelationshipformaximumdepthofscour,tounderstanding the mechanism of local scour and itscontrol. Therefore the large amount of researchwork isavailable on the topic of bridge scour and its protectionHowever, only a few studies are available so far on theflow field around the bridge elements. The flow patternwithin the scour hole around circular uniform bridgepiers have been studied through laboratoryexperimentationbyfollowinginvestigatorbyMelvilleandRaudkivi(1977), Deyetal.(1995), Ahmedand Rajaratnam(1998), Grafand Istiarto (2002),Muzzammil andGangadhariah (2003) and Deyand Raikar (2007). Theseinvestigations have mainly study on scour around suchpiers which have uniform cross section(orgeometry)along their height but without considering the effect offooting of bridge pier. But actual site (in field work)
bridge piers are constructed in different types of shapeand sizes and many of them can have varying uniformcrosssectionsalongtheirheights,thensuchtypesofpierare known as compound piers (ornon‐uniform piers).KumarandKothari(2012)conductedexperimentalwork on the flow pattern and turbulencecharacteristics around the circular uniform and nonuniformpiersinthepresenceofscourholeusinganADV.Luetal (2011)have recentlyproposeda semiempiricalmodel to estimate the temporal variation of local scouraround compound bridge pier without exposedfoundation.
Thelocalscouraroundthebridgepieristimedependentprocess. It is always show in the graphical form byplotting themaximum scour depth versus the time. It isvery difficult to calculate the correct maximum scourdepth in the given time due to the complex threedimensionalphenomenon.Thereforemanymethodshavebeen used to developing the relationship betweenmaximum equilibrium scour depth and time. Manyattempt to describe phenomenon of the temporalvariation of local scour around bridge pier have beenmadebymanyauthorsinthelast50years.Andtheyshowthat the temporal variation around the bridge pier isdependentontheflowcondition,typesofsediment,shapeofbridgepieretc.
Thecircularcompoundbridgepierdefinedasthecircularbridge pier is placed on the bigger diameter of circularfoundation and such geometry piers foundation aremostlyusedinbridgesubstructuresinIndia.
2. EXPERIMENTALSETUP
Theexperimentalworkwerecarriedinaglassbothsidesrectangular titling flume having 10m long, and crosssection of 0.30m in width and 0.50m depth in thehydraulics laboratory at the department of civil
Volume 3 Issue 3: 2015 Volume 3 Issue 4: 2015
www.ijset.in ISSN (O): 2348-4098 ISSN (P): 2395-4752
International Journal of Science, Engineering and Technology Page 39

engineering,BharatiVidyapeethDeemedUniversityPune,Maharashtra, India. The titling flume is consists of twocontrolling gates, one gate upstream side of flume isknown as inlet gate and other gate at downstream offlumeisknownasoutletgate.Watersuppliedintotiltingflumefromaundergroundwatertankconstructedbelowthefloorofthehydraulicslaboratorybyusingcentrifugalpump. For calculating discharge sharp crestedweirwasfitted at downstream of re‐circulating channel. Therehbock weir equation was used to determine thedischarge for the experimental work. The flow rate isadjusted by inlet valve. The required water depth isadjustedbyusingtheoutletgate.Thedepthofwaterlevel,initialbed levelanddepthofscour ismeasuredbyusingpointgauge. Theworkingsection0.70mlong,0.3m inwidth and 0.1m in thickness located from 4.5mfrom the upstream side of titling flume. The workingsection filled with sediment particles. The compoundpiers of different sizes were used in this experimentalwork.Thecompoundpierwereplacedattheverticallyatthe middle portion of the working section of the titlingflume (Sediment area). The bed was levelled before thestartingofflowofthetitlingflume.Theinitiallevelofbedwasmeasuredbyusingthepointagauge.Theclearwaterscourconditionwasmaintainedduringtheexperimenti.e. ratio is less thanone,whereV=approach flowvelocity
andVc=Critical velocity calculatedbyusing thed50 andshieldsmethod(GardeandRangaRaju2006).
2.1PIERMODEL
ThetwodifferenttypescompoundpierswasmadeupofPVCpipes,aregivenbelow,
1. Thediameterofpierwastakenas3cmanddiameteroffoundationwastakenas6cm
2. Thediameterofpierwas takenas3cmanddiameteroffoundationwastakenas7.40cm
Thetopleveloffoundationofcompoundbridgepierwasplaced at different location Ywith respect to initial bedlevel. In this work, the following three cases areconsidered,
Case:‐A Top levelof foundation is takenas1cmabovetheinitialbedlevel.
Case:‐BTopoffoundationistakenasatinitialbedlevel.
Case:‐CTopoffoundationistakenas1cmbelowinitialbedlevel.
2.2TYPESOFSEDIMENTMATERIALSUSED
The bed material was a mixture of river sand withdifferentparticlesizesvaryingrangefromthesedimentfilled in the working section up to thickness of 10cm.Mechanical sieve analysis was used to determine therelative proportion of different particle size in a givensediment sampleThree samples of sediments arepreparedasgivenbelow,
SampleNo:‐1d50=1mmandstandarddeviation=1.14
Sampleno:‐2d50=1mmandstandarddeviation=1.68
Sampleno:‐3d50=1mmandstandarddeviation=2
3. RESULTANDDISCUSSION
TableNo.1.ExperimentalDataforuniformsediment
Sr.No.
Pierdiameter bmm
FoundationDiameter b*mm
Footingelevationw.r.t. BedlevelYmm
FlowdepthD inmm
Approachvelocity offlowVm/s
Criticalvelocity ofsedimentmotion Vcm/s
Mediangrainsize
d50mm
Geometricstandarddeviationσg
1 30 60 ‐10 84 0.32 0.378 1 1.14
2 30 60 0 84 0.32 0.378 1 1.14
3 30 60 10 84 0.32 0.378 1 1.14
InthisV is theapproachvelocityof flowcalculatedfromthe know discharge and depth of flow for a singledischargevalue.Duringtheexperimentalworkdischargeis adjusted by inlet valve and outlet gate. The dischargecan be calculated from the Rehbock equation.Depth offlow is measured in the titling flume for particulardischarge values and the approach velocity of flow iscalculatedbyusingthecontinuityequation.
Using Shields chart for threshold condition of uniform
sediments in water (Melville and Sutherland 1988) theshear velocity u*c corresponding to d50 is obtained .Theshear velocity u*c is converted tomean shear velocityVcby the logarithmic form of velocity profile given inequation1
∗ 5.75 log 5.53 (1)
Similarly required data is obtained for non uniformsedimentsandgivenbelowintable2
Volume 3 Issue 3: 2015 Volume 3 Issue 4: 2015
www.ijset.in ISSN (O): 2348-4098 ISSN (P): 2395-4752
International Journal of Science, Engineering and Technology Page 40

Table2ExperimentalDataforNonUniformsediments.
Sr.No. Pierdiameter
bmm
Footingdiameter
b*mm
Footingelevationw.r.t. Bedlevel
.Ymm
Flowdepth
Dmm
Velocityofapproachflow
Vm/s
Criticalvelocityforsedimentmotion
Vam/s
Mediangrainsize
d50mm
Geometricstandarddeviationσg
1 30 60 ‐10 78 0.36 0.397 1 1.68
2 30 60 0 78 0.36 0.397 1 1.68
3 30 60 10 78 0.36 0.397 1 1.68
4 30 60 ‐10 90 0.253 0.418 1 2
5 30 60 0 90 0.253 0.418 1 2
6 30 60 10 90 0.253 0.418 1 2
7 30 74 ‐10 90 0.253 0.418 1 2
8 30 74 0 90 0.253 0.418 1 2
9 30 74 10 90 0.253 0.418 1 2
Themethod todetermineVa is given inMelville (1997).ThusVa=0.8Vca
Vca can be determined from logarithmic formof velocityprofile
∗ 5.75 log 5.53 (2)
Inthisu*caiscriticalshearvelocityford50asizeandd50aismedian armour size. Shear velocity is determined fromShieldsdiagramforrespectivesizes.
The particle size d50a is found using the Expression asgivenbyChin(1985)
d50a= . (3)
dmax is the maximum particle size determined fromparticlesizedistribution.
Theexperimental resultsareshown ingraphical formtoobservedscourdepthversustimeasgivenbelow,
Case:‐ I pier Diameter =3cm and footing diameter =6cmwithuniformsediment(d50=1and 1.16
Figure1:Temporalvariationofscourdepthinuniformsediments
Case:‐ IIpierDiameter=3cmand footingdiameter=6cmwithuniformsediment(d50=1mmand 1.68
Figure2:TemporalvariationofscourdepthinNonuniformsediments
Case:‐IIIPierDiameter=3cmandfootingdiameter=6cmwithuniformsediment(d50=1mmand 2
Volume 3 Issue 3: 2015 Volume 3 Issue 4: 2015
www.ijset.in ISSN (O): 2348-4098 ISSN (P): 2395-4752
International Journal of Science, Engineering and Technology Page 41

Figure3:TemporalvariationofscourdepthinNonuniformsediments
Case:‐ IV Pier Diameter =3cm and footing diameter=7.4cmwithuniformsediment(d50=1mmand 2)
Figure4:TemporalvariationofscourdepthinNonuniformsediments
4. CONCLUSION
Thefollowingconclusionsarebasedontheexperimentalwork on the scour development process around thecompoundbridgepierwithvaryingthefoundationdepthwithrespecttoinitialbedlevelofchannel.
1. In the uniform sediment particles the top level offoundationwasplacedabovetheinitialbedlevelthemaximum scour depth occurs due to more area offoundationwasexposedtotheflowingwater.
2. Whenthetopleveloffoundationwasplacedattheatinitial bed level with uniform sediment, then scourdepthreducesascomparetoabovecondition.
3. When the top level of foundation placed below theinitialbedlevelfurtherreductionwasobservedinthescourdepth.
4. Samepatternof scourwasobserved innonuniformsedimentforthethreecasesasmentionedaboveonlyoverall reduction of scour depth was observed ascomparedtouniformsedimentasthereisarmouringactioninnonuniformsediment.
5. When the standard geometric deviations increases,then scour depth decreases and for higher valuearmouring effect occurs on the upstream side ofbridgepier.
REFERENCES
1) Ahmed,F.,Rajaratnam,N.,1998.Flowaroundbridgepiers.J.Hydrol.Eng.ASCE124(3),288‐300.
2) Beheshti,A.A.,Ashtiani,A.B.,2010.Experimentalstudyof three dimensional flow fields around a complexbridgepier.J.Hydrol.Eng.ASCE136(2),143‐154
3) Breusers, H.N.C., Nicollet,G.,Shen, H.W.,1977. Localscour around cylindrica l piers. J. Hydrol. Res. IAHR15(3),211‐252.
4) Chang, W. Y., Lai, J. S., Yen, C. L., 2004. Evolution ofscour depth at circular bridge piers. J. Hydrol. Eng.ASCE130(9),905‐913.
5) Dey,S.,Bose,S.K.,Sastry,G.L.N.,1995.Clear water scourat circular piers: amodel. J. Hydrol. Eng. ASCE 121
(12),869‐876.6) Dey, S., Raikar, R.V., 2007. Characteristics of
horseshoevortexindevelopingscourholesatpiers.J.Hydrol.Eng.ASCE133(4),399‐413.
7) Graf,W.H.,Istiarto,I.,2002.Flowpatterninthescourholearoundacylinder.J.Hydrol.Res.IAHR40(1),13‐20.
8) Imamoto,H.,Ohtoshi,K.,1987.Local Scour Around aNon‐uniformPier.In:Proc.,IAHRCongr,pp.304‐309.
9) JainS.C .Maximumclearwaterscouraroundcircularpiers,JHD,ASCE,Vol.107,No.HY‐5,1981
10) Jones,J.S.,Kilgore,R.T.,Mistichelli,M.P.,1992.Effects offooting location on bridge pier scour. J. Hydrol. Eng.ASCE118(2),280‐290.
11) Junke Guo (2012) ,Pier scour in clear water forsedimentmixtures. Journal ofHydraulic research50(1),18‐27.
12) Kothyari, U. C., Garde, R. J., Ranga Raju, K. G., 1992.Temporal variation of scour around circular bridgepiers.J.Hydrol.Eng.ASCE118(8),1091‐1106.
13) Kothyari, U. C., Hagar, W. H., Oliveto, G., 2007.Generalized approach for clear‐waters courat bridgefoundation elements. J. Hydrol. Eng.ASCE133(11),1229‐1239.
14) Kumar,A.,Kothyari,U.C.,2012.Threedimensionalflowcharacteristicswithin the scourholearoundcircularuniform and compound piers. J. Hydrol. Eng. ASCE138(5),420‐429.
15) Kumar,A.,Kothyari,U.C.,RangarajuK.G.2012,Flowstructureandscouraroundcircularcompoundbridgepiers–Areview.J.ofHydro‐environmentalresearch,6,251‐265
16) Lu, Jau‐Yau.,Shi,Zhong‐Zhi,Hong, Jian‐Hao,Lee, jun‐ji, Raikar, V.K., 2011.Temporal variation of scourdepthatnon‐uniformcylindricalpiers.J.Hydrol.Eng.ASCE137(1),45‐56.
17) Melville, B.W. 1975, Local Scour at Bridge Sites.Report No. 117, Univ. of Auckland, School of Engg.,Auckland,NewZealand,
18) Melville, B.W., 1997. Pier and abutment scour:integratedapproach.J.Hydrol.Eng.ASCE125(1),59‐65
19) Melville, B.W., Raudkivi, A.J., 1977. Flowcharacteristicsinlocalscouratbridgesites.J.Hydrol.Res.IAHR15(4),373‐380.
20) Melville, B.W., Raudkivi, A.J., 1996. Effects offoundationgeometry onbridgepierscour.J.Hydrol.Eng.ASCE122(4),203‐209.
21) Melville, B.W.,Sutherland,A.J.,1988.Designmethodfor local scour at bridge piers. J. Hydrol. Eng. ASCE114(10),1210‐1226.
22) Muzzammil, M., Gangadhariah, T., 2003. The meancharacteristicsofhorseshoevortexatacylinderpier.J.Hydrol.Res.IAHR41(3),285‐297.
Volume 3 Issue 3: 2015 Volume 3 Issue 4: 2015
www.ijset.in ISSN (O): 2348-4098 ISSN (P): 2395-4752
International Journal of Science, Engineering and Technology Page 42

DESIGNANDDEVELOPMENTOFVERIFICATIONENVIRONMENTTOVERIFYSPIMASTERCOREUSINGUVM
1RAJESHC,2SHIVANANDA,3MRS.SHANTHIVA
M.Tech,Dept.ofECE,B.N.MInstituteofTechnology,Bengaluru,India,E‐mail:[email protected]
Assoc.Professor,Dept.ofECE,B.N.MInstituteofTechnology,Bengaluru,India,E‐mail:[email protected]
SeniorTechnicalStaff,MavenSiliconSoftechPvtLtd,Bengaluru,India,Email:shanthi@maven‐silicon.com
ABSTRACT
Themainobjectiveofthework istodesignanSPIMasterCoreusingVerilogHDLandVerifythedesignedSPIMasterCoreusingUniversalVerificationMethodology.SPI(SerialPeripheralInterface)facilitatesthetransferofsynchronousserialdata,which is now a day’s engineer’s favorite choice for its convenience and saving system resource. SPI (Serial PeripheralInterface)operates in fullduplexmode. Itcommunicates inmaster/slavemodewhere themasterdevice initiates thedataframe.Multipleslavedevicesareallowedwithindividualslaveselectline.SerialPeripheralInterfaceofsymmetricalstructurecanbedesignedusingVerilogHDLandSynthesizedusingXilinx13.2,andthencanbesimulatedusingQuestasim10.0b.SPIisaverypopularinterfaceusedforconnectingperipheralstoeachotherandtomicroprocessors.
KeyWords:SPI,WISHBONE,QUESTASIM,XILINXISE,Verilog,UVM,Coverage
1. INTRODUCTION
In these days almost every system includes someintelligent control, commonly a Microcontroller Core.General‐purpose circuits like remote I/O ports, dataconverters, LCD drivers, EEPROM or RAM. Applicationoriented circuits for data communication interfacesand/or intensive computation task. So thecommunicationsbetweenthesemodulesareimportant.
Inmanyapplicationstheinterfacebetweenthesemodulesis still a bottleneck of system performance. In suchprospect the reuse of IP (intellectual property) macrocells is becoming the centre of gravity for designproductivityand thekey forbeingable toproducechipsthatworkefficiently.EveryintegratedcomponentsshouldbeconnectedeachotherandeverySoCshouldbe linkedwith each other in an efficient manner that allows anerror‐free and fast communication. Communicationamong SoC is the key to yield higher performances: themostwidelyusedsolutionusedforinterconnectingSoCisaserialbus,asitgivesagreatadvantageintermsofcost.With the development of the IC manufacturing, thecommunication between hardware devices became veryimportant. Presently widely used protocols such as I2Cbusprotocol,ARMbusprotocol,WISHBONEbusprotocol,etc.,allowsthehardwaredevicestocommunicatethroughthe appointment of the rules and match the timing forachievingthepurposeofdatacommunication.Comparedto other protocols, SPI has is simple to use, has highertransmission speed, and little pins advantages. SPIstandard protocol requires at least four interfaces.Normally,thedeviceswhicharebasedonSPIprotocolaredivided into slave‐device and master‐device fortransmitting the data. The clock signal and slave selectsignalhave tobegeneratedby themaster‐deviceduringthe data exchange processing. Therefore, the masterdevice should have multiple slave select interfaces for
slave devices as it controls multiple slave devices. ThatwillnotmeetthestandardSPIprotocol.ThestandardSPIcommunication is a single‐master communication,whichis all the communications have only one master device.Thus the devices which are based on SPI protocol arelimitedbyboththeaspects.ThedesignisfullycomposedwiththefourinterfacesofstandardSPIprotocol.
2. SPIDESIGNPRINCIPLES
SPI is a synchronous serial bus protocol developed byMotorola and integrated in many of theirmicrocontrollers.NormallySPI isused forshortdistancecommunication,
2.1 ARCHITECTUREOFSPI
Fig.1:ArchitectureofSPI
SPIMasterCoreconsistsofthreemainbuildingblocks:
•Clockgenerator
Volume 3 Issue 3: 2015 Volume 3 Issue 4: 2015
www.ijset.in ISSN (O): 2348-4098 ISSN (P): 2395-4752
International Journal of Science, Engineering and Technology Page 43

•Serialinterface
•WISHBONEInterface
SPIbusconsistsoffoursignals:serialclock(SCK),masterinslaveout(MISO),masteroutslavein(MOSI),masterinslave out (MISO), and active‐low chip select (SS). As amulti‐master/slaveprotocol,communicationbetweentheselected slave and master uses the unidirectional MOSIandMISOlines,toachievehigherdataratesinfullduplexmode. SPI requires separate Slave select lines for eachslave.WithSPIwecanconnectasmanydevicesasmanypins we have on the main microcontroller. Thecommunicationspeedbetween ICs ismuch fasterdue totheFullDuplexcommunication.
2.2 MODULEDESIGN
1)ClockGeneratordesign
Theclocksignalspi_clgen isroot fromtheexternalclockwb_clk, the module produces the output signal s_clkaccording to the different frequency factor of the clockregister. Divider is the basic and efficient part of thedigital circuits and FPGA design; It is also a veryimportantcomponentof thecommunicationsystem.Thefrequency of the serial clock s_clk of the master coresystem ischangedbychanging thevalueof theDIVIDERvalue in theDivider register. Relation betweenDIVIDERvalue,s_clkandwb_clkisgivenbythefollowingequation:
Clock generation module is synthesized by ISE. ModulesynthesizedshownbelowshowninFig2.
Fig.2ClockGeneratorCircuitModule
2)SerialInterfacemoduledesign‐‐spi‐shift
Serial interface module is the core module of the SPI.Serial interfacemodule isresponsible forserialdata intoparalleloutanddataparallel intoserialout.Inthisworkthe design of serial interface is different from the usualserialinterface;Itincreasestheoveralldatatransmissionrate.SPIMasterat thehostsideactsasaslavedevice toreceive data and acts as themaster device to senddata.SerialinterfacemoduleissynthesizedbyISE.VerilogcodeforthismoduleissynthesisedmoduleshowninFig.3.
Fig.3SerialInterfaceCircuitModule
3)Top‐levelmodule–TOP
BasedonthespecificationsoftheSPIprotocol,wegetthebasicstructureSPIbusby includingtheclockgenerationmoduleandserial interfacemodule.Animportantaspectofthetop‐levelmoduleistoensurethatthesub‐moduleswork smoothly. The SPI top module needs the controlword, the efficient operation of sub‐modules: clockgeneration module and serial interface module. SPI topmodule is synthesized by ISE. Synthesized module isshowninFig.4.
Fig.4TopLevelCircuitModule
3. SIMULATIONANDVERIFICATION
VerilogHDLisoneofthehardwaredescriptionlanguages.Verilogcanbeused fordifferent levelsof logicdesign, itcan be used for digital system logic simulation, timinganalysis and logic synthesis. In this work, a SPI Mastercore Interface Module is designed using Verilog HDL.According to the standard SPI bus principle, we canachieve the bidirectional data transmission between theslavedevicesandmicrocontroller.UsingVerilogHDLwehad designed the SPI Master Core interface circuit,synthesised with ISE, and then used Questasim tosimulate.Inordertoestablishthetestplatform,firstsetupthe master module to simulate the Wishbone protocol,andthensetuptheslavemoduletosimulateSPIprotocolat the same time. Then to compare and check the
Volume 3 Issue 3: 2015 Volume 3 Issue 4: 2015
www.ijset.in ISSN (O): 2348-4098 ISSN (P): 2395-4752
International Journal of Science, Engineering and Technology Page 44

receive/send data and addresses. The test bench isdesigned using universal verification methodology.Verification is also themajor part of thiswork asmanymodules are designed and having many inputs univrsalverificationmethodologyhelpstomakeseasytostimulateaccordingtoourwish,constrainttheunwantedstimulus.Here theSPIMasterCoreDesign isconsideredasdesignunder test (DUT). Components of VerificationEnvironment are as follows : RTL module, Master andSlave agent tops which consists of master and slaveagents which contains sequencer, driver and monitor,virtual sequencer, Scoreboard, TOP level module whichencapsulatestheaboveallwithRTLandTestCases.
UVMtestbencharchitectureisasshowninFig.5.
Fig.5:UVMtestbenchArchitecture
ThesimulationresultsareasshownbelowinFig.6
Fig.6:Simulationresults
CoverageReportisshownbelowinFig.7
Fig.7:Coveragereport
4. CONCLUSION
Inthiswork,wehavedesignedtheSPIMastercoreUsingVerilog HDL language based upon design‐reusemethodology. SPI Transmission timing is very strict, sothispaperdesigns a reliable and stable clock generationmodule, considering both the odd‐even frequency cases.Datatransmissionmoduleisverysimpleandthetransferspeed is faster.Wehaveverified thedata inslavedevicesameas thedata in themaster device. Further,wehavealso done functional verification. The code coverage isobtainedfortheRTLdesignand100%codecoverageandfunctionalcoverageisextracted.Thecompletefunctionofthe registers is verified in this paper. The innovation ofthisarticle:Universalverificationmethodologyisusedinorder to coverall the functionsof the codeand to reusetheclassinsteadofwritingthecodeagain.Theadvantageofusinguniversalmethodologyismakingthethingseasybycallingtheinbuiltclasses.
REFERENCES
[1] www.opencore.org Simon Srot.SPIMasterCoreSpecification,Rev.0.6.May16,2007.
[2] Prophet, Graham. Communications IP adds SPIinterfacetoFP‐GA.EDN,v48,n27,Dec11,2003.
[3]Motorola,"MC68HCIImanual".
[4] Smart Computing Dictionary, Serial PeripheralInterface (SPI)(online)http://www.smartcomputing.com/editorial/dictionary/detail.asp?guid=&searchtype=1&DicID=12820&RefType=Dictionary(accessdate28May2006)
[5] Frédéric Leens,An Introduction to I2C and SPIProtocols,IEEEXplore.
[6] Zhang Yan‐wei, Verilog HDL detailed designprocedure,Posts&TelecomPress.
[7] Wikipedia, the free encyclopedia, “Serial PeripheralInterfaceBus”,
Availablehttp://en.wikipedia.org/wiki/Serial_Peripheral_Interface_Bus.
Volume 3 Issue 3: 2015 Volume 3 Issue 4: 2015
www.ijset.in ISSN (O): 2348-4098 ISSN (P): 2395-4752
International Journal of Science, Engineering and Technology Page 45

ESTIMATIONOFDOMESTIC,CROPWATERREQUIREMENTSANDESTIMATIONOFGROUNDWATER,SURFACEWATERRESOURCESOFRENIACITY‐IRAQ
1AHMEDTALIBABDULJALEELAL‐ALIKHAN,2PROF.P.T.NIMBALKAR
1Researchscholar,DepartmentofCivilEngineeringBharatiVidyapeethDeemedUniversityCollegeofEngineeringPune
2Professor,DepartmentofCivilEngineeringBharatiVidyapeethDeemedUniversityCollegeofEngineeringPune
ABSTRACT
TheareaunderstudyislocatedinthenortheasternofIraqbetweenlat.(36°10‐42,46°31‐00)andlong.(47°21‐00,4460‐41)approx. Areaof980 .The studyarea ischosen for thehydro‐‐geological study ithashighgroundwater resourcesusefulforirrigationofmediumandlargescaleprojects.Themainsourcesinthestudiedareaarewells,springsandstreams.ItisreportedthatdrinkablewaterinReniadistrictisexistingfor91%ofthepopulation
Renia city has an urban population about 65,110.Over the planning period through 2025, its population is projected toincreasetoapproximately117,540.Thewaterdemandfortheyear2005isapproximately28,100 ,anditisprojectedtoincreasearound50800 bytheyear2025.ThecombinedwaterdemandforthesesubdistrictReniacity(Batwata,HejiawaandChwerqurna)isprojectedtoincreasefromapproximately(34,470 )toaround(62,250 ),bytheyear2025.Welltestsfor(11)wellsthatpenetratetheQuaternaryaquiferindicatedspecificyieldwithmedianvalueof0.08m/day,ahydraulicconductivitywithmedianvalueof2.10andtransmissivitywithmedianvalueof170 .
1. INTRODUCTION
1.1 LOCATION
Fig(1)LocationofStudiedArea
1.2POPULATION
Estimationofpopulationin2005,seetable(1)
Subdistrict Urban Rural Total
Municipal center(Renia) 65,010 0 65,000
Batwata 13,250 7,400 20,652
Hejiawa 36,000 4,440 39,441
Chwerqurna 41,000 27,060 67,061
Total 155,260 38,900 192,154
ReefTableNo.(1),PopulationoftheReniain2005
1.3 CHWERQURNA,HEJIAWA,ANDBATWATA
Thecharacteristicsofthewatersystemareshowninthetable
Renia Batwata Hejiawa Chwerqurna
Population(estimated)
65,010 13,250 36,000 41,000
Area (km2) 10 8 5.5 6Density
(persons/km2)6,501 1,656 6,545 6,833
Water source Qula Spring&deep wells(25)
10,601 m3/d
spring
7,001 m3 /d
Wells (23)-3,010 m3/d
Wells (22) -2,600 m3/d
Projecteddemand
200 ( 3/d)
28,000 4,770 13,860 15,841
Projected demand -2025 (m3/d)
50,717 8,614 25,034 28,610
Water supplycap - 2005
10,629 7,001 3,010 2,510
ReefTableNo(2),WaterSystemsinthestudy
1.4 MAINPROBLEMS
Mainproblemsinwatersupplysystem
Distribution network coverage system is old andinadequate
Lessavailabilityofmaintenanceequipment
Lessavailabilityofelectricity
Lackofstoragefacilities
2. PROJECTEDNEEDS
Volume 3 Issue 3: 2015 Volume 3 Issue 4: 2015
www.ijset.in ISSN (O): 2348-4098 ISSN (P): 2395-4752
International Journal of Science, Engineering and Technology Page 46

2.1 DEMANDPROJECTION
Urban population ofRenia city is about approximately65,010 persons . By its population is projected toincrease toaround 2025 , itspopulation isprojected toincrease to around 117,500 in 2005water demandwasaround28,100 ,itisprojectedbytheyear2025thatwaterdemandwillincreasearound50800
2.2 EXISTINGCAPACITY
Design and existing capacity of Renia water supplysystem,seeReefTableNo.(3)Below
Source Renia water sources • Design capacity of the existing system *
Springs 7,501 7,501
Wells 3,129 10,537
Total 10,630 18,038
⁄ ⁄
*This design capacity of the existing system based on a24‐hoursoperation.
2.3 AIMOFTHESTUDY
Theaimsofthestudyare:
1. Anassessmentoftheavailablewaterresources.
2. To determine domestic water requirement forprojectpopulation
3. To determine crop water requirement by usingsoftwareprogram(CROPWAT8.0).
2.4 METHODOLOGY
1‐For preparing fieldwork the available basic data fromdifferentsourcesarecollectedtopographicandgeologicalmaps with relevant scale are selected and images fromsatelliteforbackgroundmapweremadeavailable..
2‐ Relevant data from another respective offices arecalculated from site on use of land groundwater anddrilledwells
2.5 FORTHEDISTRICTCENTRE'SPROJECTEDNEEDS
Accordingtoyear2005,2015and2025,estimatedwaterdemand and the supply capacities is presented in tablebelow
Parameter Quantity Existing operational water production capacity 10,630
Design capacity of the existing system 18,038
Projected demand 2005 28,081
Projected demand 2015 37,738
Projected demand 2025 50,717
Projected production capacity deficit 2005 17,451
Additional production needed in 2015 27,108
Additional production needed in 2025 40,087
⁄
Reef Table No.(4),Projected Water Demand and SupplyCapacityofReniaCity
2.6 FORDISTRICTCITY
Estimationwaterdemandsandthesupplycapacitiesfortheyears2005,2015and2025arepresentedintablefor(Batwata,HejiawaandChwerqurna).
Batwata 2005 2015 2025Existing water supply capacity 7,001 m3/d --- ---
Projected water demand 4,769 m3/d 6,410 m3/d 8,614 m3/d
Additional capacity None None 1,613 m3/d
Hejiawa 2005 2015 2025Existing water supply capacity 3,010m3/d --- ---
Projected water demand 13,860 m3/d 18,627 m3/d 25,033 m3/d
Additional capacity 10,850 m3/d 15,617 m3/d 22,023 m3/d
Chwerqurna 2005 2015 2025Existing water supply capacity 2,600 m3/d --- ---
Projected water demand 15,840 m3/d 21,288 m3/d 28,609 m3/d
Additional capacity 13,240 m3/d 18,688 m3/d 26,009 m3/d
Total of the Subdistricts 2005 2015 2025Existing water supply capacity 12,500 m3/d --- ---
Projected water demand 34,469 m3/d 46,324 m3/d 62,255 m3/d
Additional capacity required 21,969 m3/d 33824 m3/d 49,755 m3/d
ReefTableNo. (5),ProjectedWaterDemandandSupplyCapacity
2.6 ANNUAL EFFECTIVE RAINFALL ANDEVAPOTRANSPIRATION
Oct Nov. Dec. Jan. Feb. Mar. Apr. May Jun. July Aug. Sep
29.7 70.1 113.5 127.4 97.5 96.6 63.9 21.4 1.31 0 0 0
152.3 92.8 66.8 67.7 66.8 98.1 116.1 162.1 224 239.3 230.4 195.7
Peff (mm)
Eto (mm/period)
Reef Table No.(6). Annual Effective Rainfall andEvapotranspirationfortheStudiedArea
3. OBTAINEDRESULTSFORTHESTUDIEDAREA
Reef Table No.( (7).Showing output of program(CROPWAT8.0)forCropsintheReniaArea
Barley Wheat Sunflower Tobacco Chickpeas Maize754 897 724 783 551 842540 605 535 605 405 568707 711 629 697 477 669621 621 145 3.7 57 50.4496 496 126 3.6 52 470.24 0.24 0.57 0.9 0.65 0.64241 241 516 650 401 5642410 2410 5160 6500 4010 56406394 9040.5 2786 57.6 1432 115
15.40954 21.78761 14.37576 0.3744 5.74232 0.6486
658658026Cultivated Area (ha)
Volume of water required M. 0.17108
Field water supply(FWS) (l/s/ha) Net irrigation requirementNIWRi (mm/period) Net irrigation requirementNIWRi (m3/ha)
Sweet melon8496087155752
0.71
ETo(mm/period)CWR (ETm)(mm/period)Actual crop Evapotranspiration(ETc) (mm/period)Total Rainfall(mm/period)
Effective Rainfall(mm/period)
3.1 WATERRESOURCESUSEDFORIRRIGATION
3.1.1 Surfacewater
Dimane and Qoshan are main water surface used forirrigation in Renia city. Reef Table No. (8) Showingaverage discharge recorded in one month for one year.ThemeandischargeforDimaneandQoshanare(0.7834)
and(2) respectively.
MonthFactor Oct. Nov. Dec. Jan. Feb. Mar Apr. May Jun. Jul. Aug. Sep. Mean1.2 1.35 2.2 2.5 3 4.5 3.5 1.8 1.15 1 0.95 0.9 2
0.608 0.635 0.7 0.745 1 1.1 1.15 0.95 0.639 0.63 0.625 0.615 0.783Qashan Dimana
⁄
( ⁄
TableReefTableNo. (8).Averagedischarge forDimaneandQoshan
Volume 3 Issue 3: 2015 Volume 3 Issue 4: 2015
www.ijset.in ISSN (O): 2348-4098 ISSN (P): 2395-4752
International Journal of Science, Engineering and Technology Page 47

3.1.2 Groundwater
Wells andmajor springs are used for irrigationThe springs which are used for irrigation are(QolaiRenia , QolaiKanimaren, and Sarochawa) ,ReefTableNo.(9)showingspringsmeandischarge
Total
volume of water m.c.m
7.77612.4416161.7408181.9584
Major spring
Qulai Rania
Qulai Kanimaran
Saruchawa
discharges used for irrigation
50%100%80%
discharge m3/sec
0.50.46.5
Is estimated that the number of wells are nearly(50)wells which operate about 5 hr/d withindischargeofwaterabout(6l/sec/well).
3.1.3 QuaternaryAquifer‐HydraulicProperties
According to Renia groundwater intergranular. Theavailable data for wells (10) drilled with inintergranularaquiferinthestudyareaisbasedonprocess
The researcher monitors in an observation well{Transmissivity (T),Hydraulic Conductivity (K) ,SpecificCapacity(Sc),andStorativity(S)},ReefTableNo.(10)
Well Q s
(m)T.D (m) SWL (m)
b
(m)Sc(Q/s) T K (T/b)
Well 1 907.3 1.2 95.2 13.85 81.2 756.08333 600.81 0.007304
Well 2 1200 10.5 100.1 13.2 87 114.28571 44.61 0.000516
Well 3 1297 4.5 120.5 20.2 100 288.22222 124.52 0.001196
Well 4 1900.5 4.5 100.8 16.8 84 422.33333 199.33 0.002289
Well 5 950.5 2.95 126.6 43.2 81 322.20339 169.65 0.001551
Well 6 1167 6.5 122.4 36.1 86 179.53846 82.142 0.000777
Well 7 583.3 1.14 123.1 65.5 58 511.66667 245.31 0.002306
Well 8 1167 2.35 113.1 37.3 78 496.59574 235.74 0.002412
Well 9 1167 2.83 135.8 43.2 92 412.36749 152.81 0.001302
Well 10 655 3.172 120.3 36.1 84 206.49433 154.73 0.001489
Well 11 1090 0.12 79.4 6.54 72.5 9083.3333 42601 0.620991
( ⁄ )
( ⁄ ) ( ⁄ ) ( ⁄ )
ReefTableNo.(10),well testdataandPumpingTestforRenieaarea.
Fig(2).Time‐DrawdownGraphforWell1
4. CONCLUSION
Renia town has an urban population about 65,010and it is estimated to increase approximately117,500,basedonwaterdemandcriteria .Thewaterdemand in the year 2005 was 28,100 isprojectedtoincrease50800 bytheyear2005.
For sub district centers (Batwata, Hejiawa andChwerqurna) ,The water demand in the year 2005was 34,470 is projected to increase 62,250
bytheyear2025
Totalamountofwaterfor(Renia,Batwata,Hejiawaand Chwerqurna)in the year 2005 was22.5252 , total amount ofwater for center anddistrictcity isprojectedto increase40.698 bytheyear2025v
NetIrrigationWaterRequirementsforthecropswillbe approximately 58.5 . The volume of waterfrom(DimaneandQoshan) willbe86.5 .Thevolume of water from springs (QolaiRenia ,QolaiKanimaren, and Sarochawa) will be182 ,see Reef Table No. ( 9) and the wateravailableof(50)wellswillbeapproximately2 .the total amount of water from surface and groundwaterwillbe270.5 .
REFERENCES
Parson,R.M.,1957.GroundwaterResourcesofIraq,Vol. XII: SulaimaniaLiwa and area North ofKhanaquin. R.M. Parson Co., Ministry ofDevelopment,DevelopmentBoard,Gov.ofIraq,93p.
Parsons,C.,2006. Mini Master Plan for the PublicWater Supplies for the Governorate ofSulaymaniyah‐ Iraq .Public Works/Water Sector,ContractNo.W914NS‐04‐C‐0003,358P.
Al‐Kubaisi, Q.Y. , 2004. Annual Aridity Index ofTYPE.1 and TYPE.2 Mode Options for ClimateClassification. IraqijournalofScience. Vol.45C,No.1.pp.32‐41.
Bear: Dynamics of fluids in porous media(1972)(Classicmathematical treatment of fluid flowinsoilandrock;difficult)TA357B38
Adams, S., Titus, R., Pietersen, K., Tredoux, G. andHarris, C., 2001. Hydrochemical Characteristics ofAquifers near Sutherland in the Western Karoo,SouthAfrica.JournalofHydrology24:pp91‐103.
American Society for Testing and Materials, 1964Manual on industrial water and industrial waste(2nd.ed.)Philadelphia,856p.
Volume 3 Issue 3: 2015 Volume 3 Issue 4: 2015
www.ijset.in ISSN (O): 2348-4098 ISSN (P): 2395-4752
International Journal of Science, Engineering and Technology Page 48

EFFECTOFFILLERCONCENTRATIONONPROPERTIESOFGRAPHITECOMPOSITEBIPOLARPLATE
1MOHAMMEDA.M.,1EL‐NAFATYU.A.,2BUGAJEI.M.3MUKTHARB.
1DepartmentofChemicalEngineering,AbubakarTafawaBalewaUniversity,P.M.B0248Bauchi,BauchiState,Nigeria.,Email:[email protected]
1DepartmentofChemicalEngineering,AbubakarTafawaBalewaUniversity,P.M.B0248Bauchi,BauchiState,Nigeria.,Email:[email protected]
2NationalResearchInstituteforChemicalTechnology(NARICT),P.M.B.1052Basawa,Zaria,KadunaStateNigeria,Email:[email protected]
3DepartmentofChemicalEngineering,AhmaduBelloUniversity,Zaria,KadunaState,Email:[email protected]
ABSTRACT
FuelCellasanalternativeenergydevice isexpensivedue tohighcostofproductionof itscomponents. In this research,abipolar plate,which is a component of a fuel cell, is fabricated using indigenous rawmaterial (graphite).The platewasproducedusing epoxy resinas thematerialmatrixandgraphiteas the filler. Inorder toproducebipolarplatewithbestcharacteristics,eightdifferentformulations(55%,60%,65%,70%,75%,80%,85%and90%fillerconcentration)weretestedandtheplateswereproducedusingcompressionmouldingat1500Cand100kN.Theplateswerecharacterizedforelectricalconductivity,tensilestrength,and flexuralstrength.ASTMD3039andD790wereused fortensileand flexuralstrengthtestrespectively.ElectricalconductivitywasdeterminedusingVanderPauwtechniqueandthevalueswerefoundtobe104.35S/cm and 107.78 S/cm in85%and90% filler concentrationplates,which isaboveUS‐DOE target.Tensile strengthandflexural strength shows varying results due to either increase in elasticity or brittlenesswith respect to increasing fillerconcentration.However, thevalues for tensileand flexural strengthwere found tobe15.64and54.70MParespectivelyat70%fillerconcentration’splate.ThisisalsoabovethetargetsetbyUS‐DOEin2012.Therefore,70/30wt%graphite/epoxyresin formulationwasrecommendedastheappropriatesince itsplatehasallthemechanicalpropertiesabovetheUS‐DOEtarget.
IndexTerms:BipolarPlate,Binder,Composite,Epoxyresin,Filler,Fuelcell,Graphite,
1.INTRODUCTION
Bipolarplateisanimportantcomponentofafuelcell,Itaccountfor40‐50%ofthecostand60‐80%oftheweightof a fuel cell stack (Hermann etal., 2005). The bipolarplate’s main functions include carrying current awayfromeachcell,distributinggas fuelswithin thecellandprovidingsupportfortheMembraneElectrodeAssembly(Nannan et al., 2012). In order to perform thesefunctions, bipolar plates must have high mechanicalstiffness and strength, low electrical resistance, lowdensity,andlowthickness.
Since the performance of the fuel cell is highlydependentontheperformanceofthebipolarplates,thepropertiesofthematerialsselectedishighlycritical.TheUnitedStateDepartmentofEnergyproposedatechnicaltarget of bipolar plates for the year 2010 inwhich themain requirements are electrical conductivity >100S/cmand flexural strength>25MPa.Therearea rangeofmaterialsthathavebeenresearchedandarecurrentlybeing evaluated for suitability as bipolar plates(Alayavalli, 2011). This includes metals, alloys andcomposites.However,themostcommonlyusedmaterialfor bipolar plates is currently graphite. Comparedwithmetals, graphite is an excellent material for bipolarplates due to its excellent chemical resistance and low
density.However, its brittlenaturemakes it difficult tomanufacture(Nannanetal.,2012).
Inthisdirectiona lotofeffort isgoingonworldwidetomake light‐weight and cost‐effective bipolar plate forfuel cell application. In the present investigation effortwasmadetodevelopgraphite‐compositesbipolarplateby compression moulding technique to achieve therequisitegoal.Thecompositesplateswerepreparedbyusing different reinforcing fillers such as naturalgraphite,syntheticgraphite,carbonblack,carbonfiberswith phenolic resin as polymermatrix precursor in itsliquid and powder form. The composition of differentfillerconstituentadjustedinbetween5and40vol%.Thecompositeplatespreparedwithappropriateproportionoffillercomponentswerecharacterizedforphysicalandmechanical properties. It was found that no singlereinforcing filler constituent composites plate has therequisitepropertiesforbeingusedasbipolarplateinthePEMfuelcell
2.MATERIALSANDMETHOD
2.1MATERIALS
Forthisresearch,graphiteof95.42%puritywasusedasthe filler and epoxy‐resin (EPON 828) as the materialmatrix.Thispurity fallswithin theacceptable range for
Volume 3 Issue 3: 2015 Volume 3 Issue 4: 2015
www.ijset.in ISSN (O): 2348-4098 ISSN (P): 2395-4752
International Journal of Science, Engineering and Technology Page 49

bipolar plate production (Mohammed, etal, 2014). TK‐330/332compressionmouldingmachinewasused.
2.2COMPRESSIONMOULDING
Incompressionmoulding,graphitemixturecomposedofcrystalline graphite powder and binders such asthermosetting vinyl resin and reinforcing fibers likecarbon, glass cotton, etc. are molded at temperaturesranging from 10 0C to 150 0C with compression forcesvaryingfrom5to100kN.
Compressionmouldingpresswasused toproduce21.6cmlong,17.8cmwide,and3mmthickprototypebipolarplatesbyRebecca(2011).Inthisresearch,Liquidepoxyresinandgraphitepowderwereusedasmatrixandfillerrespectively. Test specimens of dimension 10cm long,10cm wide and 3mm thick were produced using thefollowingprocedure:
i. Graphitepowderof50μmand95.42%puritywasusedasfiller.
ii. Liquidepoxyresin(EPON828)withahardenerwasusedasthematerialmatrix.
iii. Thegraphitepowderandtheresinsweremixedintheratio90%graphiteand10%resinbyweight.Theformulationwasrepeatedfor85‐15%,80‐20%,75‐25%,70‐30%,65‐35%,60‐40%,and55‐45%graphite‐epoxyresinweightpercent.
iv. Abiodegradablemoldreleasewasusedtocoatthemoldsandapieceoffoilpaperwasplacedtocoverthebottomofthemold.
v. Thepressplatentemperaturewassetat1500C.
vi. AnotherpieceofFoilPaperreleaselinerwasplacedonthetopofthecompositematerialandthemoldcoverwasplacedontoptosealinthematerial.
vii. Themouldwasthenplacedbetweentheplatensinthepressandthepressurebuttonwaspressed.
viii. Aforceof50kNwasappliedandallowedtostayfor15mintopre‐heatat1500C.
ix. Theforcewasthenincreasedto100kNfor5minsat1500C
x. Themouldwascooledusingairandwateronlyuntiltheplatentemperaturereaches25°Cat100kN.
xi. Themouldwasremovedfromthepressandthemouldedplateisremovedfromthemould.
2.3CHARACTERIZATIONOFTHEPLATE
After successful fabrication of the bipolar plate, thesample was characterized in order to measure someparameters.Thefollowingparameterswereconsidered:
i. Electricalconductivity
The electrical conductivity of the composite plate ismeasured using Van der Pauw Four Point Probetechnique. The Van der Pauw technique, due to itsconvenience, is widely used in the semiconductorindustrytodeterminetheresistivityofuniformsamples.As originally devised by Van der Pauw, one uses anarbitrarilyshape,thin‐platesamplecontainingfourverysmallohmiccontactsplacedontheperiphery,preferablyinthecorners,oftheplate.AschematicofarectangularVan der Pauw configuration is shown in Figure 1. TheresistanceRAandRBarerelatedtothesheetresistanceRSthroughtheVanderPauwequation(equation1).
Figure1:SchematicofaVanderPauwconfigurationusedinthedeterminationofthetwocharacteristic
resistancesRAandRB(Parkeretal,,2012).
Theconductivitywasthenmeasuredthroughresistivitymeasurement. The resistivitymeasurement is done viathefollowssteps:
1. Fourpointprobetechnique.
2. Solving Vander Pauw equation (equation 1) forsurfaceresistance
3. The resistivity is then calculated using Ohms law:(Büchietal.,2000)
1 … 1
⁄ … 2
Where,
∗
2
ii. Tensilestrength
Mechanical testing, like tensile strength, plays animportant role in evaluating fundamental properties ofengineering materials as well as in developing new
Volume 3 Issue 3: 2015 Volume 3 Issue 4: 2015
www.ijset.in ISSN (O): 2348-4098 ISSN (P): 2395-4752
International Journal of Science, Engineering and Technology Page 50

materials and in controlling thequalityofmaterials foruseindesignandconstruction.Ifamaterialistobeusedundertension, it is importanttoknowthatthematerialisstrongenoughandrigidenoughtowithstandtheloadsthatitwillexperienceinservice.
ASTMD3039wasselectedtotestthebipolarplate.Thetest specimensweremachined to a dumbbell shape, asrepresented in figure 8, for the tensile testwhere theyare griped in a Hounsfield Tensometer and a load isappliedtoextentthematerial.Atthepointoffailuretheloadwasrecordedasthemaximumloadthematerialcanwithstand.
Hounsfield Tensometer was used to determine thetensile strength. The equipment set up is as shown inFigure 9. The Tensile strength is calculated using theformula:
. .3
Where;
| 2
| 2
Figure‐2:Dumbbellshapeformeasuringtensilestrength
iii. Flexuralstrength
Flexural strength, also known as modulus of rupture,bend strength, or fracture strength, a mechanicalparameterforbrittlematerial, isdefinedasamaterial'sability to resistdeformationunder load.The transversebending test is most frequently employed, in which aspecimen having either a circular or rectangular cross‐section is bent until fracture or yielding using a threepoint flexural test technique. The flexural strengthrepresents the highest stress experienced within thematerial at its moment of rupture. It is measured intermsofstress,heregiventhesymbolδ.
Test specimens were cut into rectangular shape ofdimension 100mmx20mm. Each formulation has threespecimens, for this test, making a total of 24 testspecimens. Three point loading technique was used todeterminetheflexuralstrengthofeachspecimen.ASTMD790,whichisoftenusedforcompositewasselectedtotest the bipolar plate. The resulting stress for a
rectangularsampleunderaloadinathree‐pointbendingsetupisgivenbyequation4andthesetupisasshowninFigure3.
32 2 … 4
Where;
| 2
| 2
Figure‐3:ThreePointLoadingTechniqueforFlexuralStrengthtest
3.RESULTSANDDISCUSSION
3.1ELECTRICALCONDUCTIVITY
Aftermeasuring the resistance RA and RB, resultswereobtained for all the 8 graphite‐Epoxy formulation asshown in Table 1. Resistance Rs was calculated bysolvingequation1numericallyusingExcelspreadsheetfor the iteration. The values for Rs, resistivity (ρ), andconductivity (δ), for 90% filler loading, are shown inTable2.Otherresultsareshownintheappendix.Plotofconductivityversusfillerconcentrationoftheplateswasalso represented in Figure 4. The calculationwas doneusing Microsoft Excel spread sheet and the resultsobtained show that the conductivity increaseswith theincreasing filler concentration. Plates of 85% and 90%filler concentrationhave a conductivityof 104.35 S/cmand107.78S/cmrespectively.Theseresultswereabovethe US‐DOE target of 100 S/cm. Shane and his co‐workers in 2005 (Mercuri, 2005) said that theconductivity can be improve to meet the target whengraphiteusedisgreaterthan60%.Thus,toimprovetheconductivity of graphite based composite plate, highlyconductingmulti‐wall nanotubes (MWNTs) in differentvol.% are incorporated. Dhakate and co‐workersdiscovered that initially, in‐plane conductivity withoutMWNTs of bipolar plate is 80 S/cm.On addition of 0.5vol.%MWNTs in composite, the electrical conductivityof nanocomposite suddenly increases from 80 to 165S/cm.With increasingMWNTs contentup to1.0 vol.%,conductivity increases up to 178 S/cm. But, on furtherincreasing the MWNTs content up to 2 vol.%, theelectrical conductivity decreases up to 145 S/cm,
Volume 3 Issue 3: 2015 Volume 3 Issue 4: 2015
www.ijset.in ISSN (O): 2348-4098 ISSN (P): 2395-4752
International Journal of Science, Engineering and Technology Page 51
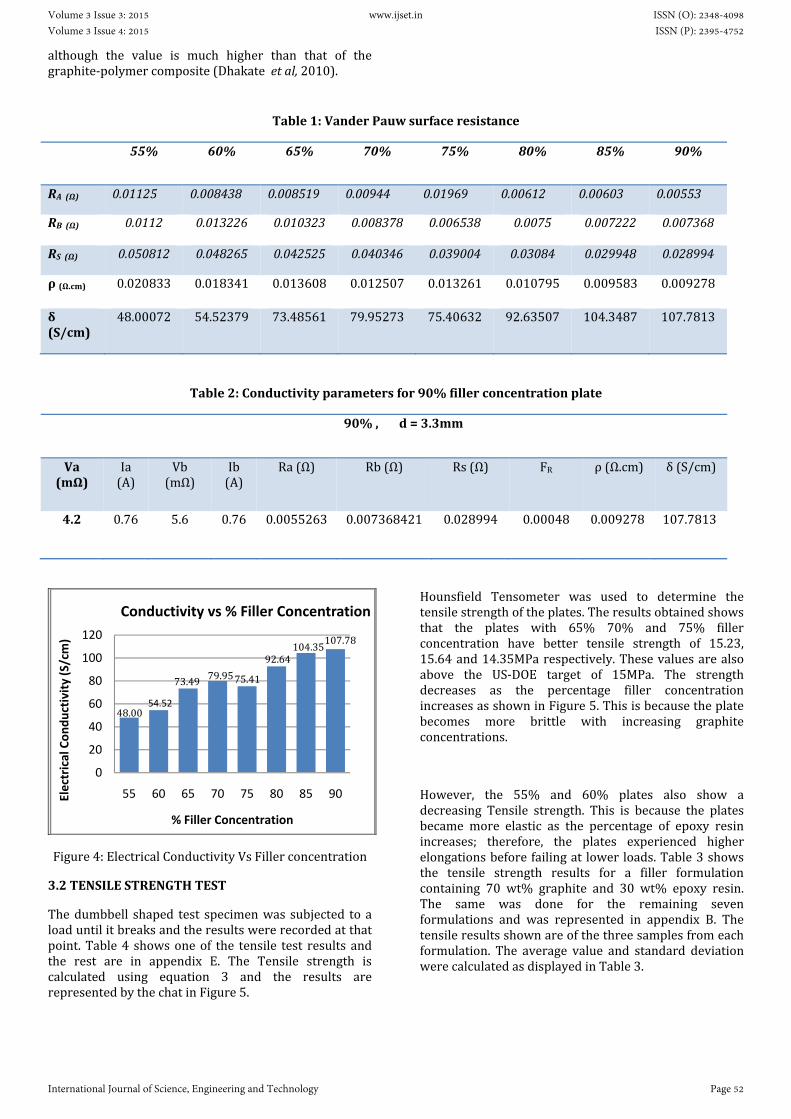
although the value is much higher than that of thegraphite‐polymercomposite(Dhakateetal,2010).
Table1:VanderPauwsurfaceresistance
55% 60% 65% 70% 75% 80% 85% 90%
RA(Ω) 0.01125 0.008438 0.008519 0.00944 0.01969 0.00612 0.00603 0.00553
RB(Ω) 0.0112 0.013226 0.010323 0.008378 0.006538 0.0075 0.007222 0.007368
RS(Ω) 0.050812 0.048265 0.042525 0.040346 0.039004 0.03084 0.029948 0.028994
ρ(Ω.cm) 0.020833 0.018341 0.013608 0.012507 0.013261 0.010795 0.009583 0.009278
δ(S/cm)
48.00072 54.52379 73.48561 79.95273 75.40632 92.63507 104.3487 107.7813
Table2:Conductivityparametersfor90%fillerconcentrationplate
90%,d=3.3mm
Va(mΩ)
Ia(A)
Vb(mΩ)
Ib(A)
Ra(Ω) Rb(Ω) Rs(Ω) FR ρ(Ω.cm) δ(S/cm)
4.2 0.76 5.6 0.76 0.0055263 0.007368421 0.028994 0.00048 0.009278 107.7813
Figure4:ElectricalConductivityVsFillerconcentration
3.2TENSILESTRENGTHTEST
Thedumbbell shaped test specimenwas subjected toaloaduntilitbreaksandtheresultswererecordedatthatpoint.Table4 showsoneof the tensile test results andthe rest are in appendix E. The Tensile strength iscalculated using equation 3 and the results arerepresentedbythechatinFigure5.
Hounsfield Tensometer was used to determine thetensilestrengthoftheplates.Theresultsobtainedshowsthat the plates with 65% 70% and 75% fillerconcentration have better tensile strength of 15.23,15.64and14.35MParespectively.Thesevaluesarealsoabove the US‐DOE target of 15MPa. The strengthdecreases as the percentage filler concentrationincreasesasshowninFigure5.Thisisbecausetheplatebecomes more brittle with increasing graphiteconcentrations.
However, the 55% and 60% plates also show adecreasing Tensile strength. This is because the platesbecame more elastic as the percentage of epoxy resinincreases; therefore, the plates experienced higherelongationsbeforefailingat lowerloads.Table3showsthe tensile strength results for a filler formulationcontaining 70 wt% graphite and 30 wt% epoxy resin.The same was done for the remaining sevenformulations and was represented in appendix B. Thetensileresultsshownareofthethreesamplesfromeachformulation. The average value and standard deviationwerecalculatedasdisplayedinTable3.
48.0054.52
73.49 79.9575.41
92.64104.35
107.78
0
20
40
60
80
100
120
55 60 65 70 75 80 85 90Electrical Conductivity (S/cm)
% Filler Concentration
Conductivity vs % Filler Concentration
Volume 3 Issue 3: 2015 Volume 3 Issue 4: 2015
www.ijset.in ISSN (O): 2348-4098 ISSN (P): 2395-4752
International Journal of Science, Engineering and Technology Page 52

Table3:Tensilestrengthparametersfor65%and70%plates
65%graphitefiller 70%graphitefiller
spec5 spec6 spec9 spec10
b(mm) 9.1 9.1 b(mm) 9.2 9.5
d(mm) 3.2 3.3 d(mm) 3.1 3.2
F(N) 480 420 F(N) 425 498
e(mm) 2.6 2.6 e(mm) 2.6 2.9
δ 16.4835 13.9860 δ 14.9018 16.3816
δav 15.23 δav 15.64
Figure5:TensileStrengthvs%Fillerconcentration
3.3FLEXURALSTRENGTH
The average of the three results was used for eachformulation.Standarddeviationofthethreeresultswasas shown in the appendix. The resulting stress for arectangularsampleunderaloadinathree‐pointbendingsetup gives the results presented in Table 4. OtherresultsofthetensiletestareshowninappendixF.
Equation 4 was used to calculate the resulting flexuralstrength and the results are displayed in Figure 6. Theflexural strength was evaluated using three pointsloading techniquesand the resultsobtained shows thatthe 65% and 70% plates has values (49.89 and54.70MPa)equivalentandaboveUSDOErespectivelyasrepresented in Table 4. This is because of the samereason as, in tensile strength, above. The flexuralstrength is decreasing with increasing graphiteconcentration (Mathuretal 2008)with somedeviationin the 55% and 60% plates which have low flexuralstrengthbutwithhigherbendingelongationsbecauseoftheir elastic properties as shown in Table 5. This isbecauseasthefillerconcentrationincreasesthematerialbecomemore brittle and hence experience decrease inmechanical strength.Thevaluesobtained,however, aregreaterthan45MPaobtainedbyMathurandco‐workersin2008andlessthan60MPabyDhakateandco‐workersin2007whichisobtainedfromthreefillers.Therefore,itisobvious that the flexural strength cangohigher thanthetargetifmorethanonefillerisused.
Table4:FlexuralStrengthParametersfor70%FillerConcentration
70%graphitefiller
spec13 spec14 spec15
b(mm) 19 21.5 20
d(mm) 3.1 3.2 3.1
F(N) 107 101 97
e(mm) 2.9 3 3.6
δf(Mpa) 62.0587 48.5824 53.4459
δav(Mpa) 54.6957
stddev 6.8245
10.25
5.61
15.2315.64 14.35
7.01 6.80 5.96
0
5
10
15
20
55 60 65 70 75 80 85 90
Tensile Strength (MPa)
% Filler Concentration
Volume 3 Issue 3: 2015 Volume 3 Issue 4: 2015
www.ijset.in ISSN (O): 2348-4098 ISSN (P): 2395-4752
International Journal of Science, Engineering and Technology Page 53

Figure6:Flexuralstrengthresult
4.CONCLUSIONS
Graphitebipolarplatesweresuccessfullyfabricatedandtestedtoascertaindifferentperformancecharacteristics.The process of compression moulding simplifies thedifficulties of bipolar plate development andmanufacturing. The difference in filler concentrationshowsvaryingpropertiesandcharacteristicswithintheplates.Electricalconductivitykeepsonincreasingasthepercentagefiller increases.This isbecausegraphite isaconductorofelectricityandthehigherthepercentageofgraphite in the plate the more conductive the platebecomes. The plate has low tensile strength but highelasticity, due to high resin content in 55% and 60%graphiteconcentration.This improvesat65%and70%but start decreasing from 75% to 90% due to highgraphite contentwhichmade thematerialmorebrittle.Similarpattern,as intensilestrength,wasexhibitedforflexural strength. From the results obtained it wasrecommended that 70/30 wt% graphite/epoxy resinformulation was appropriate since it has bothmechanical properties (Tensile andFlexural) above theUS‐DOE target. Moreover, the flow field inscription onthe mould makes the production of the plate easierwithoutanyfurthermachining.
REFERENCES
[1]. Alayavalli K. C. (2011): Design, Fabrication andTesting of graphite bipolar plates for Direct MethanolFuelCellsbyInderectLaserSintering,PhDDissertation.UniversityofTexas,AustinUSA.
[2].Büchi,F.N.,Marmy,C.A.,Panozzo,R.,Scherer,G.G.,Haas,O.,(2000).PSIScientificReport1999,pp.92‐93.
[3].DhakateS.R.,MathurR.B.,KakatiB.K.,andDhamiT.L(2007). Properties of graphite‐composite bipolar plateprepared by compression molding technique for PEMfuel cell. International Journal of Hydrogen Energy;32(17),pp.4537‐4543
[4]. Dhakate S.R., Sharma S., Chauhan N., Seith R. K.Mathur R.B.(2010). CNTs nanostructuring effect on theproperties of graphite composite bipolar plate.International Journal of Hydrogen Energy; 35(9), pp.4195‐4200.
[5]. Hermann A., Chaudhuri T., Spagno P., (2005):“Bipolar plate for PEM fuel cell”. Journal of HydrogenEnergy.Vol.30,pp.1297
[6].MarthurR.B.,DhakateS.R.,GuptaD.K.,DhalmiT.L.,AggarwalR.K.(2008):Effectofdifferentcarbonfillersonthe properties of graphite composite bipolar plate;Journalmaterialprocessingtechnology,vol.203,pp.184‐192
[7].Mercuri,R.A.(2005).Assemblingbipolarplates,GooglePatents.
[8].MohammedA.M., El‐NafatyU. A., andBugaje I.M.(2014)CharacterizationofGraphitefromSama‐BorkonoArea of Bauchi State – Nigeria. International Journal ofRecentDevelopmentinEngineeringandTechnology.Vol3(2);pp157‐162
[9].NannanG.,MingC.L.(2012):ExperimentalstudyofPEMFCusinggraphitecompositebipolarplatefabricatedby selective laser sintering. Missouri University ofscienceandtechnology,Rolla,MO65409,USA
[10].Parker,M.,Pokalativ,A.,Raba,K.,andKübarsepp,T.(2012). Accurate measurements of electricalconductivity of metals. 8th international DAAM Balticconference,Tallinn,Estonia.
[11] Rebecca, A. H. (2008). “Synergistic Effects andModeling of Thermally Conductive Resins for Fuel CellBipolarPlateApplications”.Ph.D.dissertation,ChemicalEngineering Department, Michigan TechnologicalUniversity,USA.
20.38 20.39
49.8954.70
26.8419.86
11.52 9.08
0
10
20
30
40
50
60
55 60 65 70 75 80 85 90
Flexural Strength M
pa
% Filler Concentration
Volume 3 Issue 3: 2015 Volume 3 Issue 4: 2015
www.ijset.in ISSN (O): 2348-4098 ISSN (P): 2395-4752
International Journal of Science, Engineering and Technology Page 54

APPENDIXA:ElectricalConductivityParametersandCalculations
ElectricalConductivityCalculations:
1 0
TableA1:Conductivityparametersfor55%fillerConcentrationPlate
55%,d=4.1mm
Va(mΩ) Ia(A) Vb(mΩ) Ib(A) Ra(Ω) Rb(Ω) Rs(Ω) FR ρ(Ω.cm) δ(S/cm)
3.6 0.32 2.8 0.25 0.01125 0.0112 0.050812 0.00086 0.020833 48.00072
TableA2:Conductivityparametersfor60%fillerConcentrationPlate
60%,d=3.8mm
Va(mΩ) Ia(A) Vb(mΩ) Ib(A) Ra(Ω) Rb(Ω) Rs(Ω) FR ρ(Ω.cm) δ(S/cm)
2.7 0.32 4.1 0.31 0.008438 0.013226 0.048265 0.0002 0.018341 54.52379
TableA3:Conductivityparametersfor65%fillerConcentrationPlate
65%,d=3.2mm
Va(mΩ) Ia(A) Vb(mΩ) Ib(A) Ra(Ω) Rb(Ω) Rs(Ω) FR ρ(Ω.cm) δ(S/cm)
4.6 0.54 6.4 0.62 0.008519 0.010323 0.042525 0.00058 0.013608 73.48561
TableA4:Conductivityparametersfor70%fillerConcentrationPlate
70%,d=3.1mm
Va(mΩ) Ia(A) Vb(mΩ) Ib(A) Ra(Ω) Rb(Ω) Rs(Ω) FR ρ(Ω.cm) δ(S/cm)
6.7 0.71 6.2 0.74 0.009437 0.008378 0.040346 0.000409 0.012507 79.95273
TableA5:Conductivityparametersfor75%fillerConcentrationPlate
75%,d=3.1mm
Va(mΩ) Ia(A) Vb(mΩ) Ib(A) Ra(Ω) Rb(Ω) Rs(Ω) FR ρ(Ω.cm) δ(S/cm)
6.3 0.32 3.4 0.52 0.0196875 0.006538462 0.039004 0.20461 0.013261 75.40632
Volume 3 Issue 3: 2015 Volume 3 Issue 4: 2015
www.ijset.in ISSN (O): 2348-4098 ISSN (P): 2395-4752
International Journal of Science, Engineering and Technology Page 55

TableA6:Conductivityparametersfor80%fillerConcentrationPlate
80%,
d=3.5mm
Va(mΩ) Ia(A) Vb(mΩ) Ib(A) Ra(Ω) Rb(Ω) Rs(Ω) FR ρ(Ω.cm) δ(S/cm)
4.1 0.67 4.6 6.1 0.0061194 0.0075 0.03084 5.87E‐05 0.010795 92.63507
TableA7:Conductivityparametersfor85%fillerConcentrationPlate
85%,d=3.2mm
Va
(mΩ)
Ia(A) Vb(mΩ) Ib(A) Ra(Ω) Rb(Ω) Rs(Ω) FR ρ(Ω.cm) δ(S/cm)
4.1 0.68 5.2 0.72 0.0060294 0.007222222 0.029948 3.65E‐05 0.009583 104.3487
APPENDIXB:TensileStrengthParametersandCalculations
TensileStrengthCalculations:
. .3
Volume 3 Issue 3: 2015 Volume 3 Issue 4: 2015
www.ijset.in ISSN (O): 2348-4098 ISSN (P): 2395-4752
International Journal of Science, Engineering and Technology Page 56

TableB1:TensileStrengthParametersfor55%and60%FillerConcentrationPlate
55%graphitefiller 60%graphitefiller
spec1 spec2 spec3 spec4
b(mm) 9.8 9.5 b(mm) 9.3 9.2
d(mm) 4.2 4.5 d(mm) 3.8 3.7
F(N) 312 552 F(N) 132 255
e(mm) 2 4.2 e(mm) 1.6 2.7
δ 7.580175 12.91228 δ 3.735144 7.491187
δav 10.25 δav 5.61
TableB2:TensileStrengthParametersfor75%and80%FillerConcentrationPlate
75%graphitefiller 80%graphitefiller
spec7 spec8 spec11 spec12
b(mm) 9.2 9.2 b(mm) 9.5 9.6
d(mm) 3.4 3.5 d(mm) 3.3 3.5
F(N) 420 492 F(N) 220 235
e(mm) 2.6 2.9 e(mm) 2 1.7
δ 13.42711 15.2795 δ 7.017544 6.994048
δav 14.35 δav 7.01
TableB3:TensileStrengthParametersfor85%and90%FillerConcentrationPlate
85%graphitefiller 90%graphitefiller
spec7 spec8 spec11 spec12
b(mm) 9 9 b(mm) 9 9.2
d(mm) 3.5 3.1 d(mm) 3 3.2
F(N) 198 204 F(N) 175 160
e(mm) 3.7 4.8 e(mm) 2 1.7
δ 6.285714286 7.311828 δ 6.481481 5.434783
Volume 3 Issue 3: 2015 Volume 3 Issue 4: 2015
www.ijset.in ISSN (O): 2348-4098 ISSN (P): 2395-4752
International Journal of Science, Engineering and Technology Page 57

δav 6.80 δav 5.958132045
APPENDIXC:FlexuralStrengthParametersandcalculations
FlexuralStrengthCalculations:
32 2 . .4
TableC1:TensileStrengthParametersfor85%and90%FillerConcentrationPlate
55%graphitefiller
spec1 spec2 spec3
b(mm) 19 21 19
d(mm) 4.2 4.5 3.8
F(N) 87 84 33
e(mm) 2 2.2 1.4
δf(Mpa) 27.4893 20.9185 12.7376
δav(Mpa) 20.38180712
stddev 7.390438405
TableC2:FlexuralStrengthParametersfor60%FillerConcentration
60%graphitefiller
spec4 spec5 spec6
b(mm) 18.8 19 21.2
d(mm) 3.8 3.7 4
F(N) 65 45 56
e(mm) 2.2 4.2 5.4
δf(Mpa) 25.3562 18.3211 17.4835
δav(Mpa) 20.3869
stddev. 4.32384
Volume 3 Issue 3: 2015 Volume 3 Issue 4: 2015
www.ijset.in ISSN (O): 2348-4098 ISSN (P): 2395-4752
International Journal of Science, Engineering and Technology Page 58

TableC3:FlexuralStrengthParametersfor65%FillerConcentration
65%graphitefiller
spec7 spec8 spec9
b(mm) 20 19.4 22.8
d(mm) 3 3.2 3.3
F(N) 96 102 91
e(mm) 1.3 1.5 1.4
δf(Mpa) 56.48 54.3744 38.81277
δav(Mpa) 49.88905493
stddev 9.649947008
TableC4:FlexuralStrengthParametersfor75%FillerConcentration
75%graphitefiller
spec10 spec11 spec12
b(mm) 23 20 18.7
d(mm) 3.5 3.3 3.3
F(N) 65 48 63
e(mm) 2.4 3.6 3.2
δf(Mpa) 24.43123 23.33884 32.76174
δav(Mpa) 26.84394039
stddev 5.153992255
TableC5:FlexuralStrengthParametersfor80%FillerConcentration
80%graphitefiller
spec16 spec17 spec18
b(mm) 18.2 21.4 20
d(mm) 3.3 3.2 3.5
Volume 3 Issue 3: 2015 Volume 3 Issue 4: 2015
www.ijset.in ISSN (O): 2348-4098 ISSN (P): 2395-4752
International Journal of Science, Engineering and Technology Page 59

F(N) 42.5 45 35
e(mm) 3.6 1.9 2
δf(Mpa) 22.70835 21.74677 15.12857
δav(Mpa) 19.86123094
stddev 4.126706925
TableC6:FlexuralStrengthParametersfor85%FillerConcentration
85%graphitefiller
spec19 spec20 spec21
b(mm) 21 19 18.5
d(mm) 3.5 3.1 3
F(N) 25 21 19
e(mm) 7.2 6 6.6
δf(Mpa) 10.29155 12.17975 12.08468
δav(Mpa) 11.51865895
stddev 1.063774104
TableC7:FlexuralStrengthParametersfor90%FillerConcentration
90%graphitefiller
spec13 spec14 spec15
b(mm) 19 21.5 20
d(mm) 3.3 3.2 3.1
F(N) 20 17 16
e(mm) 2.9 3 3.6
δf(Mpa) 10.23633 8.177235 8.815817
Volume 3 Issue 3: 2015 Volume 3 Issue 4: 2015
www.ijset.in ISSN (O): 2348-4098 ISSN (P): 2395-4752
International Journal of Science, Engineering and Technology Page 60

δav(Mpa) 9.076462078
stddev 1.054004292
Volume 3 Issue 3: 2015 Volume 3 Issue 4: 2015
www.ijset.in ISSN (O): 2348-4098 ISSN (P): 2395-4752
International Journal of Science, Engineering and Technology Page 61

SEISMIC PERFORMANCE EVALUATION OF RC BUILDINGS WITH VERTICAL IRREGULARITIES SUBJECTED TO BIAXIAL EXCITATION
DR.MOHD.HAMRAJ1, MOHAMMED MOIZ KHAN2
1Professor, Civil Engineering Department, Muffakham Jah College of Engineering and Technology, Telangana, India, [email protected]
2Post Graduate Student, Civil Engineering Department, Muffakham Jah College of Engineering and Technology, Telangana, India, [email protected]
ABSTRACT
Reinforced concrete multi‐storied buildings are very complex to model as structural systems for analysis. The current version of the IS: 1893‐2002 requires that practically all multistoried buildings be analyzed as three‐dimensional systems. This is due to the fact that the buildings have generally irregularities in plan or elevation or in both and later that may have a detrimental influence and effectiveness on seismic performance itself. Seismic analysis is generally performed by creating a structural model which is excited with forces in two orthogonal directions separately i.e. they are subjected to uniaxial excitation. But an actual earthquake will have its effect in both the directions simultaneously (Biaxial excitation). Limited research has been carried out on effect, of such biaxial excitation on vertical irregular buildings. The study as a whole makes an effort to evaluate the effect of vertical irregularities on RC buildings subjected to biaxial excitation. The objective of this work is to carry out Nonlinear Time history Analysis (THA) of vertically irregular RC building frames.For the purpose of the work, comparative study has been done with regular shear wall to analyze the effect of vertical irregularities (irregular shear wall and soft first storey) on low‐rise and high‐rise symmetric buildings. The symmetry is imposed to avoid the torsional effects and enhance the irregularities in elevation.The analysis engine used for the analysis and design is ETABS version 13. In the study, base shear, story displacement and story drifts of the three structures were studied; one with irregular shear wall in elevation (Building B), the other with irregular shear wall in core of the building (Building C) and the third with soft first storey (Building D). The results obtained were compared with those obtained from the structure with regular shear wall (Building A).The earthquake demand was obtained from a time response dynamic analysis using acceleration record from the Bhuj Earthquake of January 26, 2001. The analytical results show that there is a reduction in base shear by 39% and 46% of buildings B and C respectively and the story displacement is increased by 14% and 29% respectively when they are compared with the building A. There is a lot of increase in story drift by 66% and 84% in both building B and C respectively when it is compared with building A.The Building D with soft first storey has 19% reduction in base shear when it is compared with the Building A. Also, there is large increase in story displacement and story drifts of the building by 75% and 67% respectively when compared with Building A. The results illustrated that significant effect of the vertical irregularities was observed on the storey drift, base shear, storey displacement of low rise and high rise symmetric buildings.
Index Terms: Vertical Geometric Irregularity; Stiffness Irregularity; Biaxial Base excitation; Nonlinear Time history analysis.
1. INTRODUCTION
During an earthquake, failure of structure starts at points of weakness. This weakness arises due to discontinuity in mass, stiffness and geometry of structure. The structures having this discontinuity are termed as Irregular structures. Irregular structures contribute a large portion of urban infrastructure.
Vertical irregularities are one of the major reasons of failures of structures during earthquakes. For example structures with soft storey were the most notable structures which collapsed. So, the effect of vertically irregularities in the seismic performance of structures becomes really important. Height‐wise changes in stiffness render the dynamic characteristics of these buildings different from the regular building.
IS 1893 definition of Vertically Irregular structures: The irregularity in the building structures may be due to irregular distributions in their mass, strength and stiffness along the height of building. When such buildings are constructed in high seismic zones, the
analysis and design becomes more complicated. There are two types of irregularities‐
1. Plan Irregularities.
2. Vertical Irregularities.
Vertical Irregularities are mainly of five types‐ a) Stiffness Irregularity — Soft Storey‐A soft storey is one in which the lateral stiffness is less than 70 percent of the storey above or less than 80 percent of the average lateral stiffness of the three storeys above.
b) Stiffness Irregularity — Extreme Soft Storey‐An extreme soft storey is one in which the lateral stiffness is less than 60 percent of that in the storey above or less than 70 percent of the average stiffness of the three storeys above.
ii) Mass Irregularity‐Mass irregularity shall be considered to exist where the seismic weight of any storey is more than 200 percent of that of its adjacent
Volume 3 Issue 3: 2015 Volume 3 Issue 4: 2015
www.ijset.in ISSN (O): 2348-4098 ISSN (P): 2395-4752
International Journal of Science, Engineering and Technology Page 62

storeys. In case of roofs irregularity need not be considered.
iii) Vertical Geometric Irregularity‐ A structure is considered to be Vertical geometric irregular when the horizontal dimension of the lateral force resisting system in any storey is more than 150 percent of that in its adjacent storey.
iv) In‐Plane Discontinuity in Vertical Elements Resisting Lateral Force‐An in‐plane offset of the lateral force resisting elements greater than the length of those elements.
v)Discontinuity in Capacity —Weak Storey‐A weak storey is one in which the storey lateral strength is less than 80 percent of that in the storey above.
As per IS 1893, Part 1 Linear static analysis of structures can be used for regular structures of limited height as in this process lateral forces are calculated as per code based fundamental time period of the structure. Linear dynamic analysis are an improvement over linear static analysis, as this analysis produces the effect of the higher modes of vibration and the actual distribution of forces in the elastic range in a better way.
1.1 IMPORTANCE OF SEISMIC ANALYSIS
The prediction of the response of a structure to a particular type of loading is of utmost importance for the design of structure. Basically the codes and previous experiences provide us with a lot of information regarding the type of loads and their intensities for different types of structures and the site conditions. The analysis procedure to be adopted purely depends upon the engineers choice as per the accuracy of the work required. The nonlinear time history analysis can be regarded as the most accurate method of seismic demand prediction and performance evaluation of structures. Although, this method requires the selection of an appropriate set of ground motion, detailed site conditions and also a numerical tool to handle the analysis of the data, which is in many cases computationally expensive still it is regarded as the most detailed analysis and highly accurate analysis method.
2. OBJECTIVE AND SCOPE OF THE STUDY
The present work aims at the evaluation ofdesign lateral forces on buildings with two irregularities namely vertical geometric irregularity (irregular shear wall) and stiffness irregularity (soft first storey) subjected to biaxial excitation and to compare the results of different structures. The buildings analyzed in this work are:
1) Building A: Regular Shear Wall (Shear Wall up to top storey both in core and elevation of the building)
2) Building B: Irregular Shear Wall (Shear wall interrupted at mid story in elevation of the Building A).
3) Building C: Irregular Shear Wall (Shear Wall interrupted at mid story in core of the Building A)
4) Building D: Building having Soft First Storey.
These four types of buildings were generated in 4, 8, 12 story reinforced concrete symmetrical buildings. The structures are analyzed in accordance with seismic code IS 1893:2002 and using time history analysis in E‐tabs package.
3. METHODOLOGY
The purpose of the NLTHA is to evaluate the expected performance of a structural system by estimating its strength and deformation demands in design earthquakes by means of a dynamic inelastic analysis, and comparing these demands to available structures with irregular shear wall so as to observe the increase in the response of structures of interest. The evaluation is based on an assessment of performance parameters like storey displacements, storey drift, torsional moment, base shear.The NLTHA is perhaps the only procedure which captures the realistic response of the structures when subjected to real earthquake loading.Following are the general sequence of steps involved in performing NLTHA using ETABS V13 in the present study:
1. A two or three dimensional model that represents the overall structural behavior created.
2. For reinforced concrete elements the appropriate reinforcement is provided for the cross sections.
3. Gravity loads composed of dead loads and a specified proportion of live load is assigned as seismic weight to the structure.
4. Free vibration un‐damped modal analysis is performed to make note of the frequencies and time periods of the structure.
5. The time history function from a file is selected and the time history function is defined.
6. The non‐linear direct integration time history load cases are defined by assigning the ground acceleration time history function as loading in X &Y direction and by assigning proportional damping NLTHA is set to run.
7. After the analysis is completed the displacement pattern of the structure is studied and drifts are calculated.
8. The other responses such as base shear and displacements are noted.
4. PARTICULARS OF BUILDINGS
The aim of the present work is to evaluate the seismic response of the structure subjected to biaxial excitation having vertical irregularities in elevation using ETABS. The layout of plan having symmetric 3X3 bays of equal length of 4m. The plan is kept same for all buildings by varying floor levels of 4, 8 and 12.The structures are subjected to seismic excitations in both X and Y directions and observed the seismic response. The BHUJ earthquake data is used as ground motion data for performing non‐linear time history analysis.
Assumed preliminary data required for the analysis of the frame
1. Type of Structure: Moment Resisting Frame
2. Floor height : 3m
Volume 3 Issue 3: 2015 Volume 3 Issue 4: 2015
www.ijset.in ISSN (O): 2348-4098 ISSN (P): 2395-4752
International Journal of Science, Engineering and Technology Page 63

3. Li
4. De
5. M
6. Si
750x
7. Si
450
8. Sp
9. Zo
10. I
11. R
12. T
ve load
ead load
aterials
ze of column
x750mm (G+
ze of beams
x 450 mm (G
pecific weight
one
Importance fa
Response red
Type of soil
Fig 4.1 Plan v
Fig
: 5 kN/m
: 10 kN/m
: M30, Fe
: 450x450m
+12)
: 300 x 300
G+12)
t of RCC: 25 K
: V
actor :
duction factor
: M
view of Build
4.1.13D view
2
m2
e500
mm(G+4,G+8)
0 mm (G+4,G+
KN/m3
V
1
r : 5
Medium.
dings without
w of Building
)
+8)
t shear wall
A
F
F
F
Fig 4.1.2 3D v
Fig 4.1.3 3D v
Fig 4.1.4 3D v
view of Buildi
view of Buildi
iew of Buildi
ng B
ng C
ng D
Volume 3 Issue 3: 2015 Volume 3 Issue 4: 2015
www.ijset.in ISSN (O): 2348-4098 ISSN (P): 2395-4752
International Journal of Science, Engineering and Technology Page 64

Fig 4.1.5BHUJ N‐W component earthquake ground acceleration record
Fig 4.1.6 Illustrates the non‐linear direct integration time history load case using BHUJ N‐W time history function.
4.1 COMPARISON OF RESULTS OF BUILDINGS WITH VERTICAL GEOMETRIC IRREGULARITY
Fig 4.2 Base shear comparison of four storey symmetric buildings
Fig 4.2.1 Story Drift comparison of four storey symmetric buildings
Fig 4.2.2 Story displacement comparison of four storey symmetric buildings
Fig 4.2.3 Base shear comparison of eight storey symmetric buildings
Building A Building B Building C
Series1 4798.5 2591.6 2237.1
0
1000
2000
3000
4000
5000
6000
4 Storey
Bas
e sh
ear
in k
N
Building A Building B Building C
Series1 0.391 1.1 2.1
0
0.5
1
1.5
2
2.5
4 Storey
Stor
yD
rift
in m
m
Building A Building B Building C
Series1 3.71 5.67 10.94
0
2
4
6
8
10
12
4 Storey
Stor
ydi
spla
cem
ent i
n m
m
Building A
Building B
Building C
Series1 5014 2841.1 2647.1
0
1000
2000
3000
4000
5000
6000
Bas
e Sh
ear
in k
N
8 Storey
Volume 3 Issue 3: 2015 Volume 3 Issue 4: 2015
www.ijset.in ISSN (O): 2348-4098 ISSN (P): 2395-4752
International Journal of Science, Engineering and Technology Page 65

Fig 4.2.4 Story displacement comparison of eight storey symmetric buildings
Fig 4.2.5 Story drift comparison of eight storey symmetric buildings
Fig 4.2.6 Base shear comparison of twelve storey symmetric buildings
Fig 4.2.7 Story displacement comparison of twelve storey symmetric buildings
Fig 4.2.8 Story driftcomparison of twelve storey symmetric buildings
4.2 COMPARISONOF RESULTS OF BUILDINGS WITH STIFFNESS IRREGULARITY
Building A
Building B
Building C
Series1 13.41 20.34 41.02
051015202530354045
Stor
ey D
ispl
acem
ent i
n m
m
8 Storey
Building A
Building B
Building C
Series1 0.741 2.2 4.13
0
0.5
1
1.5
2
2.5
3
3.5
4
4.5
Stor
y D
rift
in m
m
8 Storey
Building A
Building B
Building C
Series1 6186.4 3772.4 3340.2
0
1000
2000
3000
4000
5000
6000
7000
Bas
e Sh
ear
in K
N
12 Storey
Building A Building B Building C
Series1 27.72 32.08 38.96
0
5
10
15
20
25
30
35
40
45
Stor
y D
ispl
acem
ent i
n m
m
12 Storey
Building A Building B Building C
Series1 1.43 4.2 7.98
0
1
2
3
4
5
6
7
8
9
Stor
y D
rift
in m
m
12 Storey
Building A Building D
Series1 2079.1 1106.5
0
500
1000
1500
2000
2500
Bas
e Sh
ear
in K
n
G+4
Volume 3 Issue 3: 2015 Volume 3 Issue 4: 2015
www.ijset.in ISSN (O): 2348-4098 ISSN (P): 2395-4752
International Journal of Science, Engineering and Technology Page 66

Fig 4.3 Base shear comparison of four storey symmetric buildings
Fig 4.3.1 Story Displacement comparison of four storey symmetric buildings
Fig 4.3.2 Story Drift comparison of four storey symmetric buildings
Fig 4.3.3 Base shear comparison of eight storey symmetric buildings
Fig 4.3.4 Story displacement comparison of eight storey symmetric buildings
Fig 4.3.5 Story drift comparison of eight storey symmetric buildings
Fig 4.3.6 Base shear comparison of twelve storey symmetric buildings
Building A Building D
Series1 0.49 7.487
0
1
2
3
4
5
6
7
8
Stor
y D
ispl
acem
ent i
n m
m
G+4
Building A Building D
Series1 0.164 1.872
0
0.2
0.4
0.6
0.8
1
1.2
1.4
1.6
1.8
2
Stor
y D
rift
in m
m
G+4
Building A Building D
Series1 2574.45 1452.3
0
500
1000
1500
2000
2500
3000
Bas
e Sh
ear
in K
N
G+8
Building A Building D
Series1 0.52 22.32
0
5
10
15
20
25
Stor
y D
ispl
acem
nent
in m
m
G+8
Building A Building D
Series1 0.174 5.58
0
1
2
3
4
5
6
Stor
y D
rift
in m
m
G+8
Building A Building D
Series1 5947.7 4816.3
0
1000
2000
3000
4000
5000
6000
7000
Bas
e Sh
ear
in k
N
G+12
Volume 3 Issue 3: 2015 Volume 3 Issue 4: 2015
www.ijset.in ISSN (O): 2348-4098 ISSN (P): 2395-4752
International Journal of Science, Engineering and Technology Page 67

Fig 4.3.7 Story displacement comparison of twelve storey symmetric buildings
Fig 4.3.8 Story drift comparison of twelve storey symmetric buildings
5. CONCLUSIONS
In this work, the preliminary results of a large parametric study, whose aim is the performance evaluation of irregularity in elevation for frame buildings, are shown. After the numerical investigation, following conclusions can be made:
1. The Building B reduces the base shear by 46%, 43%
and 39% for 4, 8 and 12 stories respectively when compared with the Building A. Whereas, the Building C reduces the base shear by 53%, 47% and 46% as storey level increases when compared with the Building A.
2. The increase in Story displacement of Building B is 35%, 34% and 14% for 4, 8 and 12 stories respectively when compared with the Building A. Whereas in case of Building C, there is an significant
increase in story displacement by 66%, 67% and 29% when compared with Building A.
3. The increase in Story drift of Building B is 64%, 66% and 66% for 4, 8 and 12 stories respectively when compared with the Building A. Whereas in case of Building C, there is an significant increase in story displacement by 81%, 82% and 84% when compared with Building A.
4. Maximum story drift and story displacement will increaseas the vertical irregularities increase in models. The structural and architectural configurations should be observed keenly to attain the optimum performance of the building in terms of its seismic response.
5. When time history analysis was done for regular as well as stiffness irregular building (soft storey), it was found that displacements of upper stories did not vary much from each other but as we moved down to lower stories the absolute displacement in case of soft storey were higher compared to respective stories in regular building.
6. The Building D with soft first storey reduces the
bases hearby 47%, 44% and 19% for 4 , 8 and 12 stories respectively when compared with the building A.
7. There is a large amount of increase in Story displacements at first storey of the building D by 93%, 97% and 75% for 4, 8 and 12 stories respectively when compared with the building A.
8. Also there is much increase in the story drifts of the Building D at first storey by 91%, 96% and 67% as storey level increases when compared with the Building A.
5.1 SCOPE OF FURTHER STUDY
1. Soil structure interaction has always attracted many researchers as an interesting topic for static procedures; the same can also be done for non‐ linear time history analysis using soil structure interaction.
2. Non‐linear time history analysis could also be performed to study the effect of other types of irregularities on the structures by varying seismic zones and subjecting to biaxial excitation.
REFERENCES
1. Influence of Vertical Irregularities in the Response of Earthquake Resistant Structures by J. H. Cassis and E. Cornejo, Eleventh World Conference on Earthquake Engineering, (1996), Paper No. 1102.
2. Study of Response of Structural Irregular Building Frames to Seismic Excitations by Anil and Gupta Ashok ISSN 2249‐6866 Vol.2, Issue 2 (2012) 25‐31.
3. Inelastic Effects of Biaxial Excitation on Geometrically Asymmetric Plan Building with Biaxial Eccentricity by Nishant Kumar K., Rajul K. Gajjar
Building A Building D
Series1 1.033 4.185
0
0.5
1
1.5
2
2.5
3
3.5
4
4.5St
ory
Dis
plac
emen
t in
mm
G+12
Building A Building D
Series1 0.345 1.046
0
0.2
0.4
0.6
0.8
1
1.2
Stor
y D
rift
in m
m
G+12
Volume 3 Issue 3: 2015 Volume 3 Issue 4: 2015
www.ijset.in ISSN (O): 2348-4098 ISSN (P): 2395-4752
International Journal of Science, Engineering and Technology Page 68

(2013)International Journal of Engineering and Advanced Technology (IJEAT).
4. CemalettinDonmez, “The lateral Drift of Simple Structural Systems Subjected to Biaxial Excitation”13thWorld Conference on Earthquake Engineering.
5. C. M. Ravi Kumar and et al., Seismic Performance Evaluation of RC Buildings with Vertical Irregularity. Indian Society of Earthquake Technology. 2012., Paper No. E012.
6. K. Güler, M. G. Güler, B. Taskin and M. Altan., ―Performance Evaluation of a Vertically Irregular RC Building‖. 14th World Conference on Earthquake Engineering, (2008), Beijing., China.
7. Dolce, M. and S. Simoninin (1986) the influence of structural regularity on the seismic behavior of buildings. Proc. 8th European Conference on Engineering, Portugal.
8. “Soft Story” and “Weak Story” in Earthquake Resistant Design: A Multidisciplinary Approach by L.Teresa Guevara‐Perez, 15th World Conference on Earthquake Engineering, Lisboa 2012.
9. IS 1893(Part1) 2002 ‐ Indian Standard criteria for earthquake resistant design of structures (5th revision), 2002.
BIOGRAPHIES
Dr.Md.Hamraj, Professor & Coordinator (ME Structural Engg.), Civil Engineering Dept., Muffakham Jah College of Engg. & Technology, Email:[email protected]
Mohd. Moiz Khan, Post Graduate Student, M.E. ( Structures), Civil Engineering Dept., Muffakham Jah College of Engineering & Technology, Email:[email protected]
Volume 3 Issue 3: 2015 Volume 3 Issue 4: 2015
www.ijset.in ISSN (O): 2348-4098 ISSN (P): 2395-4752
International Journal of Science, Engineering and Technology Page 69

STUDYOFTHEIODINATIONOFINDOLE‐3‐BUTYRICACIDBYAQUEOUSIODINEUSINGHYDRODYNAMICVOLTAMMETRY
1RAJENDRAP.YADAV,2BHARATB.BAHULE,3VITTHALT.BORKAR,4,*VIJAYT.DANGAT,5KANCHANG.SHINDE
1,2,3,4DepartmentofChemistry,NowrosjeeWadiaCollege,Pune411001,India
Email:[email protected];[email protected];[email protected]*[email protected];[email protected]
ABSTRACT
Thefastkineticsoftheiodinationofindole‐3‐butyricacid(3‐IBA)inaqueousmediumbymoleculariodineat7pHhasbeenstudiedusinghydrodynamicvoltammetryinthepresentstudy.Thereactionisveryrapidandthisspecialtechniquehasbeenemployed in these investigations. The reaction is found tobeof the secondorderand the specific reaction ratehasbeenevaluated as 590 M−1 s−1 at 22.0 0C. The frequency factor, energy of activation and entropy change in the reaction areevaluatedas3.48x10 9M−1s−1,38.3kJmole−1and −243.1 Jmol −1K−1respectively.These thermodynamicdataareused toelucidate the reactivityof theheterocycleunder studyonaquantitative scaffold in termsof the steric compulsions in thereaction dynamics. The heterocycle chosen for this study has pharmacodynamic significance as it is a component of theprecursorsofseveralbiologicallyimportantdrugmolecules.
Keywords:Hydrodynamicvoltammetry,Indole‐3‐butyricacid,Moleculariodine.
1. INTRODUCTION
Iodinations of aromatic substrates are known to beelectrophilic substitution reactions [1]. These are rapidreactionsinaqueousmediumdevoidofiodideions,dueto the lack of formation of the nucleophile I3− in thesereactions[2].Iododerivativesofaromaticsubstratesareknown to have several pharmaceutical applications,hence the rates and mechanisms of the formation ofthese derivatives is of significance [3]. In aqueousmedium, halogenations of aromatic substrates followrapid kinetics necessitating special techniques liketemperature jump, pressure jump, competitiontechnique,stoppedflowmethodandpulseradiolysis[4].
Wehavehereinadoptedarelativelysimpleyetefficienttechnique, hydrodynamic voltammetry to monitor therate of the fast iodination of the indole derivative; 3‐indolebutyricacidinaqueousmedium[5].
The indole subunit is a ubiquitous component ofmanybioactive molecules in natural products. Its study hasattracted the attention of researchers because of itsability to bind multiply to receptors. The resultingprivileged structures have immense pharmacodynamicsignificanceasprecursorsofdrugsthatareinhibitorsofcarcinogenesis[6].
Thereactionunderstudyisasfollows,
Iodine being the only species in the reaction that iselectro‐activeat amicro‐electrode, itsdecayduring the
reaction may be tracked by measuring the diffusionlimited current at a rotating platinum microelectrode[RPE]thatrotatesat600rpm.Thereferenceelectrodeisthesaturatedcalomelelectrode [SCE].The followingarethe two half‐cell reactions at the two electrodes in thegalvanic cell used in this hydrodynamic voltammetrytechnique:
I2+2e−→2I−……….Thepositiveelectrode,RPE
2Hg+2Cl− →Hg2Cl2 +2e−……….Thenegativeelectrode,SCE
I2+2Hg+2Cl−→Hg2Cl2+2I−……….OverallReaction
The use of a large concentration of the supportingelectrolyte KNO3 ensures linear proportionality of thediffusion limited current at the RPE due to the iodineconcentrationinthereaction.
2. MATERIALSANDMETHOD2.1EXPERIMENTAL
2.1.1Chemicals
Iodine:Astocksolutionofiodineispreparedindoubledistilledwaterdevoidofiodideions.Thestrengthofthissolutionisdeterminediodimetrically.
Indole‐3‐Butyric Acid: The required weight of A. R.grade3‐IBA(CASNOis133‐32‐4)isusedtopreparethestocksolutionindoubledistilledwater.
PotassiumNitrate:A.R.gradepotassiumnitrateisusedasthesupportingelectrolyte.
Volume 3 Issue 3: 2015 Volume 3 Issue 4: 2015
www.ijset.in ISSN (O): 2348-4098 ISSN (P): 2395-4752
International Journal of Science, Engineering and Technology Page 70

2.1.2Electrodes
RPE – The cathode is a bent platinum electrode (RPE)rotated at a speed of 600 rpm in the reaction vesselcausing stirring action in the solution as it senses theconcentration of the electro‐reducible entity in thereactionintermsofthediffusioncurrent.
SCE ‐ A saturated calomel electrode is the referenceelectrode (SCE). A constant potential of + 0.2 V versusthe RPE is applied between the two electrodes using apotentiometer.
A galvanometer with a sensitivity of 0.10 nA cm−1providedwithalampandscalearrangementisusedforthemeasurementof thediffusion currentdue to iodineintermsofthedeflectionofthegalvanometerlightspot.The current passing through the galvanometer iscontrolledbyusingashuntsothatthedeflectionof thelightspotiswithinscalelimits.
2.2CALIBRATION
The RPE and SCE are dipped in 50.0 cm3 of 5×10⁻³ Mpotassium nitrate which is the supporting electrolyte.The galvanometer light spot is adjusted to zerodeflectiononthescale.Potassiumnitratesolutionisthenreplacedby5×10−5Miodinesolutioncontaining5×10−3M potassium nitrate. The shunt is adjusted for thedeflectionofthegalvanometerlightspottobearound40cm. The shunt value is kept constant throughout theexperiment. The diffusion current values in terms ofdeflectionofthelightspotonthescalearerecordedforvariousconcentrationsofiodineintherangeof1×10−6Mto5×10−6M.Theplotofdeflectionobservedincmversusconcentrationofiodineisfoundtobelinear.
Thecalibrationreadingsarecarriedoutatfivedifferenttemperatures and the readings are recorded only afterthesolutionshaveattainedthethermostattemperaturesat which the kinetic reading are to be observedsubsequently.
TABLE‐1:CALIBRATIONOFTHEDIFFUSIONCURRENTOFATVARIOUSTEMPERATURESFORTHEIODINATION
OFINDOLE‐3‐BUTYRICACIDATpH7
[I2]/10−5M
DiffusionCurrent/nA
12.20C
17.40C
22.00C
27.20C
32.400C
0.25 6.0 6.2 6.5 6.7 7.0
0.50 12.1 12.5 13.0 13.4 13.9
0.75 18.2 18.7 19.4 20.2 20.9
1.00 24.0 25.0 25.9 26.9 27.8
1.25 30.0 31.2 32.4 33.6 34.8
Fig.–1:CalibrationofthediffusioncurrentofI2atvarioustemperaturesof3‐IBAinaqueousmedium.
TABLE‐2:KINETICSOFIODIATIONOF3‐IBAAT22.00CBYI2INAQUEOUSMEDIUMAT7pH
Time/sDiffusioncurrent/nA
[I2]/10−5M [I2]−1/104M−1
0 32.4 1.25 8.0
30 25.9 1.02 9.8
60 22.5 0.86 11.6
90 19.5 0.74 13.4
120 17.1 0.65 15.2
150 15.0 0.59 16.8
180 13.5 0.53 18.6
FIG.2:KINETICSOF3‐IBABYI2AT7pHATDIFFERENTTEMPERATURES
Volume 3 Issue 3: 2015 Volume 3 Issue 4: 2015
www.ijset.in ISSN (O): 2348-4098 ISSN (P): 2395-4752
International Journal of Science, Engineering and Technology Page 71

TABLE‐3:VARIATIONOFSPECIFICREACTIONRATEOFIODINATIONOF3‐IBAWITHTEMPERATUREAT7pH
T/K [T]−1/10−4[K−1] k/M−1s−1 logk
285.2 35.0 297 2.472
290.4 34.4 438 2.641
295.3 33.8 590 2.770
300.2 33.3 897 2.952
305.4 32.7 1212 3.082
FIG.3;ARRHENIUSPLOTFORTHEIODINATIONOF3‐IBABYI2AT7pH
2.3KINETICMEASUREMENTS
50 cm3 each of 2.5×10⁻⁵ M 3‐indole butyric acid andiodine containing hundred fold potassium nitrate andthe buffer components required for 7 pH are kept in athermostatindifferentcontainersinathermostat.Afterattainingthedesiredtemperaturetheyaremixedinthereactionvesselkept inthe thermostat inwhichtheSCEisdippedandtheRPEisrotating.Atthetimeofmixingastop‐clock is started. As the reaction proceeds, thegalvanometer deflection decreases steadily and thedeflections are recorded at every 10 seconds for about80seconds.
The above procedure of calibration and kineticmeasurement is repeated thrice for checking thereproducibilityof thegalvanometerreadings.Thesearefound to be within the limits of ± 0.2 cm whichcorrespondsto±0.20nAcurrent.
Fromtheobserveddeflectionsduring thekineticstudy,the concentrations of the unreacted iodine at variousinstantareobtainedusingthecalibrationcurve(Fig.‐1).
A plot of [I2]−1 versus time is found to be linear andhencethereactionisinferredtobeofthesecondorder.The slope of this plot gives the specific reaction rate kshowntypicallyfor22.00C(Fig.‐2).
Thesestudiesarecarriedoutatvarioustemperaturesinrange10−300C,fromwhichtheenergyofactivation,‘Ea’for the reaction is evaluated [Fig.3]. Further, thefrequencyfactorsAandtheentropychangeΔS#forthereactionarealsoevaluated.
3. CALCULATIONS
FromFig.3,
SlopeofthegraphoflogkVs1/T=−2000M−1s−1
Energyofactivation(Ea):=−2.303×8.314×−2000
=38.3kJmole−1
Frequencyfactor(A):
k=Ae(Ea/RT)
A=3.48×10⁹M−1s−1
Entropyofactivation(∆S)
A=(ekTe∆s#/R)/h
∆S=−243.12Jmol‐1K‐1
TABLE4:KINETICPARAMETERSEVALUATEDFORTHEIODINATIONOF3‐IBAAT7pHAT22.00C
No. Parameters Values
1 Specificreactionrate/M−1s−1 590
2 Energyofactivation/kJmol−1 38.3
3 Frequencyfactor/109M−1s−1 3.48
4 Entropyofactivation/JK−1mol−1 −243.1
4. RESULTSANDDISCUSSION
The sole halogenating agent in the reaction is thehalogenatomintheaqueousequilibria,consideringtheequilibriumconstantvalues.
The reaction are found to follow second order kineticssince the plot of 1/[I2] versus time straight line. Thegradientofthis lineisthespecificreactionratesfortheiodinationreaction..
The product in the reaction is 5‐iodoindole‐3‐butyricacid considering the confirmation from NMR data andfromstoichiometry.
5. CONCLUSION
The potential of nitrogen having a lone pair to donateelectronsisaccentuatedinIndole‐3‐butyricacidbecauseofconjugationofthebenzeneringandhencealonepairofelectronsisinvolvedinconjugation.Thisincreasesthenucleophilicityofthebenzeneringandactivatesposition5.
Volume 3 Issue 3: 2015 Volume 3 Issue 4: 2015
www.ijset.in ISSN (O): 2348-4098 ISSN (P): 2395-4752
International Journal of Science, Engineering and Technology Page 72

InIndole‐3‐butyricacid,thethirdpositionisblockedbythe substituent and hence the iodination occurs at thefifthpositionofthering.Thisisconfirmedusing13Cand1HNMRspectra.
Itisnoteworthythatthepresentstudyisintotalaccordofgreenchemistryprinciples.Thereactionsarefastandmicrogram chemicals are used. The solutions areextremelydiluteandarenon‐hazardous.
The rapidity of the reaction ensures low powerconsumption for the equipment which is needed to beoperatedonlyforafewsecondsforthecompletionofthestudyofasinglesetofobservations.
REFERENCES
[1] Berliner E.[1966] The Current State of PositiveHalogenatingAgents,J.Chem.Edu.,43(3):124‐133
[2] Bonde,S.L., Dangat,V.T., Borkar,V.T. andYadav,R.P. [2012] Rapid Iodinations of Xylidines inAqueous Medium: Kinetic Verification of SpeculatedReactivitiesRes.J.Chem.Sci.2(6);1‐5
[3] Langen,K.J.,Dirk,P.andCoenen,H.H.[2002]3‐[123I]Iodo‐α‐methyl‐L‐tyrosine: uptake mechanisms andclinical applications. Nuclear Medicine and Biology.29(6);625‐631
[4] Hart,E.J. and Boag,J.W.[1962] AbsorptionSpectrum for the Hydrated Electron in Water andAqueousSolutions.J.Amer.Chem.Soc.84,4090
[5] Borkar, V.T., Dangat, V.T., Bonde, S.L. [2013] AQuantitativeStructure‐ReactivityAssessmentofPhenolsby Investigation of Rapid Kinetics using HydrodynamicVoltammetry: Application of the Hammett Equation inAqueous Medium. International Journal of ChemicalKinetics(WileyPub).9.(46),693‐702.
Volume 3 Issue 3: 2015 Volume 3 Issue 4: 2015
www.ijset.in ISSN (O): 2348-4098 ISSN (P): 2395-4752
International Journal of Science, Engineering and Technology Page 73

DE‐EMBEDDINGOFTESTFIXTURE:ANECESSARYSTEPINPOSTSILICONVALIDATIONFORACCURATECHARACTERIZATIONOFHIGHSPEEDDEVICES
1SURENDRAKUMARDADORE,2LALITAGUPTA,3SIYARAMSAHU
1NationalInstituteofTechnology,Bhopal,Email:[email protected]
2AssistantProfessor,NationalInstituteofTechnologyBhopal,Email:[email protected]
3NationalInstituteofTechnology,Calicut(India),Email:[email protected]
ABSTRACT
HighspeedinterconnectsonaPCBcanaltertheperformanceofthedevicewhenthedatarateisintheorderofGbpsrange.TheseinterconnectsarenecessarypartsonaPCBsincedirectmeasurementoffrequencycharacteristicsofadeviceundertest(DUT)atmicrowavefrequenciesisoftendifficultduetosomeinterveningfixtureusedforfeedingtheDUT.Thesetestfixturesorinterconnectneedtobecharacterizedfirstandthende‐embedded.Thispaperfocusesonmeasurementtechniquesusedtocharacterizehighspeeddevicesanddescribesanalgorithmusedtode‐embedatest fixture(interconnectsonPCB)withthehelpofmeasuredS‐parameters.EffectsofDe‐embeddingoperationonvarioustimedomainparametersi.e.Eyewidth,Peaktopeakamplitudelevel,Risetimeetc.areanalyzed.
1. INTRODUCTION
The advancement of semiconductor process technologytosub‐microndimensionhas ledto thedevelopmentofbroad spectrum of integrated circuit (IC) systemcomponents. These complex system components arebeing further integrated on silicon to form largerSystem‐on‐a‐Chip (SOC) [7]. This leads towards theintegratedcircuitstoworkathigherspeeds.Postsiliconvalidation and characterizations is the last step indevelopment of any electronics product.Ensuring theintegrityofsignalsandcorrectoperationofproductsforthese high data rates has become challenging and hasbeenamajorfocusofresearchanddevelopmentsinceitisthevitalstageofproductlifecycle.Theseeffortsledtoremarkableadvancesinthetheoryofsignalintegrityandpractice of validation of systems over several decades.Validation is a very crucial phase of today’s design andmanufacturing process which takes more time as theproductsmovingtowardsleadingedgetechnologiesandhighfrequenciesbecauseofsignalintegrityeffects.
As thedatarateof systems ismovingtogigabits range,platform designers now face the challenge of Creatinginterconnects between various components of a PCB inHighspeedcommunicationtomaintainthesignalaswellas power integrity of a signal [6]. For example MPHY,whichtransfersdataatarateof6Gb/sandat10‐10BER.Size, weight and cost constraints along with higheroperating frequencies and advances in the technologyare driving the use of smaller and more integratedpackaged parts at the assembly level. A test fixture orcable is usually inserted between the compliance pointand the instrument to facilitate a more convenientmeasurement.AfewinchesofPCBroutingand/orcablecan distort the signal hence it is very necessary toremovealltheeffectsofatestfixturefromthemeasuredresults [1]. At higher speeds, board traces, variousinterconnect and package signal nets behave liketransmission line that may cause distortion in signalquality [2]. In order to meet these high speed
requirements the design engineer must consider andminimize all the factors that affect the integrity of thesignalinordertoensurethecorrectsystemfunctioning.
2. SILICONVALIDATIONFLOW
Figure1:SiliconvalidationflowThe silicon validation flow begins with the design of ahigh speed board satisfying the required validationspecifications. Later, it needs to perform differentanalyses on various objects that are used in the boarddesign. Figure 1 shows Silicon validation flow of highspeeddevices.According to the protocols mentioned in thespecification,Printedcircuitboardisdesigned,oncethelayoutoftheboardiscompleted.Itrequiresanalysingtheboard transmission lines in a virtual environment interms of S parameters. Agilent ADS tool is used tosimulate S‐parameters and this step comes under thepre‐testcharacterization.Inpracticalenvironmentatest
Volume 3 Issue 3: 2015 Volume 3 Issue 4: 2015
www.ijset.in ISSN (O): 2348-4098 ISSN (P): 2395-4752
International Journal of Science, Engineering and Technology Page 74

engiactuparaTheembperfchar3. De‐emeasysteDUTofthand
Theparathemcom[4].
Thewav[4]
b1=
b2=
Forthet
_ T
ineer cannotual measuremameter measmeasured
beddingoperformed thenracterizations
DE‐EMBED
embeddingasurementofemthatcomT[4].ThegoaheDUT,whilefixtureR.
S‐parameteameternetwom for the tmbinednetwo
general equvesasafunct
a1T11+a2T12
a1T21+a2T22
eachof the ttranslationbe
∙
t rely with sments requirurements thS‐parameteration.Once tn only ses.
DDINGOFTE
of a testS‐Parameterprisesoftestalofde‐embeethemeasure
Figur
er networksorksfirst,sothree cascadrkcanbevie
Figur
uations for rionoftheT‐p
2(1)
2(2)
threenetworetweenTpar
∙
(3
simulated rered. VNA ishat measuresrs are usedthede‐embedetup is rea
ESTFIXTUR
fixture begrs.Figureshotfixturesoneddingistogementisdon
re2
s are transthatwecanded networkewedasatw
re3
reflection andparametersi
rksof thecarameterandS
)
sults so is ts a suit fors S‐parameted later in dddinghasbeady for te
RE
gins with towsacascadbothsidesogetSparametewithfixture
slated intoeasilymultipks above. Toportnetwo
d transmissiisshownbelo
scaded systeSparameteri
theS
ers.de‐eenest
thededfatereL
TplyTheork
onow
em,is:
_
Thfix
[T
W
T‐
[T4.
Afusisinarelbem
ThtrsimnoprPCmwge(Sof
5.EfS‐mouefm
S ∙
hemeasuredxtureis[4]
TMeasured]=[TR
Where[TR]an
‐matrixofDU
TDUT]=[TR]‐1
. DE‐EMBEOSCILLO
fter calculatisingvectornperformedo
nternally perfre explainediminate theelow is a schmeasurement/
Fi
here are thransmitter, scmulation n
measurementode but it isractical condCB board.measurementwhich is undeenerates S‐paS2P)whichcafthetextfixtu
. RESULTS
ffectsofDe‐e‐parametersmeasured S‐putput henceffectiveonlyimade. For va
∙
T‐matrixfor
R][TDUT][TL](
d[TL]arekno
UTcanbecalc
[TMeasured][TL]
EDDING OSCOPE
ing S‐paramenetworkanalyonadigitalsforms themd above in Eeffect of a thematic of th/De‐embeddi
gure4UserI
ree blockscope and tesode and mshould be p
s performedditiondue toThe measunodealsoincesirable andarameter datanbeusedfuure.
S
mbeddingdefrom VNA
parameters wthe proces
ifaccurateS‐palidating pur
(4)
rthecombine
(5)
own
culatedas[4]
]‐1(6)
OF TEST
eter matrixyser (VNA),signaloscillosathematicalEquations 3,ext fixture. The test enviringhasbeen
Interfaceona
in the abovst fixture whmeasurementperformed aat the meastestprobingrements pecludetheeffeneed to beta in termsurthertode‐e
ependsonthei.e any inwill degradess of De‐emparametersmrpose, a com
edsetupwith
]
FIXTURE
for a test fixitsde‐embedscope(DSO).operationsw, 4, 5 andThe figure shronment in wperformed.
aDSO
ve figure nahich lies betwt node. Idat the Simulsurement nodg limitationoerformed atectsoftextfixeliminated.of two portembedtheef
emeasuremenaccuracy ine the De‐emmbedding wilmeasurementmparison is
htest
BY
xtureddingDSOwhich6 tohownwhich
amelyweendeallyationde inof thethe
xtureVNAdataffects
entofn thembedll betsaredone
Volume 3 Issue 3: 2015 Volume 3 Issue 4: 2015
www.ijset.in ISSN (O): 2348-4098 ISSN (P): 2395-4752
International Journal of Science, Engineering and Technology Page 75

between simulated S‐parameters and actual S‐parameters generated from VNA. Figure shows thecomparisonbetweensimulatedandactualS‐parametersof a PCB track. Simulated graphs are obtained fromAgilentADStool.
Figure5
Figure6
Figure7
Figure8
The figure depicts three different eye diagram plotswhichareplottedfordifferentconditions.Figure9showseye diagram plot for ideal case i.e. without any testfixture in between the simulation and measurementnode.Figure10showstheplotwiththeeffectsofthetestfixture and figure 11 shows eye diagram plot after de‐embedding the effects of the test fixture. Based uponthese plots, a quantitative analysis of various timedomainparameters i.e rise time, fall time etc. has beenperformed.Table1showstheeffectsofatestfixtureanditsde‐embeddingontheseparameters.
Figure9Idealcase(withoutanyTestFixture)
Figure10withTestFixturewithoutDe‐embedding
Figure11withTestFixturewithDe‐embedding
Table1De‐embeddingeffectsontimedomainparameters
Oscilloscope
Configuration
RealTimeParameters
Eye‐Width
Peaktopeakvoltage
Risetime
Falltime
Ideal Case(withoutanytestfixture)
982568 200
196
Volume 3 Issue 3: 2015 Volume 3 Issue 4: 2015
www.ijset.in ISSN (O): 2348-4098 ISSN (P): 2395-4752
International Journal of Science, Engineering and Technology Page 76

Oscilloscope
Configuration
RealTimeParameters
Eye‐Width
Peaktopeakvoltage
Risetime
Falltime
With test fixturewithout De‐embedding
975 584 338258
With test fixturewith De‐embedding
978 568 196198
Unit ofmeasurement
pS mV pS pS
6. CONCLUSION
In order to characterize high speed devices accurately,this paper describes de‐embedding algorithm which isnecessary to eliminate the effects of a test fixture,parasitics of pad and interconnections with asinglemeasurement [5].This algorithm isveryuseful inanenvironmentwhereprobinglimitationsoccur[3].Theaccuracy of de‐embedding algorithm depends on themeasurementofS‐parametersfromVNA.Anyinaccuracyin the measured S‐parameters will reflect in the de‐embedded output. This method is quick, accurate andconvenientforhighspeeddevices.
REFERENCES[1]. Xiaoning Ye, Ben Smith, Per Fornberg, AdamNorman, “Method and Applications of OscilloscopeWaveform De‐embedding”, 978‐1‐4244‐1699‐8/08/$25.00©2008IEEE.
[2].PaulD.Hale,,JeffreyJargon,,C.M.JackWang,BrettGrossman, Mathew Claudius, José L. Torres, AndrewDienstfrey, and Dylan F, “A Statistical Study of DeEmbedding Applied to Eye Diagram Analysis” , IEEETRANSACTIONS ON INSTRUMENTATION ANDMEASUREMENT,VOL.61,NO.2,FEBRUARY2012.
[3]. DiHu, Jaemin Shin, and TimothyMichalka,“Fixture‐free Measurement Technique for PDN DiscreteComponents”,2013ElectronicComponents&TechnologyConference, 978‐1‐4799‐0232‐3/13/$31.00 ©2013IEEE.
[4]. Xiaoning Ye Data Centre and Connected SystemsGroup, Intel Corp,”De‐embedding Errors due toInaccurate Test Fixture Characterization”, 2012 IEEEElectromagnetic Compatibility Magazine – Volume 1 –Quarter4.
[5]. Alexei s. Adalev’, japan, Nkolay v. Korovk, Russia,Masashi “De‐embedding microwave fixtures with thegenetic algorithm”, 0‐7803‐9374‐0/05/$20.00 2005IEEE.
[6]. Evan Fledell, Brett Grossman “PCB ManufacturingVariation Impact on high frequency measurementfixtures”ManuscriptreceivedOctober18,2010.
[7]. Vittorio Ricchiuti, Antonio Orlandi, Guilio Antonini,Siemens CNX, L’Aquila‐Italy “De‐embeddingMethods forcharacterizing PCB interconnections” 0‐7803‐9054‐7/05/$20.0020005IEEE.
Volume 3 Issue 3: 2015 Volume 3 Issue 4: 2015
www.ijset.in ISSN (O): 2348-4098 ISSN (P): 2395-4752
International Journal of Science, Engineering and Technology Page 77

IMPLEMENTATIONOFDOUBLY‐FEDWINDTURBINEALONGWITHPIDCONTROLLERTOMAINTAINTHEDESIREDOUTPUTLEVELSANDCONTROLTHE
PITCHACCORDINGTOWINDDIRECTION
1AJAYSHUKLA,2ANILGUPTA
1M.Tech.Scholar,DepartmentofElectricalandElectronicsEngineering,LNCT,Bhopal,India
2AssistantProfessor,DepartmentofElectricalandElectronicsEngineering,LNCT,Bhopal,India
ABSTRACT
Inordertoincreaseenergydemand,alternativesourceofenergygenerationisrequired.Amanyhybridsysteminvolvewindsystemduetoavailabilityandeasyaccessofwindresource.Thewindgeneratedpowerfluctuatingduetotimevaryingnatureand causing stability problems. When Wind turbine system is connected to the power grid to generate power alwaysfluctuatingdue to environmental conditions.Thispaper is tomodifyand simulation forawind farmwithahigh voltagetransmissionnetwork.HeremodelisdesignedtocontrolpitchanglebyusingPIDcontrollerandtomaintainoutputlevelbystabilizingrotorspeed.Analyticalmodelofwindturbinehasbeenpresentedandthiswas followedbythemodellingofthewindfarmunderSimPowerofsimulink.ThestimulatedturbinesystemusesaDoublyfedInductionGenerator(DFIG)havingacapacityof9MWwindfarmcomprisingofsix1.5MWwindturbineslinkedwith25kVdistributionsystemtransferspowertoa120kVgridfora30km,25kVfeeder.Initiallyinthismodelthewindspeedismaintainedconstantat15m/s.PIDControlleris introducedtoregulatespeedofrotorbyadjustingpitchwhichcontrolsspeedchanges.Resultshowsduetocontrollingofpitch angle output level is improved and good quality factor is achieved.We have applied fuzzy controller to establishemaximumpowerdeliverytothegridattrip.Thisdesignhavingfullcontrolontheelectricaltorque,speedandalsomakeupareactivepowercompensationandoperationundergriddisturbanceswhichimprovedesiredoutputlevels.
Keywords‐‐‐Modellingsimulation,DFIG,PIDController,Pitchangle,output,FuzzylogicControl
1. INTRODUCTION
Duetoheavyrequirementofelectricity,renewableenergyhas been widely developed. Wind power technology isone of themost popular renewable energy that is clean,easy maintenance, low cost and plentiful on the earth.Manwell and Rogers (2002), [1] , defines conversion ofkineticenergyfromthewindintobothmechanicalenergyandelectrical power. In the earlydays, large farmsusedwind power generated by windmills to do farm works.Recently, advanced technology enableswind turbines togenerated large electrical power to full fill the energydemand. Wind turbine technique has been greatlydevelopedinthepastfewdecades.
Doubly ‐ fed electric machines are basically electricmachinesthatarefedaccurrentsintoboththestatorandtherotorwindings.Mostlydoublyfedelectricmachinesinindustry are three phase wound ‐ rotor inductionmachine, and are one of the most common types ofgeneratorusedtoproduceelectricityinwindturbines.
The primary advantage of doubly ‐ fed inductiongeneratorswhenusedinwindturbinesisthattheyallowtheamplitudeandfrequencyoftheiroutputvoltagestobemaintainedata constantvalue,doesn’teffects thespeedof the wind blowing on the wind turbine rotor. By the,doublyfedinductiongeneratorscanbedirectlyconnected
to theacpowernetworkand remainsynchronizedatalltimeswiththeacpowernetworkandincludestheabilitytocontrolthepowerfactor.[2]
The problems encountered in the electrical networkcomprising wind energy systems are due to thecontinuous variations in the wind regime. Thesevariations may inflect undesirable fluctuation in thenetwork and thus has limited the capacity of the windenergysystemswhichcanbeintegratedwiththenetworkto amodest penetration factor. Various techniques havebeen proposed to cope with the variations in the windspeed toensurehighperformanceandsteadyoutput forthe wind energy systems and hence contribute to allowforhigherpenetrationfactor.
Theeffectofthevariationinthewindspeedmayresultin:
1‐Changeintheoutputvoltage
2‐Changeintheoutputfrequency
3‐Changeintheoutputpower
4‐Shiftintheoperatingpoint
Themaintainchangeintheoutputvoltageandfrequencyisisdiscussedinthispaperbyadoptingthesystemwhichemploys a doubly fed induction generator connected tothenetwork.Thevoltageandfrequencyaregovernbythemain network, the variation in the output power is
Volume 3 Issue 3: 2015 Volume 3 Issue 4: 2015
www.ijset.in ISSN (O): 2348-4098 ISSN (P): 2395-4752
International Journal of Science, Engineering and Technology Page 78

addressed in a companion paper by using a storagebatterytosmooththechangesintheoutputpower[3].
Initially for the improvement of power quality orreliability of the system FACTS devices like staticsynchronous compensator (STATCOM), staticsynchronous series compensator (SSSC), interline powerflow controller (IPFC) andunifiedpower flow controller(UPFC) etc. These FACTS devices are created for thetransmissionsystem.Butnowadaysmoreattentionisonthe distribution system for the improvement of powerquality. In these devices variations are introduced andknown as custom power devices. The custom powerdeviceswhichareused indistribution system forpowerquality improvement aredistribution static synchronouscompensator (DSTATCOM), dynamic voltage restorer(DVR),activefilter(AF),unifiedpowerqualityconditioner(UPQC)etc.
ForrenewablesourceofenergyWindenergyarefocused,and has become gradually more widespread. Windturbines use wind‐energy capturing systems. Pitchcontrol, which is normally required to attain a stableoutput power when the wind speed is abovethenevaluatedwindspeed, isaccomplishedbyregulatingthe pitch angle of the wind turbine blades to limit theoutput powerand protects wind turbine gearbox andgenerator.Thereforepitchcontroldesigned forvariable‐speedturbinesareincreasinglycriticalwhichismodifiedinthispaperbyfuzzylogiccontroller.
The proportional‐integral‐derivative (PID) controller isthe commonclosed‐loop control systemwhich improvesoverall response of system is using to design the pitchcontrolsystem.InadditiontotypicalPIDcontrolsystems,studies have suggesteddifferentmethods for controllingthe pitch angle. Modern studies have adopted todetermine the stability regionof PID control systems. Instable synthesis of a PI‐based pitch controller wassuggested. A graphical methodology was used to definethe stability region and set the parameters of thecontroller to achieve an arbitrary‐order time delaysystem. An alternate way to regulate the pitch angle inwind turbine generators is setting various operatingpointsforthecontrolsystem[4].
Fuzzy logicController isusedwith trip tooptimize itselfaccordingtoangleofwindflow.FuzzyLogiciscreatedbylogicalfunctions.TheconceptionofFuzzylogicisderivedfrom set theory. There are several controllers whichprovide effectual control for linear systems. In case ofnonlinear systems a Fuzzy Logic Controllers are used.Fuzzification, rule formation, and defuzzification are thestepspresentinfuzzylogicsystemtoperformoperation.The input to the fuzzy controller is in the form of realvariables. Intheprocessoffuzzificationtherealvariablesareconvertedintofuzzyvariableandeachfuzzyvariableare representedbymembership function. In secondstep
we form a fuzzy rules, fuzzy rules are based on definitedecision i.e., inthe formofIF‐THEN.Finallywhenall theoperations of control is completed at the last stage thefuzzy variables are again converted into real variableswhichisasknowndefuzzification.[5]
Inorder toextractmaximumpower fromavailablewindhave to take fuzzy logic control of generator sideconverterand thuscontrolofgeneratorspeedwasused.Theadvantages inusing fuzzy logic controller ispointedout in better response to frequently changes in windspeed[6].
2. PREVIOUSWORK
Several techniques have been used in the past years onmodel of wind systems for power generation.Mostlyexisting models are analytical while others arecomputer based. Hansen & al. [7], provided acomprehensivereportonthemodellingofwindturbineatboth system and component level using the DIgSILENTsoftware. Their work dealt with the description ofDIgSILENTbuilt‐inmodelsofelectricalcomponentsusedfor wind turbine system comprising: an inductiongenerator,apowerconverterandothermodelsdevelopedby user in the dynamic simulation language (DSL) ofDIgSILENT.Also,modelsofnon‐electrical componentsofwind turbine system such as wind speed model,aerodynamic model and others, were equally madeavailable.
The three phase injected current into the grid fromSTATCOM will cancel out the distortion caused by thenonlinearloadandwindgenerator.TheIGBTbasedthree‐phase inverter is connected to grid through thetransformer. The generation of switching signals fromreference current is simulatedwithin hysteresis band of0.08. The choice of narrow hysteresis band switching insystemimprovesthecurrentqualityandcontrolsignalofswitchingfrequencywithinitsoperatingband.[8]
Inaddition,Bolik(2004),developedacomputermodelofwindturbinethathasbeenwidelyusedbypower‐systemoperators to study load flow, steady state, voltagestability, dynamic and transient behaviour of powersystem.ThissystemwasalsosimulatedwithDigSILENT.DigSILENThas the capability to simulate load flow,RMSfluctuations and transient events. It providesmodels ondifferentlevelsandcanalsobeusedtosimulateloadflow,RMS fluctuation and transient events in the sameenvironment.
Besides and Fingersh& al. (2006), [9] developed underThe National Renewable Energy Laboratory (NREL), anagencyofUS, awind turbinemodel intended toprovidereliable cost projections for wind‐generated electricitybased on different scales (sizes) of turbines. The modelwasmainlyanalytical.Petru(2001),hasalsodevelopeda
Volume 3 Issue 3: 2015 Volume 3 Issue 4: 2015
www.ijset.in ISSN (O): 2348-4098 ISSN (P): 2395-4752
International Journal of Science, Engineering and Technology Page 79

similaranalyticalmodelofwindturbineasaprojectworkand this was well elaborated on other aspects of windsystemsuchastheaerodynamicmodeling,thewinddatamodeling,themechanicalaspect
Moreover, Sulla (2009), [10] modeled and simulated adoubly fed Induction Generator and the fixe speedInduction generator with MATLAB Sim power systemtoolbox.Thesystemwasmadeofagraphicalmodelbuiltunder Simulink with already existing models fortransmissionline,loads,windturbineandothers.Severalcasesof faultshavebeentestedandanalysedinordertoshowtherobustnessofthesystem.
Bharanikumar(2010),presentsamaximumpowerpointcontrol for variable speed turbine driven permanentmagnet generator [11]. In summary, his paper discussesthevariable‐speedwindenergyconversionsystemusingapermanentmagnetgeneratorandproposestheoptimalcontrol strategy of permanent magnet generator thathelpstomaximizethepowergenerated.
FurthermoreR.Melicio(2009),[12],developedamodelofWTGSusingapermanentmagnetsynchronousgenerator.Theworkaimedatimprovingthetransientstabilityofthesystem by acting on the pitch angle. A new controlstrategywasproposedand simulated; simulation resultsshow an improvement of system performances androbustness.InadditionananalysiswascarriedoutontheTotalHarmonicDistortion (THD),which is ameasure ofsystemquality.ResultsshowthatthetotalTHDwasmuchlower than 5%which is the limit imposed by IEEE‐519standard. In summary, the above review of literaturedemonstratethatwindturbinemodelingmostlygoeswiththeuseofdoublyfedorsquirrelcageinductiongeneratorand can be modeled and simulated under variousconditions by two reputed software namely, DigSILENTand MATLAB. It was also found that, models ofcomputation and validation of wind data, includingStochastic,Deterministic,WeibullandExponentialmodelsweremadeavailableunderMATLABsoftware.
3. METHODOLOGY
Simulation Methods of the Designed and Implementedmodel. On the basis of the frequency range to berepresents, three simulation methods are presentlyavailable in Sim Power Systems to model VSC basedenergy conversion systems connected on power grids.The phasor model (continuous): This model is betteradaptedtosimulatethelowfrequencyelectromechanicaloscillationsover longperiodsof time(tensofsecondstominutes).Inthephasorsimulationmethod,thesinusoidalvoltagesandcurrentsaresubstitutedbyphasorquantities(complexnumbers)atthesystemminimalfrequency(50Hzor 60Hz).This is the techniquewhich is alsoused intransient stability softwares. A 9 MW wind farm
comprisingofsix1.5MWwindturbineslinkedtoa25kVdistribution system transfers power to a 120 kV gridthrough a 30 km, 25 kV feeder. However to enhance itspowergenerationandqualityofthegeneratedpowerPIDcontroller has been implemented over the wind speedblock so as to control and regulate the wind speedaccordingtothedesiredoutputpower,alsoPIDcontrollerworksonlyontheproportionalconstantandtheintegralvalue to attain the maximum output from the wind.Proportional constant can be further termed as the gainconstant of the PID Controller. Wind Turbines do notoperateatthespeedabove55milesperhour;thiscanbeovercome by the use of PID Controller. As the PIDControllercontrolsthewindspeedforthedesignedmodelit becomes equally important to regulate the trip of thewind turbine as the amplified wind speed output maydamageorblockthewindturbine.Tocontrol the triporthe blade direction of the wind turbines Fuzzy Logic orVectorcontrolmethodcanbeused,howeverinthismodelFuzzyLogicisusedasitismoreresponsiveaccurateandless complex than the vector control box. To control thepitch of the blades fuzzy logic generate a pulse tomaneuver the blade direction or its pitch, so that theblades always remain in parallel to the wind and keeprotatingtogeneratethemaximumoutput.Windturbinesviaadoubly‐fedinductiongenerator(DFIG)compriseofawoundrotorinductiongeneratorandanAC/DC/ACIGBT‐based PWM converter. The stator winding is connectedstraight to the 60 Hz grid whereas the rotor is fed atvariablefrequencythroughtheAC/DC/ACconverter.120KVgeneratorisrequiredtosynchronizetheoutputpowergenerated by the wind turbine. The DFIG technologypermitsextractingmaximumenergy fromthewind formlowwind speeds by optimizing the turbine speed,whiledecreasing mechanical stresses on the turbine duringgustsofwind.Initiallyinproposedmodelthewindspeedismaintainedconstantat15m/s.Thecontrolsystemusesa torque controller in order to maintain the speed at1.2pu.Thereactivepowergeneratedbythewindturbineis regulated at 0 Mvar at a wind speed of 15 m/s, theturbineoutputpoweris1puofitsratedpower,thepitchangle is 8.7 degree and the generator speed is 1.2 pu. Aproportional‐integral‐derivative controller (PIDcontroller) is a control loop feedback mechanism(controller)widelyusedinindustrialcontrolsystems.ThePIDcontroller computesanerrorvalueas thedifferencebetween a measured process variable and a desired setpoint.
Fuzzy Logic A fuzzy control system is a control systembased on fuzzy logic—a mathematical system thatanalysesanalog input values in termsof logical variablesthat take on continuous values between 0 and 1, incontrast to classical or digital logic, which operates ondiscrete values of either 1 or 0 (true or false,respectively).
Volume 3 Issue 3: 2015 Volume 3 Issue 4: 2015
www.ijset.in ISSN (O): 2348-4098 ISSN (P): 2395-4752
International Journal of Science, Engineering and Technology Page 80
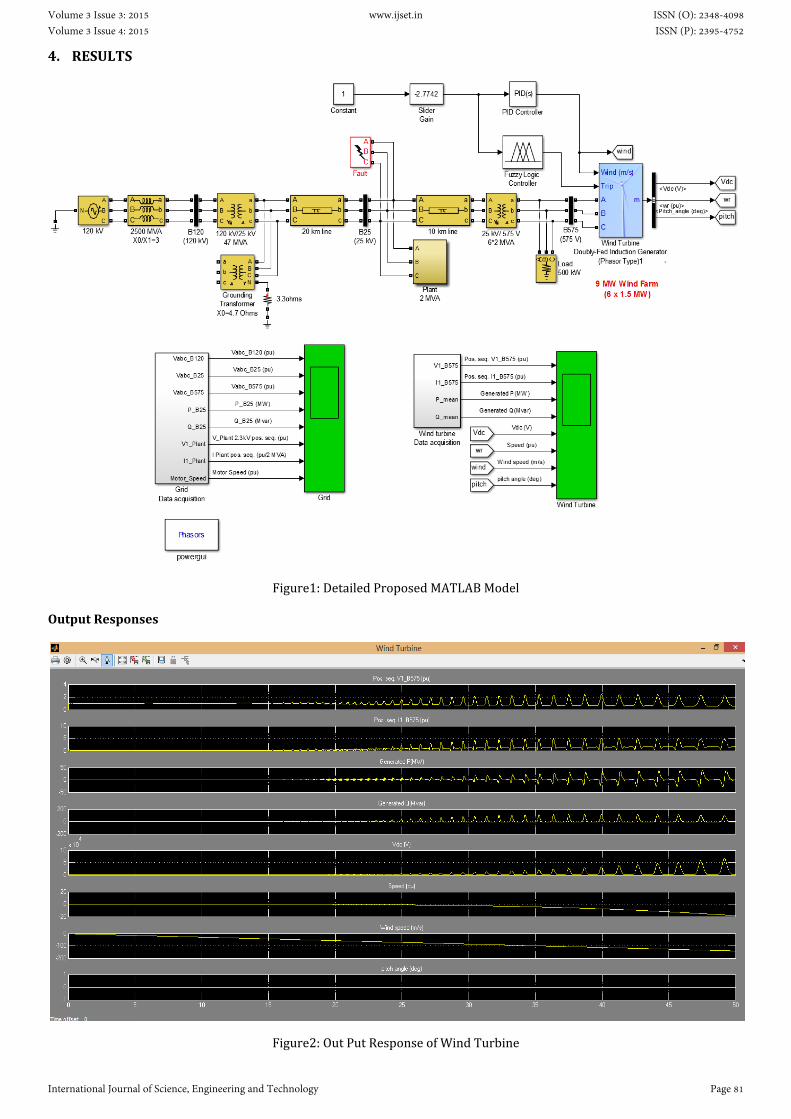
4. RESULTS
Figure1:DetailedProposedMATLABModel
OutputResponses
Figure2:OutPutResponseofWindTurbine
Volume 3 Issue 3: 2015 Volume 3 Issue 4: 2015
www.ijset.in ISSN (O): 2348-4098 ISSN (P): 2395-4752
International Journal of Science, Engineering and Technology Page 81

Figure3:OutPutResponseofGrid
5. CONCLUSIONS
On implementingPID controllerwithwind turbinehavecontrolledthedesiredoutputlevelandpowerqualityalsoimproved. This system is previously proposed forcapacityof9MWbutafterintroducingPIDcontroller,itstransient and steady state response is improved so itsoutputpowerreachedupto30MW.
In this paper, I also controlled the pitch angle of windturbineby introducingfuzzy logiccontrollerwith trip tocontrolitsangleofbladesaccordingtowindflow.
REFERENCE
[1] WIND ENERGY EXPLAINED THEORY, DESIGN ANDAPPLICATION; SECOND EDITION ‐ J.F. MANWELL | J.G.MCGOWAN University of Massachusetts, USA| A.L.ROGERSDNV–GlobalEnergyConcepts,Washington,USA
[2]PrinciplesofDoubly‐FedInductionGenerators(DFIG);CoursewareSample86376‐F0‐01/2015
[3] M. Azouz, A. Shaltout and M. A. L. Elshafei,CairoUniversityFuzzyLogicControlofWindEnergySystems,14th International Middle East Power SystemsConference, Cairo University, Egypt, December 19‐21,2010
[4] C.EbbieSelvaKumar, V.Jegathesan, R.EvelinePregitha,ModelingandControlofPowerConverterforDoublyFedInductionGeneratorWindTurbinesusingSoftComputingTechniques Journal of Energy Technologies and PolicyISSN2224‐3232(Paper)Vol.2,No.3,2012
[5] Jau‐WoeiPerng *, Guan‐Yan Chen and Shan‐ChangHsieh ; Optimal PID Controller Design Based on PSO‐
RBFNN for Wind Turbine Systems ISSN 1996‐1073 ;07/2014
[6] EvgenijeAdzic*, ZoranIvanovic*, Milan Adzic**,Vladimir Katic* ; Maximum Power Search in WindTurbineBasedonFuzzyLogicControl,Vol.6,No.1,2009
[7]AncaD.Hansen,Clemens Jauch,PoulSørensen,FlorinIov, FredeBlaabjerg ; Dynamic wind turbine models inpower system simulation tool DIgSILENT, ISBN 87‐550‐3198‐6‐2004
[8]D. Srinivas ,M. Rama Sekhara Reddy, PowerQualityImprovement in Grid Connected Wind Energy SystemUsing Facts Device and PID Controller , IOSR Journal ofEngineering(IOSRJEN)e‐ISSN:2250‐3021,p‐ISSN:2278‐8719,Volume2,Issue11(November2012),PP19‐26
[9] L. Fingersh, M. Hand, and A. Laxson, Wind TurbineDesign Cost and Scaling Model, Technical ReportNREL/TP‐500‐40566December2006
[10] Francesco Sulla, Simulation of DFIG and FSIGwindfarms in M ATLAB SimPowerSystems , Division ofIndustrial Electrical Engineering and Automation LundUniversity,CODEN:LUTEDX/(TEIE‐7235)/1‐007/(2009)
[11] R. Bharanikumar, A.C. Yazhini, A. Nirmal Kumar;Modeling and Simulation of Wind Turbine DrivenPermanentMagnetGeneratorwithNewMPPTAlgorithm,AsianPowerElectronicsJournal,Vol.4No.2August2010
[12]R.Melício,V.M.F.Mendes,J.P.S.Catalão;ComputerSimulation of Wind Power Systems: Power Electronicsand Transient Stability Analysis , International
Volume 3 Issue 3: 2015 Volume 3 Issue 4: 2015
www.ijset.in ISSN (O): 2348-4098 ISSN (P): 2395-4752
International Journal of Science, Engineering and Technology Page 82

Conference onPower SystemsTransients (IPST2009) inKyoto,JapanJune3‐6,2009
Volume 3 Issue 3: 2015 Volume 3 Issue 4: 2015
www.ijset.in ISSN (O): 2348-4098 ISSN (P): 2395-4752
International Journal of Science, Engineering and Technology Page 83

DIVERSITY,PREVALENCEANDROLEOFSUPEROXIDEDISMUTASEINCYANOBACTERIA
KANUPRIYA1,NAMITASINGH*2,INDERJEETSINGH3
1ResearchScholar,MicrobialBiotechnologyLaboratory,DepartmentofBio&NanoTechnology,GuruJambheshwarUniversityofScience&Technology,Hisar,Haryana‐125001,India.Email:[email protected]
2AssociateProfessor,MicrobialBiotechnologyLaboratory,DepartmentofBio&NanoTechnology,GuruJambheshwarUniversityofScience&Technology,Hisar,Haryana‐125001,India.Email:[email protected]
3Director,SafeAgroProducerCompanyLtd.,Hisar,Haryana‐125001,India.Email:[email protected]
*CorrespondingAuthor‐E‐mail:[email protected]
ABSTRACT
Superoxide dismutase (SOD), the antioxidant enzyme exists in four diverse forms in cyanobacteria i.e. FeSOD, MnSOD,Cu/ZnSODandNiSOD.FeSODhasanancestraloriginfromtheGSBancestorofPSIwhileMnSODhasprotobacterialancestortoPSII&mitochondria.Cu/ZnSODshows lateralgenetransferwhileNiSOD israrely found.Fe&Mn formssharesimilaritywhileCu/Znformdoesnot.SODisprevalentinallsubcellularlocationswhereO2‐(superoxide)radicalsareformed.SODplaysadefensiveroleatthetimeofenvironmentalstress likechilling,dessication, lightstress,metatoxicityetcand itsactivity isusuallyseenhigheratthetimeofstress.InactivationofSODgeneresultsinoxidativedamagetothecell.
Keywords:SOD,Antioxidant,Isoforms,Localization,Environmentalstress.
1. INTRODUCTION
Superoxide dismutases (SOD, E.C. 1.15.1.1) areubiquitousmetalloenzymeswithmolecularweight17to85 kDa that catalyze thedisproportionation reactionofconversion of superoxide radicals to peroxide andmolecularoxygenasshownin fig.1.Themetal ionsarealternatively oxidized and reduced. There are fourdifferent metalloforms of SOD found in cyanobacteriabut these are not equally distributed. The forms areFeSOD,MnSOD,CuZnSODandNiSOD.AcambialisticformthatusesFe/Mninitsactivesitealsoexists.
Though oxygenic Photosynthetic Electron Transport(PET) and aerobic respiration have improved theefficiency of Carbon metabolism but the benefits arepartiallyoffsetbytheirtendencytoformreactiveoxygenspecies (ROS). ROS can react with lipids, proteins,nucleic acids etc to cause irreversible damage to a cell.This necessitated the co‐evolution of antioxidantsystemswithPETandaerobicrespiration.
Cyanobacteria are the oldest oxygen evolvingphotosynthetic prokaryotes and possess plethora ofbioactive compounds (Sudha et al, 2011). The name"cyanobacteria" comes from the Greek word kyanos,which means blue‐ green. These occupy a crucialpositionbetweenprokaryotesandeukaryotes.Theyareconsideredasresponsiblefortheconversionofprimitiveanaerobic reducing environment into the modernoxidizingone(Lukowetal.,2000).Theyhaveadaptedtosurvive in almost every ecological niche including theextreme ones (Schopf, 2000). The protective role ofcyanobacterial SOD was first studied in Anacystisnidulans (Herbert et al., 1992). Though thephotosynthetic apparatus of cyanobacteria is similar tothat of algae and plants but the antioxidant system issimpler as compared to plants. Also, it is easier to
geneticallymanipulate it inrespect toplants, likegenesfor antioxidant enzymes can be easily inactivated byinsertional mutagenesis (Weixing et al., 2007). SODpossesses high therapeutic value and it was firstcommissioned in 1985 as a drug in USA for defence ofdonororgans against oxidative stressduringperiodsofischemiaandreperfusion(Vellard,2003).
2. THEDIVERSEFORMSOFSOD
FourdifferentisoformsofSODarefoundtobeknowntilldateincyanobacteria.AmongtheseFeandMnformsarethemostprevalent.
Iron and Manganese SODs: According to Fink andScandalios(2002),FeandMnSODsshare50%similaritybased on amino acid alignments and suggest that theymight have evolved from gene duplication from acommon ancestor. The similarity in structure betweenthetwoformsisduetosimilarelectricalpropertiesofFe&Mn.Botharehomodimersortetramerscontainingonemetal atomper 200 to 220 amino acid residue subunitwithmolecularweightrangingfrom14to30kDa.SomeArcheaalsopossesscambialistic formofSOD. Inspiteofhighdegreeof similaritybetween these two forms, twospecificaminoacidresiduesi.e.77(glutamineinFeSODand glycine in MnSOD) & 146 (alanine in FeSOD andglutamine or histidine in MnSOD) differentiate them(Weatherburn, 2001). However, it is possible tosubstituteFeforMnintheactivesiteofMnSODorviceversa but little or no catalytic activity is retained. Animportant difference between these two forms is theirintracellular location. The FeSOD is found in thechloroplastsandcytoplasm(FinkandScandalios,2002)while MnSOD is mostly localized in mitochondria(Okamoto et al., 2001). An N terminal, hydrophobic,transmembrane helix tail on theMnSODdetermines its
Volume 3 Issue 3: 2015 Volume 3 Issue 4: 2015
www.ijset.in ISSN (O): 2348-4098 ISSN (P): 2395-4752
International Journal of Science, Engineering and Technology Page 84

localization in cyanobacteria (Atzenhofer et al., 2002;Regelsbergeretal.,2002).
Copper‐zincSODs:CuZnSODexhibitstructuralaswellasevolutionary dissimilarity from Fe andMnSOD becauseofdifferentelectricalpropertiesofCu/ZnfromFe&Mn.It isahomodimerwithmolecularweightbetween31to33 kDa for each subunit and amino acid residues oflength 150 to 160 per subunit (Fridovich, 1998). TheenzymeishavingtwoactivesitesonecontainingCuandanother Zn for each subunit. It is very stable as it canwithstand multiple freeze‐thaw cycles and prolongedrefrigeratinoncepurified.Thismaybeattributedtohighglycinecontent(13to17%)contributingtoextensiveβ‐pleatedsheetconformation(Chenetal.,2001).
Nickel SODs: it is completely different from the otherthree forms of SOD. Itwas first discovered, cloned andcharacterized in the bacterial genus, Streptomyces(Wuerges etal., 2004). A survey of available genomessuggeststhatthisformisalsoavailableincyanobacteriaaswell(Paleniketal.,2003).
The reason behind the metal substitution during itsevolutionaryhistorymayberelatedtotheavailabilityofsoluble transition metal compounds in the biospherewithrespecttotheoxygencontentoftheatmosphereindifferentgeographicaleras(Bannister,1991).
2.1EVOLUTIONARYASPECTANDLOCALIZATIONOFSOD
The tree of life shows distribution of SOD inarchaebacteria,bacteriaandeukaryoteasshowninfig.2.The ancestral history reflects origin of FeSOD from theGSB ancestor of PSI while MnSOD from protobacterialancestor to PSII and mitochondria. The Cu/ZnSOD isbelieved tobeoriginatedby lateralgene transfers.SODenzymes are compartmentalized in a cell. This may bedue to the reason that O2‐ radicals cannot cross thecytoplasmic membranes and are imperative to beremoved (Takahashi and Asada, 1988). All SODs areencodedby thenucleus and appear to have evolvedbylateral gene transfer of three distinct genes to thenucleus after the endosymbiotic acquisition ofmitochondria and plastids. FeSOD is localized in thechloroplastsandcytoplasmwhileMnSODisfoundinthemitochondria. NiSOD is found to be associated withplastids.Cu‐ZnSOD is found inchloroplast, cytoplasm&periplasmasshowninfig.3.
2.2 PREVALENCE OF SOD FORMS IN DIFFERENTORDERSOFCYANOBACTERIA
Belowgiven is theprevalenceofdifferent formsofSODindifferentordersofcyanobacteriabasedonanalysisofPriyaetal, (2007). It is cleared that themostprevalentformsareFeandMn.
Fe‐SOD‐Anabaenavariabilis,Cyanothecesp.,Gloeobacterviolaceus,Lyngbyasp.,Nostocsp.,Plectonemaboryanum,Spirulina platensis, Synechococcus sp., Synechocystis sp.,Thermosynechococcuselongatus
Mn‐SOD‐ Anabaena variabilis, Crocosphaera watsonii,Gloeobacter violaceus, Leptolyngbya valderiana, Nostoc
sp., Plectonema boryanum, Synechococcus sp.,Thermosynechococcus elongatus, Trichodesmiumerythraeum
Cu/Zn‐SOD‐Lyngbyasp.,Synechococcussp.
Ni‐SOD‐Crocosphaerawatsonii,Prochlorococcusmarinus,Synechococcussp.,Trichodesmiumerythraeum
2.3PROTECTIVEROLEOFSODINCYANOBACTERIA
Researchers have demonstrated that SOD plays aprotective role against oxidative damage incyanobacteria during different types of environmentalstress.O2‐radicalsareproducedinevitablyinrespiratoryelectrontransport(Yankovskayaetal.,2003)andalsointhechloroplastsbythereductionofoxygenatthesiteofPSI (Asada, 1999). SOD is found to protect the protondonating system in nitrogen fixation against ROS inheterocysts forming cyanobacterium Anabaenacylindrical(Henryetal.,1978).SeveralstudieshavebeendoneusingmutantstrainsofcyanobacteriawithalteredlevelsofSODactivity.Aphotooxidationresistantmutantstrain ofPlectonemaboryanum with increased levels ofMnSOD activity was isolated by Steinitz etal., (1979).The protective role of SOD during differentenvironmentaltressconditionsisdescribedbelow.
Chillingstress:Chillingstressispropoundedtodecreasemembranefluiditywhichisaprimarysymptom(NishidaandMurata,1996).Chillinginpresenceoflightincreasesproduction of ROS by creating reducing atmospherewhich is further worsen by production of H2O2 and O2which inhibits enzymes of Calvin cycle (Kaiser, 1979).TheactivityoftheCalvinCycleandsolubleenzymeshasbeen found to decrease with low temperature withoutcausing any significant decrease in lightharvesting andelectron transfer system. Recent studies offer thatchilling suppress nitrate uptake in Synechococcus sp.PCC7002(SakamotoandBryant,1999)whichresultedinchlorosis.RoleofSODsinsafeguardingchillingravageincyanobacterium Synechococcus sp. PCC79421was doneby David et al, 1999. Kwang et al, (2005) reporteddifferentialexpressionofMnSODinnearisogeniclinesofwheat during cold acclimation. Punia and co‐workers(2011) reported the role of SOD in combating chillingstress inArthrospira isolates. SOD activitywas 5 timeshigherintolerantstrainand2.5timeshigherinsensitivestrain at the time of chilling stress as compared tooptimumtemperatureonnativegel.
Desiccation: The role of SOD has been well studied inNostoccommuneaftermanyyearsofdesiccation to findout its function in detoxifying ROS and reducing stress(Shirkeyetal.,2000).ThestudyunveiledthatFeSODwasthe third most abundant soluble protein in Nostoccommuneevenafterstorage indesiccatedstate for longperiod. The FeSOD purified fromNostoccommune waspurposedtobea21kDapolypeptide.N‐terminusofsodFwassequencedwhichwasencodedby200codons.Uponrehydration, FeSODwas released in the cells and extracellular fluid and suggested that this process helps inreducing oxidative stress offered by multiple cycles ofdesiccation. The retainedactivityof SodF after yearsofdessication in Nostoc commune suggested that theenzymemighthavestructuralfeatureswhichallowitto
Volume 3 Issue 3: 2015 Volume 3 Issue 4: 2015
www.ijset.in ISSN (O): 2348-4098 ISSN (P): 2395-4752
International Journal of Science, Engineering and Technology Page 85

remain in the native state despite of the removal ofwater from the cells or it might be sequestered in cellmicroenvironment (Shirkey et al., 2000). Similarly,considerableactivityofSODfoundincellfreeextractsofdessication tolerant cyanobacteria Lyngbya arboricola(Tripathi&Srivastava,2001).Marked toleranceagainsthigh solar radiation along with dessication stress isreported in the cyanobacterium, Tolypothrix byssoidea,occurring on the exposed rock surfaces of temples andmonuments in various regionsof India (Adhikaryetal.,2000). The FeSOD gene was amplified and sequencedwhichwasa292bppolypeptideencodingfor96aminoacids.Theresultinggenefoundtobe49.2%similarwithFeSOD of Anabaena sp. PCC7120. Another sequence of358 bp was also sequenced and was supposed to besimilar to sodF encoding for soluble FeSOD proteinfoundinNostoccommune.Effortsfortransferringgeneofdesiccation tolerance in cyanobacteriumChroococcidiopsishave been made Daniela etal., 2001.Chroococcidiopsis is dominating community found indeserts. Plasmids from Nostoc sp. PCC7524 weretransferred to various isolates of Chroococcidiopsis viaconjugationandelectroporationmethodsandofferedasasuitableexperimentalstrainforgeneticstudies.
Visible light stress: Light plays an important limitingfactor for growth of photosynthetic organisms. Quail(1994) propounded that signal transduction andexpressionofproteiniscontrolledbylight.Theimpactofhigh irradiance on algae is drawing special attention(CullenandLewis,1995).ROSareproduced inaheavyamount by photochemical processes involved inphotosynthesis. High light intensity reduces the rate ofphotosynthesis by harming photosynthetic apparatus(Critchley, 1994). Studies of photosystem expose thatFeSOD is relatedwith theprotectionofPSI (Thomas etal., 1998). SOD found to be selectively protective toheterocystswhich can fix nitrogen and posses only PSI(Caninietal.,1998).OxygenisreducedusinglightbyPSIincyanobacteria(Slain,1991).SODsplaycrucialrole indefending against ROS and its detoxification (Touati,1997) and provide best tolerance to oxidative stress(Bhattacharyaetal., 2004).MnSODwhich ismembraneassociatedincyanobacteriaarefoundtobeprotectivetothephotosynthetic apparatus inAnabaena sp. PCC7120when exposed to high light intensity (Weixieng et al.,2007).Thestudyconferedthatlipidperoxidationoccurdat a highr rate in absence of MnSOD under high lightintensity.MnSODwas found tobe critical inpreservingboth PSI and PSII in test sample. Earlier researchespurposed that superoxide ions are produced by PSIIwhenlightintensityishigh(Navari‐Izzoetal.,1999).Soit was hypothesized that the major role of SOD is inshielding of PSII against photoinhibition. An intensestudyonSynechocystis sp.PCC6803 tounderstand lightdependentexpressionofSODwasdonebyJaeandKyong(2005).ResultsrevealedthatFeSODwasmoreactiveincultures maintained in continuous light. Respiratoryreaction largely contributes in activation of FeSOD aselectrontransfersystemisamajorsiteofO2generation(Imlay and Fridovich, 1991). Microcystis aeruginosawhichisabloomproducingcyanobacteriawhenexposedto heavy irradiation for longer time, accounted fordecreaseinrateofphotosynthesis(AbeliovichandShilo,1972). FeSOD is inactivated ifMicrocystisaeruginosa is
exposed to light stress for longer duration due to theproductionofexcessofH2O2.Therearerecordsofabouteightfold increase in amount of FeSODwhenNodulariacollected at the depth of 10 m from Baltic sea wasexposedtohighirradiation(Caninietal.,1998).
Ultraviolet radiation stress: Ultraviolet radiation cancauseoxidativedamagedependinguponitswavelength.UV‐B (280‐320 nm) can cause photosynthetic damage(Sinha and Hader, 2002). Another study stated thatinactivationofcyanobacterialnitrogenaseafterexposuretoUV‐B(Kumaretal.,2003).UV‐Aalsoexhibitsravagingeffect on the cell. UV‐A stimulates genes in bold innegative phototactic responses in cyanobacteria whenexposed for long time and high intensity. Photosensorssuch as cryptochrome Cry‐DASH are involved in UV‐Adependent signaling at low fluence rate. UirS‐UirR andPCDaretheimportantsignallingcomponentwhichhaveimportant role under oxidative stress condition incyanobacteria.StudyofSODsconfirmsitscrucialroleinmaintaining UV‐B level in algae (Rijstenbil, 2002) butthere is no significant increase in SODs level whenexposed to UV‐A. Various nonenzymatic systems andSODsaresuggestedtohavedifferenttargetsitesforUV‐AandUV‐Bsabotage(Rijstenbil,2003).
Nutrientstress:Therateofmetabolismstartsdecliningunder nutrient stress condition which is a result ofimpairmentcausedtothecellularscaffolding.Duetolackofnutrients,catabolismofcellularproteinstartsinorderto maintain photo synthetic activities (Falkowski andRaven, 1997). These conditions of respiratorydegradation leads to the production of ROS. Punia andco‐workers(2011)reporteddecreasedactivityofSODinPistarvedstrainsofArthrospira.StudiesonroleofSODsunder nutrient limitation in cyanobacteria are gettingmore attention which will hopefully open up newperspectivesinfuture.
Metaltoxicity: Presence of excess metal ions inducesFenton reactions. Cyanobacteria has been studiedintensively and found to produce metal chelators andantioxidantbuffers inorder toabsorb tracemetals anddifferentmetalsarefoundtobeimportantforregulationof various metabolic processes (Mc Kay et al., 2001).Micronutrients settle the output ofmetabolic processesbased on macronutrients uptake (Sunda 2000) andprevent Fenton reaction by acting as an antioxidantbuffer (Martinez et al., 2000). Synechocystis aquatilismanifest decline of growth rate when concentration ofcopperisincreased(Shavyrinaetal.,2001).Asparagopsisarmataalsosufferedreductioningrowthinpresenceofmetal (Segot etal., 1983). Copper is found to producehydroxylradicalwhereaszincandleaddisturbmetabolicmachineryviafreezingantioxidantpoolwhichresultstoincrease loadofROS(Briat,2002).Cu ismostlystudiedfor understanding various SODs responses underpresenceofexcessmetal(Okamotoetal.,2001).AstudyoneffectofheavymetalinAnabaenavariabiliswasdoneby Padmapriya and Anand (2010) to determine theireffectonSODs.CopperwasfoundtoinhibitgrowthofA.variabilis to maximum amount. Production of peroxidewas found to be less in Fe and Mn varied cultureswhereas highest in Cu and Zn amended cultures.Increase in SOD activity was observed whenamendments in micronutrients were done. Increase in
Volume 3 Issue 3: 2015 Volume 3 Issue 4: 2015
www.ijset.in ISSN (O): 2348-4098 ISSN (P): 2395-4752
International Journal of Science, Engineering and Technology Page 86

copperconcentrationinA.doliolumleadto63%increasein SOD activity which also resulted in increase in lipidperooxidation(MallickandRai,1999).AmutantstrainofSynechococcussp.PCC7942hasbeenconstructedlackingdetectableFeSODactivityanditsphotosyntheticelectrontransportwasfoundtobemoresensitiveinthepresenceof methyl viologen and elevated O2 concentrations(Herbert et al., 1992; Thomas et al., 1998) but is notsensitive to oxidative stress induced with Norflurazon(David et al., 1999). The sodB‐ strain had increasedMnSOD activity as demonstrated by Herbert et al.,(1992). Itmight be possible that the increasedMnSODactivity was to compensate for the FeSOD and thusresists the effects ofNF. SOD plays a significant role incombating heavy metal stress in the cyanobacteriumSpirulinaplatensis‐S5(Meenakshietal.,2006).
Otherstress:Some filamentous cyanobacteria possesesspecialized cells known as heterocysts which arespecialized chambers with thick lining involved inprotection of nitrogenase enzyme from the poisonouseffect of oxygen and hyterocysts are formed undernitrogen deprived conditions (Zhang etal., 2006). SODfrom heterocysts of A.Cylindricahave been isolated sofarwhichgivesastrongevidencethatSOD isnecessaryforscavengingROSinN2fixingcells(Henryetal.,1978).Anabaena sp. PCC7120 heterocysts posses two SODgenesencodingforFeSOD(Liuetal.,2000;Kanekoetal.,2001) and MnSOD (Regelsberger etal., 2002; Li etal.,2002;Kanekoetal. 2001)whereFeSOD level increaseswhen cell from nitrogen abundant conditions aretransferred tonitrogendeprivedconditionsbutMnSODdoesn’t show any up regulation. Nitrate uptake at lowtemperatureslowdownsbecauseat lowtemperatureallthree enzymes involved in nitrate assimilation areprotected by membrane lipid unstauration whichreducesrateofnutrientuptake.Hencelowtemperatureandnutrientstressbothareinvolvedinconditioncallednitrogenstarvation.
3. CONCLUSION
SOD has gone under different metallic substitutionsduring its evolutionary history. This was due to theavailabilityofdifferentmetalsincontexttooxygeninthebiosphere in different geographical eras. Four differentmetalloformsexistincyanobacteriawithFe&Mnasthemost prevalent.Owing to its presence in all subcellularlocations where superoxide radicals are produced itoffers an effective defense system to the cell. Its geneinactivation results in oxidative damage to the cell.Cyanobacteria photosystem resembles to that of plantsand thus can be extensively studied for stressmechanisms.Mass cultivation of cyanobacteria for SODextraction canbepromoted foruse in therapeutics andclinicalresearch.
ACKNOWLEDGEMENT
The authors acknowledge DBT(Department ofBiotechnology) sponsored HRD & BIF(Bioinformatics)Program and UGC‐SAP (University Grants Commission‐Special Assistance Programme), New Delhi, India forprovidingfinancialandinfrastructuresupport.
REFERENCES
1. Abeliovich, A. and Shilo, M. 1972 “Photooxidativedeath in blue‐green algae”. JournalofBacteriology,111:682‐689.
2. Adhikary,S.P.2000“ChlorophyllstabilityofepilithiccyanobacteriafromtemplesofIndia.”ArchHydrobiolSuppl,98:119‐131.
3. Asada,K.1999“Thewater‐watercycleasalternativephoton and electron sinks”. Philos. Trans. R. Soc.Lond.BBiol.Sci.,355:1419–31.
4. Atzenhofer,W., Regelsberger, G., Jacob, U., Peschek,G.,Furtmuller,P.,Huber,R.&Obinger,C.2002“The2.0A°resolutionstructureofthecatalyticportionofa cyanobacterial membrane‐bound manganesesuperoxidedismutase”.J.Mol.Biol.,321:479–89.
5. Priya, B., Premanandh, J., Dhanalakshmi, R.T.,Seethalakshmi, T., Uma1, L., Prabaharan, D andSubramanian, G. 2007 ‘’Comparative analysis ofcyanobacterial superoxide dismutases todiscriminatecanonicalforms’’.BMCGenomics,8:435.
6. Baldauf, S. L., Bhattacharya, D., Cockrill, P.,Hugenholtz, P., Pawlowski, J. & Simpson, A. G. B.2004 ‘’The origin and radiation of life on earth. InCracraft, J.&Donoghue,M. J. [Eds.] Assembling theTreeofLife’’.OxfordUniversityPress,NewYork.
7. Bannister,W.H.,Bannister,J.V.,Barra,D.,Bond,J.andBossa, F. 1991 ‘’Evolutionary aspects of superoxidedismutase; the copper/zinc enzyme’’. Free RadicalResearchCommunications,12‐13,349‐361.
8. Bhattacharya,J.,Ghosh,D.K.,Chatterjee,A.,Majee,M.and Majumder, A.L. 2004 “Synechocystis Fesuperoxidedismutase gene confers oxidative stresstolerance to Escherichia coli”. BiochemBiophysResCommun,316:540–544.
9. Shirkey, B., Kovarcik,D.P.,Wright, D.J.,Wilmoth, G.,Prickett,T.F.,Helm,R., Eugene,F.,Gregory,M.andPotts, M. 2000 “Years of Desiccation Nostoccommune(Cyanobacteria) after Dismutase andAbundant sodF mRNA in Active Fe‐ContainingSuperoxide”J.Bacteriol.,182(1):189.
10. Briat,J.F.2002.“Metalionactivatedoxidativestressand its control. In: Inze, D., Montagu, M.V. (Eds.),Oxidative Stress inPlants”.TaylorandFrancis,NewYork,pp.171–189.
11. Canini, A., Leonardi, D. and Caiola, M.G. 2012‘’Superoxide dismutase activity in theCyanobacterium Microcystis aeruginosa aftersurfacebloomformation’’.NewPhytologist,152:107‐116.
12. Canini, A., Albertano, P. & Caiola, M. G. 1998“LocalizationofFecontainingsuperoxidedismutaseincyanobacteriafromtheBalticSea:depthandlightdependency”.NewPhytol.139:247–54.
13. Chen,J.,Liao,C.,Mao,S.J.,Chen,T.&Weng,C.2001“A simple technique for the simultaneousdetermination of molecular weight and activity ofsuperoxide dismutase using SDS‐PAGE”. J.Biochem.Biophys.Methods,47:233–7.
14. Critchley,C.1994“D1proteinturnover:responsetophotodamageormechanism?InBaker,N.&Bowyer,J. R. [Eds.] Photoinhibition of Photosynthesis fromMolecularMechanisms to the Field”.BIOSScientificPubl,Oxford,pp.195–201.
15. Cullen,J.J.&Lewis,M.R.1995“Biologicalprocessesand optical measurements near the sea‐surface:
Volume 3 Issue 3: 2015 Volume 3 Issue 4: 2015
www.ijset.in ISSN (O): 2348-4098 ISSN (P): 2395-4752
International Journal of Science, Engineering and Technology Page 87

some issuesrelevant toremotesensing”. J.Geophys.Res.100:13255–66.
16. Daniela,B.,Friedmann,E.I.,Helm,R.F.andPotts,M.2001 “Gene Transfer to the Desiccation‐TolerantCyanobacterium Chroococcidiopsis” Journal OfBacteriology,April2298–2305.
17. David,J.T.,Jannette,B.T.,Shane,D.P.,Nicole,E.N.andStephen, K.H. 1999 “Iron Superoxide DismutaseProtects against Chilling Damage in theCyanobacterium Synechococcus species PCC79421.”PlantPhysiology,120,pp.275–282.
18. Falkowski, P. G. & Raven, J. A. 1997. “AquaticPhotosynthesis”.BlackwellScience,Ltd.,Malden,374pp.
19. Felisa,W.S.,Daniel,G.,Oscar, S. andPaul,G.F. 2006‘’TheroleandevolutionofSuperoxidedismutasesinAlgae’’.PlantPhysiol.,142(4),1701‐1709.
20. Fink, R. C. & Scandalios, J. G. 2002. “Molecularevolutionandstructure‐functionrelationshipsofthesuperoxidedismutasegene families inangiospermsand their relationship to other eukaryotic andprokaryotic superoxide dismutases”.Arch.Biochem.Biophys.399:19–36.
21. Gallon,J.R.1992.‘’Reconcilingtheincompatible:N2fixation and Oxygen’’. New Phytologist, 122: 571–609.
22. Henry, L.E., Gogotov, I.N. and Hall, D.O. 1978“Superoxide dismutase and catalase in theprotection of the proton‐donating systems ofnitrogen fixation in the blue‐green alga Anabaenacylindrical”.J.Biochem.,174:373–377.
23. Herbert,S.K.,Samson,G.,Fork,D.C.&Laudenbach,D. E. 1992 “Characterization of damage tophotosystems I and II in a cyanobacterium lackingdetectableironsuperoxidedismutaseActivity”.Proc.Natl.Acad.Sci.USA89:8716–20.
24. ImlayJ.A.andFridovich,I.1991“Assayofmetabolicsuperoxide production in Escherichia coli”. J BiolChem,266:6957–6965.
25. Jae‐Hyun, K. & Kyong, H.S. 2005 “Light‐dependentexpression of superoxide dismutase fromcyanobacterium Synechocystis sp. strain PCC 6803”ArchMicrobiol,183:218–223.
26. Kaiser, W.M. 1979. ‘’Reversible inhibition of theCalvin‐cycle and activation of oxidative pentosephosphate cycle in isolated intact chloroplasts byhydrogenperoxide’’.Planta.,145:377‐382.
27. Kaneko, T., Nakamura, Y., Wolk, C.P., Kuritz, T.,Sasamoto,S.,Watanabe,A.,Iriguchi,M.,Ishikawa,A.,Kawashima, K., Kimura, T., Kishida, Y., Kohara, M.,Matsumoto,M.,Matsuno,A.,Muraki,A.,Nakazaki,N.,Shimpo,S.,Sugimoto,M.,Takazawa,M.,Yamada,M.,Yasuda,M. and Tabata, S. 2001 “Complete genomicsequence of the filamentous nitrogen‐fixingcyanobacteriumAnabaenasp.strainPCC7120”.DNARes.,8:205‐213.
28. Kumar, A., Tyagi, M.B., Jha, P.N., Srinivas, G. andSinha, A. 2003. ‘’Inactivation of cyanobacterialnitrogenase after exposure to ultraviolet‐Bradiation’’.Curr.Microbiol.46,380‐384.
29. Kwang, H.B. and Daniel, Z.S. 2005 ‘’Differentialexpression of manganese superoxide dismutasesequence variants in near isogenic lines of wheatduring cold acclimation’’. Plant cell Rep. DOI10.1007/s00299‐005‐0073‐6.
30. Li,T.,Huang,X.,Zhou,R.,Liu,Y.,Li,B.,Nomura,C.&Zhao, J. 2002 “Differential expression andlocalizationofMnandFe superoxidedismutases inthe heterocystous cyanobacterium Anabaena sp.strainPCC7120”.J.Bacteriol.,184:5096–103.
31. Liu,Y.,Zhou,R.andZhao,J.2000“Molecularcloningand sequencing of the sodB gene from aheterocystous cyanobacterium Anabaena 7120”.Biochim.Biophys.Acta,1491:248–252.
32. Lukow,T.,Dunfiel,P.F.andLiesack,W.2000‘’UseoftheT‐RFLPtechniquetoassessspatialandtemporalchangesinthebacterialcommunitystructurewithinanagriculturalsoilplantedwithtransgenicandnon‐transgenic potato plants’’. FEMS Microbiol. Ecol.,32:241‐247.
33. Mallick, N. and Rai, L.C. 1999 “Response of theantioxidant systems of the nitrogen fixingcyanobacterium Anabaena doliolum to copper”.JournalofPlantPhysiology,155:146‐149.
34. Martinez, J. S., Zhang, G. P., Holt, P. D., Jung, H.‐T.,Carrano,C.J.,Haygood,M.G.&Butler,A.2000“Self‐assembling amphiphilic siderophores from marinebacteria”.Science,287:1245–7.
35. McKay, R.M.L., Twiss,M.R. andNalewajko, C. 2001“Trace metal constraints on carbon, nitrogen andphosphorus acquisition and assimilation byphytoplankton. In: Algal adaptation toEnvironmental Stresses: Physiological, BiochemicalandMolecularmechanisms”. (Eds)Rai,L.Cand J.P.Gaur.Springer‐Verlag,berlin.pp.21‐43.
36. Meenakshi, C., Umesh, K.J., Mohammed, A.K.,Sunaina, Z. and Tasneem, F. 2006 ‘’Effect of heavymetal stress on proline, malondialdehyde, andsuperoxidedismutaseactivityinthecyanobacteriumSpirulina platensis‐S5’’. Ecotoxicology andEnvironmentalSafety.66(2),204‐209.
37. Navari‐Izzo, F., Pinzino, C., Qaurtacci, M.F. andSgherri,C.L.1999“Superoxideandhydroxyl radicalgeneration, and superoxide dismutase in PSIImembranefragmentsfromwheat”.FreeRadicalRes.,30:3–9.
38. Nishida, I. andMurata,N. 1996 ‘’Chilling sensitivityinplantsandcyanobacteria:Thecrucialcontributionof membrane lipids. Annu. Rev. Plant PhysiologyPlantMol.Biology,47:541‐568.
39. Noctor, G. and Foyer, C.H. 1998 ‘’Ascorbate andglutathione: keeping active oxygen under control’’.Annual Review of Plant Physiology Plant MolecularBiology,49:249‐279.
40. Ogawa, K., Kanematsu, S., Takabe, K. and Asada, K.1995 ‘’Attachment of CuZn‐superoxidedismutase tothylakoid membranes at the site of superoxidegeneration (PSI) in spinach chloroplasts: detectionby immuno‐gold labeling after rapid freezing andsubstitutionmethod’’.PlantCellPhysiology,36:565‐573.
41. Okamoto,O.K.,Pinto,E.,Latorre,L.R.,Bechara,E.J.H.&Colepicolo,P.2001“Antioxidantmodulationinresponse tometal‐induced oxidative stress in algalchloroplasts”.Arch.Environ.Contam.Toxicol. 40:18–24.
42. Padmapriya,V. andAnand,N.2010 “The InfluenceOf Metals On The Antioxidant Enzyme, SuperoxideDismutase, Present In The Cyanobacterium,Anabaena variabilis” KÜTZ Asian Research
Volume 3 Issue 3: 2015 Volume 3 Issue 4: 2015
www.ijset.in ISSN (O): 2348-4098 ISSN (P): 2395-4752
International Journal of Science, Engineering and Technology Page 88

Publishing Network Journal of Agricultural andBiologicalScienceVol.5,No.2.
43. Palenik, B., Brahamsha,B., Larimer, F.W., Land,M.,Hauser,L.,Chain,P.,Lamerdin,J.,Regala,W.,Allen,E.E., Mccarren, J., Paulsen, I., Dufresne, A., Partensky,F.,Webb,E.A.&Waterbury,J.2003“Thegenomeofamotilemarine Synechococcus”.Nature,424:1037–42.
44. Punia,S.,Singh,N.andKanupriya2011‘’Expressionof SOD under chilling and phosphate stress incyanobacterium Spirulina’’.AnnalsofBiology,27(1):17‐22.
45. Quail, P.H. 1994 “Photosensory perception andsignal transduction in plants”. CurrOpinGenetDev,4:652–661.
46. Regelsberger,G.,Atzenhofer,W.,Ruker,F.,Peschek,G.A.,Jakopitsch,C.,Paumann,P.G.&Obinger,C.2002“Biochemicalcharacterizationofamembrane‐boundmanganese‐containing superoxide dismutase fromthe cyanobacterium Anabaena PCC 7120”. J BiolChem,277:43615‐43622.
47. Rijstenbil,J.W.2002“AssessmentofoxidativestressintheplanktonicdiatomThalassiosirapseudonanainresponsetoUVAandUVBradiation”.J.PlanktonRes.,24:1277–88.
48. Rijstenbil, J.W. 2003 “Effects of UVB radiation andsalt stress on growth, pigments and antioxidativedefense of the marine diatom Cylindrothecaclosterium”.Mar.Ecol.Prog.Ser.,254:37–47.
49. Sakamoto, T. and Bryant, D.A. 1999 ‘’Nitratetransport and not photoinhibition limits growth ofthe freshwater cyanobacterium Synechococcusspecies PCC 6301 at low temperature’’. PlantPhysiol.,119:785‐794.
50. Schopf, J.W. 2000 ‘’The Fossil Record: Tracing therootsofthecyanobacteriallineage.IntheEcologyofCyanobacteria’’.WhittonBA.
51. Segot,M.,Codomier,L.,Combaut,G.,1983“Actiondequatremetaur e lourds (cadmium, cuivre,mercure,Plombs) sur la croissance de Asparagopsis armataenculture”.J.Exp.Mar.Biol.Ecol.,66,41–48.
52. Shavyrina, O.B., Gapochka, L.D., Azovskii, A.I., 2001“Development of tolerance for copper incyanobacteriarepeatedlyexposedtoitstoxiceffect”.Biol.Bull.28(2),183–187.
53. Sinha,R.P.andHader,D.P.2002‘’LifeundersolarUVradiation inaquaticorganisms’’.Adv.SpaceRes., 30,1547‐1556.
54. Slain, M.L. 1991 “Chloroplast and mitochondrialmechanisms forprotectionagainstoxygen toxicity”.FreeRadicalResCommun,12–13:851–858.
55. Steinitz,Y.,Mazor,Z.andShilo,M.1979‘’Amutantofthe cyanobacteriumPlectonemaboryanumresistanttophotooxidation’’.PlantSci.Lett.,16:327–335.
56. Sudha, S.S. Karthic, R., Francis, M., Soumya, T.S.,RengaRamanujam, J. 2011 ‘’Isolation andpreliminary characterization of associatedmicrooorganisms fromspirulinaproducts and theirsilver mediated nanoparticle synthesis’’. J. AlgalBiomassUtln.,2(3):1–8.
57. Sunda, W.G. 2000 “Trace metal/ phytoplanktoninteractions in aquatic systems. In: Environmentalmicrobe‐metal interactions”. Ed. Lovely DR. ASMpress,Washington.pp.79‐107.
58. Takahashi, M. and Asada, K. 1988 ‘’Superoxideproduction in aprotic interior of chloroplastthylakoids’’.Arch.Biochem.Biophys.,267:714–722.
59. Thomas, D.J., Avenson, T.J., Thomas, J.B. & Herbert,S.K.1998“Acyanobacteriumlackingironsuperoxidedismutase is sensitized to oxidative stress inducedwithmethylviologenbutnotsensitizedtooxidativestress induced with norflurazon”. PlantPhysiology,116:1593‐1602.
60. Touati, D. 1997 “Iron and oxidative stress inbacteria”.ArchBiochemBiophys,373:1–6.
61. Tripathi, S.N. and Srivastava, P. 2001. ‘’Presence ofstableactiveoxygenscavengingenzymessuperoxidedismutase, ascorbate peroxidase and catalase in adesiccation‐tolerant cyanobacterium Lyngbyaarboricolaunderdrystate’’.CurrentScience,81:197‐200.
62. Vellard,M. 2003 ‘’The enzyme as drug: Applicationof enzymes as pharmaceuticals’’. Curr Opinion inBiotech.,14:1‐7.
63. Weatherburn, D. C. 2001 “Manganese‐containingenzymesandproteins”.InBertini,I.,Sigel,A.&Sigel,H. [Eds.] “Handbook on Metalloproteins”. MarcelDekker,Inc.,NewYork,pp.193–268.
64. Weixing, Z. Qinxi, G. and Jindong, Z. 2007 ‘’AMembrane‐Associated Mn‐Superoxide DismutaseProtects the Photosynthetic Apparatus andNitrogenase from Oxidative Damage in theCyanobacteriumAnabaenasp.PCC7120’’.PlantCellPhysiol.,48(4):563–572.
65. Wuerges,J.,Lee,J.‐W.,Yim,Y.‐I.,Yim,H.‐S.,Kang,S.‐O.& Carugo, K. D. 2004. “Crystal structure of nickel‐containing superoxide dismutase reveals anothertype of active site”. Proc. Natl. Acad. Sci., USA101:8569–74.
66. Yankovskaya, V., Horsefield, R., Tornroth, S., Luna‐Chavez,C.,Miyoshi,H.,Leger,C.,Byrne,B.,Cecchini,G. and Iwata, S. 2003 ‘’Architecture of succinatedehydrogenase and reactive oxygen speciesgeneration’’.Science,299:700–704.
67. Zhang,C.C.,Laurent,S.,Sakr,S.,Peng,L.andBedu,S.2006 “Heterocyst differentiation and patternformationincyanobacteria:achorusofsignals”.Mol.Microbiol.,59:367–375.
Volume 3 Issue 3: 2015 Volume 3 Issue 4: 2015
www.ijset.in ISSN (O): 2348-4098 ISSN (P): 2395-4752
International Journal of Science, Engineering and Technology Page 89

FIGURES
Figure1:TheAscorbate‐GlutathionecyclerepresentingSODasfirstlineofdefensetoact(Source;NoctorandFoyer,1998).
Figure2:SyntheticdistributionbasedonknownevidencefrombiochemicalandgeneticdataofthevariousSODsoverthetreeof life(figuremodifiedafterBaldaufetal2004).FeandMnSODbothhavingcontrastingevolutionaryhistories,The
Volume 3 Issue 3: 2015 Volume 3 Issue 4: 2015
www.ijset.in ISSN (O): 2348-4098 ISSN (P): 2395-4752
International Journal of Science, Engineering and Technology Page 90

FeSOD isprevalent inall themajorcladeswhileMnSODmore inbacteriaandEukaryota. In cyanobacteria,FeSODmayhave ancestral origin from the GSB ancestor of PSI while MnSOD may have the protobacterial ancestor to PSII andmitochondria.TheCuZnSODshowsmultiple lateral gene transfersandorganismsoftenpossessmultiple copiesof it intheir genomes which are significantly phylogenetically distant. The NiSOD genes are found in genomes of fourcyanobacteria.BranchesarecoloredaccordingtoknownSODs:magenta,FeSOD;cyan,MnSOD;cyan/magenta,Fe/MnSODcambialistic);green,CuZnSOD;andgray,unknownformofSOD(Felisaetal,2006).
Figure3:SubcellularlocalizationofSODs.ThisconceptualschemerepresentallthepossiblelocationsofSODsinaeukaryoticcell(Felisaetal,2006).
Volume 3 Issue 3: 2015 Volume 3 Issue 4: 2015
www.ijset.in ISSN (O): 2348-4098 ISSN (P): 2395-4752
International Journal of Science, Engineering and Technology Page 91

SYNTHESIS,CHARACTERIZATIONANDANTIMICROBIALEFFICACYOFCYANOBACTERIAL(POLYMER)SILVERNANOPARTICLECONJUGATES
1RITIKACHANAN,2MINAKSHILALIT,3NAVEEN,4,*NAMITASINGH
1ResearchScholar,MicrobialBiotechnologyLaboratory,DepartmentofBioandNanoTechnology,GuruJambheshwarUniversityofScienceandTechnology,Hisar‐125001,Haryana,India,Email:[email protected]
2ResearchScholar,MicrobialBiotechnologyLaboratory,DepartmentofBioandNanoTechnology,GuruJambheshwarUniversityofScienceandTechnology,Hisar‐125001,Haryana,India,Email:[email protected]
3M.Tech.Student,MicrobialBiotechnologyLaboratory,DepartmentofBioandNanoTechnology,GuruJambheshwarUniversityofScienceandTechnology,Hisar‐125001,Haryana,India
4AssociateProfessor,MicrobialBiotechnologyLaboratory,DepartmentofBioandNanoTechnology,GuruJambheshwarUniversityofScienceandTechnology,Hisar‐125001,Haryana,India,Email:[email protected]
*correspondingaddress:Email:[email protected]
ABSTRACT
Emergence ofmicrobial resistance is the one of themajor problem nowadays; thus there have been tremendous effortstowardsfindingnewmetabolitesforthedevelopmentofnewantimicrobialdrugs.Cyanobacteriahavebeenidentifiedasoneofthemostpromisinggroupofmicro‐organismsfromwhichnovelandbiochemicallyactivenaturalproductscanbeisolated.Synthesis of nanoparticles using plant extracts has gained utmost importance in research world but biosynthesis ofnanoparticlesusingmicrobes isstillunexploredandunderexploited. In thecaseofmicro‐algalspecies,Cyanobacteriahavebeen studied ingreatdetail for in‐vitro silvernano‐particlegenerationand stabilization.TreatmentofCyanobacterialcellextractswith silvernitrate solution inproperconcentrationandconditionsmaycap themicrobialmetabolicproteinsandmaycausethereductionofsilverionsleadingtosynthesisofsilvernanoparticles.Inthepresentstudy,chemicallysynthesizedsilvernanoparticles(particlesize–85nm)werestabilizedusingdifferentCyanobacterialpolymericparticles(biological)andwereevaluatedintermsofantibacterialactivityandcharacterizedusingUV‐VisibleSpectroscopy,FourierTransformInfraredSpectroscopy (FTIR) techniques.The particle size of nanoparticleswas determined using particle size analyzer.With thisstudy,thesenanoparticlesbearingantimicrobialactivitythus,canbeusedasanovelsourceforcommercialapplications inthedifferentfields:pharmaceutical,cosmetics,industrial,Environmental,food,Agricultural,chemical,medicalsectoretc.
EYWORDS:Silvernanoparticles,Cyanobacterialpolymericparticles,Antimicrobialactivity.
1.INTRODUCTION
Due to unique electronic, mechanical, magnetic andchemical properties of metal nanoparticles that aresignificantly different from those of bulk materials [1]attributed to theirsmall sizesand largespecificsurfacearea, scientists found that silver nanoparticles exhibitinteresting antibacterial activities [2, 3]. Antibacterialactivity of the silver‐containing materials can be used,for example, in commercial sectors‐ medical,pharmaceutical, agricultural, textileetc [4‐10].Differentmethods to synthesize metal nanoparticles include:electrochemical method, thermal decomposition, laserablation, microwave irradiation and sono‐chemicalsynthesis[11‐17].Thesimplestandthemostcommonlyused synthetic method for metal nanoparticles is thechemicalreductionofmetalsalts[18,19].Thischemicalmethod involves reduction of an ionic salt in anappropriatemediuminthepresenceofsurfactantusingvariousreducingagents[20,21].Stabilityandtoxicityofnanoparticles is the main problem that affects thecommercialuseofsilvernanoparticles[22].Inthisstudy,wehavetriedusingbiological(Cyanobacterial)polymerto minimize toxicity and stability problem. Long termstabilityof thesilvernanoparticles isnotdesirable,dueto this reason; wehaveusedcyanobacteria tostabilizethe silvernanoparticlesby their secretedproteins [23].
Stress tolerance during adverse conditions byCyanobacterial nanoparticles is because they possesshighly heterogeneouspolymers containing a number ofdistinct polysaccharides and non‐carbohydrateconstituents including proteins, phospholipids andnucleic acids. Studies have shown that polysaccharidesplay a crucial role in bio‐sorption and binding of toxicheavymetals (silver particles).These properties of bio‐nanoparticles find special applications inbioremediation, food, and pharmaceutical industries[24].Ourstudysignifiesontheusageofcyanobacteriaasa stable carrier for silver nanoparticles and calciumalginate as a cross linker between silver nanoparticlesand cyanobacteria. Alginate and its composites havebeen used in many biomedical applications includingdrug delivery and wound dressings. It can also beeffectively used for the immobilization of silvernanoparticles [25]. Cyanobacterial silver nano‐particleconjugates were bio‐evaluated against E.coli andS.aureus.
2.MATERIALSANDMETHODS
2.1 CHEMICAL SYNTHESIS OF SILVERNANOPARTICLES
Volume 3 Issue 3: 2015 Volume 3 Issue 4: 2015
www.ijset.in ISSN (O): 2348-4098 ISSN (P): 2395-4752
International Journal of Science, Engineering and Technology Page 92

8.5mgof silvernitratewasdissolved in50mldistilledwater(1mM).Tri‐sodiumcitratewasusedasareducingagent.5mlof1%tri‐sodiumcitratewasaddeddrop‐wisein the silver nitrate solution at 850C on continuousstirring at 50‐70 rpm [26]. The sampleswere analysedwith visual inspection and UV‐Vis spectroscopy. Paleyellowishcolourwasobserved.The timescaleofvisualevolution depends on the silver nitrate solution. Ingeneral, nano‐particle formation is visually appreciableafter4minofthebeginningofthereaction.
2.2CULTIVATIONOFCYANOBACTERIA
The cultivation of cyanobacteria was carried out usingBG‐11media at 27±20C, under continuous illuminationof2000luxmaintainedbywhitefluorescencelamps.Thecultures were regularly sub‐cultured and maintainedundercontinuousshakingconditionsforfewweeks.Thecellswereseparatedfromthemediumbycentrifugation(4000rpm/10min) followedby filtrationwithWhatmanfilter paper. Finally, the Cyanobacterial pellets werelyophilized and storedat –20 0C.ThreeCyanobacterialsamples depicting high amounts of protein/lipopeptides/pigments in theextractionmediumwereusedin different concentration and dissolved in PBS(Phosphate buffer saline) buffer. The chlorophyllconcentrations of the cyanobacteria at 665nmabsorbance:Microcystis aeruginosa, Frischerella andB6strain(PersonalculturecollectionofDr.NamitaSingh’s,MicrobialBiotechnologyLaboratory,andDepartmentofBioAndNanoTechnology)were35µg/ml,28µg/mland21µg/ml respectively. The cultures were dissolved inPBSbufferasfollows:Microcystisaeruginosa(0.2gofthelyophilizedbiomasswasdissolved in 10mlPBSbuffer),Frischerella (0.16g of the lyophilized biomass wasdissolved in5mlPBSbuffer)andB6 isolate(0.1gof thelyophilized biomass was dissolved in 5ml PBS buffer),keeping in view that all the three samples had sameprotein concentration, determined by Bradford’smethod.2.3 PREPARATION OF LINKERS WITHCYANOBACTERIAL SAMPLES (CYANOBACTERIA‐LINKERSOLUTION)70mgofSodiumalginatewasdissolvedin20mldistilledwater (3mM) and calcium chloride solution (45mg in10ml, 0.03M) was added drop wise on continuousstirring to sodium alginate solution. To the abovemixture,after10minutes,PBSdissolvedthreedifferentCyanobacterial sampleswere added dropwise in threedifferent beakers. These solutions were used in 5:1:4respectively.2.4CONJUGATIONOFSILVERNANOPARTICLESWITHCYANOBACTERIAL‐LINKERSOLUTIONMix 5ml of each cyanobacteria‐linker sample to 5ml ofsilvernano‐particlesolutiononcontinuousstirringfor3to4hours.Thesampleswere furthersubjected forUV‐visiblespectroscopicanalysis.2.5TESTMICRO‐ORGANISMS
Themicroorganisms includinggrampositiveandgramnegativebacteriawereusedinthisstudy.Staphylococcusaureus NCIM 5021 (gram positive), E.coli MTCC‐723(gram negative) were provided from NCIM (NationalCollection of Industrial Microorganisms) culturecollection, Pune and Institute of Microbial Technology,Chandigarh, India respectively. The bacterial strainsweremaintained on nutrient agar slants and incubatedat300C.2.6ANTIBACTERIALASSAYThe antimicrobial susceptibility of Silver Nanoparticles(Ag NPs) was evaluated using well diffusion method.Zones of inhibition were measured after overnightincubation at 300C. The comparative study was madebetween cyanobacteria linked silver nanoparticles andsilvernanoparticlesalone.3.RESULTSANDDISCUSSIONSilver nanoparticles were synthesized according to thechemicalreductionmethod.
Figure1:SilverNanoparticlesolution
Thetransparentcolourlesssolutionwasconvertedtothecharacteristicpaleyellowcolour,whencitrateofsodium(tri‐sodium citrate) was used as stabilizing agent. Theoccurrence of colour indicated the formation of silvernanoparticles. The change in colour is because of thestrongabsorptionofvisiblelightduetoexcitationofthenano‐particlesurfacePlasmon[27‐29].
AnalyticalAssays:
3.1UV‐VisibleSpectralAnalysis
UV‐Visible spectroscopy isoneof themostwidelyusedtechniques. Nanoparticles can be structurallycharacterized using this technique. The change in thecolorandthustheformationofsilvernanoparticleswasconfirmedby theUV‐Vis experiment. TheUV‐Vis photospectra of AgNPs (SilverNanoparticles)was recordedwith respect to the substrate placed in the referencebeamusingdoublebeamspectrophotometer(Shimadzu,Model:UV‐2450) in the range200–800nm.Absorptionpeak of Silver nano‐particle synthesized by chemicalreduction method using tri‐sodium citrate and silvernitrate was recorded. In the figure 1.1(1), UV‐Visiblespectraofthesilvernitratesolutiongaveapeakaround217nm,asexpectedforsilverions.Itwasobservedthat
Volume 3 Issue 3: 2015 Volume 3 Issue 4: 2015
www.ijset.in ISSN (O): 2348-4098 ISSN (P): 2395-4752
International Journal of Science, Engineering and Technology Page 93

surface Plasmon absorption maximum was shifted tolowerwavelengthwith addition of citrate of sodiumasreducing agent [30].UV‐Visible Spectroscopy for Cyanobacteria‐Microcystis aeruginosa showed the absorptionmaximaat300‐700nmwiththepresenceofchlorophylla, phycoerythrin and phycocyanine and absorptionmaxima at 700‐800 nm showed the presence of
chlorophyll a [31]. Fig 2 describes the UV‐Vis photospectra of the mixture sample of (a) Silver Nano‐particles (b)Microcystis aeruginosa linked silver nano‐particles (c)Frischerella linked silvernanoparticlesand(d) B6 Cyanobacteria linked silver nanoparticlesrecordedintherangeof200–800nm.
(a)Silvernanoparticles(AgNPs)(b)MicrocystisaeruginosalinkedAgNPs
(c)FrischerellalinkedAgNPs(d)B6linkedAgNPs
Figure2:UV‐VisibleSpectraofAgNPsandCyanobacterialinkedAgNPs
3.2PARTICLESIZEANALYSIS Particle size of Ag NPs formed was 85nm in diameter.Shape of the particles and spherical structure of theparticles can be controlled experimentally. The resultindicated that the average particle size of thesynthesized silver nanoparticles was highly influencedby the reaction. The nano size of material results inspecific physicochemical characteristics different thanthose of their bulk materials or larger particles. Thiseffect ismainly credited tohigh surface‐area‐to‐volume
ratio, which results in increased reactivity; hence, thenano scalematerials aremore advantageous than theirbulk counterparts. Average size of silver nano‐particleswasrecordedtobe85nm.Afterconjugation,Microcystislinked silver nano particles conjugate showed 144nmsize of particles.Frischerella linked silver nanoparticlesconjugate showed 503nm size of the particle.Cyanobacteria B6 linked silver nanoparticles showed216nmsizeofparticles.Thismeanstheseparticles,givehigh‐surface‐to‐volumeratio,whichresults in increasedreactivity.
Table‐1:PeakvaluesdepictingAverageSize(r.nm),Intensity(%),andWidth(r.nm)ofthreedifferentCyanobacterial
samplesinkedwithAgNPs
Volume 3 Issue 3: 2015 Volume 3 Issue 4: 2015
www.ijset.in ISSN (O): 2348-4098 ISSN (P): 2395-4752
International Journal of Science, Engineering and Technology Page 94

Chart‐1:Relationshipbetweenintensityandsize(r.nm)of silver nanoparticles prepared from differentCyanobacterial samples: Microcystis, Frischerella, B6isolate.3.3FTIRANALYSIS
The FTIR spectrum indicates various functional groupspresentatdifferentpositions.IRspectroscopystudyhasconfirmed that the carbonyl group of amino acidresiduesandpeptidesofproteinshasa strongerabilityto bind metal, so that the proteins may form a coat,coveringthemetalnanoparticles(i.e.cappingofAgNPs)to prevent the agglomeration of the particles and tostabilizethenanoparticlesinthemedium.InthecaseofMicrocystis aeruginosa, Frischerella , B6 Isolate linkedsilver nano particle conjugates, the peaks in the regionbetween 3859.55 to 3422.27 are assigned to O‐Hstretching of alcohol and phenol compounds andaldehyde–C‐H‐ stretching of alkanes. The peaks in theregion1615.76to1407.02and1300to650correspondstoN‐H(bond)ofprimaryandsecondaryamidesand–C‐N‐ stretching vibration of amines or C‐O stretching ofalcohols,etherandcarboxyicacid.
(a) MicrocystisaeruginosalinkedAgNPs(b)FrischerellalinkedAgNPs
. (c)B6linkedsilvernanoparticles
Figure3:FTIRSpectraofSilverNanoparticleslinkedwiththreedifferentCyanobacteriaThe overall peaks from FTIR observation confirm thepresence of protein in the samples of silvernanoparticles. It can be assumed that there is the
presenceofnitratereducingbacteriatoproducenitratereductase enzyme (protein). This reduces to silvernitrate solution fromsilvernanoparticles [32, 33].The
4000.0 3600 3200 2800 2400 2000 1800 1600 1400 1200 1000 800 600 400.0
48.0
49
50
51
52
53
54
55
56
57
58
59
60
61.0
cm-1
%T
3422.27
2362.06
2344.55
1615.78
1407.03 1093.18
942.65
665.73 528.67
1032.16
1121.67
2857.14
2929.97
3859.94
4000.0 3600 3200 2800 2400 2000 1800 1600 1400 1200 1000 800 600 400.0
32.0
33
34
35
36
37
38
39
40
41
42
43
44
45
46
47
48
49
50
51.0
cm-1
%T
3422.35
2925.782362.58
1618.14
1385.191028.85
550.91
3859.94
1082.51
951.04
618.18
4000.0 3600 3200 2800 2400 2000 1800 1600 1400 1200 1000 800 600 400.0
32.0
33
34
35
36
37
38
39
40
41
42
43
44
45
46.0
cm-1
%T
3433.80
2362.83
1616.40
1406.23
1093.74
536.23
2929.97
1127.27 1029.37
951.04
Volume 3 Issue 3: 2015 Volume 3 Issue 4: 2015
www.ijset.in ISSN (O): 2348-4098 ISSN (P): 2395-4752
International Journal of Science, Engineering and Technology Page 95

bands at 1622 cm‐1 and 1527 cm‐1 correspond to thestretch molecule vibration. The two bands existing at1412 cm‐1 and 1029 cm‐1 can be assigned to the C‐Nstretching vibrations of aromatic and aliphatic amines.The corresponding bending vibrations were seen at1651 cm−1 and 1548 cm‐1, respectively. The two bandsobservedat1379cm−1and1033cm−1canbeassignedtothe C–N stretching vibrations of aromatic and aliphaticamines, respectively [34].The silver ionswere reduced
in the presence of nitrate reductase, leading to theformation of a stable silver hydrosol 10‐25 nm indiameter and stabilized by the capping agent [35]. Thepresence of protein acts as a stabilizing agent andsurrounds silver nanoparticles [36]. The clarity of thepeakshowedthepresenceofproteinintheconjugation.The shifting of some peak at 528, 805, 1127 and 1320showedthepresenceofdisulphide,S‐OR, thio‐carbonyl,phosphonategroupsalso.
Table‐2:StretchingandvibrationoffunctionalgroupofNanoformulations
3.4ANTIMICROBIALACTIVITYIt iswellknownthatsilver ionnanoparticlesarehighlytoxictomicroorganisms.Silvernanoparticleshavebeenknown to have inhibitory and bactericidal effects andthusweextenditsapplicationasanantibacterialagent.The biological activity of silver based materials,depending on their structure and physicochemicalproperties, affects the interaction with the cytoplasmicmembraneofbacteriaandinfluencescellmetabolism.Inour study, the antimicrobial activity of nano‐silver‐containingCyanobacterialfilmswasinvestigatedagainstE. coli and Staphylococcus aureus. The Antibacterialactivity is estimatedby the zoneof inhibition [37].Thedifferences in the composition of the cell wall of Gramnegative (E.coli)andGrampositive (S.aureus)bacteriaandhydrophilicandhydrophobiccharacterofE.coliandS. aureus respectively induce different antimicrobialactivity. The mechanism of the bactericidal effect of
silverandsilvernanoparticlesremainstobeunderstood.Several studies propose that silver nanoparticles mayattach to the surface of the cell membrane disturbingpermeability and respiratory function of the cell. It isalso possible that silver nanoparticles not only interactwith the surface of membrane, but can also penetrateinside the bacteria [38]. Itmay be observed that silvernanoparticles have comparatively higher anti‐bacterialactivity against gram negative organism than grampositive, probably due to thinner peptidoglycan layerandpresenceofporins[39].Twoaspectsaretobeconsidered:
MeanWidthofZoneofinhibition(Diameter,cm) Microorganismused:
EscherichiacoliMTCC723
StaphylococcusaureusNCIM5021
Figure4:Antimicrobialefficacyof(A)AgNP(PositiveControl),(B)MicrocystislinkedAgNP,(C)FrischerellalinkedAgNP,(D)B6linkedAgNP(E)Negativecontrol(OnlyPBSBufferinsteadofthetestextract)againstE.coli.
Volume 3 Issue 3: 2015 Volume 3 Issue 4: 2015
www.ijset.in ISSN (O): 2348-4098 ISSN (P): 2395-4752
International Journal of Science, Engineering and Technology Page 96

Figure5:Antimicrobialefficacyof(a)AgNP(Positivecontrol),(b)MicrocystisaeruginosalinkedAgNP,(c)FrischerellalinkedAgNP,(d)B6linkedAgNP(e)Negativecontrol(PBSBufferinsteadoftestextract)againstS.aureus.
Table‐3:ZoneofInhibitionofsilvernanoparticlesandCyanobacterialinkedAgNPs.Parenthesisshowing%reductioninzoneofinhibitionafter30daysstorageofsilvernanoparticlesat4˚C.
The antibacterial activity of the test extracts(CyanobacteriaLinkedSilverNanoparticles)andpositivecontrol (Silver Nanoparticles alone) maintained at 40C,were again measured after one month against testpathogensintermsofzoneofinhibition.Itwasobservedthat the zone of inhibition in cms for the silvernanoparticles decreased in diameter. The possiblereason for this decrease could be due to theagglomeration of the silver nanoparticles with timewhereas the zone of inhibition of cyanobacteria linkedsilver nanoparticles remained same in diameter evenafter one month. This indicated that the nanoparticleslinkedwithcyanobacteriadidnotagglomerateandwerestabilizedforalongerperiodoftimeduetothesecretionofproteinsfromcyanobacteriawhichactedasacappingagent to help these conjugates to not to lose theireffective bioactivity whereas non‐conjugated silvernanoparticlesshowedadecreaseinsizeoftheirzoneofinhibitionandbioactivitywithtime.
4.CONCLUSION
Inourstudy,silvernanoparticleswithmeandiameterof85nm were synthesized using tri‐sodium citrate as areducingagent.ThenanoparticleswerecharacterizedbyUV/Vis Spectroscopy, FTIR. UV/Vis spectra showed thecharacteristic Plasmon absorption peak for the silvernanoparticles ranging from 200‐ 230 nm. Additionally,the antibacterial activity of the nanopartículatedispersion was measured. The results of this study
clearly demonstrated that the colloidal silvernanoparticlesinhibitedthegrowthandmultiplicationofthe tested bacteria, including highly multi resistantbacteriasuchasS.aureusandEscherichiacoli.Thesilvernanoparticles linked cyanobacteria help to reduce thetoxicity of the silver nanoparticles and improve thestability of the silver nanoparticles by the secretion ofproteins (capping agent) after conjugation withcyanobacteria. The Bio‐Nano‐formulation ofcyanobacteria and silver nano‐particles conjugateweremore stable than the silver nanoparticles alone againstpathogenic bacteria and thus these conjugates findapplication in commercial fields such as‐ biomedical,pharmaceutical, cosmetics, health, food and agriculturesectors.
ACKNOWLEDGEMENT
AuthorsacknowledgeUGC‐BSRandDSTforfinancialsupportintheformoffellowshiptothestudentandDBT –HRD Programme , UGC‐SAP for infrastructurefacilitiescreatedinthedepartment.
REFERENCES
[1]. Mazur,M.,“Electrochemicallypreparedsilvernano‐flakesandnano‐wires”.ElectrochemistryCommunications,vol.6,2004,p400‐403.
[2]. Shahverdi, A.R..; Fakhimi, A., “Neural NetworkModelling For Prediction Size Of Silver
Volume 3 Issue 3: 2015 Volume 3 Issue 4: 2015
www.ijset.in ISSN (O): 2348-4098 ISSN (P): 2395-4752
International Journal of Science, Engineering and Technology Page 97

Nanoparticles InMontmorillonite/Starch SynthesisByChemicalReductionMethod”. Digest JournalofNanomaterials and Biostructures, vol.3, 2007, p168‐171.
[3]. Pal, S., “A General Strategy for Nano crystalSynthesis”.Applied and EnvironmentalMicrobiology,vol.73,no.6,2007,p1712‐1720.
[4]. Roldan, M.V.; Frattini, A.L., “Synthesis, chemicalreductionmethodand theirantibacterialactivity”.AnalesAFA,vol.17,2005,p212‐217.
[5]. Yin, H.; Amamoto, T.Y.; Wada, Y., “Microwave‐Mediated Rapid Synthesis of Gold Nanoparticles”.Materials Chemistry and Physics, vol.83, 2004, p66‐70.
[6]. Zhu, Z.; Kai, L.; Wang, Y., “Synthesis andapplications of hyper branched polyesterspreparation and characterization of crystallinesilver nanoparticles”. Materials Chemistry andPhysics,vol.96,2006,p447‐453.
[7]. Edelstein, A.S.; Cammarata, R.C., “Nanomaterialssynthesis,propertiesandapplications”. InstituteofPhysics Publications, Bristol and PhiladelphiaPublishers,1996.
[8]. Mock, J.J.; Barbic, M., “Shape effects in plasmon resonance of individual colloidal silver nanoparticles”. J. Chem. Phys.,vol. 116, no.15, 2002, p 6755-6759.Duran,N.;Marcato,P.L.;Alves,O.L.,J.Nano‐biotechnology,vol.3,no.8,2005,p1‐7.
[9]. Duran, N.; Marcato, P.L.; Alves, O.L., “Mechanistic aspects of biosynthesis of silver nanoparticles by several Fusariumoxysporum strains”. J. Nano‐biotechnology, vol. 3, no.8, 2005, p 1‐7.
[10]. Maillard, M.; Giorgo, S.; Pileni, M.P., “Silver Nano Disks”. Adv. Mater, vol. 14, no.15, 2002, p 1084‐1086.
[11]. Tang, Z.; Liu, S.; Dong, S.; Wang, E.,“ElectrochemicalsynthesisofAgnanoparticlesonfunctional carbon surfaces”. Journal of ElectroanalyticalChemistry,vol.502,2001,p146‐151.
[12]. Mazur,M.,“Electrochemicallypreparedsilvernano‐flakes and nano‐wires”. ElectrochemistryCommunications,vol.6,2004,p400‐403.
[13]. Zhu, J.; Zhu, X.; Wang, Y., “Electrochemical synthesis and fluorescence spectrum properties of silver nanospheres”. Microelectronic Engineering,vol.77, 2005, p 58..
[14]. Kim, Y.H.; Lee, D.K.; Kang, Y.S., “Colloids andSurfaces, Physicochemical and EngineeringAspects”.vol.273,2005,p257–258.
[15]. Bae,C.H.;Nam,S.H.;Park,S.M.,“Formationofsilvernanoparticlesby laserablationofasilvertarget inNaCl solution”. Applied Surface Science, vol.197–198,2002,p628‐634.
[16]. Patel, K.; Kapoor, S.; Dave, D.P.; Mukherjee, T.,“Synthesis of nano‐sized silver colloids bymicrowave dielectric heating”. J. Chem. Sci, vol.117,no.4,2007,p311‐315.
[17]. Zhang, J.; Chen, P.; Sun, C.; Hu, X., “SonochemicalSynthesisofColloidalSilverCatalysts forReductionof Complexing Silver in DTR System”. AppliedCatalysisA.,vol.266,2004,p49.
[18]. Chaudhari, V.R.; Haram, S.K.; Kulshreshtha, S.K., “Micelle assisted morphological evolution of silver nanoparticles”. Colloids and Surfaces A., vol.301, 2007, p 475‐480.
[19]. Pal, A.; Shah, S.; Devi, S., “Synthesis of Au, Ag and Au–Ag alloy nanoparticles in aqueous polymer solution”. Colloids and Surfaces A., vol. 302, 2007, p 51‐57..
[20]. Chen, Z.; Gao, L., “A facile and novelway for thesynthesis of nearly mono disperse silvernanoparticles”. Materials Research Bulletin, vol.42,2007,p1657‐1661.
[21]. Kumar, A.; Joshi, H.; Pasricha, R.; Mandale, A.B.; Sastry M., “Phase transfer of silver nanoparticles from aqueous to organic solutions using fatty amine molecules”.Journal of Colloid and Interface Science, vol. 264, 2003, p396.
[22]. Kittler, S.; Greulich, C.; Diendorf, J.; Epple, M.,“Toxicity of Silver Nanoparticles Increases duringStorageBecauseofSlowDissolutionunderReleaseofSilverIons”.Chem.Mater,2010,vol.22,p4548–4554.
[23]. Mubark Ali D.; Sasikala, M.; Gunasekaran, M.,“Biosynthesis and characterization of silvernanoparticles using marine Cyanobacterium,oscillatoria willei, NTDM01”. Digest Journal ofNanomaterials and Biostructures, vol. 6, no. 2,2011,p385‐390.
[24]. Chug, R.; Mathur, S., “Extracellular PolymericSubstances from Cyanobacteria: Characteristics,Isolation and Biotechnological Applications‐AReview”. International Journal of Advances inEngineering,ScienceandTechnology(IJAEST)vol.3,no.2,2013,p49‐53.
[25]. Augustine, R.; Rajarathinam, K., (2011)DepartmentofBioengineering,VHNSNCollege,VirudhunagarTamilNadu.
[26]. Basavarajudapudi; Naik, P.K., “Synthesis andCharacterizationofSilverNanoparticles”.IJPBSvol.2,no.3,2012p10‐14.
[27]. Lee, J.; Lee, H.J.; Wark, A.W., “Nanoparticleenhanced surface Plasmon resonance detection ofproteins at attomolar concentrations”. Anal Chemvol.84,2012,p1702‐1707.
[28]. Ray, P.C., “Sizeand shapedependent secondordernonlinear optical properties of nanomaterials andtheir application in biological and chemicalsensing”.ChemRev,vol.110,2010,p5332‐5365.
[29]. Hartland,G.V.,“Opticalstudiesofdynamicsinnoblemetalnanostructures”.ChemRev,vol.11,2011,p3858‐3887.
[30]. Guzmán,M.G.;Dille,J.;Godet,S.,“Synthesisofsilvernanoparticles by chemical reduction method andtheir antibacterial activity”. World Academy ofScience,EngineeringandTechnology,vol.2,2008.
[31]. Purves et al.,Life: The Science of Biology 4thEdition.
[32]. Ahmad,A.;Mukherjee,P.;Senapati,S.;Mandal,D.;Khan, M.I.; Kumar, R.; Sastry, M., “ExtracellularbiosynthesisofsilvernanoparticlesusingthefungusFusarium oxysporum”. Colloids Surfaces B:Biointerfaces,vol.27,2003,p313‐318.
[33]. Jayashree J.; Pradhana, N.; Prasad Dashb, B.;Kumar P., “Biosynthesis and characterization ofsilvernanoparticlesusingmicroalga chlorococcumhumicola and its antibacterial activity”.International Journal of Nanomaterials andBiostructures,vol.3no.1,2013,p1‐8.
Volume 3 Issue 3: 2015 Volume 3 Issue 4: 2015
www.ijset.in ISSN (O): 2348-4098 ISSN (P): 2395-4752
International Journal of Science, Engineering and Technology Page 98

[34]. Shaligram, S.N.; Bule, M.; Bhambure, R.; Singhal,S.R.;Singh,K.;Szakacs,S.;Pandey,A.,“Biosynthesisof silvernanoparticlesusingaqueous extract fromthecompactingproducingfungi”.ProcessBiochem,vol.44,2003,p939–943.
[35]. Metuku,R.P.;Pabba,S.;Burra,S.;Gudikandula,K.;“Biosynthesis of silver nanoparticles fromSchizophyllum radiatum HE 863742.1: theircharacterization and antimicrobial activity”. J.Biotech,vol.4,2014,p227–234.
[36]. Metuku,R.P.;Pabba,S.;Burra,S.;Gudikandula,K.;“Biosynthesis of silver nanoparticles fromSchizophyllum radiatum HE 863742.1: theircharacterization and antimicrobial activity”. J.Biotech,vol.4,2014,p227–234.
[37]. Jenaa, J.; Pradhana, N.; Dashb, B.P.; Suklaa, L.B.;Pand, P.K., “Biosynthesis and characterization ofsilvernanoparticlesusingmicroalga chlorococcumhumicola and its antibacterial activity”International Journal of Nanomaterials and Biostructuresvol.3(1),2013,p1‐8.
[38]. Prabhu, S.;Poulose, E.K., “Silver nanoparticles:mechanism of antimicrobial action, synthesis,medical applications, and toxicity effects”.InternationalNanoLetters,2012.
[39]. Metuku,R.P.;Pabba,S.;Burra,S.;Gudikandula,K.;(2014) “Biosynthesis of silver nanoparticles fromSchizophyllum radiatum HE 863742.1: theircharacterization and antimicrobial activity”. J.Biotech,vol.4,2014,p227–234.
Volume 3 Issue 3: 2015 Volume 3 Issue 4: 2015
www.ijset.in ISSN (O): 2348-4098 ISSN (P): 2395-4752
International Journal of Science, Engineering and Technology Page 99


![[XLS]poddarpigmentsltd.compoddarpigmentsltd.com/pdf/MCA-2010-2011-FNL.xls · Web viewChhindwara Zunheboto Ganjam Kapurthala Churu Krishnagiri Malda ARMENIA Mahbubnagar Tirap Kamrup](https://img.pdfslide.net/doc/110x75/5ab13a947f8b9a7e1d8c27e7/xls-viewchhindwara-zunheboto-ganjam-kapurthala-churu-krishnagiri-malda-armenia.jpg)
![Untitled-2 [ ] · PDF fileNOIDA Greater Noida West Noida Golf ... .99. GH-04 A SECTOR ... The Group is having Group Housing Projects & Integrated Township spread over 125 Acres of](https://img.pdfslide.net/doc/110x75/5aa560aa7f8b9a1d728d10ff/untitled-2-greater-noida-west-noida-golf-99-gh-04-a-sector-the-group.jpg)


![[XLS] · Web viewChittorgarh Karur Balarampur ARGENTINA Kurnool Tawang Jorhat Gopalganj Koriya Kachchh Kurukshetra Solan Pulwama Jamtara Chitradurga Pathanamthitta Chhindwara Zunheboto](https://img.pdfslide.net/doc/110x75/5add97bb7f8b9ae1408d310d/xls-viewchittorgarh-karur-balarampur-argentina-kurnool-tawang-jorhat-gopalganj.jpg)