Embed Size (px)
Citation preview

154
International workshop on “Environmental Problem and Its Possible Mitigation for Sustainable Development”
In collaboration with the following projects.1. Kyoto University SPIRITS Program: Mitigation Cyclone and Flood Damages in My-
anmar: Applying the Bangladesh’s Successful Experience” 2. ISS Hoga Project: Action research on knowledge from experience and its practical use
about disaster prevention and mitigation for natural disaster in Bangladesh: Application of Sustainability Science to Area Studies
3. Program of Collaborative Research on Transitional Justice and Inclusive Economic Development in Developing ASEAN Countries
4. Challenging Exploratory Research Project of “Study of a Site-Specific Rural Develop-ment Model through Alternative Zaichi (existing locally) Cultural Formation”
Date: Febuary 6, 2016Time: 10:30-12:30Place: Tonantei, Inamori Building 2F
Aim of the Workshop:Recent Situation of Agriculture and Rural Development in the developing coun-tries such as Myanmar, Bangladesh, Bhutan have changed much in accordance with the socio-cultural impact of economic globalization, excessive modernization in Agriculture with paying less regard to the ecology and climate change etc beyond the common sense in last two decades, such as depopulation, abandoning farming, artificial salinity problem in agriculture, super cyclone & flood etc. To realize miti-gation for sustainable development in Agriculture and rural development in future, the countries facing these problems are to exchange their experience possibly so that the alternative ways for overcoming the problem can be considered. This small workshop is planned to fulfill this aim by connecting the several different projects implemented by the department of practice-oriented area studies, CSEAS, Kyoto University.

155
workshop Program
10:30-10:35 Opening remarks by Kazuo Ando (CSEAS)10:35-10:55 Natural Hazards Induced Salt- affected Soils for Rice Produc-
tion in Myanmar by Soe Soe Thein (Yezin Agricultural University, Myanmar)10:55-11:15 The Characteristics and Role of Homestead in Bangladesh by Keiko Yoshino (Tokyo University of Agriculture)11:15-11:35 Rural Development in Bhutan: a Case Study of Chokhortoe
Village by Jime Norbu (Sherubtse College, Bhutan) 11:35-11:55 How to apply action research for mutual learning to research
and higher education by inter-connection among Myanmar, Bangladesh, Bhutan and Japan
by Kazuo Ando (CSEAS)11:55-12:25 General Discussion ( with reference of the PRA of Bhutan
Sherubtse College Team in Japan from Jan.26 to Feb.7, 2015) Comment by Haruo Uchida (CSEAS), Yoshio Akamatsu
(CSEAS)12:25-12:30 Concluding Remarks by Kazuo Ando (CSEAS) 12:30- 13:30 Lunch Gathering (Lunch Box)

Paper Collection of Unknown Contemporary Issues for Sustainable Environmental and Rural Development in
Myanmar: Highlighting Collaboration with Bangladesh, Bhutan and Japan
Department of Practice-oriented Area Studies, Center for Southeast Asian Studies (CSEAS), Kyoto University
in collaboration withSEAMEO Regional Centre for History and Tradition (SEAMEO-CHAT)
Yezin Agricultural University (YAU)Postgraduate School of Agriculture, Kyoto University
Practice-oriented Area Studies Series No.9
Edited by Kazuo Ando, Khin Lay Swe and Mamoru Kanzaki

The Practice-oriented Area Studies aim at the alternative Area Studies to establish the consciousness of “ZAICHI” (Locally existing) in the researchers’ mind and at-titude by mutual enlightenment to collaborate with the local people conducting their “Practice” in their living areas. The Practice-oriented Area Studies Series are to pub-lish the research outcome on the basis of these researchers’ consciousness.
Kazuo AndoCoordinator, Practice-oriented Area Studies Series
First EditionMarch 2016150 copiesCopyright@editors
All rights reserved. No part of this publication may be reproduced, stored in a re-trieval system, or transmitted in any form or by any means – electronic, mechanical, photocopying, recording or otherwise, without the prior written permission from the editors. For information address Department of Practice-oriented Area Studies, CSEAS, Kyoto University, 46 Yoshida-Shimoadachi- Cho, Sakyo-ku, Kyoto, 606-8501, Japan (E-mail: [email protected])
Published by Department of Practice-oriented Area Studies, Center forSoutheast Asian Studies (CSEAS), Kyoto Universityin collaboration with SEAMEO Regional Centre for History and Tradition(SEAMEO-CHAT),Yezin Agricultural University (YAU), Postgraduate Schoolof Agriculture, Kyoto University
Edited in Collaboration with Lekhapora Editing
Printed by Tanaka Printing
Cover design by Lekhapora EditingCover photo: Traditional bullock cart in central Myanmar (Photo by Kazuo Ando, December 20, 2015)
ISBN 978-4-906332-34-2

Paper Collection of Unknown Contemporary Issues for Sustainable Environmental and Rural Development in
Myanmar: Highlighting Collaboration with Bangladesh, Bhutan and Japan
Edited by Kazuo Ando, Khin Lay Swe and Mamoru Kanzaki
Department of Practice-oriented Area Studies, Center for Southeast Asian Studies (CSEAS), Kyoto University
in collaboration withSEAMEO Regional Centre for History and Tradition (SEAMEO-CHAT)
Yezin Agricultural University (YAU)Postgraduate School of Agriculture, Kyoto University
Practice-oriented Area Studies Series No.9

2
Dedicated to the memory of Professor Yoshikazu Takaya

3
Editors’ Note and Acknowledgement
This publication is the academic paper collection from the presentations at a series of the workshops held between April, 2014 and Feburary, 2016, concerning sustainable agricultural and rural development as well as environmental resource management in collaboration with the following programs;
1. Kyoto University Program: Promotion of International Collaboration on Bi-oresources Management in Myanmar (PICBiRMa)
2. Kyoto University SPIRITS Program: Mitigation Cyclone and Flood Damages in Myanmar: Applying the Bangladesh’s Successful Experience
3. Kyoto University ISS HOGA Project: Action research on knowledge from experience and its practical use about disaster prevention and mitigation for natural disaster in Bangladesh: Application of Sustainability Science to Area Studies
4. Program of Collaborative Research on Transitional Justice and Inclusive Eco-nomic Development in Developing ASEAN Countries
5. KAKEN Challenging Exploratory Research Project: Study of a Site-Specific Rural Development Model through Alternative ZAICHI (existing locally) Cultural Formation
A series of the workshop has been planned in relation to the resent situation of Agriculture and Rural Development in the developing countries such as Myanmar, Bangladesh and Bhutan, which have rapidly changed because of the socio-cultural impact of economic globalization, excessive modernization in agriculture, forestry, fishery and rural development with paying less regard to the ecology and climate change etc., occurring beyond the common sense in last two decades. The impact has appeared as phenomenon of depopulation, abandoning farming, artificial salin-ity problem in agriculture and damage by natural disaster e.g. super cyclone, flood earthquake etc. The papers related to Myanmar in this publication are commonly not familiar to both people outside as well as inside the country because the facts reported by the papers have been limitedly recognized by local people, even at the present. The other facts related to Bangladesh, Bhutan and Japan are also not famil-iar to the people outside each country. To realize sustainable environmental and rural development in the future, the countries facing these problems are to exchange their experience possibly in order to find an alternative way for overcoming the problem. Challenging this collaborated effort, the essential first step is to share the facts in each country. A series of the workshops were held to meet this objective and make strong network among the participants. The necessity of academic collaboration

4
among Myanmar, Bangladesh, Bhutan and Japan is also discussed in this publica-tion.We fondly hope that this publication is to meet interest of the people engaged in the area studies on Myanmar in particular as well as the studies of environmental and rural development.
This editorial note was written during my field work in Bhutan from March 4 to March 15, 2016. In the early morning of March 15, when I was preparing my be-longings for the departure from Paro international airport at 11:00, the shock news reached me. Dr. Yosshikazu Takaya, professor emeritus of Kyoto University, sud-denly passed away in the hotel during his field work in India on March 11, 2016. He is a devoted teacher and a field worker of the area studies. He is really a pioneer to seek the area studies as a discipline. He completed Ph.D in geology of the postgrad-uate school of sciences of Kyoto University and started his career of a professional scholar since the inception of Center for Southeast Asian Studies, Kyoto University in 1960s. I has been fully guided by him from my student time in the postgraduate school of agriculture, Kyoto university to the present. The concept and methodology of my area studies as a field worker must owe to Prof. Takaya. Personally, I would like to dedicate this publication in memory to Professor Yoshikazu Takaya who is being loved and respected by me as well as the students, teachers and scholars working in the area studies, Kyoto University.
We are thankful to SEAMEO-CHAT, Yezin Agricultural University, Yangon Uni-versity and Kyoto University as well as the belonging organizations of the workshop participants, especially, the contributors of this publication for their kind coopera-tion. At the last but not least, we would like to acknowledge ISS, Kyoto University for financial support, Mr. Rokib Uddin Ahmed, Rubi Enterprise for English proof-reading and Ms. Yuki Onodera, LEKHAPORA for assistance to editorial work. The papers would not have been published without their kind cooperation.
Each paper has been reviewed and revised according to the comments through each workshop. However, the opinion and statement of the papers owe to responsibility of the authors themselves and are not presented of the belonging organization of the authors. Therefore, the editorial work is done only for minimum correction.
March 30, 2016.
Kazuo Ando, on behalf of editorial board

5
Members of Editorial Board:Kazuo Ando Associate Professor, Head of Practice-oriented Area Studies,
CSEAS, Kyoto University, JapanKhin Lay Swe Executive Member, ECCDI (and FREDA (Forest Resource
Environment Development)) and Conservation Association, ex Pro-Rector, YAU (Yezin Agricultural University), Myan-mar
Mamoru Kanzaki Professor, Postgraduate School of Agriculture, Kyoto Univer-sity, Japan

6
Editor’s Note and AcknowledgementKazuo Ando ……………………………………………………………………………3
Learning from CHAT toward overcoming the environmental and developmental problems of global modernismKazuo Ando ……………………………………………………………………………9
Coastal Salinity in Ayeyarwady Region, Myanmar: A case study of the salinity impact on rice production in Pyapon Township, Ayeyar-wady RegionKhin Lay Swe and Kazuo Ando ……………………………………………………… 15
Natural Hazards Induced Salt-affected Soils for Rice Production in MyanmarSoe Soe Thein ………………………………………………………………………… 27
Nutrient Management for Rice Production in MyanmarAung Naing Oo, Theingi Khaung and Soe Soe Thein ……………………………… 37
Impact of Flood on Agricultural Production in Seikphyu Township, Magwe RegionNyein Nyein Htwe, Mya Yadana Tun, Khin Oo ……………………………………… 47
Sustaining Community and Forest Development through Community Forest Enterprise - A Case Study in Southern Shan StateLwin Lwin Naing …………………………………………………………………… 57
Rural Urban Migration in Ayeyarwady Region:A Case Study of Ah Mar Sub-township, Phyapon DistrictMyint Thida ………………………………………………………………………… 65
Contents

7
Study on Agricultural Labor Migration of Selected Farm Households in Kyaukpadaung Township, Dry Zone, MyanmarNandar Aye Chan, Theingi Myint …………………………………………………… 75
Study on Postharvest Handling Practices of Cabbage and Cauliflower in Selected Areas of MyanmarT.T.Soe, T.D.Hnin, Y.Y. Soe, N.N. Htwe, K.T.D.Myint and T.O.Win ……………… 91
Pharmaceutical Ethnobotany Survey of Anticancer Plant Resources from The Hlawgar Wildlife Park, Yangon Region, Myan-marKhin Thantsin, San San Aye, Khin Thandar Win ……………………………………103
Soybean Crop Improvement in Hilly Region of MyanmarMar Mar Win, Myat Nwe Nwe and Tun Shwe ………………………………………111
Traditional Homestead Management in Floodplain BangladeshKeiko Yoshino …………………………………………………………………………119
Workshop on reduction of severe wind damages in BangladeshYusuke Yamane ………………………………………………………………………131
Rural Development in Bhutan: A case study of Chokhortoe VillageJigme Norbu …………………………………………………………………………135
Transition of Man-made Landscape and Contemporary Problems of Mountainous villages in JapanYoshio Akamatsu ……………………………………………………………………141
Potential and Necessity of Establishment of Strong Academic Col-laboration among Myanmar, Bangladesh, Bhutan and Japan for Research and Higher EducationKazuo Ando …………………………………………………………………………147
Workshop Program …………………………………………………………………154Index (List of Key Words) …………………………………………………………158


9
Learning from CHAT toward overcoming the environmental and developmental problems of global modernism
Kazuo AndoHead (Associate Professor) Department of Practice-oriented Area Studies
Center for Southeast Asian Studies, Kyoto UniversityE-mail:[email protected]
ABSTRACTThis paper was originally presented as Key Note Speech of the workshop held at SEAMEO-CHAT on Dec. 23, 2016. The aim of the workshop is to highlight the environmental related problems occurred with the over mod-ernization by recent globalization in the world, particularly, to achieve the rapid economic development. To improve this development problem, the alternative way of development by culture, history and tradition is to quick-en the process besides the current globalization. The role of the SEAMEO-CHAT gets more and more important to derive the sustainable agriculture and rural development in Myanmar. This paper aims at explaining the ne-cessity of the additional alternative development way by referring to the recent field observation in Myanmar and Bangladesh.
Key Words: Alternative Development, SEAMEO-CHAT, Salinity Prob-lem, Global modernism
ACKNowLEDgEMENtGood morning. Mengaraba. Ladies and Gentleman. Thank you for participating in this workshop.
Special thanks to the SEAMEO-CHAT, YAU and CSEAS to support to organize this workshop. This workshop can be held financially by the cooperation from the following projects such as Kyoto University Program “Promotion of Inter-national Collaboration on Bioresources Management in Myanmar (PICBiRMa)” (headed by Prof.Kanzaki) and “Mitigating Cyclone and Flood Damages in Myan-mar: Applying the Bangladesh’s Successful Experiences” (headed by Ando).

10 Kazuo Ando
two SIMILAR LANDSCAPES IN MyANMAR AND BANgLADESHI would like to deliver my key note speech with the slides, which I am in posses-sion just on Dec. 20, 2015 in Htein Kan Gyi village, Pwe Lone Kyan Village Tract, Myithha Township, Kyaukse District, Mandalay Region and in one village of Sat-kira Upozila, Bangladesh on Jan 11-25, 2012.
The landscapes of both villages are very similar. Htein Kan Gyi Village is seriously affected by salt damage in Mandalay. The village of Satkira Upazila was at-tacked by the high tide of the cyclone Aira and its impact has continued even at the present. In both villages, the big trees in homestead are drying up and abandoned rice fields have spread due to high sallity of soil.
QUEStIoN HAS RAISED: wHy HAVE tHESE PRoBLEMS oC-CURRED? In the village of Satkira, the high tide of Aira Cyclone invaded into inside of the polder due to break of the embankment. In another hand, in the village of Htein Kan Gyi, double irrigated rice cultivation begins and it has accumurated salinity in
Photo1: Htein Kan Village, Myanmar (Dec. 20, 2015)
Photo3: Landscape of the polder in the village in Satkira Upozila, Bangladesh. Staff of FREDA & ECCDI were seen ( Jan., 2012 ).
Photo2: the village of Satkira Upozila, Bangladesh ( Jan., 2012)

11Learning from CHAT
the surface.The polder with embankment is very useful for protecting life and property
of the local people, but it is not essentially to cropping in the coastal area. Before establishing the polder, the dominant cropping pattern of the village was traditional single rice cropping or Transplanting Aman rice cultivation in rainy season, some-time following by rabi crops (Rahman 2015). It is believed that the Aman rice va-riety cultivated outside the polder at the present has strong salinity tolerance. The landscape of this cropping pattern is shown in the photo 3. However, this cropping pattern gets converted into prawn production area. Prawn is considered as “a cash crop”. The polders may be much essential to this cropping systems, because the fact of invasion of tide may illustrate that height and strength of embankment was not enough for protecting the high tide of the big cyclone such as Aira. It may be noticed that tidal water easily flow out without being block of the broken embankment.
In the village of Htein Kan Gyi, the new big dam namely Kinda dam has started to irrigate this area since 1990 (Photo 4). The villagers have also started double irrigated rice cropping pattern since the same year. The methodology is 6 days continuation of irrigation and 3 days stop irrigation through network of the gravity irrigation cannels. After five years arround, the salinity problem has occured in the village. Approximately, the villagers now abandoned the 30 % of the total cultivated area of own cultivated area. The village head has informed us that there is only 1000 acre of single monsoon rice cropping in the village and no summer rice cropping. However, he also informed us that before Kinda dam irrigation the ancient dam made by the King of Anawarata (1044-1077) had irrigated the rice fileds in
Photo4: Kinda dam (Khin and Ando 2015)

12 Kazuo Ando
the village only for a single monsoon rice crop. The irrigation method was different from that of the present. The kinda dam system has good network of main and sub-irrigation and drainage canal sytems, but the ancient system is just to follow down from a plot to plot continuously.
The villages are well familiar to the danger level of salinity to rice cultivation, which is that the weed local name Myatrao, family Cyperaceae similar to Schoeno-plectus lineolatus (Franch. et Sav.) T. Koyama. This weed has appeared after three years of continuous irrigation in the salinity filed. However, if the drainage would be improved in the salinity filed, the weed of the filed has changed from Myatrao to Myaka or the weed of family Poaceae. In the field of Myaka, the rice such as the va-riety of Manawtka can grow. However, it is considered that it is still risky. Therefore, some villagers have already abandoned the rice field nearly 20 years ago and even sold out the fields.
In the villages of Hatiya island located in the costal area of Bangldesh, the villagers know well improvement of the tide affected field to be suitable for rice cultivation by judging the weed species changed from Uri to Dubla. According to
Photo5: Myatrao
Photo7: Abandoned Rice Field in Htein Kan Gyi Village. The White portion is salt.
Photo6: Myatrao

13Learning from CHAT
this judgment, they have started the reclamation of rice field in the tidal area with-out construction of embankment, with salanity tolerant traditional variety namely Rajazhail (meaning of King of rice).
These facts illustrated by the villagers are well indicating the alternative way to overcome the environmental and developmental problems induced by the global modernity of the technologies which the human being has believed to bring us to the convenient world. In the field of rural development, it becomes, at the present, common sense among the experts, scholars and some villagers facing the problems that the way to overcome the problem is to think and find the alternative way based on the traditional way. This alternative way has well location specific, cultural specific and surely historic specific. The science cannot sustain the development without careful concern of the CHAT (cultural, history and tradition).
RESPoNSIBILIty oF SEAMEo-CHAtWhy do we hold this workshop in the SEAMEO-CHAT? I would like to request the SEAMEO-CHAT to take the challenging role of changing the paradigm of development in strong collaboration with field oriented science such as agriculture, geography, meteorology etc. particularly of Yezin Agricultural University, Yangon University, Yangon engineering University, NGOs like ECCDI and FREDA etc. The Myanmar can find the Myanmar way of development to overcome the problems surely created by the global modernism surrounding the countries with the rapid economic development. The responsibility of the SEAMEO-CHAT is appreciable for the contemporary Myanmar.
Thank you for your patient hearing. Chezetibare.
Photo8: Uri gash in Hatiya Island Photo9: Du Uri gash in Hatiya Island

14 Kazuo Ando
REFERENCESKhin Lay Swe and Kazuo Ando 2015 Inland Salinity Problems in Myanmar:
Case study in dry zone, Mandalay Region, presentation at The 25thAnnual Meeting of the Japan Society of Tropical Ecology ( JASTE25) in Inamori Foundation Memorial Hall, Kyoto Univ. 21 June 2015.
Rahman, Md.Rashedur 2015 Shrimp Based Rice Cropping System in the Coast-al Area of Bangladesh: An Approach to Area Studies, Practice-oriented Area Studies Series No.7, Rubi Enterprise and Lekhapora Editing, Dhaka:45-69.

15
Coastal Salinity in Ayeyarwady Region, Myanmar: A case study of the salinity impact on rice production in Pyapon
Township, Ayeyarwady Region
Khin Lay Swe1 and Kazuo Ando2
1. Forest Resource Environment Development and Conservation Association (FREDA), Yangon ([email protected])
2. Center for Southeast Asian Studies (CSEAS), Kyoto University, Japan ([email protected])
ABSTRACTAyeyarwady Region has been experiencing salinity due to more frequency and intensity of coastal flooding, particularly after the Cyclone Nargis in 2008. The salinity impact on rice production is expected to be exacerbated by climate change and improper cropping system. Double rice cropping in coastal areas for consecutive years renders the soil more affected by salinity. Main contributors to low rice yields are soil salinity and low input technol-ogy. Regarding with farmers’ concept on the constraints in rice production, survey results show that rice productions of 95% of respondent households were decreasing during the last three years while 85% were facing with salinity problem. A high tide in October, 2014 severely damaged 27.5% of respondents and 10% had zero harvest. As traditional adaptation strategies, farmers practice early sowing, use of low inputs and multiple salt tolerant varieties, and building embankments. These strategies are no longer ef-fective under extreme climate variability these days and rice production is unproductive. Nypa thatch making, fishery, home garden, Community Forestry, livestock raising and are potential livelihood opportunities and needed to be improved.
Key Words: salt affected soil, climate change, adaptation strategies, farmer’s concept, Nypa thatch
INtRoDUCtIoNMyanmar stands as an agrarian country with its rich natural resources favorable for agricultural production for centuries. However, crop production is constrained by various natural and anthropological influences these days; and salinity becomes a detrimental problem to crop production. Due to its topographical nature, Myanmar has a considerable extent of inland salinity in central Myanmar and coastal salinity in
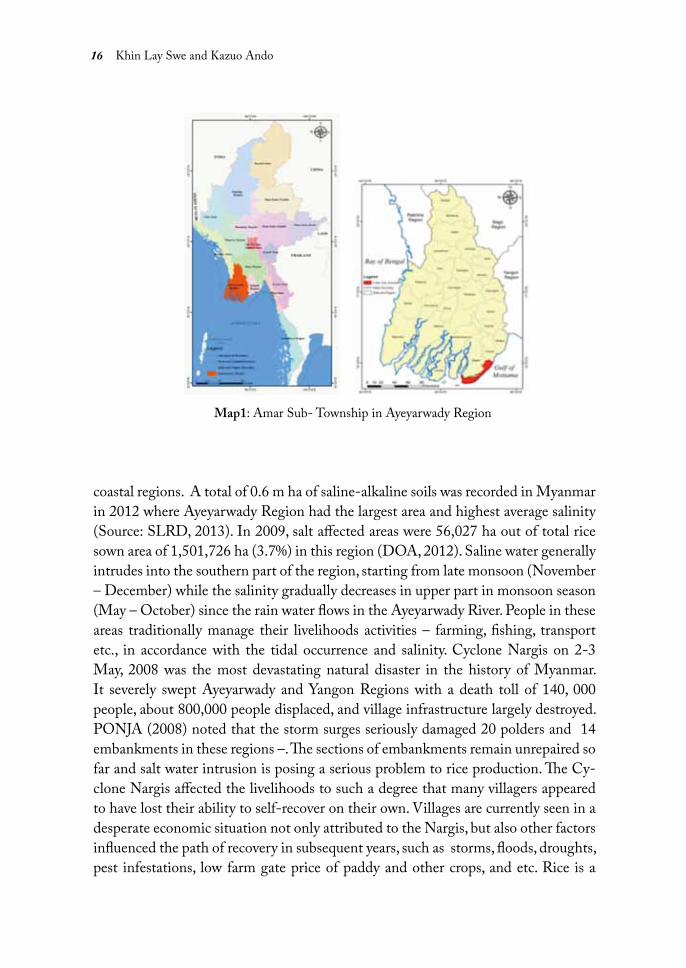
16 Khin Lay Swe and Kazuo Ando
coastal regions. A total of 0.6 m ha of saline-alkaline soils was recorded in Myanmar in 2012 where Ayeyarwady Region had the largest area and highest average salinity (Source: SLRD, 2013). In 2009, salt affected areas were 56,027 ha out of total rice sown area of 1,501,726 ha (3.7%) in this region (DOA, 2012). Saline water generally intrudes into the southern part of the region, starting from late monsoon (November – December) while the salinity gradually decreases in upper part in monsoon season (May – October) since the rain water flows in the Ayeyarwady River. People in these areas traditionally manage their livelihoods activities – farming, fishing, transport etc., in accordance with the tidal occurrence and salinity. Cyclone Nargis on 2-3 May, 2008 was the most devastating natural disaster in the history of Myanmar. It severely swept Ayeyarwady and Yangon Regions with a death toll of 140, 000 people, about 800,000 people displaced, and village infrastructure largely destroyed. PONJA (2008) noted that the storm surges seriously damaged 20 polders and 14 embankments in these regions –. The sections of embankments remain unrepaired so far and salt water intrusion is posing a serious problem to rice production. The Cy-clone Nargis affected the livelihoods to such a degree that many villagers appeared to have lost their ability to self-recover on their own. Villages are currently seen in a desperate economic situation not only attributed to the Nargis, but also other factors influenced the path of recovery in subsequent years, such as storms, floods, droughts, pest infestations, low farm gate price of paddy and other crops, and etc. Rice is a
Map1: Amar Sub- Township in Ayeyarwady Region

17Coastal Salinity in Ayeyarwady Region, Myanmar:
sensitive plant to salinity, particularly in the early growth; an average seasonal salin-ity in excess of 1.9 dS/m reduces the yields (Lam 2014). Very few researches on the harmful effects of salinity on rice production have been conducted in Myanmar; the survey research, therefore, was carried out with the following objectives – To study the salinity impact on rice production and farmers’ adaptation strategies and their livelihood opportunities in Pyapon Township, Ayeyarwady Region.
MEtHoDoLogyIn 2012 and 2015, field observation and surveys were conducted in five villages in Ah Mar Sub-Township, Pyapon Township, namely, Auk Seik Kwin, Seik Ma village, Oke Hpo, Tei Pin Seik, and War Kone villages. “Focus Group Discussions (FGD)” was done in each study village. Secondary data were collected, mainly from Depart-ment of Agriculture (DOA) and General Affairs Department in Pyapon Township. A total of 80 households (25% of the total HH) were interviewed in Oke Hpo vil-lage with semi-structured questionnaires. The information gathered were details of socio-economic situation, rice cultivation practices, strategies to fight against the salinity problem and etc. Emphasis were given on the weather status, land use and cropping patterns, impact of salinity, and farmers’ concept on the constraints in rice production.
Map2: Soil Map of Ayeyarwady Region(Source: Land Use Division, MOAI, 2002)

18 Khin Lay Swe and Kazuo Ando
RESULtS AND DISCUSSIoNStudy Site: As described in the Map 1, “Mangrove Forest Soils” are observed in the coastal area. Mangrove Forest (Thionic Fluvisols) soils and Saline Swampy Meadow Gley (Gley - Gleysol) soils occur in Ayeyarwady Delta (LUD, 2002). Pyapon Town-ship is situated at N 15º15’ -16º25’ and E 90º30’ – 95º45’ with the area of 587.33 square miles, and average 14 feet above sea level. There exists a vast land of fertile soil with optimum loam and pH value of 4.5 - 6.0, and the soil type is generally classified as clay soil, locally known as “Le-myay-pyar”. Fresh water, brackish water and saline water intrusion areas in this township in 2011 was 49,845 ac, 28,245 ac and 126,728 ac, respectively. Total salt affected rice area was recorded as 14,990 ac in 2011 (Source: DOA, Pyapon Township). It was observed that water salinity is high during dry season, high tide and the area near the sea. The salinity level of rivers declines to its lowest level during the rainy season and it increases gradually towards the sea during the dry season (Kogo 1993).
Land Use type: The Ah Mar Sub-Township listed orchard land (home gardens) of 155 ac and Nypa lands of 38 ac (Table 1). Pasture lands were 2,167 ac for cattle breeding. Forty-four percent (26,462 ac) of total rice lands were recorded as officially registered while 56% (33,365 ac) were unregistered lands. The “Unregistered land” means that the farmers who work on those lands have not been officially regis-tered as “farm households” by the Settlement and Land Record Department. Under the government’s mandate of “increased rice production throughout the country in 1990s, Ayeyarwady delta was no exception. Rice fields were extended both in reserved and non-reserved mangrove forest areas, and many lands remained unreg-istered. Tei Pin Seik Village Tract (Oke Hpo, Tei Pin Seik and War Kone villages) had the largest areas of total rice land (24,863 ac) of which 98% were unregistered (24,382 ac) in 2014.
Among the total registered rice area of 26,464 ac, 8.1% (2,184 ac) were salt affected soils. In other words, 681 farmers (18.2 %) with official registered land had the salt affected soils (Table 2). Even though the areas of unregistered lands are much larger than the registered, the salt affected rice areas have not yet recorded un-der this category. These areas are generally undeveloped and poorly accessible to the towns. Moreover, due to the nearness to the sea and high salinity, rice yields are very low; most rice fields have neither been registered nor recognized by the government.
A Super Syclone in 2014: Based on the FGD in all study villages, the impact of a “super cyclone” on rice production in 2014 and farmers’ coping strategies to salinity problem were recorded. On 12 October, 2014 a severe cyclone “Hudhud” hit the Odisa Coast of India with winds of almost 200 km/h; under this effect, an extraor-

19Coastal Salinity in Ayeyarwady Region, Myanmar:
dinarily high tide devastated a large part of the Ayeyarwady Region (Source: The Global New Light of Myanmar” 13 October, 2014). This “Super tide” (named by the villagers), which was much stronger than the normal ones, overflowed into the study villages and rice fields. It began from 9 –10 –11 October; inundation lasted about a week. It is a common phenomenon in this region that ordinary high tides occur in October – November, and considerable rains followed soon after each high tide. However, there was no or very few rains after this “Super tide” so that salts brought by the tide were not drained and washed away. As a consequence, it ruined rice plants and severely damaged the production. Auk Seik Kwin village (Bawa Thit Village Tract) was the worst affected in the Sub-township. Photo 1 taken in April,
Sr. Village tract Total rice area(Registered) (ac)
Total number of farmers
Salt affected area (ac)
No. of farmers with salt affected
area (ac)1 Boe Ba Kone 880 340 313 1462 Nauk Mee 1266 239 279 283 Seik Ma 1636 1176 496 1884 Tei Pin Seik 481 312 181 475 Ba Wa Thit 863 501 327 1856 Myo Kone 6712 334 75 47 Daw Nyein 3176 232 178 238 Kyaung Kone 1717 232 178 239 Day Da Lu 9731 368 120 37
Total 26,462 3,734 2147 6818.1% 18.2%
Source: DOA, Pharpon Township, 2014
Table2: Salt affected rice areas in Ah Mar Sub-Township, Pyapon Township in 2012
Village TractRice area
(Registered) (ac)
Orchard (ac)
Pasture (ac)
Others (ac)
Nypa (ac)
Rice area in forest (Unregis-
tered) (ac)Total (ac)
Ah Mar Sub Township 26,462 155 2167 620 38 33,365 62,807
Boe Ba Kone 880 - - - 13 3,752 4,645Nauk Mee 1266 - - 170 - 154 1,590Seik Ma 1636 98 35 9 14 553 2,345
Tei Pin Seik 481 - - - - 24,382 24,863Ba Wa Thit 863 - 56 - - 4,524 5,443Myo Kone 6712 - - - - - 6,712Daw Nyein 3176 - 832 - - - 4,008
Kyaung Kone 1717 39 - - 11 - 1,767Day Da Lu 9731 18 1244 441 - - 11,434
Source: Pyapon Township DOA, 2014
Table1: Land use type by village tract in Ah Mar Sub-Township, Pyapon Township in 2014

20 Khin Lay Swe and Kazuo Ando
2015 shows the debris and rubbles of rice plants after the “Super tide”in Auk Seik Kwin village. About 3,000 acres were damaged, and some 1,000 ac totally destroyed, among which 400 ac were registered lands (Source: DOA, Pyapon Township, 2015). No compensation, support or crop insurance system has not yet been available in Myanmar and farmers have to bear all the losses. As shown in Fig.1, post monsoon rains in 2014 were unevenly distributed. The rain-fall in October was the lowest value of 156 mm. Moreover, total rainy days was 125 days in 2014, fewer than the normal year. Few rainy days means that there will be long breaks in monsoon rains which, in turn, cause an increased salinity in rivers and tributaries of coastal zone. These facts agree with the farmers’ complaint that there were no rains in their villages soon after the “Super tide” in October, 2014; the salts
7
(Source: DOA, Pyapon Township, 2015). No compensation, support or crop insurance
system has not yet been available in Myanmar and farmers have to bear all the losses.
As shown in Fig.1, post monsoon rains in 2014 were unevenly distributed. The rainfall
in October was the lowest value of 156 mm. Moreover, total rainy days was 125 days
in 2014, fewer than the normal year. Few rainy days means that there will be long
breaks in monsoon rains which, in turn, cause an increased salinity in rivers and
tributaries of coastal zone. These facts agree with the farmers’ complaint that there were
no rains in their villages soon after the “Super tide” in October, 2014; the salts were not
diluted and washed away, harmful effect to rice plants to death.
Fig. 1 Weather Data of Pyapon Township in 2014 (Source: DOA, Pyapon Township, 2015)
Farmers’ coping strategies to salinity: Early sowing
Early sowing is a traditional adaptation strategy to avoid the salinity stress at rice plants’
early growth. When the salinity increases in tidal water starting in late monsoon
(November – December), the rice plants should reach at their maturity stage which can
resist the stress more than the earlier stages. Early arrival of monsoon with enough rains
is required to dilute the salts deposited in the fields in summer months. Farmers
experienced that rice seeds cannot germinate well and young plants die when there is no
0
200
400
600
800
1000
0 5
10 15 20 25 30 35 40
Jan Feb Mar Apr May Jun Jul Aug Sep Oct Nov Dec
Month Ra
infall mm
Degree
C/d
ay
Rainfall mm Max Temp Min Temp Rainy days
Figure1: Weather Data of Pyapon Township in 2014 (Source: DOA, Pyapon Township, 2015)
Photo1: Rice fields destroyed by 2014 Super tide (Auk Seik Kwin )

21Coastal Salinity in Ayeyarwady Region, Myanmar:
were not diluted and washed away, harmful effect to rice plants to death.
Farmers’ Coping Strategies to Salinity: Early SowingEarly sowing is a traditional adaptation strategy to avoid the salinity stress at rice plants’ early growth. When the salinity increases in tidal water starting in late mon-soon (November – December), the rice plants should reach their maturity stage which can resist the stress more than the earlier stages. Early arrival of monsoon with enough rains is required to dilute the salts deposited in the fields in summer months. Farmers experienced that rice seeds cannot germinate well and young plants die when there is no enough rain at the time sowing. In a good weather condition, farmers usually grow rice as early as possible in monsoon season in Waso waxing days of 3rd to 10th of Myanmar lunar calendar (Early June) and harvest not later than November. Due to late monsoon rains in 2014, farmers broadcast rice seeds at the end of Waso and Wakaung (late July or August). When an extraordinarily high tide occurred in early October, it corresponded with rice plants’ flowering stage, a very vulnerable stage to salinity and flood, causing more loss.
Low Input technologyPlanting rice seeds without any tillage operation is common in many areas of study villages. All farmers use broadcasting method to reduce the costs of uprooting and transplanting seedlings, although they understand that transplanting method pro-duce more yields. It was found that farmers, in general, fallow some of their rice lands since they do not have enough resources, such as money, labor, time etc. The management practices are at a minimum – a small amount or no chemical fertiliz-ers or pesticides are applied. Some farmers do one or two times of hand-weeding while others do not perform at all. The farmers in the study villages are risk -adverse farmers, using low inputs because of the high risk of crop failures by the frequent occurrence of drought, storms and floods. As a result, yields are very low, and farmers have to be satisfied with the harvest what are left in their fields.
Multiple Salt tolerant VarietiesUse of multiple varieties is one of the coping strategies to avoid a total yield loss under the environmental stresses. In general, farmers in the study villages use various salt tolerant varieties ranging from two to four since they cannot estimate which one will give a better yield in that particular year. They often test the new varieties intro-duced from other areas, expecting to obtain more suitable varieties in their specific location. Their selection is based on more yield potential and shorter duration and a good eating quality. All farmers traditionally use saline tolerant local rice varieties. The most widely grown varieties are Annawar-bo, Let-yone-gyi, Nga-sein-gyi, A-chon, Kun-ni and Kun-wah of local names. Some of them have been adopted for several

22 Khin Lay Swe and Kazuo Ando
decades and some newly introduced from some other saline areas of the country.
Embankments Post monsoon season, fresh water declines in rivers and its estuaries and brackish water gradually increases. Farmers build embankments or dikes (3 – 5 feet high and 2-3 ft. wide) to protect their fields from sea water intrusion (Photo 2). However, resource poor farmers cannot afford to cover all their fields. To date, there has been a lack of support from the government and NGOs for building embankments in the study areas.
Table3: Concepts on the constraints in rice production in Oke Hpo village
11
Sr. Particular Number of respondents
1 Major problem in rice
growing Salinity
High
production
costs
Labor
shortage
Others/
Weather,
etc.
42 (52.5) 14 (17.5) 20 (25) 4 (5)
2 Salinity in the rice fields Yes No No answer
68 (85) 8 (10) 4(5)
3 More drought in last
three years
Yes No No answer
66 (82.5) 14 (17.5) 0 (0)
4
More floods /tides in last
three years
Yes No No answer
68 (85%) 6 (7.5) 6(7.5)
5 Rice damage by “Super
tide” in October, 2014
Yes No
74 (92.5) 6 (7.5)
4 Rice damage severity by
“Super tide” in October,
2014
Damage all
areas (Zero
harvest)
More than
50% affected
Less than
50%
destroyed
No
damage
8 (10) 22 (27.5) 44 (55) 6 (7.5)
5 Wish to abandon farming Yes No
8 (10) 72(90)
6 Main support to improve
rice productivity
Embankments Inputs Micro –
credits
48 (60) 7(8.75) 25 (31.25)
Source: Personal survey by authors in April, 2015; the values in the parentheses are percentages of total
respondents.
Conclusion
Although the region is known as the rice bowl of the country, food security is a
challenging issue, the village economy remain depressed in study villages. Main
contributors to low rice yields are soil salinity and low input technology. Farmers
believe that salinity levels of rice fields has been increasing because of more occurrence

23Coastal Salinity in Ayeyarwady Region, Myanmar:
Livelihood opportunitiesApart from rice production, commercial production of Nypa thatch making is one of the major household incomes. The business of collecting, weaving and trading of Nypa fruticans (Da-ni) is more common in summer months after rice farming activities (Photo 3). The plants of Hygrophyla spp., which locally called Pinle-hnan or Mechaung-kunphat are formerly a kind weed in the fields. It has become a popu-lar crop due to a good export demand to China since 2010. Many farmers grow them in vacant lands under the mangrove trees (Photo 4). Some cultivated it in rice fields instead of rice. It gives a better profit than rice in some years, depending on the price. Some farmers in study villages are engaged in Community Forest (CF) which started in early 2000s in the study area, supported by the Forest Department and FREDA. War Kone village has successfully established CF of 140 ac with For-est User Groups (FUG) of 45 households (Photo 5). Non-timber Forest Products (NTFP) collected by some villagers are mostly fuel wood for local consumption (Photo 6) and Phoenix palm stems (Thin-baung) are used for fencing and construc-tion. Moreover, some households are partly supported by small-scale backyard home gardens. Coconut palms and betel nuts are the most common fruit trees (Photo 7). The products vary from home consumption to a sale at the market. Fishery products play an important role as a source of income and nutrition of the study villages. Most fishermen are daily wage laborers, catching fishes, crab and prawns in the streams and small rivers. Mud crab culture is well thriving and becoming popular these days with a good export market (Photo 8).
Concepts on the Constraints in Rice Production Based on the household survey in Oke Pho village, the farmers’ concept on the constraints in rice production were recorded (Table 3). The major problems as perceived by the respondent HH were – soil salinity (52.5%), high production cost (17.5%), labor shortage (25%) and other factors (5%). Eighty five percent of HH had salinity problem in their fields, while 10% had no salt affected fields, and 5% could not give a clear answer. Concerning with weather condition in the last three years, most farmers (82.5%) mentioned more drought years than before. Eighty five percent of respondents agreed that there were more floods or tidal inundation dur-ing the rice growing season in the last three years. The “Super tide” in October, 2014 affected the 92.5% of HH while 10% had total yield losses. Despite of their poor rice production, 90% HH did not wish to abandon farming. The main supports to improve their livelihood the respondents wished to receive include: embankments (60%), inputs – quality seeds, fertilizers, etc. (8.75%), and micro - credits program (31.25%).

24 Khin Lay Swe and Kazuo Ando
Photo2: Embankments in Auk Seik Kwin village
Photo4: Pinle-hnan in Te Pin Seik village
Photo6: NTFP –fuel woods in Seikma village
Photo8: Crab culture in Oke Pho village
Photo3: Nypa business in Te Pin Seik village
Photo5: CF and aqua-agroforestry in Wakone village
Photo7: Homestead garden in Wakone village
25Coastal Salinity in Ayeyarwady Region, Myanmar:
CoNCLUSIoNAlthough the region is known as the rice bowl of the country, food security is a challenging issue, the village economy remain depressed in study villages. Main con-tributors to low rice yields are soil salinity and low input technology. Farmers believe that salinity levels of rice fields has been increasing because of more occurrence in frequency and intensity of tidal floods, seasonal sea water intrusion, sea level rise in the face of climate change. As farmers’ traditional adaptation strategies are no longer effective under more extreme climate variability these days. Since rice is susceptible to salinity, rice productions in coastal zones are found to be unproductive and un-sustainable. The intensive rice cultivation will enhance salinity and soil degradation in the “blackish water and saline water areas”. Fishery, Nypa thatch industry, home gardening, Community Forestry and livestock raising are potential livelihood op-portunities which need to be improved. This study will provide some basic informa-tion to the policy makers for designing future rural development plans in the coastal areas of Myanmar.
REFERENCESDOA. 2012. Annual Report. Agricultural Extension Division, Department of Agri-
culture (DOA), Ministry of agriculture and Irrigation (MOAI). Kogo, M. 1993. Final Report on Mangrove Reforestation Feasibility Study, Feasible
Study on Mangrove Reforestation. MYA/90/003, Food and Agriculture Or-ganization of the United Nations, Tokyo.
LUD (Land Use Division). 2002. Soil Types and Characteristics of Myanmar. Myanma Agriculture Service (MAS), Ministry of Agriculture and Irrigation (MOAI), The Government of the Union of Myanmar. Yangon.
PONJA. 2008. Post-Nargis Joint Assessment (PONJA), UN, ASEAN, Government of the Union of Myanmar.
Lam, N. H, 2014. Improvement of Rice Cropping in Saline Soils in the North Central Coastal Region of Vietnam. Ph.D Thesis. Kyoto University, Japan. www.soils.kais.kyoto-u.ac.jp/wp-content/uploads/2015/05/2014Lamthesis.pdf


27
Natural Hazards Induced Salt-affected Soils for Rice Production in Myanmar
Soe Soe TheinPro-rector, Yezin Agricultural University, Myanmar
(Mail: [email protected])
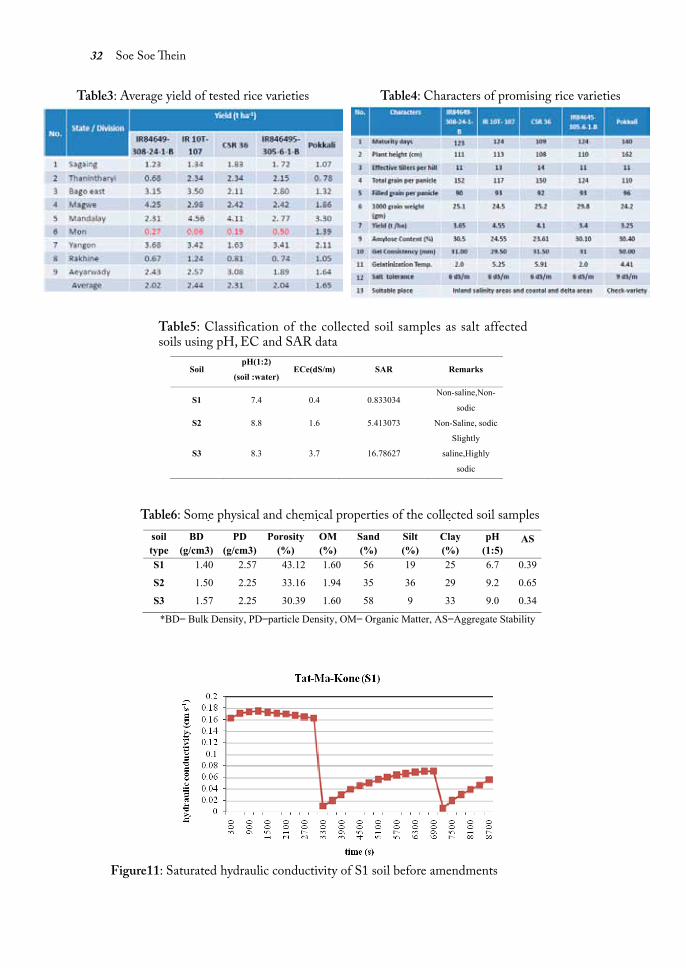
ABSTRACTMyanmar is exposed to natural hazards such as cyclone, drought, earth-quake, fire, flood, landslide and storm surge. This paper emphasized on in-land salinity problem due to drought in Central Dry Zone (CDZ) area and flood related seawater salt intrusion in Ayeyarwady Delta. To grow double rice crop in brackish and salt water intrusion area of Ayeyarwady, selection of short life varieties, irrigation according to the lunar calendar, balanced fertilizer application are three main points essential for success rice growing in this area. IR 84649-308-24-1-B, IR 10T-107, CSR36, and IR 846495-305-6-1-B are, so far, promising salt tolerant rice varieties for inland salin-ity areas and coastal and delta areas. According to experimental results, application of cow dung manure at the rate of 5 ton ha-1 was the best for non-saline, slightly sodic soil (S2) of Pale Township, Sagaing Region, CDZ and application of gypsum at the rate of 2 ton ha-1 was the appropriate amendment for slightly saline, highly sodic soil (S3) of Shwebo township, Sagaing Region, CDZ.
Key Words: natural hazards, salinity, sodic, lunar calendar, salt tolerant rice varieties, amendments
INtRoDUCtIoNAgriculture plays the pivotal role in Myanmar, accounting to more than 22 percent of GDP and employing 60 percent of labour force and the Government of Myan-mar has also positioned agricultural development as one of seven key pillars sup-porting for sustained economic development. Since the advent of military govern-ment in 1962, Socialism has been launched and its consequent agricultural policies including land nationalization and planned cultivation, Myanmar, the largest rice exporter in world in the 1950s, has the record of considerably decline in the 1960s (Dawe, 2002). The political transition that started in 2011 and current government via Ministry of Agriculture and Irrigation (MoAI), has deployed the strengths of the

28 Soe Soe Thein
Figure1: Map of Myanmar’s agro-ecological Zones
Figure3: Map of Ayeyarwady delta
Figure2: Map of the Central Dry Zone
Central Dry Zone
29Natural Hazards Induced Salt-affected Soils
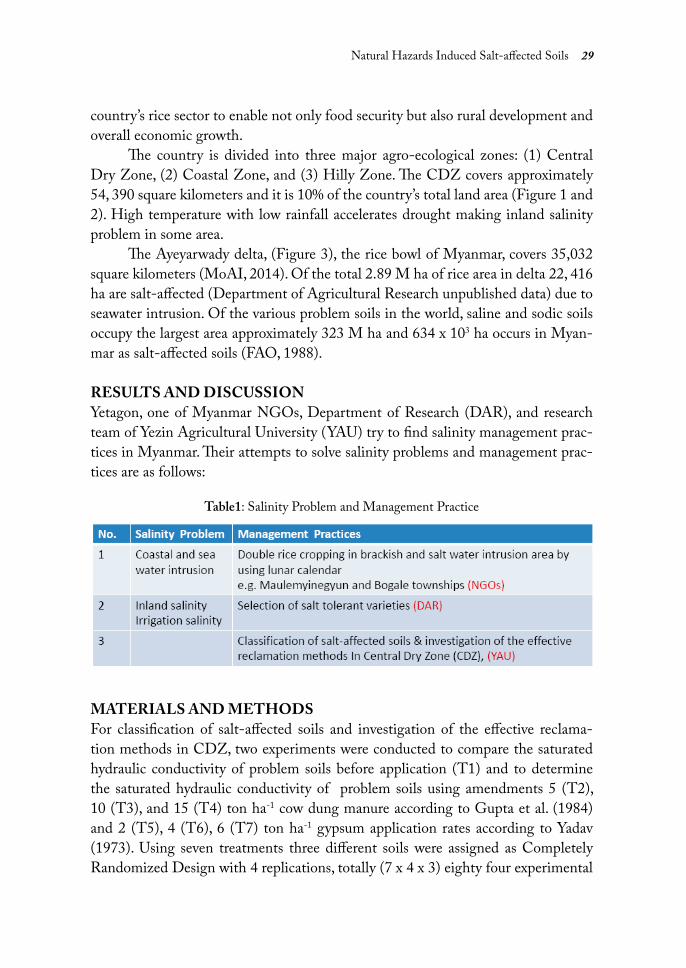
country’s rice sector to enable not only food security but also rural development and overall economic growth.
The country is divided into three major agro-ecological zones: (1) Central Dry Zone, (2) Coastal Zone, and (3) Hilly Zone. The CDZ covers approximately 54, 390 square kilometers and it is 10% of the country’s total land area (Figure 1 and 2). High temperature with low rainfall accelerates drought making inland salinity problem in some area.
The Ayeyarwady delta, (Figure 3), the rice bowl of Myanmar, covers 35,032 square kilometers (MoAI, 2014). Of the total 2.89 M ha of rice area in delta 22, 416 ha are salt-affected (Department of Agricultural Research unpublished data) due to seawater intrusion. Of the various problem soils in the world, saline and sodic soils occupy the largest area approximately 323 M ha and 634 x 103 ha occurs in Myan-mar as salt-affected soils (FAO, 1988).
RESULtS AND DISCUSSIoNYetagon, one of Myanmar NGOs, Department of Research (DAR), and research team of Yezin Agricultural University (YAU) try to find salinity management prac-tices in Myanmar. Their attempts to solve salinity problems and management prac-tices are as follows:
MAtERIALS AND MEtHoDSFor classification of salt-affected soils and investigation of the effective reclama-tion methods in CDZ, two experiments were conducted to compare the saturated hydraulic conductivity of problem soils before application (T1) and to determine the saturated hydraulic conductivity of problem soils using amendments 5 (T2), 10 (T3), and 15 (T4) ton ha-1 cow dung manure according to Gupta et al. (1984) and 2 (T5), 4 (T6), 6 (T7) ton ha-1 gypsum application rates according to Yadav (1973). Using seven treatments three different soils were assigned as Completely Randomized Design with 4 replications, totally (7 x 4 x 3) eighty four experimental
Table1: Salinity Problem and Management Practice

30 Soe Soe Thein
Figure 4. Irrigation based on Lunar Calendar
Figure 5. Lunar Calendar and safe time for irrigation
Figure 6. Strategy for double cropping in salt
intrusion area
Figure 7. Salinity tolerance of paddy during
growth
Figure 8. Recommended Irrigation Method during the Low Tide using pumps
Figure 4. Irrigation based on Lunar Calendar
Figure 5. Lunar Calendar and safe time for irrigation
Figure 6. Strategy for double cropping in salt
intrusion area
Figure 7. Salinity tolerance of paddy during
growth
Figure 8. Recommended Irrigation Method during the Low Tide using pumps
Figure 4. Irrigation based on Lunar Calendar
Figure 5. Lunar Calendar and safe time for irrigation
Figure 6. Strategy for double cropping in salt
intrusion area
Figure 7. Salinity tolerance of paddy during
growth
Figure 8. Recommended Irrigation Method during the Low Tide using pumps
Figure 4. Irrigation based on Lunar Calendar
Figure 5. Lunar Calendar and safe time for irrigation
Figure 6. Strategy for double cropping in salt
intrusion area
Figure 7. Salinity tolerance of paddy during
growth
Figure 8. Recommended Irrigation Method during the Low Tide using pumps
Figure4: Irrigation based on Lunar Calendar
Figure6: Strategy for double cropping in salt intrusion area
Figure5: Lunar Calendar and safe time for irrigation
Figure7: Salinity tolerance of paddy during growth
Figure8: Recommended Irrigation Method during the Low Tide using pumps
problem soils before application (T1) and to determine the saturated hydraulic conductivity of
problem soils using amendments 5 (T2), 10 (T3), and 15 (T4) ton ha-1 cow dung manure
according to Gupta et al. (1984) and 2 (T5), 4 (T6), 6 (T7) ton ha-1 gypsum application rates
according to Yadav (1973). Using seven treatments and three different soils were assigned as
Completely Randomized Design with 4 replications, totally (7 x 4 x 3) eighty four experimental
units. Three soil samples, S1 from WunDin Township, Mandalay Region, S2 from Pale
Township, Sagaing Region and S3 from Shwe Bo Township, Sagaing Region (Yin Mar Soe,
2014).
RESULTS AND DISCUSSION
Yetagon NGO suggested that to grow double rice crop in brackish and salt water intrusion area
of Ayeyarwady, selection of short life varieties, irrigation according to the lunar calendar,
balanced fertilizer application are three main points essential for success rice growing in this area
(Table 1, Figure 4, 5, and 6). They also pointed out that salt concentration of water is higher
during high tides than during low tides and irrigation should be done during low tides using
pumps.
Table 1. Selection of short life rice varities
Monsoon rice Life span 2nd crop Life span
Yetagon 90 DAS Yetagon 90 DAS
Sin Thwe Latt 135 DAS Sticky rice 95-96 DAS
Paw San Yin 145-150 DAS Pan Khan Shwe War 100-105 DAS
Pa Khan Shwe War 100-105 DAS Thee Htet Yin 110-115 DAS
Thee Htet Yin 110-115 DAS
Salinity tolerant ability of rice differs during growth stages and 1 DAS, 15 DAS and at flowering
stage, rice plants are very sensitive to salinity, however, rice plants are tolerant to salinity at 30
DAS and 45 DAS. Realizing on this point, farmers can adjust the time of sowing to critical sea
water intrusion period.
Table2: Selection of short life rice varieties

31Natural Hazards Induced Salt-affected Soils
units. Three soil samples, S1 from WunDin Township, Mandalay Region, S2 from Pale Township, Sagaing Region and S3 from Shwe Bo Township, Sagaing Region (Yin Mar Soe, 2014).
RESULtS AND DISCUSSIoNYetagon NGO suggested that to grow double rice crop in brackish and salt water intrusion area of Ayeyarwady, selection of short life varieties, irrigation according to the lunar calendar, balanced fertilizer application are three main points essential for success rice growing in this area (Table 2, Figures 4, 5, and 6). They also pointed out that salt concentration of water is higher during high tides than during low tides and irrigation should be done during low tides using pumps.
Salinity tolerant ability of rice differs during growth stages and 1 DAS, 15 DAS and at flowering stage, rice plants are very sensitive to salinity, however, rice plants are tolerant to salinity at 30 DAS and 45 DAS. Realizing on this point, farm-ers can adjust the time of sowing to critical sea water intrusion period.
Yetagon NGO also suggested one time P fertilizer application at basal, two times split K application at basal and EPI, three times N application at 15 DAS, 30 DAS and EPI.
Department of Agricultural Research (DAR) has tested rice breeding lines under three levels of EC and obtained some promising rice varieties (Figure 10, Tables 3 and 4). Breeding lines were tested on both station and on farm.
A research team of Soil and Water Science Department, Yezin Agricultural University conducted an experiment to classify the types of salt-affected using indi-cators of pH, ECe and SAR. According to FAO (1988), these indicators were used
Figure 9. Balanced fertilizer application for rice
Yetagon NGO also suggested one time P fertilizer application at basal, two times split K
application at basal and EPI, three times N application at 15 DAS, 30 DAS and EPI.
Department of Agricultural Research (DAR) has tested rice breeding lines under three levels of
EC and obtained some promising rice varieties (Figure 10, Table 2 and 3). Breeding lines were
tested on both station and on farm.
Figure 10. Breeding lines under three levels of EC at Research Station, Department of
Agricultural Research (DAR)
Figure9: Balanced fertilizer application for rice
Figure10: Breeding lines under three levels of EC at Research Station, Department of Agricultural Research (DAR)
32 Soe Soe Thein
Table3: Average yield of tested rice varieties Table4: Characters of promising rice varieties
Table5: Classification of the collected soil samples as salt affected soils using pH, EC and SAR data
Table6: Some physical and chemical properties of the collected soil samples
Figure11: Saturated hydraulic conductivity of S1 soil before amendments
Table 4. Classification of the collected soil samples as salt affected soils using pH, EC and SAR data
Soil pH(1:2)
(soil :water) ECe(dS/m) SAR Remarks
S1 7.4 0.4 0.833034 Non-saline,Non-
sodic
S2 8.8 1.6 5.413073 Non-Saline, sodic
S3 8.3 3.7 16.78627
Slightly
saline,Highly
sodic
Table 5. Some physical and chemical properties of the collected soil samples
soil type
BD (g/cm3)
PD (g/cm3)
Porosity (%)
OM (%)
Sand (%)
Silt (%)
Clay (%)
pH (1:5)
AS
S1 1.40 2.57 43.12 1.60 56 19 25 6.7 0.39
S2 1.50 2.25 33.16 1.94 35 36 29 9.2 0.65
S3 1.57 2.25 30.39 1.60 58 9 33 9.0 0.34
*BD= Bulk Density, PD=particle Density, OM= Organic Matter, AS=Aggregate Stability
Comparison of saturated hydraulic conductivity for salt-affected soils before applying
amendments
Figure 11.Saturated hydraulic conductivity of S1 soil before applying amendments.

33Natural Hazards Induced Salt-affected Soils
to determine the collected soil samples whether salt affected or not. Tables (5, 6) showed the results and some physic chemical properties of soil samples.
Comparison of Saturated Hydraulic Conductivity for Salt-affected Soils before AmendmentsFigure 12 showed that no water can penetrate through soil S2 and S3 before soil amendments based on hydraulic conductivity values of these soils. Dane et al (2005) discussed that hydraulic conductivity was very much dependent on soil structure, i.e., on the occurrence of aggregates and/or cracks.
Figure12: Saturated hydraulic conductivity of S2 sand S3 soil before amend-ments
Figure13: Effect of different amendments rates on saturated hydraulic con-ductivity of S1 soil
Figure 12.Saturated hydraulic conductivity of S2 sand S3 soil before applying amendments.
Figure 13. Effect of different amendments rates on saturated hydraulic conductivity of S1 soil.
Pr> 0.05 ns
Figure 12.Saturated hydraulic conductivity of S2 sand S3 soil before applying amendments.
Figure 13. Effect of different amendments rates on saturated hydraulic conductivity of S1 soil.
Pr> 0.05 ns
Pr> 0.05 ns

34 Soe Soe Thein
However, Figures 13, 14 and 15 showed the effect of different amendments and their rates on hydraulic conductivity values of three soils.
According to different amendments rates, there was no statistically significant difference on saturated hydraulic conductivity of two soils (S1) and (S2). However, (S3) showed that there was a highly significant difference at 1% level due to ap-plication of different amendments rates. For S1and S2, T2 (10 ton cow dung ha-1) amendment rate was well enough to improve soil physical properties based on costs.
For S3, there was no improvement in soil hydraulic conductivity till the ad-dition of cow dung manure at the rate of 15 t ha-1. Although there was a highest saturated hydraulic conductivity due to the application gypsum at the rate of 6 t ha-1 gypsum (T7), application of gypsum at 4 t ha-1 gypsum (T6) and T5(2 t ha-1
Figure14: Effect of different amendments rates on saturated hydraulic con-ductivity of S2 soil.
Figure15: Effect of different amendments rates on saturated hydraulic con-ductivity S3 soil.
Figure 14. Effect of different amendments rates on saturated hydraulic conductivity of S2 soil.
Figure 12 showed that no water can penetrate through soil S2 and S3 before applying soil amendments based on hydraulic conductivity values of these soils. Dane et al (2005) discussed that hydraulic conductivity was very much dependent on soil structure, i.e., on the occurrence of aggregates and/or cracks.
However, Figure 13, 14 and 15 showed the effect of different amendments and their rates on hydraulic conductivity values of three soils.
Figure 15.Effect of different amendments rates on saturated hydraulic conductivity S3 soil.
According to different amendments rates, there was no statistically significant difference
on saturated hydraulic conductivity of two soils (S1) and (S2). However, (S3) showed that there
Pr> 0.05 ns

35Natural Hazards Induced Salt-affected Soils
gypsum) were not statistically different with T7. With the consideration of the eco-nomic point of view, application of T5 (2 t ha-1 gypsum) would be appropriate for farmers.
CoNCLUSIoNIntegrated approaches such as indigenous knowledge, salt-tolerant crop, leaching salt, applying acid forming fertilizer or amaendments, improved cultivation practices are essential for reclamation of salt-affected soil. Moreover, it is needed to classify which type of salt-affected soil first and then the proper method should be applied.
REFERENCESDawe D., 2002. The Changing Structure of the World Market, Food Policy 27.FAO (Food and Agricultural Organization), 1988. Salt-affected Soils and Their
Management, Soil Bulletin-39, Rome.Gupta, R,K., Sigh, O.P. and Abrol, I.P. (1984). Determination of cation exchange
capacity and exchangeable sodium in alkali soils. Soil Sci., India. MoAI (Ministry of Agriculture and Irrigation), 2014. Myanmar Agriculture at a
Glance.MoAI (Ministry of Agriculture and Irrigation), 2015. Myanmar Agriculture in Brief.
81 pp. MoAI (Ministry of Agriculture and Irrigation), 2015. Myanmar Rice Sector Develop-
ment Strategy. 93 pp. Yadov, J.S.P. (1973). Annual report. All India coordinated project on water manage-
ment and soil salinity research institute, Karnal, India.Yin Mar Soe (2014). Comparison of saturated hydraulic conductivity on salt-affect-
ed soils and optimizing the effective reclamation methods. Journal of Agricul-tural Research, YAU. Vol: 1, Issue 1. P. 26-31.


37
Nutrient Management for Rice Production in Myanmar
Aung Naing Oo1, Theingi Khaung1 and Soe Soe Thein2
1. Lecturer, Department of Soil and Water Science, Yezin Agricultural University, NayPyiTaw, Myan-mar Ph: 95+095197139, Email: [email protected]
2. Pro-rector (Academic), Yezin Agricultural University, NayPyiTaw, Myanmar
ABSTRACTField experiment was conducted in order to investigate the effect of nutri-ent management on the productivity of high yielding rice (Yadanartoe) and hybrid rice (Palethwe-1) in the Department of Soil and Water Science, Yezin Agricultural University during the dry season of 2015. Experiment was laid out in a randomized complete block (RCB) design with four repli-cations. Five fertilizer treatments T1: no fertilizer applied (no-F), T2: +(PK) fertilizers, T3: +(NK) fertilizers, T4: +(NP) fertilizers and T5: +(NPK) fer-tilizers were randomized. In both varieties, the application of NPK, NK, and NP fertilizers significantly increased dry matter, plant height, number of tillers per hill, number of panicles per hill, number of grains per panicle and grain yield when compared to no fertilizer and PK fertilizers. The ap-plication of NPK treatment resulted in the highest grain yield, followed by the application of NK and NP fertilizers. The result also indicated that there was no significant difference on mean grain yield recorded between the treatments of without fertilizer and PK fertilizers application. It can be concluded that nitrogen is the most limiting factors to increase the produc-tivity of both varieties among the macronutrients.
Key Words: high yielding rice, hybrid rice, nutrient management, macro-nutrients
INtRoDUCtIoNRice (Oryza sativa L.) is one of the most important crops of the world, grown in wide range of climatic zones, and the main source of nutrition to millions of people around the world. Rice is also a staple food for Myanmar people and is an important agricultural product for export. Yet by 2030, global rice production must be dou-ble to meet demand (FAO 2010), placing greater stress on already threatened land and water resources. Total rice production will need to increase in order to feed an
38 Aung Naing Oo, Theingi Khaung and Soe Soe Thein
increasing population. Introduction of hybrid rice is an important step towards aug-mentation of rice yield. Hybrid rice yields about 15-20% more than the promising high-yielding commercial varieties (Chaturvedi 2005). The hybrid cultivars are more responsive to higher doses of nutrients (Yuan 1999) and thereby the yield potential-ity is all high.
Generally, nitrogen (N) is one of the major elements required for plant growth as the most yield limiting nutrient in lowland rice production because it is a constit-uent of numerous important compounds found in living cells, including amino acids, proteins (enzymes), nucleic acids, and chlorophyll (Traore and Maranville 1999). It was hypothesized that low yields were partly related to a change in the N supply-ing capacity of soil which results in low N concentration in the leaf canopy during the grain filling period, early senescence of leaves, and low rates of photosynthesis (Kropff et al. 1993). With this hypothesis, grain protein content also appears to have decreased. There are a large number of papers in fertilizer nitrogen rate which reported that nitrogen could increase protein content and possibly grain yield of rice, however, with the considerable variability rate. It is likely that yield would have increased further in most experiments if a higher rate of N-fertilizer was taken into consideration. Thus, N affects all parameters contributing to yield. Leaf N concen-tration is closely related to leaf photosynthesis rate and crop biomass production. N drives the demand for other macronutrients such as P and K (Dobermann and Fairhurst 2000).
Phosphorus is important for flower production, anthesis, grain setting, strong root and stem, and ripening of plant (Yoshida 1981). Phosphorus is very important in early growth stages. It is mobile within the plant and promotes root develop-ment, tillering, early flowering, and ripening (especially where the temperature is low). Addition of mineral phosphorus fertilizer is required when the rice plant’s root system is not yet fully developed and the native soil phosphorus supply is small (Dobermann and Fairhurst 2000). Rice plants that are deficient in P are stunted and dirty-dark green, and they have erect leaves, relatively few tillers, and decreased root mass. Phosphorus is remobilized within the plant during later growth stages if suf-ficient P has been absorbed during early growth (Dobermann and Fairhurst 2000).
Potassium is the key component in the enzymes activities. While K does not have a pronounced effect on tillering, it does affect the number of spikelets per pani-cle, percentage of filled grains, and grain weight. Potassium improves the rice plant’s tolerance to adverse climatic conditions, lodging, insect pests, and diseases. Defi-ciency symptoms tend to occur in older leaves first, because K is very mobile within the plant and is translocated to young leaves from old senescing leaves. Often, yield response to K fertilizer is observed only when the supplies of other nutrients, espe-cially N and P, are sufficient (Dobermann and Fairhurst 2000). Haefele et al. (2006)

39Nutrient Management for Rice Production in Myanmar
found that in Northeast Thailand regions, there was no significant yield difference between the control and the PK treatments indicated that P and K were rarely lim-iting yield without N application. But, if N was applied, application of P and K did increase the average yields significantly.
An important constraint to rice yield is nutrient availability, and available nu-trients are considered to be the most limiting nutrient to the rice yield in Myanmar. In addition, balanced fertilization is very crucial in rice production. Therefore, the aim of this research was to investigate the effect of nutrient management on the productivity of high yielding rice (Yadanartoe) and hybrid rice (Palethwe-1).
MAtERIALS AND MEtHoDSExperimental SiteField experiment was carried out in the Department of Soil and Water Science, Yezin Agricultural University, Myanmar at latitude of 19° 50´ N and longitude of 96° 15´ E, and at an elevation of 120 m above sea level during the dry season of 2015.
Experimental Design and treatmentsExperiment was laid out in a randomized complete block (RCB) design with four replications under irrigated condition. The tested varieties were Yadanartoe (130 days) and Palethwe-1 (120 days) which was one of the promising hybrid varieties
Treatment DescriptionT1 No fertilizer applied (no-F)T2 +(PK) fertilizers at the rate of 0-13-31 kg N-P-K ha-1
T3 +(NK) fertilizers at the rate of 85-0-31 kg N-P-K ha-1
T4 +(NP) fertilizers at the rate of 85-13-0 kg N-P-K ha-1
T5 +(NPK) fertilizers at the rate of 85-13-31 kg N-P-K ha-1 NPK used were urea, triple superphosphate and muriate of potash
Treatment DescriptionT1 No fertilizer applied (no-F)T2 +(PK) fertilizers at the rate of 0-25-63 kg N-P-K ha-1
T3 +(NK) fertilizers at the rate of 115-0-63 kg N-P-K ha-1
T4 +(NP) fertilizers at the rate of 115-25-0 kg N-P-K ha-1
T5 +(NPK) fertilizers at the rate of 115-25-63 kg N-P-K ha-1
NPK used were urea, triple superphosphate and muriate of potash
Table1: Fertilizer management practices for high yielding rice (Yadanartoe) in dry season, 2015
Table2: Fertilizer management practices for hybrid rice (Palethwe-1) in dry season, 2015

40 Aung Naing Oo, Theingi Khaung and Soe Soe Thein
for mass production.For high yielding rice (Yadanartoe), Triple superphosphate (13 kg P ha-1) was
applied as basal. Urea (20 kg N ha-1) and muriate of potash (10 kg K ha-1) were applied at 7 DAT (Day After Transplanting). Urea (45 kg N ha-1) and muriate of potash (11 kg K ha-1) were applied at 20 DAT (mid-tillering). Urea (20 kg N ha-1) and muriate of potash (10 kg K ha-1) were applied at 45 DAT (panicle initiation) as three split applications. For hybrid rice (Palethwe-1), Triple superphosphate (25 kg P ha-1) was applied as basal. Urea (25 kg N ha-1) and muriate of potash (21 kg K ha-1) were applied at 7 DAT (Day After Transplanting). Urea (65 kg N ha-1) and muriate of potash (21 kg K ha-1) were applied at 20 DAT (mid-tillering). Urea (25 kg N ha-1) and muriate of potash (21 kg K ha-1) were applied at 45 DAT (panicle initiation) as three split applications.
Data CollectionAn area of 1m ×1m sampling size was used for taking samples (number of tillers per hill and plant height) of each plot by two weeks interval started from 14 days after transplanting. In order to estimate grain yield, the sampling area (4 m2) of each plot was hand-harvested and total grain weight of each plot was recorded. Yield compo-nents were also recorded as number of hills per m2, number of tillers per hill, number of panicles per hill, thousand grain weight, number of total grains, number of filled grains and number of unfilled grains. The number of panicles per hill was counted from randomly selected ten hills of harvested area and totaled them. The average number of panicles per hill was calculated. From randomly selected ten panicles of harvested area, the grains were threshed and bulked, and separated the unfilled grains from filled grains. And then, the number of filled grains and unfilled grains was counted and thousand grain weights was measured by a digital balance.
Fertilizer Use EfficiencyFertilizer use efficiency was calculated by using the following formulae (Fageria 2009).
4
(panicle initiation) as three split applications. For hybrid rice (Palethwe-1), Triple superphosphate
(25 kg P ha-1) was applied as basal. Urea (25 kg N ha-1) and muriate of potash (21 kg K ha-1) were
applied at 7 DAT (Day After Transplanting). Urea (65 kg N ha-1) and muriate of potash (21 kg K
ha-1) were applied at 20 DAT (mid-tillering). Urea (25 kg N ha-1) and muriate of potash (21 kg K
ha-1) were applied at 45 DAT (panicle initiation) as three split applications.
2.3 Data collection
An area of 1m ×1m sampling size was used for taking samples (number of tillers per hill and
plant height) of each plot at two weeks interval started from 14 days after transplanting. In order to
estimate grain yield, the sampling area (4 m2) of each plot was hand-harvested and total grain
weight of each plot was recorded. Yield components were also recorded as number of hills per m2,
number of tillers per hill, number of panicles per hill, thousand grain weight, number of total grains,
number of filled grains and number of unfilled grains. The number of panicles per hill was counted
from randomly selected ten hills of harvested area and totaled them. The average number of
panicles per hill was calculated. From randomly selected ten panicles of harvested area, the grains
were threshed and bulked, and separated the unfilled grains from filled grains. And then, the
number of filled grains and unfilled grains was counted and thousand grain weights was measured
by a digital balance.
2.4 Fertilizer use efficiency
Fertilizer use efficiency was calculated by using the following formulae (Fageria 2009).
2.5 Data analysis
The data collected were analyzed statistically using Analysis of Variance (ANOVA)
techniques, and treatment means were compared by least significant difference (LSD) test at 5%
probability level. All statistical analyses were done by using Statistix 8.0 software and Excel
program (2010) by followed up Gomez and Gomez (1984).
N application grain yield with N application - grain yield without N application Agronomic N use
efficiency =
P application grain yield with P application - grain yield without P application Agronomic P use
efficiency =
K application
grain yield with K application - grain yield without K application Agronomic K use efficiency
=

41Nutrient Management for Rice Production in Myanmar
Data AnalysisThe data collected were analyzed statistically using Analysis of Variance (ANO-VA) techniques, and treatment means were compared by least significant differ-ence (LSD) test at 5% probability level. All statistical analyses were done by using Statistix 8.0 software and Excel program (2010) by following up Gomez and Gomez (1984).
RESULtS AND DISCUSSIoNThe plant height of Yadanartoe and Palethwe-1 measured from 14 days to 84 days after transplanting at two weeks interval is shown in Figure 1. It was observed that plant height was similar at first 4 WAT, thereafter somewhat increased until 8 WAT. After 8 WAT, the growth was not much progressed in all treatments in both varie-ties. The increased plant height after 4 WAT was more pronounced in the applica-tion of NPK, NK, and NP fertilizers. In both varieties, the maximum plant height was found in NPK treatment which was statistically similar to those of NK and NP application treatments. Likewise the minimum plant height was observed in no fertilizer treatment. PK application plot was also statistically similar in plant height as no fertilizer treatment. It was probably attributed to the addition of N which promotes the metabolic processes (Traore and Maranville 1999) and plant height
5
3. Results and Discussion
The plant height of Yadanartoe and Palethwe-1 measured from 14 days to 84 days after
transplanting at two weeks interval is shown in Figure 1. It was observed that plant height was
similar at first 4 WAT, thereafter somewhat increased until 8 WAT. After 8 WAT, the growth was
not much progressed in all treatments in both varieties. The increased plant height after 4 WAT was
more pronounced in the application of NPK, NK, and NP fertilizers. In both varieties, the maximum
plant height was found in NPK treatment which was statistically similar to those of NK and NP
application treatments. Likewise the minimum plant height was observed in no fertilizer treatment.
PK application plot was also statistically similar in plant height as no fertilizer treatment. It was
probably attributed to the addition of N which promotes the metabolic processes (Traore and
Maranville 1999) and plant height (Fageria and Baligar 2001).
Figure 1 Means number of tiller for control and four different fertilizers application on Yadanatoe
and Palethwe-1
The total shoot dry weight at harvest time resulted from five different fertilizer applications
is shown in (Figure 2). In both varieties, data revealed that the application of NPK, NK, and NP
fertilizers significantly produced maximum dry weight over the treatments of no fertilizer and PK
application fertilizer application at harvest.
0
20
40
60
80
100
120
140
2 W
AT
4 W
AT
6 W
AT
8 W
AT
10 W
AT
12 W
AT
no-F +(PK) +(NK) +(NP) +(NPK)
Plan
t hei
ght (
cm)
Weeks after transplanting
0
20
40
60
80
100
120
140
2 W
AT
4 W
AT
6 W
AT
8 W
AT
10 W
AT
12 W
AT
no-F +(PK) +(NK) +(NP) +(NPK)
Weeks after transplanting
Yadanatoe Palethwe-1
Figure1: Means number of tiller for control and four different fertilizers application on Yadana-toe and Palethwe-1

42 Aung Naing Oo, Theingi Khaung and Soe Soe Thein
(Fageria and Baligar 2001).The total shoot dry weight at harvest time resulted from five different fer-
tilizer applications is shown in (Figure 2). In both varieties, data revealed that the application of NPK, NK, and NP fertilizers significantly produced maximum dry weight over the treatments of no fertilizer and PK application fertilizer application at harvest.
Grain yield and yield components of high yielding rice (Yadanartoe) and hy-brid rice (Palethwe-1) as affected by different fertilizer applications are presented
Figure2: Dry matter yield for control and four different fertilizers application on Yadanatoe and Palethwe-1
Table3: Effect of nutrient management on yield and yield components of high yielding rice (Yadanartoe) in dry season, 2015
6
Figure 2 Dry matter yield for control and four different fertilizers application on Yadanatoe and
Palethwe-1
Table 3 Effect of nutrient management on yield and yield components of high yielding rice
(Yadanartoe) in dry season, 2015
Treatment
Number of
tillers
per hill
Number of
Panicles
per hill
Number of
spikelets
per panicle
% of
filled
grains
Grain yield
(kg ha-1)
(no-F) 6.67 b 6.33 b 108.7 b 87.9 4701 c
+(PK) 7.25 b 6.83 b 121.0 b 90.7 5611 b
+(NK) 8.83 a 8.25 a 136.0 a 87.7 7656 a
+(NP) 8.83 a 8.50 a 144.3 a 90.4 7696 a
+(NPK) 9.08 a 8.75 a 141.0 a 89.4 7715 a
F-test * ** ** ns **
C.V % 9.75 8.94 5.50 2.19 7.17
Values in column followed by the same letter are not significantly different at 5% level (**) − significantly different at P≤0.01, (*) − significantly different at P≤0.05, ns − not significant
Grain yield and yield components of high yielding rice (Yadanartoe) and hybrid rice
(Palethwe-1) as affected by different fertilizer applications are presented in (Table 3) and (Table 4),
respectively. It was found that mean grain yield of both varieties recorded under the application of
NPK, NK, and NP fertilizers treatments was significantly higher than that of no fertilizer and PK
treatments. Among the five fertilizer application treatments, however, the application of NPK
1626 1508
1957 1958 1949
1444 1548
1904 1976 1905
0
500
1000
1500
2000
no-F +(PK) +(NK) +(NP) +(NPK)
Dry
mat
ter y
ield
(g m
-1)
Treatments
Yadanatoe Palethwe-1

43Nutrient Management for Rice Production in Myanmar
in (Table 3) and (Table 4), respectively. We noticed that mean grain yield of both varieties recorded under the application of NPK, NK, and NP fertilizers treatments was significantly higher than that of no fertilizer and PK treatments. Among the five fertilizer application treatments, however, the application of NPK treatment resulted in the highest grain yield, which was followed by the yield of application of NK and NP fertilizers. The result also indicated that there was no significant difference on mean grain yield recorded between the treatments of without fertilizer application and PK fertilizers application. Pham et al. (2000) reported that adjusting amount of nitrogen application and indigenous nitrogen is a key factor to get higher yield of rice and sustainability.
Regarding to yield components of both varieties, the application of NPK, NK, and NP fertilizers treatments significantly produced a number of tillers per hill, a number of panicles per hill, number of spikelets per panicle and thousand grain weight more than the treatments of no fertilizer application and NP fertilizers, but there was no significant difference in percentage of filled grains among the five dif-ferent kind of fertilizer treatments. The plots without fertilizer application gave low value of yield components. Nitrogen fertilizer promotes rice growth by increase in plant height, number of tillers per hill, leaf size, number of spikelets per panicle, and filled grains percentage in each panicle, and thus yields as shown in many reports (Nangju and De Datta 1970; Seetanum and De Datta 1973; Patrick and Hoskins 1974; Fageria and Baligar 2001).
Agronomic N use efficiency (ANUE) was defined as the ratio of grain yield with N application minus grain yield without N application to N application (Fa-geria 2009). The fertilizer use efficiency of Yadanatoe and Palethwe-1 is shown in
Table4: Effect of nutrient management on yield and yield components of hybrid rice (Palethwe-1) in dry season, 2015
7
treatment resulted in the highest grain yield, which was followed by the yield of application of NK
and NP fertilizers. The result also indicated that there was no significant difference on mean grain
yield recorded between the treatments of without fertilizer application and PK fertilizers application.
Pham et al. (2000) reported that adjusting amount of nitrogen application and indigenous nitrogen is
a key factor to get higher yield of rice and sustainability.
Table 4 Effect of nutrient management on yield and yield components of hybrid rice (Palethwe-1)
in dry season, 2015
Treatment
Number of
tillers
per hill
Number of
Panicles
per hill
Number of
spikelets
per panicle
% of
filled
grains
Grain yield
(kg ha-1)
(no-F) 6.31 b 6.19 b 131.3 b 76.5 5704 b
+(PK) 6.56 b 6.56 b 130.5 b 78.7 6092 b
+(NK) 8.00 a 7.81 a 157.8 a 79.7 8330 a
+(NP) 7.88 a 7.84 a 157.3 a 76.1 8198 a
+(NPK) 8.81 a 8.50 a 162.3 a 81.0 8382 a
F-test * ** ** ns **
C.V % 14.11 13.98 7.40 7.53 8.75
Values in column followed by the same letter are not significantly different at 5% level (**) − significantly different at P≤0.01, (*) − significantly different at P≤0.05, ns − not significant
Regarding to yield components of both varieties, the application of NPK, NK, and NP
fertilizers treatments significantly produced number of tillers per hill, number of panicles per hill,
number of spikelets per panicle and thousand grain weight more than the treatments of no fertilizer
application and NP fertilizers, but there was no significant difference in percentage of filled grains
among the five different kind of fertilizer treatments. The plots without fertilizer application gave
low value of yield components. Nitrogen fertilizer promotes rice growth by increase in plant height,
number of tillers per hill, leaf size, number of spikelets per panicle, and filled grains percentage in
each panicle, and thus yields as shown in many reports (Nangju and De Datta 1970; Seetanum and
De Datta 1973; Patrick and Hoskins 1974; Fageria and Baligar 2001).
Agronomic N use efficiency (ANUE) was defined as the ratio of grain yield with N
application minus grain yield without N application to N application (Fageria 2009). The fertilizer
use efficiency of Yadanatoe and Palethwe-1 is shown in (Figure 3). The efficiency of N fertilizer is
high, relatively P and K are very low. In both varieties, the ANUE value recorded in this study was
higher than the 16 kg grain kg-1 N fertilizer reported by Haefele et al. (2006) for eight fertilizer

44 Aung Naing Oo, Theingi Khaung and Soe Soe Thein
(Figure 3). The efficiency of N fertilizer is high, relatively P and K are very low. In both varieties, the ANUE value recorded in this study was higher than the 16 kg grain kg-1 N fertilizer reported by Haefele et al. (2006) for eight fertilizer trials car-ried out in the Northeast Thailand from 1995 to 1997. From this result, it could be suggested that the application of P and K fertilizer could be reduced in Yezin soil.
CoNCLUSIoNThis study investigated the effect of nutrient management on the growth and yield of high yielding rice (Yadanartoe) and hybrid rice (Palethwe-1). In both varieties, the results indicated that the application of NPK, NK, and NP fertilizers signifi-cantly increased total dry matter, plant height, number of tillers per hill, number of panicles per hill, number of spikelets per panicle and grain yield while compared to using no fertilizer and PK fertilizers. The results indicated the effect of N fertilizer could improve the growth and grain yield of rice for both varieties. Nitrogen would verify to be a significant contributor to the growth, development and finally grain yield, as it is evident from this study. Indigenous P and K supply would be sufficient to achieve yields of both varieties in this study area. Based on above findings, it can be concluded that nitrogen is the most limiting factor to increase grain yield of both varieties at the study site.
ACKNowLEDgEMENtThis study was supported from the research project of Yezin Agricultural University, Nay-PyiTaw, Myanmar.
8
trials carried out in the Northeast Thailand from 1995 to 1997. According to this result, it could be
suggested that the application of P and K fertilizer could be reduced in Yezin soil.
Figure 3 Fertilizer use efficiency of Yadanatoe and Palethwe-1 (ANUE = Agronomic N use
efficiency; APUE =Agronomic P use efficiency; AKUE = Agronomic K use efficiency)
4. Conclusion
This study investigated the effect of nutrient management on the growth and yield of high
yielding rice (Yadanartoe) and hybrid rice (Palethwe-1). In both varieties, the results indicated that
the application of NPK, NK, and NP fertilizers significantly increased total dry matter, plant height,
number of tillers per hill, number of panicles per hill, number of spikelets per panicle and grain
yield while compared to using no fertilizer and PK fertilizers. The results indicated the effect of N
fertilizer could improve the growth and grain yield of rice for both varieties. Nitrogen would verify
to be a significant contributor to the growth, development and finally grain yield, as it is evident
from this study. Indigenous P and K supply would be sufficient to achieve yields of both varieties in
this study area. Based on above findings, it can be concluded that nitrogen is the most limiting
factor to increase grain yield of both varieties at the study site.
5. Acknowledgement
This study was supported from the research project of Yezin Agricultural University,
NayPyiTaw, Myanmar.
6. References
Chaturvedi, I. 2005. Effect of nitrogen fertilizers on growth, yield and quality of hybrid rice (Oryza
sativa). Journal of Central European Agriculture, 6: 611–618.
0
5
10
15
20
25
30
ANUE APUE AKUE
Yadanatoe Palethwe-1
Ferti
lizer
Use
Eff
icie
ncy
Figure3: Fertilizer use efficiency of Yadanatoe and Palethwe-1 (ANUE = Agronomic N use efficiency; APUE =Agronomic P use efficiency; AKUE = Agronomic K use efficiency)

45Nutrient Management for Rice Production in Myanmar
REFERENCESChaturvedi, I. 2005. Effect of nitrogen fertilizers on growth, yield and quality of
hybrid rice (Oryza sativa). Journal of Central European Agriculture, 6: 611–618.Dobermann, A. and T. Fairhurst. 2000. Rice: Nutrient disorders and nutrient manage-
ment. Potash and Phosphate Institute (PPI), Potash and Phosphate Institute of Canada (PPIC), and International Rice Research Institute (IRRI).
Fageria, N.K. 2009. The use of nutrients in crop plants. CRC press, Boca Raton, Florida.Fageria, N.K. and V.C. Baligar. 2001. Lowland rice response to nitrogen fertilization.
Communication of Soil Science and Plant Analysis, 32(9, 10): 1405–1429.FAO (Food and Agriculture Organization). 2010. Rice market monitor volume 8-issue
no. 2. Rome: Food and Agriculture Organization of the United Nations.Gomez, K.A. and A.A. Gomez. 1984. Statistical Procedures for Agricultural Research.
2nd edition. John Wiley & Sons, New York.Haefele, S.M., K. Naklang, D. Harnpichitvitaya, S. Jearakongman, E. Skulkhu, P.
Romyen, S. Phasopa, S. Tabtim, D. Suriya-arunroj, S. Khunthasuvon, D. Krai-sorakul, P. Youngsuk, S.T. Amarante and L.J. Wade. 2006. Factors affecting rice yield and fertilizer response in rainfed lowlands of northeast Thailand. Field Crops Research 98:39–51.
Kropff, M.J., K.G. Cassman, H.H. Van Laar and S. Peng. 1993. Nitrogen and yield potential of irrigated rice. Plant Soil 155: 391–394.
Nangju, D. and S.K. De Datta. 1970. Effect of time of harvest and nitrogen level on yield and grain breakage in transplanted rice. Agronomy Journal 62: 468–474.
Patrick, R. M. and F.H. Hoskins. 1974. Protein and amino acid content of rice as affected by application of nitrogen fertilizer. Cereal Chemistry 51: 84–95.
Pham, K., W. Seetanum and S.K. De Datta. 2000. Grain yield, milling quality, and seed viability of rice as influenced by time of nitrogen application and time of harvest. Agronomy Journal 85: 390–394.
Seetanum, W. and S.K. De Datta. 1973. Grain yield, milling quality, and seed viabil-ity of rice as influenced by time of nitrogen application and time of harvest. Agronomy Journal 65: 390–394.
Traore, A. and J.W. Maranville. 1999. Nitrate reductase activity and diverse grain sorghum genotypes and its relationship to nitrogen use efficiency. Agronomy Journal 91: 863–869.
Yoshida, S. 1981. Fundamentals of rice crop science. International Rice Research Insti-tute, Los Baños, Philippines.
Yuan, L. 1999. Hybrid rice breeding for super high yield. Hybrid Rice 12(6): 1-6.

47
Impact of Flood on Agricultural Production in Seikphyu Township, Magwe Region
Nyein Nyein Htwe1, Mya Yadana Tun2, Khin Oo3
1. Associate Professor and Professors, Yezin Agricultural University 2. Master Student 3. Retired Professor, Yezin Agricultural University
Corresponding email address: [email protected]
ABSTRACTTo investigate the loss of agricultural production of farmers after flood hit in October 2011, the study was conducted by interviewing 120 respondents from 10 villages at Seikphyu Township, Magway Region in July 2012. A total of 120 respondents from 10 villages were interviewed with structural interview questionnaire. The study area was divided into three groups based on their level of damage: Group I (seriously affected area), Group II (mod-erately affected area), and Group III (less affected area). In the study area, majority of the respondents mainly relied on upland farming and alluvial land cultivation. Land holding size of Group I was significantly different in upland and alluvial land cultivation before and after flood. Cropping patterns of group I, and II were significantly changed after flood. Farm implements, well and storehouse were significantly reduced compared with groups I and II. Flood affected people received many farming assistance provided by government and many donor organizations. For all respond-ents, lack of investment and adaptable seeds were the most difficulties for the affected people livelihood. The farmers needed the rehabilitation pro-gram to provide loan, adaptable seeds to climate change, improve agricul-tural technology, farm machinery and implements and availability of water supply.
Key Words: flood, cropping patterns, agricultural production, Seikphyu Township
INtRoDUCtIoNThe Union of Myanmar is exposed to multiple natural hazards including cyclone, earthquake, floods and fire due to climate change. Climate change had a signifi-cant impact on the country’s agriculture and livelihoods, especially in the Dry Zone. The farming systems of the Dry Zone are a complex mixture of paddy cultivation, non-rice crops (pulses, oilseeds, vegetable and others) and large and small livestock

48 Nyein Nyein Htwe, Mya Yadana Tun, Khin Oo
(MOAI 2011).The impacts of climate change on agriculture and human well-being include:
1) the biological effects on crop yields; 2) the resulting impacts on outcomes includ-ing prices, production, and consumption; and 3) the impacts on per capita calorie consumption and child malnutrition. The biophysical effects of climate change on agriculture induce changes in production and prices, which play out through the economic system as farmers and other market participants adjust autonomously, al-tering crop mix, input use, production, food demand, food consumption, and trade (Nelson et al. 2009).
In Seikphyu Township, the total of 27 villages was severely hit by flood of Yaw Stream in 19th and 20th October in 2011. The villages along Yaw Stream within Magway Region were initially declared disaster zones. Seventy five percent of the houses and buildings were destroyed and the flood killed some people, animals, and destroyed many farm, households, and declined their economy (DOA 2012).There-fore, the objective of this study was to assess the impact of climate change on the agricultural production in the study area.
RESEARCH MEtHoDoLogyIn this study, the primary data were collected from the selected 120 households with the structured interview in ten villages from five village tracts during July 2012 in Seikphyu Township.
(i) Primary data on cropping patterns of farmers’ before and after flood, as-sistance for agricultural livelihood for rural development after flood, and cultivated area, uncultivated area, net sown area, damage list of Yaw stream flood and strong winds and aids for households affected by flooding.
(ii) The major sources of the secondary data were also taken from village el-ders and personnel from Department of Agriculture (DoA) in Seikphyu Township.
The paired-sampled t-test was used to analyze the statistically differences of cropping patterns of farmers’ economy before and after flood. The chi-square test was used to analyze the losses of livelihood and rehabilitation program of the sample respondents after flood.
RESULtS AND DISCUSSIoNThe sample respondents were selected from different villages in Seikphyu Town-ship to represent the population affected by flood. Based on flood damaged level, the sample households were classified into three groups; seriously affected areas (65 households in Group I), moderately affected areas (32 households in Group II) and less affected areas (23 households in Group III).

49Impact of Flood on Agricultural Production
Land Holding of the Sample Respondents Before and After FloodThe total number of land holding size owned by farmer groups is shown in Table 1. There were three types of land such as lowland, upland and alluvial land. The mean lowland holding size was significantly different (0.62 and 0.57 ha) before and after flood in Group I. For upland farm, the mean upland holding size was 1.72 and 1.62 ha within the range of 0.08 - 8.11 and 0.08 - 6.88 ha before and after flood respec-tively. Therefore, upland holding size in Group I was significantly changed before and after flood. The mean alluvial land holding size was 0.68 and 0.52 ha within the range of 0.1 – 1.22 ha before and after flood in the study area. In Group I, alluvial land holding size was significantly different before and after flood.
It was found that possession of different types of farm land was similar in
Items Sample respondentsFirst priority (Group I) 65 (54.2)
Second priority (Group II) 32 (26.7)Third priority (Group III) 23 (19.2)
Total 120 (100)
Table1: Different types of the sample respondents in the study area, 2012
Table2: Effects of flood on landownership of farmers in the study area, 2012
Table 2. Effects of flood on landownership of farmers in the study area, 2012
Types of lands ha
Group I Group II Group III
% of the respondents t-test
% of the respondents t-test % of the respondents t-test
Before After Before After Before After
Lowland
0 <1
1.1-2.9 3-4.9 Mean Range
32(49.2) 27(41.5)
5(7.7) 1(1.5)
0.62 0.08 - 3.44
34(52.3) 25 (38.5)
6 (9.2) 0
0.57 0.08 - 2.02
1.760ns
16(50.0) 13(40.6)
2 (6.3) 1(3.1)
0.63 0.10 - 3.24
17(53.1) 12 (37.5)
2 (6.3) 1 (3.1)
0.59 0.10 - 3.24
-
12(52.2) 9(39.1)
2(8.7) 0.57
0.20 - 1.62
12(52.2) 9(39.1)
2(8.7) 0.57
0.20 - 1.62
-
Upland
0 <1
1.1-2.9 3-4.9 5-6.9
>7 Mean Range
4(6.2) 25(38.5) 26(40.0)
6(9.2) 3 (4.6) 1 (1.5)
1.72 0.08 - 8.11
8(12.3) 23(35.4) 24 (36.9)
6 (9.2) 4 (6.2)
0 1.62
0.08 - 6.88
2.419*
1(3.1) 12(37.5) 15 (46.9)
4(12.5) 1.69
0.41 - 4.05
2(6.3) 12 (37.5) 14(43.8) 4 (12.5)
1.63 0.41 - 4.05
1.438ns
2(8.7) 11 (47.8)
8 (34.8) 2 (8.7)
1.43 0.41 - 4.05
4(17.4) 11 (47.8)
6 (26.1) 2 (8.7)
1.26 0.20 -
4.05
2.152*
Alluvial land
0 <1
1.1-2.9 Mean Range
26(40.0) 34(52.3)
5(7.7) 0.68
0.10 - 1.22
36(55.4) 24 (36.9)
5(7.7) 0.52
0.10 - 1.22
3.411**
15(46.9) 15 (46.9)
2 (6.3) 0.59
0.05 - 1.22
18(56.3) 12(37.5)
2 (6.3) 0.50
0.04 - 1.22
1.791ns
10(43.5) 12 (92.3)
1 (4.3) 0.61
0.09 - 2.02
12(52.2) 10(43.5)
1 (4.3) 0.52
0.09 - 1.01
1.447ns
Figures in the parentheses are percentage.
Note: ** = significantly different at 1% level, * = significantly different at 5% level, and ns =non- significant

50 Nyein Nyein Htwe, Mya Yadana Tun, Khin Oo
12
Table 3. Cropping patterns of farmers in respondents before and after flood, 2012
Items Crops
Group I Group II Group III
No. of respondents
(%) t-test
No. of respondents
(%) t-test
No. of respondents
(%) t-test
Before After Before After Before After
Lowland
Rice-Chickpea 15 (23.0) 12(18.
4)
1.760ns
9 (28.1) 6 (18.7)
1.791ns
10 (43.4) 10 (43.4)
-
GG or Maize 4 (6.1) 0 2.049* 1 (3.1) 1 (3.1) 1.000ns
Sunflower 0 3 (4.6) -1.760ns
Total respondents 19 15 10 7
Upland
GG-M/PP 14 (21.5) 6 (9.3) 2.997** 3 (13.0) 2 (8.7) 1.000ns
GG-fallow-Onion 18(27.8) 9 (13.8) 3.207**
Onion-Betel 13 (40.7) 7 (21.8) 2.675*
GG-PP/M/O-S 15 (46.9) 7 (21.8) 3.215**
Onion- fallow- Betel/CH 4 (6.1) 5(7.6 ) -1.000ns
3 (13.0) 4 (17.3) -1.000ns
13
GG+PP+M/S/CT 16 (24.6) 12 (18.4) 2.049* 14 (43.9) 9 (28.1) 2.396* 6 (26.0) 3 (13.0) 1.817ns
M+S/CT/SF 6 (9.3) 3 (4.6) 1.760ns
1 (4.3) 1 (4.3) -
GG+M+C/SF/T+CH 19 (29.1) 7 (10.8) 3.807** 2 (6.2) 0 1.438ns
5 (21.7) 3 (13.0) 1.447ns
M+SF/PP 1 (4.3) 1 (4.3) -
Total respondents 77 42 44 23 19 14
Alluvial
land
Onion- Betel 31 (47.7) 20
(30.8)
3.611** 11 (34.4) 9 (28.1)
1.438ns
Chilli or Sesame 2 (3.0) 3 (4.6) -1.000ns
5 (15.6) 2 (6.2) 1.791ns
Onion- Betel + Chilli 12 (52.1) 8 (34.6) 2.152*
Total respondents 33 23 16 11
Figures in the parentheses are percentage.
Note: * = Significantly different at 5% level and ns = non - significant
Table3: Cropping patterns of farmers in respondents before and after flood, 2012

51Impact of Flood on Agricultural Production
Group I and Group II (Table 2). The mean lowland holding size of Group II was 0.63 and 0.59 ha within the range of 0.10 – 3.24 ha before and after flood. The mean upland holding size was 1.69 and 1.63 ha within the range of 0.41 - 4.05 ha before and after flood. The mean alluvial land holding size was 0.59 and 0.50 within the range of 0.05 – 1.22 ha before and after flood. Therefore, average land holding size of different types of land in Group II farmers were not significantly reduced before and after flood. In Group III, The mean lowland holding size 0.57 ha was not changed within the range of 0.20 – 1.62 ha before and after flood in the study area. The mean upland holding size was 1.43 and 1.26 ha within the range of 0.41 - 4.05 ha before and after flood. Therefore, Group III upland holding sizes were significantly reduced after flood. The mean alluvial land owner were 0.61 and 0.52 ha within the range of 0.09 - 2.02 and 0.09 - 1.01 ha before and after flood. Significantly change in size of ownership of alluvial was not found in Group III due to impact of flood.
Impact of Flood on types of Cultivated Crops and Patterns in the Study Area There were various crops cultivated in three types of cropping patterns; mono crop-ping, double cropping and mix cropping patterns (Table 3). In group I, rice-chickpea pattern in lowland was cultivated by 23% and 18.4% of the respondents before and after flood respectively. Moreover, green gram or maize was cultivated by 6.1% of farmers before flood whereas sunflower cultivation was done by 4.5% in place of green gram or maize after flood. Significant impact of flood was found in cultivation of green gram or maize crops in lowland of Group I.
The upland types of cropping patterns were green gram - maize/pigeon pea, green gram - onion, onion - betel/ chilli, green gram + pigeon pea, maize/sesame/cotton, maize + sesame/cotton/sunflower, and green gram + maize+ chickpea/sun-flower/tomato + chilli. Green gram- maize or pigeon pea done by 21.4% of group1 was decreased to 9.3% after flood. Moreover, green gram- onion cultivation was done by 27.8% whereas 13.8% of farmers could cultivate after flood respectively. The mix cropping of green gram, maize, and chili with chickpea or sunflower or tomato cultivation was done by 29.1% before flood and 10.8% of farmers after flood respectively. These three types of cropping patterns with various crops were highly significantly different before and after flood.
In alluvial land although onion-betel vine cultivation was done by 47.7% be-fore flood, 30.8% of farmers continued this pattern. It was highly significantly dif-ferent before and after flood.
In Group II farmers, rice followed by chickpea was cultivated by 28.1% before flood but 18.7% of lowland owners were able to grow this pattern after flood. This cropping pattern in lowland farm was not significantly different before and after flood. Onion-betel vine cultivation was done by 40.7% and 21.8% of the respond-

52 Nyein Nyein Htwe, Mya Yadana Tun, Khin Oo
ents before and after flood. The mix cultivation of green gram + pigeon pea / maize/onion + sesame and another mix cropping were dominant in upland. Before flood, over 40% of farmers could use these patterns but only about 20% continued to grow after flood. These three types of cropping patterns were significantly different before and after flood.
In alluvial land, onion followed by betel vine cultivation was cultivated by 34.4 % and 28.1% before and after flood. The chili cultivation was done by 15.6 % before flood and 6.3 % after flood. The cropping patterns in alluvial land were not signifi-cant before and after flood.
In Group III, the common pattern of rice followed by chickpea in lowland was practiced by 43.1% of farmers before and after flood. In upland farm, cropping patterns were the same with other groups such as onion followed by chili or betel vine cultivation, green gram + pigeon pea + maize/ sesame / cotton/ sunflower/ chili + tomato. The cropping patterns of lowland and upland farm were not significant different before and after flood.
In alluvial land, onion followed by betel vine cultivation and chili cultivation was done by 52.1 % and 34.6% of farmers before and after flood respectively. This type of cropping was significantly different before and after flood.
Impact of Flood on Farm Assets of the Sample HouseholdsIn the study area, most of the villages were located along the Yaw stream. When flooding in the study area, their implements were floated down along the stream. In Group I and II households, the respondents who owned tractor was the same (6.2%) before and after flood. The owners of farm assets such as sprayer (43.1 % to 35.4%), water pump (72.3% to 61.5%), well (58.5% to 40%), storehouses (58.5% to 35.4%) and threshing ground (12.3% to 10.8%) were significantly decreased after flood. In group II household, the no. of heavy farm machines owners such as tractor (6.3%), trailer (3.1%) and power tiller (3.1%) were the same before and after flood. Although farm assets such as sprayer, water pump, storehouses and threshing ground were lost during flood, the loss of well was significantly increaseded after flood (43.8% to 31.3%). In group III households, it was noticed that some farm assets (sprayer, water pump, well and storehouses) were lost, but not significantly reduced by flood-ing (Table 4).
Economic Analysis on Impacts of Flood on onion Production To evaluate the profitability and efficiency of resource use in onion production of the sample farmers in the study area, comparative gross margin analysis of the study area before and after flood is conducted (Table 5).
As a consequence of low yield and low price of onion production, production

53Impact of Flood on Agricultural Production
14
Table 4 Effect of flood on farm assets of the sample respondents
Items Group I Group II Group III
Before After t-test Before After t-test Before After t-test
Tractor 4 (6.2) 4 (6.2) - 2 (6.3) 2 (6.3) -
Power tiller 1 (3.1) 1 (3.1) -
Sprayer 28 (43.1) 23 (35.4) 2.309* 13 (40.6) 10 (31.3) 1.791ns 5 (21.7) 4 (17.4) 1.000ns
Water pump 47 (72.3) 40 (61.5) 2.779** 19 (59.4) 16 (50.0) 1.791ns 15 (65.2) 15 (65.2) -
Trailer 1 (1.5) 1 (1.5) - 1 (3.1) 1 (3.1) -
Well 38 (58.50 26 (40.0) 3.469** 14 (43.8) 10 (31.3) 2.104* 10 (43.5) 9 (39.1) 1.000ns
Storehouse 38 (58.5) 23 (35.4) 4.382** 15 (46.9) 12 (37.5) 1.791ns 10 (43.5) 7 (30.4) 1.817ns
Threshing ground 8 (12.3) 7 (10.8) 1.000ns 4 (12.5) 3 (9.4) 1.000ns 1 (4.3) - 1.000ns
Figures in the parentheses are percentage.
Note: ** significantly different at 1% level, * significantly different at 5% level, and ns non- significant
15
Table 5 Comparative gross margin analysis of onion production of all group farmers before and after flood Group I Group II Group III
No
.
Description Unit
Before
flood
After
flood
Before
flood
After
flood
Before
flood
After
flood
1. Average output (yield) kg/ha 5529.5 2356.2 5493.7 1734.8 4983 2722.5
2. Average farm-gate price Kyats/kg 417.86 364 392.9 364 385 375
3. Value of production (1x2) Kyats/ha 2310556.9 857656.8 2158474.7 631467.2 1918455 1020937.5
4. Total material cost Kyats/ha 111088.1 183360 139119 92528.6 161370 124125
5. Total labor cost Kyats/ha 237578.6 344240 279395.2 183757.1 325030 247000
6. Total variable cost (TVC)(4+5) Kyats/ha 348666.7 527600 418514.2 276285.7 486400 371125
7. Gross margin per unit of land (3-6) Kyats/ha 1961890.2 330056.8 1739960.5 355181.5 1432055 649812.5
8. Gross margin per unit of capital (3/6) Kyats/TVC 6.62 2.59 5.16 2.29 3.94 2.75
9. Break-even yield (6/2) kg/ha 834.4 1449.5 1065.2 759 1263.4 989.7
10. Break-even price(6/1) Kyats/ha 63.06 223.9 76.2 159.3 97.6 136.3
Table4: Effect of flood on farm assets of the sample respondents
Table5: Comparative gross margin analysis of onion production of all group farmers before and after flood

54 Nyein Nyein Htwe, Mya Yadana Tun, Khin Oo
value of group I was decreased 37.1% (from over 2 million kyats to over 800000 kyats) after flood. In group II & III production value decreased 29.3% and 53.2% respectively. Although farmers were not able to use necessary inputs and labor for getting high yields, input and labor cost were expensive after flood.
In a consequence of the lower value of production, gross margin per unit of land in group I decreased from over 1900000 kyats to over 330000 kyats , that is 16.8% after flood. For group II it was much lower than before 20.4% (from over 1700000 kyats to over 350000 kyats) after flood. Gross margin per unit of land in group III were much lower 45.4% (from over 1 million kyats to over 60000 kyats) after flood is over.
Table 1 Different types of the sample respondents in the study area, 2012 Items Sample respondents
First priority (Group I) 65 (54.2)
Second priority (Group II) 32 (26.7)
Third priority (Group III) 23 (19.2)
Total 120 (100)
Table 6 Agricultural aids obtained by farmers after flood
No. Aids % of the respondents
Group I Group II Group III
1. Plough/harrow 38.5 53.1 21.7
2. farm implements 75.4 62.5 56.5
3. Well 29.2 12.5 47.8
4. Seeds 66.2 59.4 69.6
5. Technology 4.6 15.6 4.3
χ2 47.87*
*= Significant at 5 % level Table 7 Difficulties in farming faced by farmers after flood
No. Difficulty % of the respondents
Group I Group II Group III
1. Lack of investments (money) in farms 36.9 50.0 56.5
2. Lack of water in farms 27.7 18.8 26.1
3. To prepare flooded fields for cultivation 58.5 53.1 56.5
4. Lack of seeds for sowing 84.6 90.6 95.7
5. Difficulty to transport 7.7 3.1 -
6. Lack of electricity in village 10.8 3.1 8.7
7. Insufficient food for households 18.5 9.3 13.0
8. Lack of implements 3.0 6.3 4.3
9. Lack of other household property 12.3 6.3 4.3
10. Low crop prices 72.3 59.4 86.9
a) Group I = 65, b) Group II = 32, c) Group III = 23
Table6: Agricultural aids received by farmers after flood
Table7: Difficulties in farming faced by farmers after flood

55Impact of Flood on Agricultural Production
Consequently, gross margin per unit of capital were decreased respectively from 6.62 in group I, 5.16 in group II and 3.94 in group III before flood to 2.59, 2.29 and 2.75 after flood. The profit of onion production of farmers in all groups I were dramatically reduced and their revenue could not cover the total variable cost of production after flood. Therefore, the break-even yield and break-even price of onion production were significantly increased for all groups after flood.
The break-even price showed that farmers must get a higher price for their onion production after flood just to cover their total variable costs. But break-even yield were reduced after flood.
Agricultural Aids for Sample Respondents after FloodThe survey reported that many donor organizations such as Action Aid, Mae Far Luang foundation, PC-Myanmar, MNGO-CP, FAO, Ecodev MHDO provided farm implements and quality seeds for sowing (Table 6). About 66.2% of group I, 59.4% of group II, and 69.6% of group III farmers received quality seeds for cul-tivation next season. Farm implements such as plough or harrow were received by 38.5% of the respondents in group I, 53.1% of the respondent group II, and 21.7% of the respondent group III farmers. The donor organizations such as Development Committee of Towns and Cities, Manawphyu, Action Aid, and NLD party donated wells to obtain sufficient water for cultivation. About 29.2% of group I, 12.5 of group II, and 47.8% of group III of the respondents received wells to obtain sufficient water for cultivation in water shortage season. Other farm implements were largely received by 75.4% of group I, 62.5% group II, and 56.5% group III in the study area. The χ2 value expressed that agricultural aids obtained by farmers were significantly different among groups. Among the groups, group I largely obtained farm imple-ments and seeds, Group II got the highest assistance for plough or harrow and seed while group III were in possession of wells and seeds.
Difficulties in Farming of the Sample Respondents after FloodThe respondents were questioned regarding their difficulties in crop production and other difficulties after flood (Table 7). In the sample farmers, about 84.6% of group I, 90.6% of group II, and 95.7% of group III of the sample respondents cited lack of quality seeds for sowing as their worst problems. The respondents (72.3 % of group I, 59.4% of group II and 86.9 % of group III) expressed lack of proper markets for their seasonal goods. In all groups, over 50% of the farmers faced the serious problem of flooding in their fields. Moreover, 36.9% of group I, 50% of group II, and 56.5% of group III farmers stated lack of money to invest for cultivation in the next crop. In the sample respondents, the most difficulties were lack of seed for re-sowing, low price of their crops, to prepare flooded fields and lack of money by all group farmers

56 Nyein Nyein Htwe, Mya Yadana Tun, Khin Oo
after flood. Seeds and farm equipments were largely provided to all groups by the donor agencies. Although group I lost many well but donors provided more wells to group III.
CoNCLUSIoN AND PoLICy IMPLICAtIoNFlood simultaneously impacted on several sources of income, livelihood, properties and lives. Cropping patterns, crop varieties and crop yields of the climate related crop production were limited factors due to the impact of flood in the study area. In practice, physical capital such as plows, seeds, farm implements and water sup-plied sources must be restored. The livelihood of farming people will be recovered by providing good quality seeds and improved technology for crop production. The local farmers will mainly need extension and financial services concerned with crop production and rural development. The international donors and local government especially MOAI should provide adequate amount of seeds, investment money and required farm implements according to the farmers’ needs in rehabilitation program.
REFERENCESDOA (Department of Agriculture). 2012. Official report. Ministry of Agriculture
and Irrigation, Myanmar.MOAI (Ministry of Agriculture and Irrigation, Myanmar). 2011. Myanmar Agricul-
ture at a Glance, Nay Pyi Taw, Myanmar.Nelson, G. C., M. W. Rosegrant, J. Koo, R. Robertson, T. Sulser, T. Zhu, C. Ringler,
S. Msangi, A. Palazzo, M. Batka, M. Magalhaes, R. Valmonte-Santos, M. Ew-ing, and D. Lee. 2009.Climate Change, Impact on Agriculture and Cost of Adaptation. IFPRI (International Food Policy Research Institute, Washing-ton). Food Policy Report. pp 1-4.

57
Sustaining Community and Forest Development through Community Forest Enterprise - A Case Study in Southern
Shan State
Lwin Lwin NaingEcosystem Conservation and Community Development Initiative (ECCDI), Myanmar
ABSTRACTA market-led approach to community forest was piloted in Ywangan Township in 2014 through FFF (Forest and Farm Facility) funded project: “Preparing for a community forest-based enterprise”. It involved 6 CFs (Community Forests) and successfully established in 6 village level Com-munity Forest Products Producer Associations (CFPPAs) and a Township level CFPPA. Following the success of this project FFF funded the project: “Establishing and Strengthening CF Enterprises in Southern Shan State” in 2015. It involved 36 CFs in 5 townships including Ywangan with ben-eficiaries numbering 3,789 households.
Key Words: community forest (CF), southern Shan State, forest and farm facility (FFF)
INtRoDUCtIoNInternational experiences have shown that market-led approach to CF (Community Forest) or CF-based enterprises can alleviate poverty, sustain forests and improve social justice.
With this end in view, the Ecosystem Conservation and Community Devel-opment Initiative (ECCDI) implemented a project entitled “Preparing for A Com-munity Forest-based Enterprise” in Ywangan Township in 2014, and the follow-up project “Establishing and Strengthening CF Enterprises in Southern Shan State” in five townships including Ywangan in 2015.The projects were financially supported by the Forest and Farm Facility (FFF).
The first project had assessed the potential of six CFs/FUGs (Forest Users Group) located in Ywangan Township for enterprise development, and assisted in the formation of six individual CF enterprises and a Township level enterprise, while the follow-up project strengthened the existing enterprises and formed State level CF enterprise.

58 Lwin Lwin Naing
This paper briefly describes the achievements of the two FFF-funded projects implemented by ECCDI.
BACKgRoUNDThe First CF EnterpriseThe FFF funded CF market-led project: “Preparing for A Community Forest-based Enterprise” was implemented in Ywangan Township, Southern Shan State, in 2014.
In the past Ywangan Township was covered with dense forests. In the 1960’s most of these dense forests were degraded and depleted as a result of overcutting and shifting cultivation. Consequently, local community experienced a severe water crisis for decades. Agricultural activities were badly affected and even draught animals such as buffaloes died. They also faced shortage of fuel wood which they used for cooking. Villagers had to go long distances to get water and fuelwood.
The people in this area then realized the importance of forest for their daily lives. A head village monk called a meeting of the concerned villages to address the problems they were facing. He encouraged some land owners to donate part of their land to establish forest plantation for the village. The land owners agreed to donate their land and the villagers agreed to contribute cash to buy tree seedlings and labor to establish village plantations.
In 2003, the six project villages obtained CF certificates for their forests from the Forest Department (FD). The restoration and sustainable management of the forests in this area is very important since it lies in the watershed of the Inlay Lake.
The FFF Project involved 6 CFs or 6 villages with 410 HHs.
Photo1: Pway Hla Community Forest Figure1: Map of Project Site

59Sustaining Community and Forest Development through Community Forest Enterprise
The overall objective was to promote community forest enterprises, to reduce poverty and to sustain forests while specific objectives include
•Toassessthepotentialofmarket-ledapproachtoCF;•ToassistformationofanassociationoracooperativeofCFUGstoenhance
their influence and capacity;•To strengthen business skills of the CFUG associations or cooperatives
through appropriate trainings; and•To assistCFUGs to strengthen theirCFs legally and secure commercial
forest rights.The project had found that the communities were very enthusiastic about the
CF and CF enterprises and the market surveys demonstrated potential to commer-cialize community forests.
The project had been able to form CF enterprises at all 6 CF villages and the Ywangan Township CF enterprise and identified priority products that the market demanded.
The Project conducted technical trainings to enable the communities to pro-duce the products which the market needs and the business-related trainings to en-able them to manage marketing and financial matters.
technical trainings during First Phase of ProjectInformed of those project activities, other ten CFs in the township had expressed
Photo4: Training on Orchid Cul-tivation
Photo2: Training on Cultivation of Elephant Yam
Photo3: Training on Bamboo Cultivation
Photo5: Training on Cultivation of Rattan

60 Lwin Lwin Naing
their interest to join the township enterprise. (They were included in the follow-up project).
Structure of the township AssociationThe Association has an Executive Committee with 9 members as follows: Chairper-son, Vice-Chairperson, Secretary, Treasurer, Auditor and four members. Each Village CFPPA is represented in the Township Executive Committee. The Village CFPPAs have their own Executive Committees.
CFPPA DEVELoPMENt IN SoUtHERN SHAN StAtEEncouraged by the success of the pilot project, FFF continued its support to EC-CDI to strengthen the existing Ywangan CF enterprises and formes new CF enter-prises in other townships, and create State level CF enterprise in the Southern Shan State through a follow-up project “Establishing and Strengthening CF Enterprises in Southern Shan State”.The project duration was from March to November 2015 (9 months).Overall objective: To sustainably develop CFs and alleviate rural poverty through formation and clustering of CF enterprises in the Southern Shan StateSpecific objectives: •ToscaleupYwanganTownshipCommunityForestProductsProducerAs-
sociation •ToestablishSouthernShanStateCommunityForestProductsProducer
Association
Structure of the Project
6
3. CFPPA Development in Southern Shan State
Encouraged by the success of the pilot project, FFF continued its support to ECCDI to strengthen
the existing Ywangan CF enterprises and form new CF enterprises in other townships, and create
State level CF enterprise in the Southern Shan State through a follow-up project “Establishing
and Strengthening CF Enterprises in Southern Shan State”.
The project duration was from March to November 2015 (9 months).
Overall objective: To sustainably develop CFs and alleviate rural poverty through formation and
clustering of CF enterprises in the Southern Shan State
Specific objectives:
• To scale up Ywangan Township Community Forest Products Producer Association
• To establish Southern Shan State Community Forest Products Producer Association
3.1. Structure of the project
The project includes 5 townships and 36 CF enterprises as shown in the following table and
diagram.
SN
No. of CF
Location (township)
No. of beneficiaries
(FUG member
HHs)
1 16 Ywangan 2,171
2 5 Pindaya 859
3 5 Kalaw 233
4 5 NyaungShwe 474
5 5 Pinlaung 52
Total 36 5 townships 3,789
Table1: Basic Information of Community Forest (CF) Enterprises

61Sustaining Community and Forest Development through Community Forest Enterprise
The project includes 5 townships and 36 CF enterprises as shown in the following table and diagram.
Project Activities Project activities includeStrengthening existing Ywangan Tsp CF enterpriseEnlarging CFsConducting market survey with identification of priority productsProviding appropriate trainings Formation of CF enterprises in village, township and State levels
trainings and technical Assistance Provided by the ProjectTo strengthen the skills of the CFUG associations, both technical and business-oriented trainings were conducted after identifying the training needs.
•TrainingonCommunityForestManagementandCommercializingCF•TrainingonProductionofPriorityProduct(Coffee)•TrainingonProductionofPriorityProduct(GreenTeaLeaves)•Trainingonproductionofbambooandrattanvalueaddedproducts.•Trainingonbookkeeping(forYwanganCFUGs)•Trainingonmarketanalysisanddevelopment(forYwanganCFUGs)
Figure2: Project Organization Diagram

62 Lwin Lwin Naing
•Trainingonbookkeeping(forCFUGsinother4townships)•Trainingonmarketanalysisanddevelopment(forCFUGsinother4town-
ships)
Results of trainings and technical AssistanceValue-added rattan products The local market surveys had shown the priority products for local consumption and export. The first priority was the rattan-value-added products. Thus, the Ywangan CFPPAs were linked to the Myanmar Rattan and Bamboo Exporting Association which guaranteed to consume all the products that the Association could manage.
The Ywangan CF enterprises are being strengthened technically and have been trained to produce rattan value-added products such as trays, vases, under plate, placemats of all shapes and hats. ECCDI staged an exhibition of these products at its 4th annual mass meeting held in the International Business Centre in Yangon on 8 Sept, 2015. Although the products were of better quality, they were sold at lower prices than those in the markets in Yangon.
Planned Activities for Further DevelopmentThere are plenty of broom grass in CFs and on road sides. Brooms have a large local market.
ECCDI has already organized for the villagers a TOT program on the mak-ing of brooms.
There is a number of CFs which have potential as tourist sites such as wa-terfalls in Ale-chaung and Kyaukguti CFs, blue lake in Tawkye CF, cultural sites in Pwehla CFs.
ECCDI will assist the respective CF enterprises to promote ecotourism in their CFs.
Photo6: Rattan value-added product training, Ya Gyi CF
P hoto7: Rattan value-added products on sale at ECCDI an-nual meeting

63Sustaining Community and Forest Development through Community Forest Enterprise
CoNCLUSIoNThe achievements of the project are encouraging. The CFs are healthy and very well protected and looked after by FUGs. FUGs are enthusiastic and active, even wishing to scale up their existing CFs. The local Shan State government is supportive of the community forestry and its expansion. Forest Department (FD), Township Coop-erative and Administrative authorities are cooperative. It is heartening to note that 36 CF enterprises have been appreciably formed as associations and a partnership between FUGs and Myanmar Bamboo and Rattan Products Producers Association made. Thus, the future for CF enterprise is merited bright. As a result, community livelihood will be more pleasant and the forests enlarged in a better manner.
ACKNowLEDgEMENt ECCDI acknowledges with thanks the FFF, FAO, for encouraging and funding the pro-jects. The Organization is also grateful to the DG, FD for permission to organize the projects with CFs and the State forest staff for cooperation and support.
REFERENCESECCDI. 2014. Proposal on “Establishing and Strengthening CF Enterprises in the
Southern Shan State” (December, 2014), ECCDI.ECCDI. 2014. Business Plan for Ywangan Township CF based forest products Associa-
Photo8: Broom grass in CF
Photo11: A blue lake near Ywangan Township
Photo9: Brooms
Photo12: A waterfall
Photo10: Cultural site, Pwayhla

64 Lwin Lwin Naing
tion, ECCDI.ECCDI. 2014. Interim report on the project “Preparing for a Community Forest-
based Enterprise”, ECCDI.ECCDI. 2014. Long-term Development Plan for Community Forest Products Producers
Association, Yagyi Village, Ywangan Township, Shan State, ECCDI

65
Rural Urban Migration in Ayeyarwady Region:A Case Study of Ah Mar Sub-township, Phyapon District
Myint ThidaAssociate Professor, Department of Geography, University of Yangon
ABSTRACTThe paper stresses on migration caused by ineffective rural economy on Ah Mar Sub-township located in coastal area of Ayeyarwady Region. Objec-tives of the paper are to examine causes of migration in the area, to find out consequences of migration and to explore the means that can reduce depopulation of the area. Migration especially permanent migration and chain migration were distinct. Rural economy, low health care, less educa-tion facilities are major push factors that influence the migration of the area. Rural economic activities, such as agriculture, making thatch and fishing are ineffective and give low income. These economic activities are seasonal works and they do not get regular income. On the other hand, major pull factors of urban area are higher and have regular income, better environment and job opportunities. In order to get regular income, they move to urban areas and abroad because most young adults remain jobless after harvesting season. As a consequence, labour shortage problem and high labour cost become distinct and these, in turn, affect agriculture, major economy of the area.
Key Words: push factors, rural economy, agriculture, making thatch, fish-ing, pull factors, impacts
INtRoDUCtIoNBy increasing the demand for labour in urban areas, rural urban migration occurs (Roberts, 2001). Rural urban migration is a distinct phenomenon in Myanmar, like other developing countries. Most young adults who live in rural areas move to urban areas for better income and high living standard.
Ah Mar Sub-township is in Ayeyarwady Region known as Myanmar Granary and major economic activity is agriculture. As the study area is located in coastal area, and salt water intrusion that causes crop loss is a major problem. Although agriculture is major economy, labour shortage gets known and labour cost increases because of migration. Role of labour is important in agriculture because it is neces-sary to plant and harvest crops in time. Fishing and making thatch are also other

66 Myint Thida
economic activities of the area. But, these are also seasonal works and they give insuf-ficient income to local people. Therefore, rural economy which provides low income is a main cause that affects movement of people from rural areas to urban areas.
There are five types of movements, on the assumption that they represent pos-sible patterns: rural-urban migration; seasonal movement; unskilled labor in search of employment opportunities; the “brain drain” phenomenon, and the creation of refugees (Choucri, N, 1978). In the area, rural-urban migration; seasonal movement and unskilled labor in search of employment opportunities assume an alarming situ-ation.
Second cause of migration is related to education. To get higher educational opportunities, most local people let their children go to urban areas to have higher educational opportunities. Most migrants are teenagers and move to attend higher education class, such as high schools and universities. Movement connecting health matter is third reason for migration. Some local residents move to urban area with a vies to getting good health care. In the area, medical centers are far apart and number of medical stuffs is low. Rural health assistant plays important role in health care of the area. But, migration related to economy of the area is distinct.
Migration reduces the use of young adult labour in agriculture because the majority of migrants are male (Maharjan, A., et al, 2013).Therefore, the area encoun-ters labour shortage problem and labour cost increases in agriculture.
StUDy AREAAhmar Sub-township in Phyapon Township has 4 Wards and 9 Village Tracts. It
Figure1: Location of Ahmar sub-Township in Ayeyarwady Region
Figure2: Village Tracts of Ahmar sub-Town-ship in Ayeyarwady Region

67Rural Urban Migration in Ayeyarwady Region
has an area of 2.8 sq.km (691 acres) and total population was 126899 of which male was 63865 and female 63034 in 2014. Major economic activities are agricul-ture, fishing and making thatch. More than 70 % of the population are engaged in agriculture and the rest in fishing and making thatch. Therefore, an overwhelming majority of people are poor.
DAtA AND MEtHoDSPrimary data were collected through semi-structured interviews to get thorough understanding on rural urban migration. Among 9 village tracts, 5 village tracts of which people engaged in agriculture, fishing and making thatch were selected to collect primary data to understand major driving force causing migration. Primary data such as family income, jobs, education, health, migration etc. were mainly col-lected and socio-economic and demographic questions that affect migration were also selected to illustrate causes, consequences and pattern of migration. Secondary data were also applied.
Descriptive method and quantitative - qualitative mixed method are mainly applied to this research.
RESULtS AND FINDINgSIn the study area, rural economy including agriculture, fishing and making thatch, is a key factor that mainly affects migration. Other factors affecting migration include education, health issue, and etc.
Major economy of the area is agriculture and local people depend on agricul-ture. But, agriculture gives low income to the local people due to high loss caused by salt water intrusion. Income from agriculture is insufficient for their cost of living, they have no variable alternatives to get income for their survival and they are in the vicious debt cycle.
Household migration may be classified into two categories: Split migration and family migration. Split migration occurs when the head of the household moves from a rural to an urban area. Family migration occurs when the entire family moves together at the same time to urban areas (McCatty, 2004). In the study area, one or more family members move to other places for better income and split migration arises.
According to interviews, 48 percent of the families have one or more migrants. In the study area, jobs related migration is common. In the circumstances, 60 % of the migrants are connected to job opportunities and they move to other place to get higher income. Job related movement is distinct and young adults go to urban area of Phyapon Township, Hlaingtharyar Township in Yangon Region and abroad to get regular income and lead a better life. These migrants work as labors in textile indus-

68 Myint Thida
tries, construction work and trading activities and remit their salary to their parents.Figure 3 shows working places of migrants moved from Ahmar Sub-town-
ship. Directional bias is distinctly found. Although the Phyapon Town is nearer than Hlaingtharyar Township, most migrants move to Hlaingtharyar Township for job opportunities.
In many countries, rural areas supply the manual labor needed in various in-dustries. Rural laborers generally have little education and are relegated to low pay-ing jobs (McCatty, 2004). Although education status of the person who moved to urban area to get regular and better income ranged from monastic education to graduate level, most migrants are of high school level.
Seventy percent of the family have desire to send their children to urban areas to get better income and better education. 90 % of the family wants to abandon farming but they do not have other alternative jobs for survival.
Push FactorsEconomic, educational and health factors are push factors that affect the migration of the area. Among them, ineffective rural economy is a major factor that forces the local people to make a move.
Rural Economy There is a strong link between low economic growth and migration. In the area, three major economic activities: agriculture especially paddy cultivation, fishing and mak-ing thatch are prominent in the area.
Figure3: Work Places of Migrants(Source: Interviews, 2015)

69Rural Urban Migration in Ayeyarwady Region
AgricultureAgriculture is always associated with natural risks. The poor farmers, especially in developing countries are most vulnerable to these risks. In the study area, the major-ity of the poor are engaged in agriculture. Risk in agriculture is mainly related to salt water intrusion.
Although paddy is a major crop in the area, paddy cultivated area decreased due to crop loss caused by salt water intrusion. As salt water intrudes into the paddy field when the ears of the paddy begin to appear and it causes grain loss in paddy cultivation. According to questionnaire’s results, 88 percent of the farmers cultivate paddy and 62 percent of the paddy cultivars said, they reduce their paddy cultivated area and left some paddy land as fallow land due to salt intrusion, crop loss and low benefit.
The potential yield of rice varieties in Myanmar is about 6 tons per ha (120 baskets per acre), but farmers in study area can only produce around 3.5 tons per ha (70 baskets per acre) (Than Htike Oo and Myo Myo, 2009). In the area, according to interviews, actual average productivity of paddy is about 1 tons per ha (20 basket per acre). It is mainly caused by salt water intrusion. Low agricultural productivity is one of the factors that causing migration.
Land preparation for paddy cultivation is done in March, April and May. Then, the land is ploughed in June and July. They collect the organic waste and bring them to their fields. Then they fire paddy stalks and organic waste for the purpose of increasing fertility. When the monsoon sets in, plowing is done by using cows and buffalo only. Farmers in the area do not use agricultural machinery because of less investment. In August, paddy seeds are broadcast in the fields. They use only broad-casting method in paddy cultivation due to high labour cost caused by migration.
Figure4: Education level of Migrants(Source: Interviews, 2015)

70 Myint Thida
Some farmers add fertilizers and pesticides into paddy field but most farmers cannot afford to buy fertilizers and pesticides due to high price and they can not use input in paddy cultivation. The ears of the paddy begin to appear in November. At that time, rainfall decreases in November and salt water intrudes into the paddy field. Then paddy plants become wilted and most paddy plants die. Therefore, yield is low and low yield gives insufficient income which causes migration.
FishingAs the study area is located near the streams, fishing is also found in the area. The first contract is formally permitted by government and the second one is allowed by the first contract. The first contract must pay about 10,000,000 Kyats (8,000$) to the government to get permission on fishing in the whole area and second contract about 2,500,000 Kyats (2000$) to the first contract for getting a permission to catch fishes along the stream. The second contract has a permission to fish along a stream. Under the second contract, there are many small contracts that are allowed by sec-ond contract for fishing at an area. The individual fisherman has to take permission from these groups to fish in the stream allowed. According to interviews, fishes are caught throughout the whole year but amount of fish-catch is higher in July and August. Although the amount of fish-catch is higher in the period, price falls due to higher supply and local people get low income. Therefore, the young adults of the fishermen’s members move to other areas to get regular income. Average income of a fisherman is about more than 3000 Kyats per day (>3$).
Making ThatchAs the study area is located near the coastal area, there are large areas of Nippa land. Most farmers depend on the Nippa land on their economy by making thatch. Leaves of thatch are cut twice a year: November and April. The leaves cut in November are known as summer leaves which are old and in April as the rainy season leaves which are young. The rainy season leaves are not as much expensive as thatch cut in No-vember due to young leaves.
In the area, two types of making thatch are found. Some families buy a pack of raw material (Nippa leaves) of thatch roof and make them into thatch at home. These families make thatches by using family members and they get average income of about 3000 Kyats (> 3$) per day.
Some persons go to the thatch depot and work as daily wage earners. Accord-ing to interview, a man or woman can earn about 1500 Kyats (about 1$) per day by working at depot. Thatches are sent to Yangon by boats. Making thatch is also a seasonal work and local people do not have regular income.
In Ahmar Sub-Township, labour wage is about 3000 Kyats /day (>2$ per day).

71Rural Urban Migration in Ayeyarwady Region
But, people in the area do not have regular income. In agriculture, labour is needed only in planting and harvesting period. Most works in agriculture is done by family members. Making thatch is done twice per year; first time in December and Janu-ary and second time in May and June. People do not income from making thatch in remaining months.
Pull FactorsMajor pull factors of the urban area is regular income and other pull factors are better living standard, higher job choice, greater recreational activities and better environment. Most migrants move to Hlaingtharyar Township in Yangon Region. Hlaingtharyar Township is located in North Yangon District and more than 600 factories are housed in this industrial zone. It attracts migrant workers from rural areas. Hlaingtharyar is about 70 miles (112 kilometers) from Phyapon District and it takes about 4 hours only. It is also a pull factor that attracts migrants from Ahmar Sub-township.
Plate 1: Laid down the fishing net along the streams (20.6.15)
Plate 3 : Selection fish on the boat (20.6.15)
Plate 2: fishing along the streams (20.6.15)
Plate 4 : Selection fish at depot (20.6.15)

72 Myint Thida
Impacts of MigrationThe ‘impact’ of migration depends on the numbers involved, the duration of absence, the effect of both absence and possible return (Lipton, 1980). In the study area, most migrants do not usually return and impacts of migration are distinct in agri-culture. According to interviews, permanent and chain migration is mainly found. Some young adults moved to urban areas of Phyapon and Yangon and they got mar-ried. Then, they settle in these areas. Therefore, permanent migration is found. Some moved to urban area, look for jobs for the relatives and their younger. After that, young adults lived in the study area moved to the places where the relatives and the elders live and chain migration occurs.
In Amar Sub-Township, according to interviews, most young adults moved to other urban areas and the number of adults is low. Therefore, labour shortage resulted in and labour cost is high. Average labour cost is 90000 Kyats or 100,000
Plate 5: Nippa plant along the streams (24.4.15)
Plate 7 : Making thatch by family members (24.4.15)
Plate 6: Nippa leaves (Tebinseik Village) (24.4.15)
Plate 8 : Transport to Yangon by boat (24.4.15)

73Rural Urban Migration in Ayeyarwady Region
Kyats (70$ or 80$) per month and it is also difficult to get labour. Labour charges have to be paid in advance before planting and harvesting time due to labour short-age. These problems affect agriculture because agricultural works such as planting, harvesting have to be done in time to prevent from untimely rain.
CoNCLUSIoNAh Mar Sub-township is located in coastal area of Myanmar. Migration is distinct in the area and economic, educational and health reasons play important role in migration. Although there are 3 major reasons, economic reason is most impor-tant and is a major push factor. Ineffective rural economic activities are agriculture, fishing and making thatch. These are seasonal work and local people engaged in agriculture encounter crop loss caused by salt water intrusion. Therefore, according to interviews, one or more family member of the most families moves to urban area for regular income. Some migrants got married in the urban areas and permanent migration occurred. In the rural area, rural depopulation, labour shortage and high labour cost become distinct. Much labour force is needed in agriculture to harvest the crops in time because irregular and untimely rain causes crop loss which af-fects low yield and low return. It is necessary to build large embankment (Tar) to protect salt water intrusion for the purpose of getting higher income and reducing the number of migrants form the area. Moreover, it is necessary to open vocational schools for the school dropouts in the area to keep labour force, to establish small and medium scale enterprises in which job opportunities should be created for those who complete vocational trainings and to protect the area from rural depopulation.
Figure5: Causes and impacts of migration

74 Myint Thida
REFERENCESChoucri, N., 1978, Migration Processes among Developing Countries: The Middle East,
Center for International Studies, Massachusetts Institute of Technology Cambridge.
Lipton, M., 1980, Migration from Rural Areas of Poor Countries: The Impact on Rural Productivity and Income Distribution, World Development Vol. 8 pp. l-24.
Maharjan, A., Siegfried, B., Knerr, B. , 2013, Migration for labour and its impact on farm production in Nepal, Working Paper IV, Centre for the Study of Labour and Mobility, Kuleshwor, Kathmandu.
McCatty, M.,2004, The Process of Rural-Urban Migration in Developing Countries, Department of Economics Carleton University, Ottawa, Ontario.
Mendola, M., 2006, Rural out-migration and economic development at Origin: What do we know?, University of Milano-Bicocca and Centro Studi L. d’Agliano.,Sussex Migration Working Paper No 40.
Than Htike Oo and Myo Myo, 2009, Experts push for assistance to paddy farmers, Myanmar’s first international weekly, Volume 23, No. 457.
Roberts, K.D., 2001, The determinants of job choice by rural labour migrants in Shanghai, China Economic Review (2001) pp-15-39.

75
Study on Agricultural Labor Migration of Selected Farm Households in Kyaukpadaung Township, Dry Zone, Myanmar
Nandar Aye Chan1, Theingi Myint2
1. Assistant Lecturer, Department of Agricultural Economics, Yezin Agricultural University ([email protected])
2. Supervisor, Associate Professor, Department of Agricultural Economics, Yezin Agricultural University, Corresponding author. ([email protected])
ABSTRACTThe study was made to examine agricultural labor migration in Kyauk-padaung township, dry zone area in October 2014. Data collection was done on 59 migrant farm households from two sample villages through household survey and field observation. In the study area, about one fourth of household members were migrants who were mostly young and active men. Common migration was internal (rural to urban out-migration) and about one third of migration were international (cross-border migration). The push factors of rural out-migration were mostly associated with declin-ing opportunities in agriculture because of weed problem and bad weather condition. The pull factors of out-migration to other places were better economic and employment opportunities, high income and congenial liv-ing standard of new destination places. Regarding the household income, remittance was significantly high and it was about half of total households’ income. As the positive view of migration, the remittance was used mainly for agricultural investment for their crop and livestock production. In the study, migrant farm households can more invest in crop production such as input used, hired labor in farming activities etc. Therefore, higher yield and profit were earned by migrant farm households. Due to impact of migra-tion, the original resident areas faced the labor shortage problem in farming especially during the peak season. High labor cost, labor unavailability in time, unskilled female and child labor were observed in the agricultural sector.
Key Words: migrant, labor, remittance, migration
INtRoDUCtIoNMigration is the movement of people from one location to another and widely as-sociated with change of permanent place of residence. Rural out-migration and agricultural crop production are key livelihood strategies in many rural areas of

76 Nandar Aye Chan, Theingi Myint
agro-based developing countries nonetheless the relationship between migration, agriculture and rural development has become an interesting argument in the study of economic development. In developing countries, the major source of income, food and employment opportunities are still provided from the agriculture sector (World Bank, 2008). Small studies of migration in Myanmar, as a part of Qualitative Social and Economic Monitoring (QSEM) revealed that migration is a common coping strategy, with 26-30% of all households having a family member migrating, and overall village population migration levels ranging from less than 2% in Shan State to over 10% in Mandalay Region. International, non-seasonal migration was the highest in States bordering neighboring countries, whilst in the central and delta areas, the migration was predominantly internal and seasonal (LIFT/World Bank, 2014).
Myanmar’s total population is 51.41 million and 70 percent of the population lives in rural areas (Ministry of Immigration and Population, 2014). Since agricul-ture is the major income source and employment in the rural areas, farm labor is a major source of employment opportunity for the rural labor force. However, farming activities are gradually unattractive for them because of unstable crop production, inadequate credit, and adverse climate condition etc. Under such conditions, most of the households commonly practice income diversification strategies, including labor migration. Therefore, the rural out-migration within and between the countries is one of the most important issues and it receives a particular consideration for alter-native economic development.
The specific objectives of the study are –1. To describe the profile of migrants and migration patterns in the study area2. To compare income composition of migrant and non-migrant farm house-
holds in the study area3. To examine cost & return analysis in the cropping pattern of migrant and
non-migrant farm households
MEtHoDoLogyData Collection and AnalysisPrimary data were collected from two sample villages – Inn Taw and Ywar Tan Shay in Kyaukpadaung township. By using the purposive sampling method and field ob-servation, data were collected from 59 migrant and 58 non-migrant farm households during October 2014. Descriptive statistics were applied to show the socio-econom-ic and demographic characteristics of household heads and migrants, reasons of out-migration, contribution of remittances in crop production and income composition.

77Study on Agricultural Labor Migration of Selected Farm Households
RESULtS AND DISCUSSIoNDemographic Characteristics of Sample Farm Households in the Study Areaa) Household headsThe demographic characteristics of sample farm households in the study area are de-scribed in Table 1. The results of t-tests showed that male and female headed house-holds were not significantly different between migrant and non-migrant household heads. It was found that 80% of migrant farm household heads and 86% of non-migrant farm household heads were male while 20% of migrant farm household heads and 14% of non-migrant farm household heads were female. Therefore, male headed households were traditionally dominant in the study area. The average age of sample household heads was around 57 years in migrant farm households and 52 years in non-migrant farm households. According to the t-test results, these average ages of H/H heads were significantly different at 5% level.
In the study area, the education levels of migrants’ household heads were found in monastery (31%), primary (20%) and secondary (19%) respectively. And also, the education levels of non-migrant farm households’ heads were found in monastery (19%), primary (24%) and secondary (24%) respectively. There were no differences between educational levels of migrant and non-migrant farm households’ heads in the study area.
10
Maharjan, A. &TheingiMyint.2015. Internal Labor Migration Study in the Dry Zone, Shan
State and the Southeast of Myanmar, HELVETAS Swiss Intercooperation Myanmar.
Ministry of Immigration and Population. 2014. Myanmar Population and Housing Census.
Census report volume II.
World Bank. 2008. World Development Report 2008: Agriculture for Development: World
Bank.
Table 1 Demographic characteristic of migrant and non-migrant household heads
Item Migrant farm HHH (N = 59)
Non-migrant farm HHH (N = 58)
Total HHH (N = 117)
Female headed HH 12 (20.3%) 8 (13.8%) 20 (17.1%) Male headed HH 47 (79.7%) 50 (86.2%) 97 (82.9%) Total 59 (100%) 58 (100%) 117 (100%) t-test t=0.936, sig= 0.315ns, df= 115 Average age (Year) 57 52
t-test t=2.585, sig= 0.011**, df= 115 Educational level
Illiterate 5 (8.5%) 3 (5.2%) 8 (6.8%) Monastery 18 (30.5%) 11 (19.0%) 29 (24.8%) Primary 12 (20.3%) 14 (24.1%) 26 (22.2%) Secondary 11(18.6%) 14 (24.1%) 25(21.4%) High school 10 (16.9%) 15 (25.9%) 25 (21.4%) Graduated level 3 (5.1%) 1(1.7%) 4 (3.4%) t-test t=-1.274, sig=0.205ns, df= 115 ** Significant at 5% probability and ns = non-significant
Table 2 Demographic characteristics of migrant and non-migrant household members
Item Migrant farm HHM (N = 264)
Non-migrant farm HHM (N = 201)
Total HHM (N = 465)
Female 145 (54.92%) 132 (65.67%) 277 (59.69%) Male 119 (45.08%) 69 (34.33%) 188 (40.30%) Total 264 (100%) 201 (100%) 465 (100%) t-test t=3.802, sig= 0.000***, df= 115 Age (Year) >15 42 (15.91%) 50 (24.88%) 15-24 68 (25.76%) 46 (22.89%) 25-45 104 (39.39%) 67 (33.33%) 46-55 18 (6.82%) 12 (5.97%) 55+ 32 (12.12%) 26 (12.94%)
Table1: Demographic characteristic of migrant and non-migrant household heads

78 Nandar Aye Chan, Theingi Myint
b) Household membersThe demographic characteristics of sample farm household members in the study area are shown in Table 2. The total number of household members was 264 in migrant farm households and 201 in non-migrant farm households. The popula-tion of female in migrant farm households (55%) and non-migrant farm households (66%) were higher than male population in migrant farm households (45%) and non-migrant farm households (34%). The results of t-tests showed that the gender status were highly significantly different between migrant and non-migrant house-hold members at 1% level. Between ages of 15-45, it was observed that middle-aged members in migrant farm households were higher than non-migrant farm house-holds (172 > 113 members).
According to the education levels, primary (25%), secondary (22%), high school (22%) and graduate (16%) were found in migrant farm households whereas primary (40%), secondary (18%), high school (16%) and graduate (4%) were found in non-migrant farm households. The educational level was significant at 5% level between migrant and non-migrant farm households’ members. Therefore, it was ob-served that the educational level of migrant farm households’ members were higher
10
Maharjan, A. &TheingiMyint.2015. Internal Labor Migration Study in the Dry Zone, Shan
State and the Southeast of Myanmar, HELVETAS Swiss Intercooperation Myanmar.
Ministry of Immigration and Population. 2014. Myanmar Population and Housing Census.
Census report volume II.
World Bank. 2008. World Development Report 2008: Agriculture for Development: World
Bank.
Table 1 Demographic characteristic of migrant and non-migrant household heads
Item Migrant farm HHH (N = 59)
Non-migrant farm HHH (N = 58)
Total HHH (N = 117)
Female headed HH 12 (20.3%) 8 (13.8%) 20 (17.1%) Male headed HH 47 (79.7%) 50 (86.2%) 97 (82.9%) Total 59 (100%) 58 (100%) 117 (100%) t-test t=0.936, sig= 0.315ns, df= 115 Average age (Year) 57 52
t-test t=2.585, sig= 0.011**, df= 115 Educational level
Illiterate 5 (8.5%) 3 (5.2%) 8 (6.8%) Monastery 18 (30.5%) 11 (19.0%) 29 (24.8%) Primary 12 (20.3%) 14 (24.1%) 26 (22.2%) Secondary 11(18.6%) 14 (24.1%) 25(21.4%) High school 10 (16.9%) 15 (25.9%) 25 (21.4%) Graduated level 3 (5.1%) 1(1.7%) 4 (3.4%) t-test t=-1.274, sig=0.205ns, df= 115 ** Significant at 5% probability and ns = non-significant
Table 2 Demographic characteristics of migrant and non-migrant household members
Item Migrant farm HHM (N = 264)
Non-migrant farm HHM (N = 201)
Total HHM (N = 465)
Female 145 (54.92%) 132 (65.67%) 277 (59.69%) Male 119 (45.08%) 69 (34.33%) 188 (40.30%) Total 264 (100%) 201 (100%) 465 (100%) t-test t=3.802, sig= 0.000***, df= 115 Age (Year) >15 42 (15.91%) 50 (24.88%) 15-24 68 (25.76%) 46 (22.89%) 25-45 104 (39.39%) 67 (33.33%) 46-55 18 (6.82%) 12 (5.97%) 55+ 32 (12.12%) 26 (12.94%)
11
Educational level
Illiterate 18 (6.8%) 23 (11.4%) 41 (8.8%) Monastery 23 (8.4%) 21 (10.4%) 44 (9.3%) Primary 65 (24.7%) 81 (40.3%) 146 (31.5%) Secondary 58 (22.1%) 37 (18.4%) 95 (20.5%) High school 57 (21.7%) 32 (15.9%) 89 (19.2%) Graduated level 43 (16.3%) 7 (3.5%) 50 (10.8%) t-test t= 0.484, sig= 0.000**, df= 115 *** and ** significant at 1% and 5% probability levels respectively and ns = non-significant
Table 3 Family size and dependency ratio of migrant and non-migrant farm households
Items Migrant farm HH (N = 59)
Non-migrant farm HH (N = 58) Total
Family size
Mean 6 5 5 Minimum 2 2 2 Maximum 10 7 10 t-test t=3.80, sig= 0.000***, df= 115 Dependency ratio
0-19% 27 (45.8%) 19 (32.8%) 46 (39.3%) 20-39% 17 (28.8%) 18 (31.0%) 35 (29.9%) 40-59% 11 (18.6%) 12 (20.7%) 23 (19.7%) 60% & above 4 (6.8%) 9 (15.5%) 13 (11.1%) Average ratio 21.1% 28.7% 24.9% t-test t= -1. 943, sig= 0.055**, df= 115 *** and ** significant at 1% and 5% probability levels respectively
Table 4 Socio-economic characteristics of migrants in the sample households
Item Male Female Total
Gender (No.) 71 (89.9%) 8 (10.1%) 79 (100%)
Mean Minimum Maximum
Age (Years) 24 12 52
Age of migrants when
migrated (Years) 22 11 36
Education (Years) 10 5 14
Years of migration 4.3 0.5 30
Migration rate 25% (1/4 of 323 total population in migrant FHHs)
Table2: Demographic characteristics of migrant and non-migrant household members

79Study on Agricultural Labor Migration of Selected Farm Households
than non-migrant farm households’ members in the study area.
Family Size and Dependency Ratio of Sample Farm Households in the Study AreaThe family size and dependency ratio were compared between migrant and non-migrant farm households (Table 3). The average family size of migrant farm house-holds was 6 ranging from 2 to 10 and the average family size of non-migrant farm households was 5 ranging from 2 to 7. According to the t-test results, the average family size was highly significantly different at 1% level among migrant and non-migrant farm households. In Myanmar traditional custom, dependent members who are lower than 14 years and above 65 years are considered as school-age-children and elder people respectively. When analyzing household members by age category, there were 42 and 50 household members under 15 years in migrant and non-migrant farm households. The working-aged household members have to take care for both dependent groups although they are partially concerned in household livelihood ac-tivities. The average dependency ratios of migrant and non-migrant farm households were 21% and 29% respectively. Therefore, number of dependents in non-migrant farm households was higher than migrant farm households.
Profile of Migrants in Kyaukpadaung townshipThe total number of migrants was 25% out of 323 populations in the 59 sample mi-grant farm households. Among them, 90% were male and 10% were female. The av-erage age of migrants was 24 years old ranging from 12 to 52 years. The average age
11
Educational level
Illiterate 18 (6.8%) 23 (11.4%) 41 (8.8%) Monastery 23 (8.4%) 21 (10.4%) 44 (9.3%) Primary 65 (24.7%) 81 (40.3%) 146 (31.5%) Secondary 58 (22.1%) 37 (18.4%) 95 (20.5%) High school 57 (21.7%) 32 (15.9%) 89 (19.2%) Graduated level 43 (16.3%) 7 (3.5%) 50 (10.8%) t-test t= 0.484, sig= 0.000**, df= 115 *** and ** significant at 1% and 5% probability levels respectively and ns = non-significant
Table 3 Family size and dependency ratio of migrant and non-migrant farm households
Items Migrant farm HH (N = 59)
Non-migrant farm HH (N = 58) Total
Family size
Mean 6 5 5 Minimum 2 2 2 Maximum 10 7 10 t-test t=3.80, sig= 0.000***, df= 115 Dependency ratio
0-19% 27 (45.8%) 19 (32.8%) 46 (39.3%) 20-39% 17 (28.8%) 18 (31.0%) 35 (29.9%) 40-59% 11 (18.6%) 12 (20.7%) 23 (19.7%) 60% & above 4 (6.8%) 9 (15.5%) 13 (11.1%) Average ratio 21.1% 28.7% 24.9% t-test t= -1. 943, sig= 0.055**, df= 115 *** and ** significant at 1% and 5% probability levels respectively
Table 4 Socio-economic characteristics of migrants in the sample households
Item Male Female Total
Gender (No.) 71 (89.9%) 8 (10.1%) 79 (100%)
Mean Minimum Maximum
Age (Years) 24 12 52
Age of migrants when
migrated (Years) 22 11 36
Education (Years) 10 5 14
Years of migration 4.3 0.5 30
Migration rate 25% (1/4 of 323 total population in migrant FHHs)
Table3: Family size and dependency ratio of migrant and non-migrant farm households

80 Nandar Aye Chan, Theingi Myint
when they started migration was 22 years. The oldest age at the initial migration was 36 years and youngest was 11 years. In this case, most of these migrants were young male and their average education was 10 years. In the study area, the minimum year of migration was 6 months and maximum was 30 years with an average of 4 years. Regarding the relationship of migrants in their households, most of the migrants (77%) were son (Tables 4 & 5).
Pull and Push Factors of Migration in the Study AreaThe push factors for migration were insufficient farm income (11%) probably due to crop damaged (3%) by irregular rainfall and weed problem, and consequently they got low wages (8%) from agriculture. Some migrants reported that they were surplus labors (7%) in their households because of small farm land holding (4%) and few job opportunities (4%) in their village. Therefore, they were unemployed and looked for job opportunities near urban area, Kyaukpadaung or migrating to other places and
11
Educational level
Illiterate 18 (6.8%) 23 (11.4%) 41 (8.8%) Monastery 23 (8.4%) 21 (10.4%) 44 (9.3%) Primary 65 (24.7%) 81 (40.3%) 146 (31.5%) Secondary 58 (22.1%) 37 (18.4%) 95 (20.5%) High school 57 (21.7%) 32 (15.9%) 89 (19.2%) Graduated level 43 (16.3%) 7 (3.5%) 50 (10.8%) t-test t= 0.484, sig= 0.000**, df= 115 *** and ** significant at 1% and 5% probability levels respectively and ns = non-significant
Table 3 Family size and dependency ratio of migrant and non-migrant farm households
Items Migrant farm HH (N = 59)
Non-migrant farm HH (N = 58) Total
Family size
Mean 6 5 5 Minimum 2 2 2 Maximum 10 7 10 t-test t=3.80, sig= 0.000***, df= 115 Dependency ratio
0-19% 27 (45.8%) 19 (32.8%) 46 (39.3%) 20-39% 17 (28.8%) 18 (31.0%) 35 (29.9%) 40-59% 11 (18.6%) 12 (20.7%) 23 (19.7%) 60% & above 4 (6.8%) 9 (15.5%) 13 (11.1%) Average ratio 21.1% 28.7% 24.9% t-test t= -1. 943, sig= 0.055**, df= 115 *** and ** significant at 1% and 5% probability levels respectively
Table 4 Socio-economic characteristics of migrants in the sample households
Item Male Female Total
Gender (No.) 71 (89.9%) 8 (10.1%) 79 (100%)
Mean Minimum Maximum
Age (Years) 24 12 52
Age of migrants when
migrated (Years) 22 11 36
Education (Years) 10 5 14
Years of migration 4.3 0.5 30
Migration rate 25% (1/4 of 323 total population in migrant FHHs)
12
Table 5 Relationship of migrants with household heads
Relationship of migrants Migrants (N=79)
No. Percent
Son 61 77.2
Daughter 8 10.1
Son-in-law 7 8.9
Household head 2 2.5
Relative 1 1.3
Total 79 100
Table 6 Various reasons for out migration of sample migrant farm households
Reasons Percent
Reasons Percent
To seek better job/ salary 31 Few job opportunities in village 4
Insufficient farm income 11 Family food insecurity 4
To be better living standard 9 Family social problem 4
Low wages 8 Crop damaged due to climate 3
Surplus labors in HH 7 To build a house 2
For education purpose 6 Repayment for debt 1
To invest for agriculture 6 Total 100
Small farm land 4
Table 7 Types of migration and patterns in the sample migrant farm households
Item No. Percent
Types of migration
- Rural to urban (internal migration) 52 66
- Abroad (international migration) 27 34
Pattern
- Permanent 14 18
- Temporary 43 54
- Seasonal 22 28
Table4: Socio-economic characteristics of migrants in the sample households
Table5: Relationship of migrants with household heads

81Study on Agricultural Labor Migration of Selected Farm Households
neighboring countries to work as causal labors. Another factors influencing decision for out-migration were family food insecurity (4%) and family social problem (4%).Some rural households were in debt to pay back loan borrowed from money lenders to invest in agricultural production (7%).
The main pull factors for the migrant location were high salary income and better job opportunities (31%) in the new destination places and for education pur-pose (6%) (Table 6).
types of Migration and PatternsIn the study area, two types of migration were examined- rural to urban or inter-nal migration (66%) and abroad or international migration (34%). The destination places for internal migration were Yangon, Magway, Lashio and Muse townships. As international migration, most of migrants went to Malaysia and Thailand.
According to the return time interval and their migration period, three pat-
12
Table 5 Relationship of migrants with household heads
Relationship of migrants Migrants (N=79)
No. Percent
Son 61 77.2
Daughter 8 10.1
Son-in-law 7 8.9
Household head 2 2.5
Relative 1 1.3
Total 79 100
Table 6 Various reasons for out migration of sample migrant farm households
Reasons Percent
Reasons Percent
To seek better job/ salary 31 Few job opportunities in village 4
Insufficient farm income 11 Family food insecurity 4
To be better living standard 9 Family social problem 4
Low wages 8 Crop damaged due to climate 3
Surplus labors in HH 7 To build a house 2
For education purpose 6 Repayment for debt 1
To invest for agriculture 6 Total 100
Small farm land 4
Table 7 Types of migration and patterns in the sample migrant farm households
Item No. Percent
Types of migration
- Rural to urban (internal migration) 52 66
- Abroad (international migration) 27 34
Pattern
- Permanent 14 18
- Temporary 43 54
- Seasonal 22 28
Table6: Various reasons for out migration of sample migrant farm households
Table7: Types of migration and patterns in the sample migrant farm households

82 Nandar Aye Chan, Theingi Myint
terns of migration were found in this study. They are (1) permanent migration (left their native place for good), (2) temporary migration (return to the original place of residence sometimes), and (3) seasonal migration (take place only in a certain time of the year). In this study, it was observed that 18% of migration were permanent, 54% were temporary and 28% seasonal (Table 7).
Source of Information about the MigrationAmong 79 migrants, 40% of the internal migrants got the information on migration from friends. About one fourth (27%) of internal migrants worked in other places by their own decision. Only 4% of internal migrants got information through their family members working in new destination place. For international migration, 42% of migrants decided to go abroad through job seeking agents and companies. Some migrants (12%) decided to migrate abroad and looked for a job through returned migrants and current migrated people abroad (Figure 1).
Source of Initial Migration CostIn case of initial migration cost which included travel cost and fee for agent, 33% of migrant workers had to use the costs of migrating with their parents’ money and 14
Figure 1 Source of migration information for sample migrant farm households
Figure 2 Source of initial migration cost of migrants in the study area
Figure 3 Time interval of sending remittance by migrants
Figure 4 Remittance utilized by sample migrant farm households
42.4
27.3 18.2
6.1
6.1
8.9
26.7 40.0
15.6
4.4 4.4
0 10 20 30 40 50
From job hunting agents & companies
Own decision to migrate
From friends
From current migrate people
From return migrants
From family members
% of Migrants
Sour
ce o
f mig
ratio
n in
form
atio
n Internal migration International migration
23.0%
1.4% 2.7%
4.1% 4.1%
16.2% 17.6%
31.1%
0 10 20 30 40 50
No cost
From own saving Loan borrowed from friend
Sold land Sold other property
Loan borrowed from relatives Loan borrowed from others
From parents
% of Migrants
Sour
ce o
f ini
tial m
igra
tion
cost
0 20 40 60
Monthly Once in 2 months
Once in 6 months
Once in a year
No received
45.8
11.9 10.2 22.0
10.2
% o
f Rem
ittan
ce
sent
by
mig
rant
s
Time interval
0.6% 2.8%
4.5% 5.6%
7.3% 14.0%
32.6% 32.6%
0 10 20 30 40 50
Other Saving
Health care Education
Debt repayments Social affairs
Basic food need Investment in crop & livestock production
% of Migrant FHH
Rem
ittan
ce u
tiliz
atio
n
14
Figure 1 Source of migration information for sample migrant farm households
Figure 2 Source of initial migration cost of migrants in the study area
Figure 3 Time interval of sending remittance by migrants
Figure 4 Remittance utilized by sample migrant farm households
42.4
27.3 18.2
6.1
6.1
8.9
26.7 40.0
15.6
4.4 4.4
0 10 20 30 40 50
From job hunting agents & companies
Own decision to migrate
From friends
From current migrate people
From return migrants
From family members
% of Migrants
Sour
ce o
f mig
ratio
n in
form
atio
n Internal migration International migration
23.0%
1.4% 2.7%
4.1% 4.1%
16.2% 17.6%
31.1%
0 10 20 30 40 50
No cost
From own saving Loan borrowed from friend
Sold land Sold other property
Loan borrowed from relatives Loan borrowed from others
From parents
% of Migrants
Sour
ce o
f ini
tial m
igra
tion
cost
0 20 40 60
Monthly Once in 2 months
Once in 6 months
Once in a year
No received
45.8
11.9 10.2 22.0
10.2
% o
f Rem
ittan
ce
sent
by
mig
rant
s
Time interval
0.6% 2.8%
4.5% 5.6%
7.3% 14.0%
32.6% 32.6%
0 10 20 30 40 50
Other Saving
Health care Education
Debt repayments Social affairs
Basic food need Investment in crop & livestock production
% of Migrant FHH
Rem
ittan
ce u
tiliz
atio
n
Figure1: Source of migration information for sample migrant farm households
Figure2: Source of initial migration cost of migrants in the study area

83Study on Agricultural Labor Migration of Selected Farm Households
own saving. Most migrants (37%) reported that initial migration cost was covered by borrowing money from friends, relatives and others. Some migrants (8%) sold the properties in which 4% of migrants sold land for migration cost. However, 23% of migrant workers had no specific migration costs because their migrated area was within local area (Figure 2).
types of occupation of Migrants Before and After MigrationIn case of occupation of migrants before migration, the highest percentage (23%) worked in farm activities as family labor whereas 22% of migrants worked in the car workshop. Another 22% of migrants were students before migration. Regarding with agricultural work, farmers (8%), agricultural wage labor (5%), livestock raising (1%) were found respectively. After migration, 37% of migrant worked as industrial workers. Furthermore, after migration migrants worked as bus drivers and assistant (19%), causal labor (19%) and government employees (11%) respectively.
The occupation of migrants regarding the agricultural and other sector, 37% of migrants worked in the agricultural sector and 63% of migrants worked in other sectors before migration. After migration, there were no migrants who worked in the agricultural sector. All migrants were working in the non-agricultural sectors at the present condition (Table 8).
Remittance Received by Sample Migrant Farm HouseholdsAmong 59 sample migrant farm households, about 90% have received remittances
13
Table 8 Types of occupation of migrants in the sample migrant farm households
No. Types of occupation Before (%) Types of occupation Current (%) 1 Family Labor 22.8
Worker in industry 36.7
2 Student 21.5
Causal labor 19.0 3 Car workshop 21.5
Bus driver &assistant 18.9
4 Farmer 7.6
Government staff 11.4 5 Agricultural wage labor 5.1
Private company staff 6.3
6 Causal labor 5.1
Student 3.8 7 Dependent/ Unemployed 5.1
Grocery (Small shop) 2.5
8 Worker in industry 3.8
Dependent/ Unemployed 1.3 9 Private company staff 2.5
Total 100
10 Government staff 2.5
11 Livestock raising 1.3
12 Bus driver & assistant 1.3
Total 100
Table 9 Comparison of before and current monthly income earned by migrants
Item Mean Minimum Maximum
Before migration (MMK/month) 13,508 0 70,000
At present (MMK/month) 157,918 15,000 400,000
Table 10 Enterprise budget of sesame and pigeon pea production
Item Unit Migrant farm HH (N=47)
Non-migrant farm HH (N=43)
Sesame Yield Bsk/ac 3.27 2.81
Price MMK/bsk 41,149 36,423
Pigeon pea
Yield Bsk/ac 6.10 5.24
Price MMK/bsk 19,872 19,581
Total gross benefit MMK/ac 255,799 205,066
Total variable cost MMK/ac 207,512 195,442
Net benefit MMK/ac 48,287 9,624
Benefit Cost Ratio (BCR) 1.23 1.05
Table8: Types of occupation of migrants in the sample migrant farm households

84 Nandar Aye Chan, Theingi Myint
from migrant family members. The remittance received by migrant farm households was varied with different time interval. Among them, 46% of migrants sent monthly money to their family. Various remittance receiving intervals were once a year (22%), once per 2 months (12%) and 6 months interval (10%) respectively (Figure 3).
Remittance Utilized by Sample Migrant Farm householdsThe utilization of remittance by the receiving households was analyzed separately in order to identify the allocation of remittance money in their households’ needs. About one third of the migrant farm households (33%) utilized remittance money to invest in crop and livestock production which included for buying inputs (11%), for buying farmland (7%) and for hired labor wage (13%). And then, 32% of migrant farm households allocated remittance money for basic needs (food, clothing and shelter) of household subsistence. Another 14% of migrant farm households spent for social affairs, 7% for debt repayments, 6% for education, 5% for health care and 3% for saving (Figure 4).
Impact of Migration on Households’ IncomeNormally the current highest income was 400,000 MMK per month while the mi-grants got the highest income about 70,000 MMK per month before they migrated. Some migrants did not have income before out-migration. The average monthly
14
Figure 1 Source of migration information for sample migrant farm households
Figure 2 Source of initial migration cost of migrants in the study area
Figure 3 Time interval of sending remittance by migrants
Figure 4 Remittance utilized by sample migrant farm households
42.4
27.3 18.2
6.1
6.1
8.9
26.7 40.0
15.6
4.4 4.4
0 10 20 30 40 50
From job hunting agents & companies
Own decision to migrate
From friends
From current migrate people
From return migrants
From family members
% of Migrants
Sour
ce o
f mig
ratio
n in
form
atio
n
Internal migration International migration
23.0%
1.4% 2.7%
4.1% 4.1%
16.2% 17.6%
31.1%
0 10 20 30 40 50
No cost
From own saving Loan borrowed from friend
Sold land Sold other property
Loan borrowed from relatives Loan borrowed from others
From parents
% of Migrants
Sour
ce o
f ini
tial m
igra
tion
cost
0 20 40 60
Monthly Once in 2 months
Once in 6 months
Once in a year
No received
45.8
11.9 10.2 22.0
10.2
% o
f Rem
ittan
ce
sent
by
mig
rant
s
Time interval
0.6% 2.8%
4.5% 5.6%
7.3% 14.0%
32.6% 32.6%
0 10 20 30 40 50
Other Saving
Health care Education
Debt repayments Social affairs
Basic food need Investment in crop & livestock production
% of Migrant FHH
Rem
ittan
ce u
tiliz
atio
n
Figure3: Time interval of sending remittance by migrants
Figure4: Remittance utilized by sample migrant farm households

85Study on Agricultural Labor Migration of Selected Farm Households
income before out migration was 13,508 MMK and current monthly income after migration was 157,918 MMK. The migrated place had more income earning op-portunity than their native area (Table 9).
The income compositions in migrant and non-migrant farm households were described in Figure 5. In the study area, it was observed that migrant farm house-holds earned their family income mainly from two main sources, i.e., remittance and farm income while non-migrant farm households earned family income mainly from three sources, i.e., farm income, off-farm and non-farm income. In both mi-grant and non-migrant farm households, farm income obtained from sale of crops such as sesame, pigeon pea, groundnut, green gram and cowpea. Some farm house-holds earned the household income from non-farm activities which are working in industry and construction sites, working in government and private services, handi-craft and cottage.
According to the observed income composition of migrant farm households, annual income from remittance was the largest amount and it took 43% of the total incomes. Annual income from crop production was 26% of the total income. Other sources of income were 17% from non-farm activities, 11% from off-farm activi-
15
Figure 5 Income compositions of migrant and non-migrant households
Figure 6 Labor management problems of sample migrant farm households
Figure 7 Problems solving of agricultural labor requirement in the crop production
Crop 26%
Animal husbandry
3% Remittance 43%
Off-farm income 11%
Non-farm activities
17%
Migrant FHH
Crop 32%
Animal husbandry
6% Off-farm income
31%
Non-farm activities
31%
Non-migrant FHH
10%
1%
5%
14%
17%
54%
0 10 20 30 40 50 60
No problem
Affect livestock farming
Not affective as family labor
Difficulties in crop cultivation
High wages
Unavailable in time
% of Migrant farm households
Lab
or m
anag
emen
t pr
oble
m
14% 2% 2%
8% 12%
14% 17%
32%
0 10 20 30 40 50
No problem Labor exchange
Reduce farmland Social dealing
Involvement of more family labor Pay more money to hire
Ignore Hire from other village
% of Migrant farm households
Prob
lem
solv
ing
of la
bor
requ
irem
ent
Figure5: Income compositions of migrant and non-migrant households
13
Table 8 Types of occupation of migrants in the sample migrant farm households
No. Types of occupation Before (%) Types of occupation Current (%) 1 Family Labor 22.8
Worker in industry 36.7
2 Student 21.5
Causal labor 19.0 3 Car workshop 21.5
Bus driver &assistant 18.9
4 Farmer 7.6
Government staff 11.4 5 Agricultural wage labor 5.1
Private company staff 6.3
6 Causal labor 5.1
Student 3.8 7 Dependent/ Unemployed 5.1
Grocery (Small shop) 2.5
8 Worker in industry 3.8
Dependent/ Unemployed 1.3 9 Private company staff 2.5
Total 100
10 Government staff 2.5
11 Livestock raising 1.3
12 Bus driver & assistant 1.3
Total 100
Table 9 Comparison of before and current monthly income earned by migrants
Item Mean Minimum Maximum
Before migration (MMK/month) 13,508 0 70,000
At present (MMK/month) 157,918 15,000 400,000
Table 10 Enterprise budget of sesame and pigeon pea production
Item Unit Migrant farm HH (N=47)
Non-migrant farm HH (N=43)
Sesame Yield Bsk/ac 3.27 2.81
Price MMK/bsk 41,149 36,423
Pigeon pea
Yield Bsk/ac 6.10 5.24
Price MMK/bsk 19,872 19,581
Total gross benefit MMK/ac 255,799 205,066
Total variable cost MMK/ac 207,512 195,442
Net benefit MMK/ac 48,287 9,624
Benefit Cost Ratio (BCR) 1.23 1.05
Table9: Comparison of before and current monthly income earned by migrants

86 Nandar Aye Chan, Theingi Myint
ties and 3% from livestock rearing. Therefore, the migrants’ income was the high-est in the total households’ income. In income composition of non-migrant farm households, it was found that annual income from crop production (32%), off-farm income (31%) and non-farm income (31%) were the highest in the total households’ income.
Impact of Migration on Agricultural Labor Problem and Crop ProductionGenerally, farming in Myanmar is small scale and labor intensive. Migrant farm households needed more agricultural laborer in farm activities to compensate their migrant family labor. Almost of sample households (90%) faced the problem in ac-cessing hired labor. The reasons for this problem were difficult to get hired labor in time (54%), high wage in accessing hired labor (31%) and hired labors were not affective as family labor (5%). Labor migration creates labor shortage in the crop production which, in turn, high wages and decrease crop yields, are happened par-ticularly during the peak season (Amina Maharjan & Theingi Myint, 2015). There-fore, these labor shortage problems affect crop cultivation, yield and also livestock
15
Figure 5 Income compositions of migrant and non-migrant households
Figure 6 Labor management problems of sample migrant farm households
Figure 7 Problems solving of agricultural labor requirement in the crop production
Crop 26%
Animal husbandry
3% Remittance 43%
Off-farm income 11%
Non-farm activities
17%
Migrant FHH
Crop 32%
Animal husbandry
6% Off-farm income
31%
Non-farm activities
31%
Non-migrant FHH
10%
1%
5%
14%
17%
54%
0 10 20 30 40 50 60
No problem
Affect livestock farming
Not affective as family labor
Difficulties in crop cultivation
High wages
Unavailable in time
% of Migrant farm households
Lab
or m
anag
emen
t pr
oble
m
14% 2% 2%
8% 12%
14% 17%
32%
0 10 20 30 40 50
No problem Labor exchange
Reduce farmland Social dealing
Involvement of more family labor Pay more money to hire
Ignore Hire from other village
% of Migrant farm households
Prob
lem
solv
ing
of la
bor
requ
irem
ent
Figure6: Labor management problems of sample migrant farm households
Figure7: Problems solving of agricultural labor requirement in the crop production

87Study on Agricultural Labor Migration of Selected Farm Households
farming (Figure 6).According to the type of labor problem, migrant farm households are solved
in various ways. Some migrant households solved the problem by hiring labor from other distance village (32%). Other specific solutions were paying high wage to hire in time (14%), the rest family members including children, women and elder persons worked in farm during peak season (12%) and taking advantage of close social deal-ing to get hired labor from same village and other villages (8%). In few cases, each 2% of migrant households used mutual labor exchange system with other households and finally reduced farmland size to solve labor requirement problem (Figure 7).
As labor migration impacts on labor availability, it also impacts on wages and value. As seen in Kyaupadaung township, the labor shortage has increased the wages in agriculture work compared with before migration condition. As can be seen in the wages comparison, the hired labor daily wage increased from about 500 MMK to 2000 MMK for male and about 300 MMK to 1500 MMK for female during off-season. The daily wage increased from about 800 MMK to 3000 MMK for male and about 600 MMK to 1500 MMK (or) 2000 MMK for female during peak season in the study area.
Enterprise Budget of Sesame and Pigeon Pea ProductionMigrant farm households obtained higher yield of sesame (3.27 basket/ac) and pi-geon (6.1 basket/ac) than non-migrant farm households (2.81 and 5.24 basket/ac). And also, prices of sesame (41,149 MMK/basket) and pigeon pea (19,872 MMK/basket) for migrant farm households were higher than sesame price (36,423 MMK/basket) and pigeon pea price (19,581 MMK/basket) of non-migrant farm house-
13
Table 8 Types of occupation of migrants in the sample migrant farm households
No. Types of occupation Before (%) Types of occupation Current (%) 1 Family Labor 22.8
Worker in industry 36.7
2 Student 21.5
Causal labor 19.0 3 Car workshop 21.5
Bus driver &assistant 18.9
4 Farmer 7.6
Government staff 11.4 5 Agricultural wage labor 5.1
Private company staff 6.3
6 Causal labor 5.1
Student 3.8 7 Dependent/ Unemployed 5.1
Grocery (Small shop) 2.5
8 Worker in industry 3.8
Dependent/ Unemployed 1.3 9 Private company staff 2.5
Total 100
10 Government staff 2.5
11 Livestock raising 1.3
12 Bus driver & assistant 1.3
Total 100
Table 9 Comparison of before and current monthly income earned by migrants
Item Mean Minimum Maximum
Before migration (MMK/month) 13,508 0 70,000
At present (MMK/month) 157,918 15,000 400,000
Table 10 Enterprise budget of sesame and pigeon pea production
Item Unit Migrant farm HH (N=47)
Non-migrant farm HH (N=43)
Sesame Yield Bsk/ac 3.27 2.81
Price MMK/bsk 41,149 36,423
Pigeon pea
Yield Bsk/ac 6.10 5.24
Price MMK/bsk 19,872 19,581
Total gross benefit MMK/ac 255,799 205,066
Total variable cost MMK/ac 207,512 195,442
Net benefit MMK/ac 48,287 9,624
Benefit Cost Ratio (BCR) 1.23 1.05
Table10: Enterprise budget of sesame and pigeon pea production

88 Nandar Aye Chan, Theingi Myint
holds because they expended higher total variable cost and could produce quality yield to get higher price.
Hence, migrant farm households received more profit (48,284 MMK/ac) than non-migrant farm households (9,624 MMK/ac) by growing sesame and pigeon crop intercropping in the study area. The reason for receiving larger profit than non-mi-grant farm households was that the migrant farm households got higher yield than the other one. Although there was not much different in output price and total variable costs among migrant and non-migrant groups, the gross benefit received by migrant (255,799 MMK/ac) and non-migrant farm households (205,066 MMK/ac) was different. Return above variable cost (RAVC) for migrant and non-migrant farm households were 48,287 MMK/ac and 9,624 MMK/ac respectively. Hence, the benefit-cost ratios were 1.23 and 1.05 for migrant and non-migrant farm house-holds, respectively (Table 10).
CoNCLUSIoN AND PoLICy IMPLICAtIoNIn the study area of Kyaukpadaung township, about one fourth of household mem-bers were migrants who were mostly young and active men. Common migration was internal rural to urban out migration and about one third of migration were international cross-border migration. The push factors of rural out-migration in the study area were mostly associated with declining opportunities in agriculture be-cause of weed problem and bad weather condition. Moreover, low employment op-portunities of non-farm sectors in original areas were also existed. The pull factors of out-migration to other places were better economic and employment opportuni-ties, high income and better living standard in new destination places. Regarding the household income, remittance was significantly high and it was about half of total households’ income. As the positive view of migration, the remittance was used mainly for agricultural investment for crop and livestock production. Due to impact of migration, the original resident areas faced the labor shortage problem in farming especially during peak season. With the men migrating out, the bulk of the work load and responsibilities fall upon women and children who were not adequately ready for these new responsibilities. Problems of high labor cost, labor unavailability in time, unskilled female and child labor were found in the agricultural sector. There-fore, there is a need for a socio-political framework in which women and children can be empowered with the relevant skills and technologies to undertake this new role more efficiently.
The policies should be targeted towards coping strategies of labor saving tech-nologies, extension and education program emphasized on women, children and el-der persons. Moreover, it should establish and promote agricultural based small and medium enterprises (SMEs) in the rural areas to provide job opportunities for the

89Study on Agricultural Labor Migration of Selected Farm Households
livelihoods of the rural community. In addition, educational and vocational institu-tions should be established to facilitate skill building of rural youths that will make them employable in the agriculture based small and medium enterprises (SMEs).
REFERENCESLIFT/World Bank. 2014. Qualitative Social and Economic Monitoring (QSEM) Sum-
mary of Round Four Report. World Bank& Myanmar Development Research Commissioned by the Livelihoods and Food Security Trust Fund
Maharjan, A. & Theingi Myint. 2015. Internal Labor Migration Study in the Dry Zone, Shan State and the Southeast of Myanmar, HELVETAS Swiss Interco-operation Myanmar.
Ministry of Immigration and Population. 2014. Myanmar Population and Housing Census. Census report volume II.
World Bank. 2008. World Development Report 2008: Agriculture for Development: World Bank.


91
Study on Postharvest Handling Practices of Cabbage and Cauliflower in Selected Areas of Myanmar
T.T.Soe1,a, T.D.Hnin1, Y.Y. Soe1, N.N. Htwe1, K.T.D.Myint1 and T.O.Win2
1. Yezin Agricultural University, Ministry of Agriculture and Irrigation, Myanmar2. Cropping System Section, Department of Agricultural Research, Ministry of Agriculture and Irriga-
tion, Myanmar (Corresponding author: [email protected])
ABSTRACTThe study was made to investigate the existing handling practices of cab-bage and cauliflower in selected areas of Myanmar from December 2011 to May 2012. A total of 193 respondents from Aung Ban, Nay Pyi Taw and Yangon were randomly selected and interviewed using structural ques-tionnaires. Commodities are transported from growing area to wholesale markets by truck or else; whereas, brokers, collectors and off-takers are served as middlemen among the producers, wholesalers and retailers; ur-ban wholesalers sell to retailers in nearby markets and send to other mar-kets. The middlemen collect the produce from the farm and bring it to the wholesale market using cow-driven carts in that area. It was observed that cabbage and cauliflower without packaging materials were currently prac-ticed during transportation using truck. Non-refrigerated vehicles gener-ally are open-sided trucks with wire mesh frames. This type of transport is inexpensive, convenient and it is usually used in developing countries. The suitable and mostly used position during storage and transportation for cabbage is upside down and side by side position for cauliflower. Packaging of mesh bag, plastic bag and bamboo basket at the retailers were commonly employed. The losses of cauliflower stakeholders could be higher than that of cabbage stakeholders due to its inflorescence crop type and discoloration of the curd.
Key Words: handling practices, packaging materials, postharvest transpor-tation and supply chain
INtRoDUCtIoNMyanmar has huge potential for production of various kinds of horticultural crops and they are cultivated year round or seasonally in different parts of the country. Leafy vegetables are rich source of essential nutrients such as vitamin A and folic acid (Aye, 2007). In Myanmar, cabbage and cauliflower are generally grown in win-
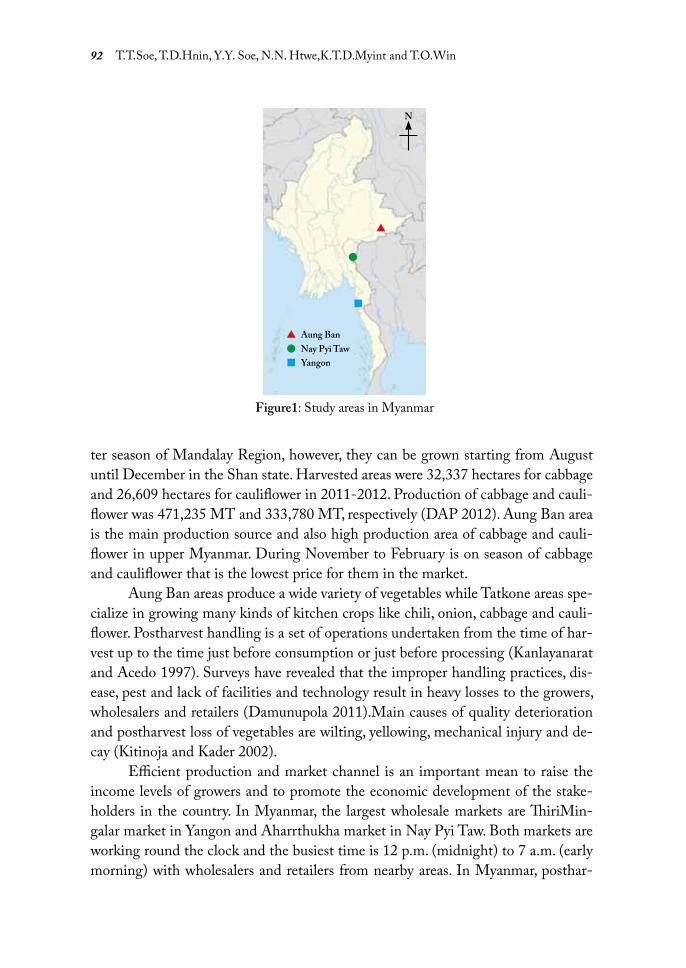
92 T.T.Soe, T.D.Hnin, Y.Y. Soe, N.N. Htwe,K.T.D.Myint and T.O.Win
ter season of Mandalay Region, however, they can be grown starting from August until December in the Shan state. Harvested areas were 32,337 hectares for cabbage and 26,609 hectares for cauliflower in 2011-2012. Production of cabbage and cauli-flower was 471,235 MT and 333,780 MT, respectively (DAP 2012). Aung Ban area is the main production source and also high production area of cabbage and cauli-flower in upper Myanmar. During November to February is on season of cabbage and cauliflower that is the lowest price for them in the market.
Aung Ban areas produce a wide variety of vegetables while Tatkone areas spe-cialize in growing many kinds of kitchen crops like chili, onion, cabbage and cauli-flower. Postharvest handling is a set of operations undertaken from the time of har-vest up to the time just before consumption or just before processing (Kanlayanarat and Acedo 1997). Surveys have revealed that the improper handling practices, dis-ease, pest and lack of facilities and technology result in heavy losses to the growers, wholesalers and retailers (Damunupola 2011).Main causes of quality deterioration and postharvest loss of vegetables are wilting, yellowing, mechanical injury and de-cay (Kitinoja and Kader 2002).
Efficient production and market channel is an important mean to raise the income levels of growers and to promote the economic development of the stake-holders in the country. In Myanmar, the largest wholesale markets are ThiriMin-galar market in Yangon and Aharrthukha market in Nay Pyi Taw. Both markets are working round the clock and the busiest time is 12 p.m. (midnight) to 7 a.m. (early morning) with wholesalers and retailers from nearby areas. In Myanmar, posthar-
Figure1: Study areas in Myanmar
N
Aung Ban▲
▲
Nay Pyi Taw●
●
Yangon■
■

93Study on Postharvest Handling Practices of Cabbage and Cauliflower
vest handling practices such as harvesting, storage, cleaning; grading, packing and transportation for cabbage and cauliflower are not systematically conducted along the supply chain. Therefore, the present survey had been carried out to investigate the postharvest handling practices of cabbage and cauliflower by the stakeholders in study areas.
RESEARCH MEtHoDoLogySelection of Study AreasAung Ban and Nay Pyi Taw (Tatkone) areas are well known as a major vegetables production areas. Aung Ban is in Kalaw Township, Southern Shan State. It is lo-cated at 20° 40´ N and 96° 38´ E coordinates. The growing areas of cabbage and cauliflower in Kalaw Township are 871 and 251 acres, respectively in 2010. The main market destination of cabbage and cauliflower from Aung Ban is Yangon during winter season.
Nay Pyi Taw is the capital of Myanmar and located at 19° N and 96° E coordi-nates. Tatkone area produces many kinds of vegetables such as cabbage, cauliflower,
4
Figure .1 Study areas in Myanmar
Table 1. Sample markets and number of respondents
Township Market No. of respondents (%)
Wholesaler Retailer
Nay Pyi Taw Arharrathukha 5 (33.33)
Yezin 5 (14.29)
Pa La Ka at YAU 5 (14.29)
Pyinmana 5 (14.29)
Yangon ThiriMingalar 10 (66.67)
Haymawon 5 (14.29)
Yandanar 5(14.29)
Sanpya 5 (14.29)
Thingankyun 5 (14.29)
Total 15(100.00) 35 (100.00)
Aung Ban
Nay Pyi Taw
Yangon
N
5
Table 2.Number of respondents in selected areas
RESULTS AND DISCUSSION
Handling Practices and Time Lag during Storage in Cabbage and Cauliflower at
Wholesaler Sites
Handling practices of cabbage and cauliflower at wholesaler sites were pile up, spread
out and by bamboo basket. It was found that 50% of the cabbage and cauliflower wholesalers
mainly used spread out storage position in Yangon area. In Nay Pyi Taw area, 80% of cabbage
wholesalers and 60% of the cauliflower wholesalers mainly stored spread out storage position
(Table 3). It can be assumed that most of the wholesalers used spread out because there was no
need to pay for labour and material cost and then easy to store. Kanlayanarat and Acedo (1997)
stated that quality deterioration of produce can be retarded effectively by proper storage systems
by refrigerated storage, cool storage. In this study, storage losses at wholesaler were no
significant differences between Yangon and Nay Pyi Taw for both cabbage and cauliflower (data
not shown). Most of the wholesalers used unsystematic handling practices and there were no
cooling facilities and no specialties for crop storage. It was found that most of the 80% of the
cabbage and 40% of the cauliflower wholesalers stored for 1 day (time lag) for sale in Yangon
area and Nay Pyi Taw area (Table 4).
Township No. of respondents
Grower Wholesaler Retailer Total
Aung Ban 77 - - 77
Nay Pyi Taw 66 5 15 86
Yangon - 10 20 30
Total 143 15 35 193
Table1: Sample markets and number of respondents
Table2: Number of respondents in selected areas

94 T.T.Soe, T.D.Hnin, Y.Y. Soe, N.N. Htwe,K.T.D.Myint and T.O.Win
chili, eggplant, radish and mustard. The growing areas of cabbage and cauliflower in Tatkone Township are 302 and 289 acres, respectively in 2010. The main market destination of cabbage and cauliflower from Tatkone is NayPyi Taw Aharathukha market and other distant markets. Fresh commodities of both sites entered in Yan-gon city by truck. Data collections were conducted along through production sites at Aung Ban and Nay Pyi Taw and wholesale and retail markets at Yangon and Nay Pyi Taw. Yangon is the focal point of the internal and external trade for agricultural produce from other states and regions by highway road, railway and waterway. Yan-gon Thiri Mingalar market is the wholesale market for fresh produces and it has also terminal and transit of vegetable crops distributed to Yangon retail markets and other distant markets.
Data CollectionQuestionnaires for different surveys were conducted at Aung Ban, Nay Pyi Taw and Yangon markets by random sampling method to overview assessment on posthar-vest handling practices of cabbage and cauliflower by interviewing 50 and 27 cab-
6
Table 3. Handling practices of cabbage and cauliflower during storage at wholesaler sites Item Wholesalers (%)
Yangon Nay Pyi Taw
Cabbagea Cauliflowerb Cabbagec Cauliflowerd
Pile up 10 20 20 20
Spread out 50 50 80 60
By bamboo basket 40 30 - 20
Total 100 100 100 100
(a) n = 10; (b) n = 10; (c) n =5; (d) n = 5
Table 4. Time lag of cabbage and cauliflower at wholesaler sites
Time lag (days) Wholesalers (%)
Yangon Nay Pyi Taw
Cabbage a Cauliflower b Cabbage c Cauliflower d
1 80 80 40 40
2 20 20 20 20
3 - - 20 20
4 - - 20 20
Total 100 100 100 100
(a) n = 10; (b) n = 10; (c) n =5; (d) n = 5
Plate 1. Storage practices of cabbage and cauliflower at wholesaler sites: -
(a) pile up, (b) spread out, (c) bamboo basket
c b a
c
Table3: Handling practices of cabbage and cauliflower during storage at wholesaler sites
Table4: Time lag of cabbage and cauliflower at wholesaler sites

95Study on Postharvest Handling Practices of Cabbage and Cauliflower
bage and cauliflower growers from 6 villages in Kalaw Southern Shan State and 41 and 25 cabbage and cauliflower growers from 4 villages in Nay Pyi Taw (Tatkone) during December 2011 to May 2012. The data were collected from stakeholders with structural interview questionnaire. Distribution of cabbage and cauliflower re-tailers for 20 and 15 in Yangon and Nay Pyi Taw were interviewed to overview the postharvest handling practices of grading, packing, temporary storage, loading sys-tem, transportation and storage during retailing.
Data AnalysisThe Statistical Package for Social Science (SPSS) version 16.0 Software and Micro-soft Excel Program were used for data analysis.
RESULtS AND DISCUSSIoNHandling Practices and time Lag during Storage in Cabbage and Cauliflower at wholesaler SitesHandling practices of cabbage and cauliflower at wholesaler sites were piled up, spread out and by bamboo basket. It was found that 50% of the cabbage and cauli-flower wholesalers mainly used spread out storage position in Yangon area. In Nay Pyi Taw area, 80% of cabbage wholesalers and 60% of the cauliflower wholesalers mainly stored spread out storage position (Table 3). It can be assumed that most of the wholesalers used spread out because there was no need to pay for labour and material cost and then easy to store. Kanlayanarat and Acedo (1997) stated that quality deterioration of produce can be retarded effectively by proper storage systems by refrigerated storage, cool storage. In this study, storage losses at wholesaler were no significant differences between Yangon and Nay Pyi Taw for both cabbage and cauliflower (data not shown). Most of the wholesalers used unsystematic handling practices and there were no cooling facilities and no specialties for crop storage. It
Plate1: Storage practices of cabbage and cauliflower at wholesaler sites: (a) pile up, (b) spread out, (c) bamboo basket
a b c

96 T.T.Soe, T.D.Hnin, Y.Y. Soe, N.N. Htwe,K.T.D.Myint and T.O.Win
was found that most of the 80% of the cabbage and 40% of the cauliflower wholesal-ers stored for 1 day (time lag) for sale in Yangon area and Nay Pyi Taw area (Table 4).
Handling Practices and time Lag during Storage for Cabbage and Cauliflower at Retailer SitesHandling practices during storage for cabbage and cauliflower at the retailer sites were spread out, by bamboo basket, natural condition, in the plastic bag and covered with wet cloth. Among them, bamboo baskets were mostly used because it is an indigenous packaging material for most vegetable crops in these days. Moreover, it is easy to be available at cheaper cost. It was found that 35.00% of the retailers used bamboo basket in storage for cabbage and cauliflower at Yangon area. In Nay Pyi Taw area, most of the retailers (66.70%) used plastic bag for cabbage and cauliflower in storage (Table 5). It can be assumed that there is no cooling facility (cool storage room and refrigerators) in Myanmar. Therefore,the retailers still use conventional storage practices.
In Yangon area, 55% of cabbage respondents stored for 3 days (time lag), how-ever, 50.00% of cauliflower respondents stored for 2 days. In Nay Pyi Taw, 66.70% of the cabbage and cauliflower retailers stored for 2 days (Table 6).Therefore, time lag of Yangon were one day longer than that of Nay Pyi Taw. It can be assumed that Yangon is urban area and far away from farm.
Packaging Materials of Cabbage and Cauliflower at Retailer SitesPackaging materials of cabbage and cauliflower at retailer sites were bamboo basket, mesh bag, wadding bag and plastic bag. The packaging of cabbage and cauliflower
7
Handling Practices and Time Lag during Storage for Cabbage and Cauliflower at Retailer
Sites
Handling practices during storage for cabbage and cauliflower at the retailer sites were
spread out, by bamboo basket, natural condition, in the plastic bag and covered with wet cloth.
Among them, bamboo baskets were mostly used because it is an indigenous packaging material
for most vegetable crops in these days. Moreover, it is easy to be available and cheaper cost. It
was found that 35.00% of the retailers used bamboo basket in storage for cabbage and
cauliflower at Yangon area. In Nay Pyi Taw area, most of the retailers (66.70%) used plastic bag
for cabbage and cauliflower in storage (Table 5). It can be assumed that there is no cooling
facility (cool storage room and refrigerators) in Myanmar. Therefore,the retailers still use
conventional storage practices.
In Yangon area, 55% of cabbage respondents stored for 3 days (time lag), however,
50.00% of cauliflower respondents stored for 2 days. InNay Pyi Taw, 66.70% of the cabbage and
cauliflower retailers stored for 2 days (Table 6).Therefore, time lag of Yangon were one day
longer than that of Nay Pyi Taw. It can be assumed that Yangon is urban area and far away from
farm.
Table 5. Handling practices of cabbage and cauliflower during storage at retailer sites Item Retailers (%)
Yangon Nay Pyi Taw
Cabbagea Cauliflowerb Cabbagec Cauliflowerd
Spread out 20.00 20.00 13.30 13.30
By bamboo basket 35.00 35.00 20.00 20.00
In the Plastic bag 20.00 20.00 66.70 66.70
Natural condition 10.00 10.00 - -
Covered with wet
cloth
15.00 15.00 - -
Total 100.00 100.00 100.00 100.00
(a) n = 20; (b) n = 20; (c) n =15; (d) n = 15
Table5: Handling practices of cabbage and cauliflower during storage at retailer sites

97Study on Postharvest Handling Practices of Cabbage and Cauliflower
8
Table 6.Time lag of cabbage and cauliflower at retailer sites
Time lag (days) Retailers (%)
Yangon Nay Pyi Taw
Cabbage a Cauliflower b Cabbage c Cauliflower d
1 5.00 5.00 33.33 33.33
2 20.00 50.00 66.70 66.70
3 55.00 45.00 - -
4 20.00 - - -
Total 100.00 100.00 100.00 100.00
(a) n = 20; (b) n = 20; (c) n =15; (d) n = 15
Table 7.Packaging materials forcabbage and cauliflower at retailer sites
Packaging materials Retailers (%)
Yangon Nay Pyi Taw
Cabbage a Cauliflowerb Cabbagec Cauliflowerd
Mesh bag 40.00 40.00 13.30 13.30
Bamboo basket 25.00 25.00 26.70 26.70
Wadding bag 25.00 25.00 20.00 20.00
Plastic bag 10.00 10.00 40.00 40.00
Total 100.00 100.00 100.00 100.00
(a) n = 20; (b) n = 20; (c) n =15; (d) n = 15
Packaging Materials of Cabbage and Cauliflower at Retailer Sites
Packaging materials of cabbage and cauliflower at retailer sites were bamboo basket,
mesh bag, wadding bag and plastic bag. The packaging of cabbage and cauliflower from
wholesaler to retailer sites were 40% of the respondents by using mesh bag in Yangon area.
Packing by plastic bag was currently used by 40% of cabbage and cauliflower retailers in Nay
Pyi Taw area (Table 7). It was agreed with the report of FAO (2011). It was reported that
packaging generally provides protection for the product, to reduce spoilage and losses and to
enhance the value of produce. Plastic bags are the most widely accepted for vegetables in most
Table6: Time lag of cabbage and cauliflower at retailer sites
Table7: Packaging materials for cabbage and cauliflower at retailer sites
Plate2: Packaging materials of cabbage and cauliflower at the retailer sites: (a) Mesh bag, (b) Bamboo basket, (c) Plastic bag, (d) Wadding bag
a b c d

98 T.T.Soe, T.D.Hnin, Y.Y. Soe, N.N. Htwe,K.T.D.Myint and T.O.Win
Plate3: Storage practices of cabbage and cauliflower at retailer sites:(a) spread out, (b) by bamboo basket, (c) covered with wet cloth,
(d) in the plastic bag, (e) natural condition
Plate4: Loading system of cabbage and cauliflower during transportation in Myanmar:(a) upside down, (b) side by side, (c) line up, (d) cabbage under the cauliflower, (e) with wrapper leaf
a
a
b
b
d
d
c
c
e
e

99Study on Postharvest Handling Practices of Cabbage and Cauliflower
from wholesaler to retailer sites were 40% of the respondents by using mesh bag in Yangon area. Packing by plastic bag was currently used by 40% of cabbage and cauli-flower retailers in Nay Pyi Taw area (Table 7). It was agreed with the report of FAO (2011). It was reported that packaging generally provides protection for the product, reduce spoilage and losses and enhance the value of produce. Plastic bags are widely accepted for vegetables in most countries. It can be assumed that plastic were used to reduce transpiration rate (water loss) that can prolong shelf life and maintain the product quality.
CoNCLUSIoN AND RECoMMENDAtIoNThe stakeholders of cabbage and cauliflower have deep knowledge on different stor-age positions of upside down, side-by-side, line up, pile up and with wrapper leaf for cabbage and cauliflower at temporary storage. Among them, the suitable and mostly used position during storage and transportation for cabbage was upside down and side by side position for cauliflower. Cabbage and cauliflower without packaging were commonly practiced for distant transportation and sale processes of cabbage and cauliflower from the farm to the wholesalers. However, packaging materials of mesh bag, wadding bag, plastic bag and bamboo basket were mostly employed by retailers.
Plate5: Unsystematic loading of cabbage and cauliflower during transportation from wholesaler to retailer sites
a b
d
c
e f

100 T.T.Soe, T.D.Hnin, Y.Y. Soe, N.N. Htwe,K.T.D.Myint and T.O.Win
Stacking of many layers of produce which results in high percentages of loss by mechanical damage and reduces produce quality. Therefore, handling practices and packaging system should be systematically managed to reduce losses and to maintain the quality of the produce. Cabbage and cauliflower produce from wholesale markets were sold to small retail markets by various types of vehicles that may cause exces-sive weight loss and quality loss. Transporting produce in unrefrigerated trucks or unrefrigerated conditions may tailor the shelf life of produce and reduce nutritional value that in turn leads to lower market value. Therefore, cooling truck,temporary cold storage room and refrigerators are necessary for cabbage and cauliflower stake-
Plate6: Current supply chain system of cabbage and cauliflower from grower site to reach consumer hand:(a) Production site (farm), (b) Unsystematic harvesting, (c) Spread out in the field, (d)Pile up in the open field, (e)Unsys-tematic transportation, (f ) Temporary storage at wholesaler, (g) Transportation from wholesaler to retailer, (h)Temporary storage by natural condition, (i) Temporary storage at retailer by bamboo basket and (j) Selling to the consumer
a b
d
g
j
c
f
i
e
h

101Study on Postharvest Handling Practices of Cabbage and Cauliflower
holders in Myanmar by the help of government or other organization.During loading and unloading, systematic postharvest handling practices for
middlemen, retailers, transporters should be educated at wholesale depot. All of infrastructures, such as processing equipment, packing houses, grading and sizing machines should be provided to growers and wholesalers to reduce severe quality losses. Famers association, Myanmar Vegetable Producers and Exporter Association (MFVPA), growers cluster should be cooperated with effective structural institu-tional organizations. The stakeholders of cabbage and cauliflower along the supply chain should be trained on postharvest handling practices to reduce the losses. It is suggested that good agricultural practices (GAP) should be needed for the grow-ers. Moreover, in Myanmar, systematic handling practices, harvesting and packaging system will also be needed for all labor including (farm labor) along the supply chain.
REFERENCESAye, K. N. 2007. Postharvest Technologies for Fresh Leafy vegetables in Myanmar.
In: Acedo, A. L. and K. Weinberger (eds.) Postharvest Management of Leafy Vegetables in Greater Mekong Sub-region Countries. Proceeding. Hanoi, Viet-nam. 165: 28p.
DAP. 2011. Department of Agricultural Planning. Myanmar Agricultural at a glance, Myanmar Agriculture in Brief. Ministry of Agriculture and Irrigation.
DAP. 2012. Department of Agricultural Planning. Myanmar Agricultural at a glance, Myanmar Agriculture in Brief. Ministry of Agriculture and Irrigation.
Damunupola, J .W.2011. Postharvest technology of fruits and vegetables. M.Sc The-sis. Postgraduate Institute of Science, University of Peradeniya. India.
FAO. 2001. Food Balance Sheets. In: Economic and Social Development Department, Food and Agriculture Organization of United Nations, VialedelleTerme di Caracalla, 00153rome, Italy, pp.14.
Kanlayanarat, S.1997. Introduction of postharvest technology of agricultural pro-duce. In: Postharvest Handling System of Agricultural Products.A Training Man-ual. King Mongkut’s Institute of Technology, Thonburi, Bangkok. Thailand.
Kanlayanarat, S and A.L. Acedo.1997. Introduction of postharvest technology of agricultural produce. In: Postharvest Handling System of Agricultural Prod-ucts. A Training Manual.King Mongkut’s Institute of Technology, Thonburi, Bangkok. Thailand.
Kitinoja, L. and A. A Kader. 2002. Small-scale postharvest handling practices. In: Davis (ed.) A Manual for Horticultural Crops. 4th edition.University of Califor-nia. Postharvest Horticulture Series 8E: 260p.


103
Pharmaceutical Ethnobotany Survey of Anticancer Plant Resources from The Hlawgar Wildlife Park, Yangon Region,
Myanmar
Khin Thantsin*, San San Aye, Khin Thandar WinDepartment of Botany, University of Yangon, University Avenue, Kamayut Township, Yangon, 11041-
11044, MYANMAR ([email protected])
ABSTRACTSince prehistoric time, men have used natural resources especially from plants for healthcare purpose. The information of therapeutic uses for cancer is very rare. The present work information is the result of pharma-ceutical ethnobotany investigation on the Hlawgar Wildlife Park, Yangon Region from June to October 2014. We studied the plant resource therapeutically used materials especially for the treatment of cancer by Thai and Myanmar traditional practitioners. Specimens were collected together with two Thai traditional practitioners. Data were combined with the interview of four traditional practitioners, two from Thailand and two from Myanmar. A total 32 species, 23 families were recognized as record. Those species were recommended for specific treatments of different organ cancer by two Thai traditional practitioners, and some of them are used as medicine by Myanmar traditional practitioners too. In the present research morphological identification was carried out using literatures. Further-more, herbarium specimens were deposited in the Department of Botany Herbarium, University of Yangon. Those species need to address more sys-tematic and scientific methods. These data were useful for future pharma-cological study, and also for estimation of the species which are in threat of exhaustion.
Key Words: anticancer resource, ethnobotany, Myanmar, traditional prac-titioners
INtRoDUCtIoNHuman have relied on plant resource as food, shelter, clothes and healthcare for daily life since prehistoric time. Mendonça-Filho [2006] stated plants are still used and have considerable importance in international trade. Herbal medicine knowledge and its efficacy was acquired by trial and error and handed over from one genera-tion to another. However, the diffusion of herbal medicine knowledge is sometimes

104 Khin Thantsin, San San Aye, Khin Thandar Win
dangerous because there is improper communication. Pharmaceutical ethnobotany experience for several years has verified to be a
precious channel in modern screening of pharmacology [Natural products isolation 2005:4]. Nowadays, the information of botanical resource from traditional practi-tioners has acquired considerable awareness in part of the scientific researchers. But methods in informant selection need to be carefully created level. Myanmar and Thailand have a long history of traditional remedies and learning of biological origin for therapeutic used [Ashin Nagathein 1977; Bodeker 1997]. The information about traditional therapeutic uses for cancer is very rare; it needs to address secure and rea-sonable quality control methods modified to pharmaceutical ethnobotany resource.
This is time to get utmost advantage from the experience of traditional prac-titioners to give sufficient health care service not only to countryside people but also who believe to use herbal medicine. In the present study, the pharmaceutical infor-mation may be original, or rare uses in the treatment of cancer for particular organs and that might be needed to be elucidated urgently. Hence, this paper was reported as an ethnobotanical survey. The aims of this research are:
•ToreportlocallyanticancerresourceutilizedbyThai;•ToassesstheutilizationofMyanmarhabitatspecies;•ToevaluatethecommonspeciesusedbyMyanmarandThai;•Topredicthowmuchmedicinalanticancerresourcestandintheprotective
area;•Toestimatethethreatenspecies.
MAtERIALS AND MEtHoDS geographic and Forest type overviewThe location of Yangon region is the eastern boundary of the Ayeyarwaddy Delta area to the north-west of Andaman Sea, south of Bago Region and East of Ayeyar-waddy Region. The Hlawgar Wildlife Park is situated in the Yangon region that is a protected area and was established in 1982 with the total area of 3.63 km2. The Hlawgar Wildlife Park has plenty of water resource, such as lakes and streams and also sloping area [Fig. 1]. Forest type is tropical wet evergreen forest and they form high, dense, multilayered evergreen forests characterized by a vast number of tree species. Even classified as wet evergreen forests there were patches of deciduous forests, and wetland vegetation, and swamp forests species are grown well.
Ethnic Composition of yangon RegionAccording to the Population and Housing Census of Myanmar [2014], composition of the ethnic in Yangon Region is diverse, and major group is Burma the biggest eth-nic group of Myanmar’s population; some are Karin, Mon, Yakhine, Shan, Chin and

105Pharmaceutical Ethnobotany Survey of Anticancer Plant Resources
Kachin. Most of them are office staff, industry workers, and farmers. Myanmar is the dominant and official language. This research area, the lowland region of Ayeyar-waddy river delta is fertile. Products of this area are mainly rice, however currently industrial zone are expanded. Climate Yangon region belongs to Köppen’s tropical monsoon climatic zone and has long rainy season from the mid of May to the mid of October. During this time we have a substantial amount of rainfall. Dry season is from the mid of October to the mid of May but during the dry season there are some rainy days. Temperature is fluctuated because of rainy days and average maximum temperature range from 29 to 37°C and average minimum temperature range from 17 to 25°C [Meteorology and Hydrology Department, Yangon, 2014].
Data CollectionInformants having ethnobotanical and traditional remedy knowledge, especial-ly professional herbal specialists were selected. Four traditional practitioners, two from Thailand and two from Myanmar were recruited to minimize the instability of knowledge level. Data were collected through unstructured and unlimited inter-views. Informants from Thailand were contributed their herbal remedies knowledge in the field which showed the plants to confirm. Identification of the medicinal plant specimens collected from the study area was performed at the Herbarium of the Department of Botany, University of Yangon by comparison with already identi-
Figure1: Map of Yangon Region and the location of the Hlawgar Wildlife Park. (Agriculture Atlas, Myanmar, 2002; Google map, 2014)

106 Khin Thantsin, San San Aye, Khin Thandar Win
fied herbarium specimens and literatures [Hooker 1885; Lawrence 1969; Cronquist 1981; Kress et al. 2003]. The entry of each species included the name of family, Latin binomial, author. Voucher specimens were enclosed at the Herbarium of The De-partment of Botany, University of Yangon.
Data collection chiefly based on the experiences of Thai traditional practition-ers namely Mr. Boon Phyoung and Mrs. Vun Phong Phyoung [Chinmayi, Thailand] with addition of the knowledge of Myanmar traditional practitioners Mr. Than Swe and Mrs. Thin Thin Nwe [Yangon, Myanmar]. For some botanical specimens, in-terviews were taken and repeated for confirmation. Myanmar names, treatments of illness, plant parts used, general mode of preparation and administration were recorded for each plant during the interviews.
RESULtSBotanical Resource and Their UsesThe present research was concentrated on ethnobotanical reports by traditional prac-titioners from Thailand and Myanmar for their medical uses. Also, the medical uses of Thailand and Myanmar are different in most cases but related in some instances.
Thirty two species mentioned by professional traditional practitioners were recorded. The recorded species were referred to by two Thai traditional practitioners for the treatment of cancer of particular organs. Among them only 19 species were recommended for medical uses by Myanmar traditional practitioners. A plant spe-cies mentioned by one or two practitioners was considered to be valuable. Reported Botanical resource with their family names, scientific names, Myanmar names, con-dition and habit of species, part used and uses are shown in Table 1 comprising of 23 families.
Part Used for Botanical origin and Preparation ModeIn Myanmar traditional remedies, stem, bark, root, rhizome and leaves are the major parts utilized for medicinal uses and others including flower, fruits, and the whole plant are only or miscellaneously used. But in the case of treatment of different kinds of cancer, Thai herbal medicine practitioner used mainly bark, stem, root, and rhizome for the treatment of cancer (Fig. 2). Aerial parts are taken habitually, easy to get and energetic organs of the plant; moreover primary metabolite and second-ary metabolite are accumulated in these parts. Underground portions, i.e. roots and rhizomes also store energy and manufacture secondary metabolite.
Dosages for every treatment are subjected to the age, gender, physical appear-ance or fitness of the patient. Decoction (boiling with water for oral dose and sink in alcohol for external application) and demulcent (mixing with ingredient such as jaggery, butter, milk, glycerin, and honey) are the most familiar mode of preparation.

107Pharmaceutical Ethnobotany Survey of Anticancer Plant Resources
Table1: List of Medicinal Plants mentioned by Thai Traditional Practitioners for treatment of CancerTable 1. List of Medicinal Plants that mentioned by Thai Traditional Practitioners for treatment of Cancer Sr. No.
Family and Scientific Name Myanmar Name
English Name
Condition and habit of species
Part Use Uses
1. Annonaceae Miliusa velutina Hook. f. & Thomson Uraria ptychocalyx Roxb.
Tha but Gyi Tha but Nwe
Dom-sal
W (T) W (Cl)
Stem Root, Leaves
Nose cancer (Thai) Prostrate gland cancer (Thai); toothache (Myanmar)
2. Apocynaceae Holarrhena antidysenterica Wall. Wrightia arborea (Dennst.) Mabb.
Let Htoke Gyi Let Htoke lay
Bitter oleander Queen wrightia
W, G(T) W (T)
Bark Root
Intestine cancer (Thai); Anti-dysenteric, anti-inflammatory, uterine relevant, menstrual diseases, Antimicrobial (Myanmar) Kidney failure and related diseases (Thai, Myanmar)
3. Araceae Amorphophallus campanulatus (Roxb.) Blume ex Decne.
Wa U
Elephant food yam
W, G (H)
Rhizome
Liver cancer (Thai); Slim aid (Myanmar)
4. Caesalpiniaceae Cassia siamea Lam. Cassia fistula L.
Mae Zali Ngu
Winged cassia Shower tree
W,G (T) W, G (T)
Bark, Leaves, buds Fruits Leaves, buds
Kidney failure (Thai) , Tonic, insomnia (Myanmar) Intestine cancer (Thai); antiviral, skin diseases, carminative, arthritis, Antimicrobial, diuretic, gastrointestinal disease (Myanmar)
5. Casuarinaceae Casuarina equisetifolia Ferst.
Pin Lae Ka Vwe
W,G (T)
Bark
Liver cancer (Thai)
6. Celastraceae Lophopetalun fimbriatum Wight.
Yae Main
W (T)
Bark
Skin cancer, internal organ cencer (Thai)
7. Combretaceae Terminalia chebula Retz. Terminalia bellerica Roxb.
Phan Gar Thit saint
Chebulic myrobalan
W, G(T) W(T)
Root, bark Root Bark
Liver cancer, intestine cancer(Thai); diarrhea, dysentery, wound healing (Myanmar) uterus cancer (Thai); asthma, cough, antimicrobial (Myanmar)
Fruits tonic, appetizer (Myanmar) 8. Ebenaceae
Diospyros ehretioides Wall. Aut Chin zar
Persimmon
W (T)
Bark
intestine cancer (Thai)
9. Euphorbiaceae Bridelia retusa (L.) A. Juss. Croton joufra Roxb.
Seik Che Thet Yin Kado
Kowli
W (T) W (T)
Bark Bark
Lung cancer (Thai) Intestine cancer (Thai); Gastrointestinal diseases, anti-inflammatory for liver, lung, joints, ulcer, snake bite (oral dose) (Myanmar)
10. Fabaceae Butea frondosa Roxb. Dalbergia cultrate Grah. Pterocarpus microcarpus Kurz.
Pauk Yin Taik Thit Pa dauk
Flame of forest Amhri
W (T) W (T) W, G (T)
Bark Flower Bark Root Wood, bark leaves
Intestine cancer (Thai); anthelmintic, ulcer, Diuretic (external use) (Myanmar) Lymphatic cancer (Thai); Hepatic disorder, diuretic, Itching, skin diseases (Myanmar) Internal organ cancer (Thai); kidney failure, Toothache (Myanmar)
11. Hypericaceae Cratoxylon neriifolium Kurz.
Bebya
Bebya
W (T)
Root, stem
Liver cancer, intestine cancer (Thai)
12. Hypoxidaceae Curculigo orchioides Gaenth
Myet Ga Mone
Curculigo, Golden eye grass
W (H)
Rhizome
Uterus cancer (Thai)
13. Loganiaceae Strychnos nux-blanda L.
Kha baung
Strychnine tree
W (T)
Bark Seeds
Liver cancer (Thai) Diarrhea, dysentery, eye infection (Myanmar)
14. Mimosaceae Mimosa pudica L.
Hti Ka Yone
Mimosine
W (S)
Whole plant
Liver cancer, Heart disease (Thai); Kidney stone, asthma, intestinal bleeding, anti-inflammatory (Myanmar)
15. Minispermaceae Stephania verosa (Bl.) Spreng.
Taung Kyar
W (Cl)
Rhizome
Uterus cancer (Thai, Myanmar)
16. Moraceae Ficus callosa L. f. Streblus asper Lour.
Kha Aung Oat Ne
Country fig Toothbrush
W (T) W (T)
Bark Root
Liver cancer (Thai) Lung cancer, Liver cancer, intestine cancer (Thai)
tree Carminative, antimicrobial (Myanmar) 17. Rubiaceae
Mitragyna rotundifolia (Roxb.) Kuntze Randia dumetorum Lam.
Bin Ga Say Than bayar
Emetic nut
W (T) W (T)
Bark, stem Stem
Lung cancer, intestine cancer (Thai) All organs (Thai)
18. Rutaceae Zanthoxylum budrunga Wall.
Ma Yar Nin
jingbawng
W (T)
Fruits
Liver cancer, uterus cancer, skin cancer (Thai)
19. Sapindaceae Scheichera oleosa (Lour.) Oken
Gyoe
Ceylon oak
W (T)
Bark
Good blood circulation (Thai),
20. Schophylaceae Scoparia dulcis L.
Say cho
W, G (H)
Whole plant
Lung cancer (Thai); asthma, toothache, antipyretic (Myanmar)
21. Sterculiaceae Pterospermum semisagittatum Buch. Ham.
Na gel
Mucukunda
W (T)
Stem
intestine cancer (Thai)
22. Tiliaceae Berrya ammonilla Roxb.
Phet won
W (T)
Root Leaves
Prostrate cancer (Thai); inhaler (Myanmar)
23. Verbenaceae Tectona grandis L. f.
Kyun
Teak
W, G (T)
Leaves Bark Wood
Diabetes, all organ cancer (Thai), Diarrhea (Myanmar) Anti-inflammatory (Myanmar) Itching (Myanmar)
W: found only in wild; W, G: found both in wild and at home garden; T: Tree; S: Shrub; H: Herbs; Cl: Climber

108 Khin Thantsin, San San Aye, Khin Thandar Win
Preparation mode of drug for each plant is the most difficult section to report be-cause this research just relies on the opinion of traditional practitioners.
DISCUSSIoN AND CoNCLUSIoNBotanical Resource Habitat and Current StatusThe specimens reported in this study were collected at wild state; in the Hlawgar Wildlife Park, although some of them can be seen in the home garden, namely Hol-arrhena antidysenterica Wall., Cassia siamea Lam., Cassia fistula L., Terminalia chebula Retz., Casuarina equisetifolia Ferst., Pterocarpus microcarpus Kurz., Scoparia dulcis L., Tectona grandis L. f. and Amorphophallus campanulatus (Roxb.) Blume ex Decne. They have medicinal value and Myanmar people planted them in home garden. The plants species can also find in home garden are 28% and only in wild are 72%. My-anmar practitioners still believe that medicinal plants from nature are more effective in the treatment of diseases. Therefore, traditional practitioners collect material of plants for medicines in the wild. Collecting from natural condition is a huge hazard for the plants.
It is normal through changes in the location and biotic conditions that more plants species were used in the earlier period than now. The present data are useful to help the modern health care system and the production of synthesized drug. Fur-thermore, crisis on habitat disappearance or extinction of plant species and disap-pearance of the indigenous knowledge has led the exhaustion of the specific plant resources and their related information. Moreover, information on ethnopharma-ceutical plant species is extinct because most of the traditional remedy practitioners have passed away without correctly transferring their knowledge to the new genera-tions especially in Myanmar.
In some plant species like Zanthoxylum budrunga Wall., Thai traditional prac-
Figure2: The plant parts used of Thai and Myanmar traditional medicine

109Pharmaceutical Ethnobotany Survey of Anticancer Plant Resources
titioners used for treatment of cancer and also described its antioxidant activity by Islam et al. [2014]. However, Myanmar people did not use it as medicine. However, 19 species had significant use such as Uraria ptychocalyx Roxb., Holarrhena anti-dysenterica Wall., Wrightia arborea (Dennst.) Mabb., Amorphophallus campanulatus (Roxb.) Blume ex Decne., Cassia siamea Lam., Cassia fistula L., Terminalia chebula Retz., Terminalia bellerica Roxb., Croton joufra Roxb., Butea frondosa Roxb. Dalbergia cultrate Grah., Pterocarpus microcarpus Kurz., Strychnos nux-blanda L., Mimosa pudica L., Stephania verosa (Bl.) Spreng., Streblus asper Lour., Scoparia dulcis L., Berrya am-monilla Roxb. and Tectona grandis L. f.. because those species were mentioned by both Thai and Myanmar traditional practitioners, but widespread use of plant parts and target diseases were different. It might be cause of divergence of knowledge of ethnopharmacology due to a lack of properly transfer of their awareness to the next generations. On the other hand, Thai practitioners and Myanmar practitioners were agreed in the use of Wrightia arborea (Dennst.) Mabb. for the treatment of kidney failure and related diseases, and also Stephania verosa (Bl.) Spreng. for the treatment of uterus cancer.
Ethnobotanical Resource trade and HazardCollection of plant genetic resources from the nature tend to lead to the reduction in biodiversity found in all over the world. Extreme harvest of underground organs and/or reproductive organs which are vital to the continued existence of the plants often leads to the depletion of plant resources. In this study, among 32 species 26 are trees and need a long period to grow. It takes for some plant 3-4 years to reach the flowering and fruiting stage, reducing their regeneration possibility. Nowadays, Myanmar traditional practitioners intentionally grow medicinal plants at different levels for their production of herbal medicine. But they were capable of growing only a few species; others are still in the waiting list, and those other species are fac-ing threats of extinction. Moreover, larger threats for bioresources were collection from the nature for illegal trades in the vast amount. Even in the protective area some medicinal plants were collected from the wild according to the market demand especially for border trade. Hence, plant species noted in this study can be suitable targets for future study.
ACKNowLEDgEMENtSSpecial thanks to Mr. Boon Phyoung and Mrs. Vun Phong Phyoung, Thai traditional medicine practitioners not only for their hospitality and kindness but also for usage of the medicinal plants. The authors are thankful to U Than Swe and Daw Thin Thin Nwe, Myanmar Traditional Practitioners who shared the knowledge of herbal medicine and approached the different mode of preparation.

110 Khin Thantsin, San San Aye, Khin Thandar Win
REFERENCESAnonymous, 2005. Natural Products Isolation. 2nd ed. (edited by Satyajit D. Sarker,
Zahid Latif, Alexander I. Gray). Humana Press, Totowa, New Jersey. Ashin Nargathein, 1977. Pon Pya Say Abi Dan. Illustrated Pharmacopeia. Vol.IV. My-
anmar Mingalar Press, Yangon. (Myanmar Languish) Bodeker, C.G. 1997. Medicinal Plants and forest conservation and healthcare. Publish-
ing Management Service, Information Division, FAO, Viale delle Terme di Caracalla, 00100 Rome, Italy
Cronquist, A. 1981. An Integrated System of Classification of Flowering Plants. Colum-bia University Press, New York.
Hooker, J. D. 1885. The Flora of British India. L. Reeve & Co. Ltd., London.Kress, J.; DeFilipps, R. A.; Farr, E. R.; Yin Yin Kyi. 2003. Checklist of the trees, shrubs,
herbs and climbers of Myanmar: (revised from the original works by J.H. Lace, R. Rodger, H.G. Hundley and U. Chit Ko Ko on the “List of trees, shrubs, herbs and principal climbers, etc. recorded from Burma). Department of Systematic Biology -Botany, National Museum of Natural History, Washington, D.C.
Lawrence, G. H. M. 1969. Taxonomy of Vascular Plants. Xth Ed. The Macmillan com., New York.
Mendonça-Filho, R. R. 2006. Bioactive Phytocompounds: New Approaches in the Phy-tosciences, in Modern Phytomedicine: Turning Medicinal Plants into Drugs (eds I. Ahmad, F. Aqil and M. Owais), Wiley-VCH Verlag GmbH & Co. KGaA, Weinheim, Germany
Islam, M. K., Biswas, N. N., Saha, S., Hossain, H., Jahan, I. A., Khan, T. A., Shilpi, J. A. 2014. Antinociceptive and antioxidant activity of Zanthoxylum budrunga Wall (Rutaceae) seeds. The Scientific World Journal 2014, 1-7.
The population and Housing census of Myanmar 2014 [online] http://countryof-fice.unfpa.org/myanmar/census/

111
Soybean Crop Improvement in Hilly Region of Myanmar
Mar Mar Win1 , Myat Nwe Nwe2 and Tun Shwe3
1. Assistant Research Officer, Food Legumes Section, Department of Agricultural Research, Yezin, Nay Pyi Taw, Myanmar ([email protected])
2. Research Officer, Food Legumes Section, Department of Agricultural Research3. Director, Oilseed crops and Food Legumes Division, Department of
Agricultural Research
ABSTRACTSustainable increases in food crops production will increasingly require integration of improved cultivars and cultural practices to economically achieve improvements in crop productivity and its stability. The major chal-lenge is to produce more from each unit of land and sustain soil health on the other. Crop diversification through leguminous crop of soybean (Glycine max L.) is considered as one of the important options, which can help re-verse the process of system degradation and can prove agronomic and eco-logical benefits simultaneously, while maintaining or enhancing the scale of efficiency of production. Since soybean is the best and cheapest protein source compared to animal protein, demand for soybean is tremendous for food supply. Therefore, improvement of soybean for specific regions at-taches much importances. To identify high yielding varieties ideally suited to the environment and more acceptable for their end-use, yield trials with Yunnan soybean varieties and a local check variety were carried out during a five-year period (2009–2014) at hilly region in Shan State, Myanmar. Effects of yield trials showed that Diancanga 2 and Dian 86-5 gave more yielding and early maturity when compared to the local variety. Diancanga 2 showed greater seed yield advantage ranging from 33 - 45% over the lo-cal variety of Shan Sein in demonstration plot and stable yield at different testing locations of Myanmar. From these results, it can be concluded that Diancanga 2 was the high yielding variety for different hilly regions of Shan State. Therefore, with the introduction of Diancanga 2, the area under soybean will also expand resulting in a betterment of soybean production.
Key Words: Diancanga 2, hilly region, varietal improvement, Yunnan soy-bean varieties
INtRoDUCtIoNSustainable increases in food crops production will increasingly require integration of improved cultivars and cultural practices to economically achieve improvements

112 Mar Mar Win , Myat Nwe Nwe and Tun Shwe
in crop productivity and its stability. The major challenge is to produce more from each unit of land and sustain soil health on the other. Crop diversification through legumes or pulses crop is considered as one of the important options, which can help reverse the process of system degradation and can prove agronomic and ecological benefits simultaneously, while maintaining or enhancing the scale of efficiency of production. Hence, the rotation of cereal crops with legumes, or mixed or intercrops with legumes is essential to keep well soil health and productivity. Soybean (Glycine max L.) is one of the leguminous crops and has had a major impact on the agroecol-ogy and economy of hilly region’s agriculture in Myanmar. They contribute to very largely crop diversity on farming systems of the region.
In Myanmar, soybean (locally known as Peboke) currently grows on 158,000 ha countrywide with the production of 238,000 MT and an average yield of 1.51Mt/ha (MOAI, 2014). Majority of soybean is available in highlands of Shan State (52%) viz., Southern Shan (22%), Northern Shan (21%), and Eastern Shan (9%) State (Figure 1). Soybean grows in three main seasons; (1) the first season crop grows in irrigated areas (from mid December to mid January) after rice harvest. It grows in abundance in Northern Shan State, Eastern Shan State and Kachin State. (2) The second season crop grows in the uplands during the early rainy season (from May to mid June). It was mainly found in Shan State. (3) The remaining soybean crop grows in late rainy season (from September to October) mostly along the river banks after the water has receded. It is really a crop of central dry zone and lower Myanmar.
Soybean is now one of the potential crops among the food legume crops. Be-sides the high yield potential, soybean seed contains approximately 37-41% protein,
pulses crop has been considered as one of the important options, which can help in reversing
the process of system degradation and can deliver many agronomic and ecological benefits
simultaneously, while maintaining or enhancing the scale of efficiency of production. Hence,
the rotation of cereal crops with legumes, or mixed or intercrops with legumes is essential to
improve soil health and productivity. Soybean (Glycine max L.) is one of the leguminous
crops and has had a major impact on the agroecology and economy of hilly region’s
agriculture in Myanmar. Their contribution to increasing crop diversity has had a positive
impact on farming systems of the region.
In Myanmar, soybean (locally known as Peboke) is currently grown on 158,000 ha
countrywide with the production of 238,000 MT and an average yield of 1.51Mt/ha (MOAI,
2014). Majority of soybean is found in highlands of Shan State (52%) viz., Southern Shan
(22%), Northern Shan (21%), and Eastern Shan (9%) State (Figure 1). Soybean is grown in
three main seasons; (1) the first season crop is grown in irrigated areas (from mid December
to mid January) after rice harvest. It was mainly found in Northern Shan State, Eastern Shan
State and Kachin State. (2) The second season crop is grown in the uplands during the early
rainy season (from May to mid June). It was mainly found in Shan State. (3) The remaining
soybean crop is grown in late rainy season (from September to October) mostly along the
river banks after the water has receded. It was found in central dry zone and lower Myanmar.
Figure 1. Share of different regions of soybean production in sown area (2014-2015) in
Myanmar Figure1: Share of different regions of soybean production in sown area (2014-2015) in Myanmar

113Soybean Crop Improvement in Hilly Region of Myanmar
18-21% oil, 30-40% carbohydrate, and 4-5% ash (Hulse, 1996). Its capacity for protein and oil production makes it a significant contributor to human nutrition and animal feed, and its characteristic symbiosis with root bacteroids makes it a very important crop by research. Therefore, improvement of soybean for specific regions is very essential. To maximize soybean productivity for specific regions, research pro-grams mainly focus on varietal improvements of different ecosystems. There was also excellent cooperation with the Institutes from Thailand, China and Korea through the introduction of breeding materials and conducts soybean research for the devel-opment and identification of suitable soybean cultivars adapted to different regions and development in Myanmar. Therefore, a total of 10 varieties of soybean (5 varie-ties in 2009 and 5 varieties in 2010) were introduced from Yunnan Academy of Ag-ricultural Sciences, China. The study was made with the objective of identification of high yielding varieties which was well adapted to hilly region of Shan State and more acceptable for their end-use.
MAtERIALS AND MEtHoDSThe research was carried out during a five-year period (2009–2014) at the experi-mental fields of Food Legumes Section, Yezin (19˚ 50´ N; 96˚ 16´ E; 100 m msl), Aungban (20.67˚ 40´ N; 96.62˚ 38´ E; 1369 m msl), Taryaw (20˚ 37´ N; 96˚ 1´ E; 252 m msl), Loikaw (19˚ 40´ N; 97˚ 12´ E; 872 m msl), and Kengtung (21˚ 18´ N; 99˚ 36´ E; 828 m msl). The experimental materials involved 5 varieties in 2009 and 5 varie-ties in 2010. The tested varieties originated from Yunnan Academy of Agricultural Sciences, China. In each experiment, the introduced soybean varieties were touched upon with local standard check variety. Necessary cultural practices and plant pro-tection measures were done whenever needed. At maturity, yield components and yield were determined. The experimental data of yield components and yield were subjected to ANOVA.
RESULtS AND DISCUSSIoNobservation trialThe observation trial was conducted with a simple design at Yezin during monsoon and post-monsoon season, 2009. The introduced Yunnan soybean varieties were compared to check variety. Effects of monsoon trial showed that highest yield was recorded by Dian 86-5 (2454 kg/ha), followed by Daunfeng (2300 kg/ha) and Dian-canga 2 (1768 kg/ha). These varieties showed superiority over check variety Yezin 10 (1677 kg/ha) (Table1). Results of post-monsoon season showed that highest yield was recorded by Diancanga 2 (1677 kg/ha), followed by Dian 86-5 (1378 kg/ha). These varieties expressed the superiority over check variety Yezin 6 (1262 kg/ha) (Table 1). The results of this study explained that maturity days were shorter in post-

114 Mar Mar Win , Myat Nwe Nwe and Tun Shwe
monsoon season compared to monsoon season. Moreover, the more pod numbers were observed in post-monsoon season. This indicated that Yunnan soybean from subtropical highland climate produced more pods during grown in post-monsoon season of Yezin environment.
Preliminary yield trialAs a preliminary yield trial, field experiments were conducted at Food Legumes Section, Yezin and Aungban Agricultural Research Farm during cool season, 2010. Results spoke of the highest yield as recorded by Diancanga 2 (739 kg/ha) with superiority (14%) over check variety Yezin 6 (648 kg/ha) (Table 2). At Aungban Agricultural Research Farm, highest yield was recorded by Yezin 6 (1121 kg/ha), followed by Diancanga 2 (1096 kg/ha). The results also added that Diancanga 2 va-riety was a promising variety during the cool season. By this study, Yunnan soybean
Theses varieties showed superiority over check variety Yezin 10 (1677 kg/ha) (Table1).
Results of post-monsoon season showed that highest yield was recorded by Diancanga 2
(1677 kg/ha), followed by Dian 86-5 (1378 kg/ha). Theses varieties showed superiority over
check variety Yezin 6 (1262 kg/ha) (Table 1). The results of this study showed that maturity
days were shorter in post-monsoon season compared with monsoon season. Moreover, the
pod numbers were observed more in post-monsoon season. This indicated that Yunnan
soybean from subtropical highland climate produced more pods during grown in post-
monsoon season of Yezin environment.
Table 1. Performance of Yunnan soybean varieties at Yezin during monsoon and post- monsoon season, 2009
Variety
Monsoon season Post-monsoon season Days
to maturity
Pods per
plant
100-seed
wt. (g)
Yield (kg/ha)
Days to
maturity
Pods per
plant
100-seed
wt. (g)
Yield (kg/ha)
Diancanga 2 77 9 13.4 1768 70 32.5 18.0 1677 Zhongpin 661 87 14 14.6 1503 73 30.3 14.8 872 Dian 86-5 87 20 17.8 2454 71 30.5 20.4 1378 Dian 86-4 83 8 17.5 1411 73 37.1 15.9 930 Daunfeng 83 16 15.3 2300 70 21.2 18.0 1187 Check var. 77 15 10.4 1677 70 33.3 14.3 1262 Mean 82.3 13.7 14.8 1852 71 30.8 16.9 1218 SE 1.8 1.8 1.1 175 0.6 2.2 0.9 121 Check var. Yezin 10 in monsoon season, Yezin 6 in post-monsonn season
Preliminary yield trial
As a preliminary yield trial, field experiments were conducted at Food Legumes
Section, Yezin and Aungban Agricultural Research Farm during cool season, 2010. Results
showed that highest yield was recorded by Diancanga 2 (739 kg/ha) with superiority (14%)
over check variety Yezin 6 (648 kg/ha) (Table 2). At Aungban Agricultural Research Farm,
highest yield was recorded by Yezin 6 (1121 kg/ha), followed by Diancanga 2 (1096 kg/ha).
The results showed that Diancanga 2 variety was promising variety during the cool season.
According to this study, Yunnan soybean varieties were observed well performed at Aungban
Research Farm because its location is at highland of Shan State.
Table 2. Performance of Yunnan soybean varieties at Yezin and AungBan during cool season, 2010
Variety
Yezin Aungban Days
to maturity
Pods per
plant
100- seed
wt. (g)
Yield (kg/ha)
Days to
maturity
Pods per
plant
100- seed
wt. (g)
Yield (kg/ha)
Diancanga 2 80 10 14.8 739 101 33 20.3 1096 Zhongpin 661 72 7 13.2 457 92 29 19.0 980 Dian 86-5 78 6 11.9 357 97 32 24.3 797 Dian 86-4 72 5 13.5 340 95 25 20.3 731 Daunfeng 72 7 15.2 531 89 29 20.7 623 Check var. 80 9 13.8 648 104 31 18.0 1121 Mean 76 7 13.7 512 96 30 20.4 891 SE 1.7 0.8 0.5 65.1 2.3 1.2 0.9 83.5 Check var. Yezin 6 at Yezin and Aungban
Advanced yield trial
The Yunnan soybean varieties were sown in advanced yield trial at Yezin and
Aungban during monsoon season, 2011. In these trials, 10 Yunnan soybean varieties were
compared with checks variety (Yezin 6) in randomized complete block design with 3
replications. Although there were significantly differences in yield components, no
significant difference was in yield. Results showed that highest yield was recorded by
Daunfeng (900 kg/ha), followed by Diancanga 2 (835 kg/ha) at Yezin (Table 3). At Aungban
Research Farm, Dian 86-4 (928 kg/ha), Daunfeng (863 kg/ha), and Zhongpin 661(863 kg/ha)
were observed as promising varieties as significantly more yield than Yezin 6 (549 kg/ha)
(Table 3). The results indicated that new Yunnan soybean varieties (YN-V1, YN-V2, YN-S9,
YN-S10, and YN-S11) were not performing well in Aungban environments.
Regional yield trial
Regional yield trials of high yielding Yunnan soybean variety were conducted at
Yezin and Aungban Research Farm in monsoon season, 2012 and Taryaw and Kengtung
Research Farm in monsoon season, 2013. There were significantly differences in yield and
yield components at Yezin and Aungban Research Farm. At Yezin, highest yield was
recorded by Dian 86-5 (1486 kg/ha), followed by Diancanga 2 (1284 kg/ha). At Aungban
Research Farm, these varieties were observed as high yielding varieties compared with local
check variety (Table 4). At Taryaw and Kengtung Research Farm, no significantly
differences were observed in yield and yield components. At Taryaw, Diancanga 2 gave the
Table1: Performance of Yunnan soybean varieties at Yezin during monsoon and post-mon-soon season, 2009
Table2: Performance of Yunnan soybean varieties at Yezin and AungBan during cool season, 2010

115Soybean Crop Improvement in Hilly Region of Myanmar
varieties were observed well performed at Aungban Research Farm because of its location is at highland of Shan State.
Advanced yield trialThe Yunnan soybean varieties were sown in advanced yield trial at Yezin and Aung-ban during monsoon season, 2011. In these trials, 10 Yunnan soybean varieties were compared with checks variety (Yezin 6) in randomized complete block design with 3 replications. Although there were significant differences in yield components, no significant difference was in yield. Results showed that highest yield was recorded by Daunfeng (900 kg/ha), followed by Diancanga 2 (835 kg/ha) at Yezin (Table 3). At Aungban Research Farm, Dian 86-4 (928 kg/ha), Daunfeng (863 kg/ha), and Zhongpin 661(863 kg/ha) were observed as promising varieties as significantly more yield than Yezin 6 (549 kg/ha) (Table 3). The results indicated that new Yunnan soybean varieties (YN-V1, YN-V2, YN-S9, YN-S10, and YN-S11) were not suiting well in Aungban environments.
Regional yield trialRegional yield trials of high yielding Yunnan soybean variety were made at Yezin and Aungban Research Farm in monsoon season, 2012 and Taryaw and Kengtung Research Farm in monsoon season, 2013. There were remarkable differences in yield and yield components at Yezin and Aungban Research Farm. At Yezin, highest yield
highest yield (1712 kg/ha), followed by Srisamrong 1 (1647 kg/ha) (Table 5). At Kengtung
Research Farm, Yezin 3 gave the highest yield (1494 kg/ha), followed by Dian 86-5 (1364
kg/ha) (Table 5).
Table 3. Advanced yield trial of Yunnan soybean varieties at Yezin and Aungban
during monsoon season, 2011
Variety
Yezin Aungban Days
to maturity
Pods per
plant
100-seeds
wt.(g)
Yield (kg/ha)
Days to
maturity
Pods per
plant
100- seeds wt.(g)
Yield (kg/ha)
Diancanga 2 78 17 20.2 835 82 25 15.0 637 Zhongpin 661 79 19 18.3 609 78 18 19.3 863 Dian 86-5 80 30 15.7 710 79 24 21.3 710 Dian 86-4 73 12 18.6 473 79 21 16.7 928 Daunfeng 81 19 18.9 900 89 24 19.7 863 YN-V1 74 16 13.1 548 YN-V2 73 11 17.1 722 YN-S9 88 12 23.8 639 YN-S11 73 12 18.6 573 YN-S10 85 10 20.3 399 74 8 23.7 161 Yezin 6 (ck) 74 17 14.3 731 101 35 15.7 549 F test ** ** ** ns ** ** ** ns LSD(0.05) 4.7 5.2 2.7 135.5 10.3 9.2 3.6 299.1
Check var. Yezin 6 at Yezin and Aungban
According to Board et al. (1997) soybean yield is basically determined by seed size
(grams per 100 seed) and seed number (number per square meter). Seed number is
determined by seed per pod (number) and pod number (number per square meter) and pod
number can be influenced by pod per reproductive node (number), reproductive node number
(number per square meter), percent nodes becoming reproductive (percent) and node number
(number per square meter). In this study, none of the cultivars was superior in all grain yield
components. They were varied from one or few superior components on the one side to
medium or inferior components on the other side. Hence, the level of grain yield was result of
combinations of grain yield components and harvested plants per unit area (data not shown).
Moreover, maturity days were varied depend on sowing date and altitude of tested area.
Results showed that maturity days of the tested variety were shorter in Yezin compared with
the results of other tested locations. It was due to Yezin is at lower latitude and altitude.
Table3: Advanced yield trial of Yunnan soybean varieties at Yezin and Aungban during monsoon season, 2011

116 Mar Mar Win , Myat Nwe Nwe and Tun Shwe
Table 4. Regional yield trials of Yunnan high yielding soybean varieties during monsoon season, 2012
Variety
Yezin Aungban Days
to maturity
Pods per
plant
100 seed
wt.(g)
Yield (kg/ha)
Days to
maturity
Pods per
plant
100 seed
wt.(g)
Yield (kg/ha)
Daepung 79 20 13.0 702 87 12 18.3 509 Diancanga 2 78 24 12.6 1284 107 19 22.3 775 Dian 86-5 84 22 14.4 1486 105 14 24.3 743 Zhongpin 661 78 16 14.6 848 89 17 20.3 670 YN-V1 86 9 17.2 549 94 14 25.0 743 YN-V2 89 19 16.4 1179 103 15 11.7 105 Check var. 81 31 14.3 912 97 22 23.7 686 F test ** ** ** ** ** * ** * LSD(0.05) 4.9 13.2 1.8 444 3.3 13.5 2.6 363
Check var. Yezin 6 at Yezin, Shan sein at Aungban
Table 5. Regional yield trials of Yunnan high yielding soybean varieties during monsoon season, 2013
Variety
Taryaw KengTung Days
to maturity
Pods per
plant
100- seed
wt.(g)
Yield (kg/ha)
Days to maturity
Pods per
pods
Yield (kg/ha)
Dian 86-5 97 51 22.8 1550 113 27 1364 Diancanga 2 101 74 17.3 1712 113 21 977 Srisamrong 1 101 41 20.2 1647 108 25 1284 Yezin 3 88 59 14.0 1413 113 30 1494 Check var. 92 77 21.1 1510 110 20 880 F test
ns ** ns
ns ns
LSD(0.05)
28.0 1.5 331
11.7 573 Check var. Shan war Lone Gyi at Taryaw, Shan sein at Kengtung
Demonstration plot
The demonstration yield trials were conducted during the monsoon season, 2014. The
promising varieties of Yunnan soybean- Diancanga 2 and Dian 86-5 were compared with
local variety at different locations. Diancanga 2 was observed as adaptable variety with good
yield at Yezin, Loikaw and Aungban locations (Figure 2). Dian 86-5 was observed as high
yielding variety at Loikaw. These results were in line with INTSOY Newsletter (1980) that
indicated the cultivars developed in temperate zones can provide large yield under
experimental conditions in the tropics and subtropics and widely adapted than expected.
Table 6. Demonstration yield trials of Yunnan high yielding soybean varieties during monsoon season, 2014
Genotypes Yield (kg/ha) Stability
value Yezin Loikaw Kengtung Aungban Mean Diancanga 2 1671 3028 484 2834 2004 1.0 Dian 86-5 1388 4037 565 2761 2188 1.3 Check var. 1155 2269 727 2059 1553 0.6 Mean 1405 3111 592 2551
Ckeck var. Yezin 3 at Yezin and Shan Sein at Loikaw, Kengtung and Aungban
Conclusion
The results of these experiments revealed that the yields of soybean varieties were varied
significantly in different growing season of Yezin and Aungban environment and monsoon
season of Taryaw, Kengtung and Loikaw. Based on these results, it can be concluded that
Diancanga 2 was the most suitable variety with stable yield for different environments of
Yezin and Aungban. Dian 86-5 was also promising variety for Kengtung and Loikaw
environments. These varieties were early maturity and had large seed size of good grain
quality. Therefore, with the introduction of Diancanga 2, the area under soybean will also
increase resulting in an increase in soybean production.
Figure 2. Pod filling stage of Diancanga 2
Table4: Regional yield trials of Yunnan high yielding soybean varieties during monsoon season, 2012
Table5: Regional yield trials of Yunnan high yielding soybean varieties during monsoon season, 2013
Table6: Demonstration yield trials of Yunnan high yielding soybean varieties during monsoon season, 2014

117Soybean Crop Improvement in Hilly Region of Myanmar
was recorded by Dian 86-5 (1486 kg/ha), followed by Diancanga 2 (1284 kg/ha). At Aungban Research Farm, these varieties were marked as high yielding varieties compared to local check variety (Table 4). At Taryaw and Kengtung Research Farm, no significant differences were observed in yield and yield components. At Taryaw, Diancanga 2 gave the highest yield (1712 kg/ha), followed by Srisamrong 1 (1647 kg/ha) (Table 5). At Kengtung Research Farm, Yezin 3 gave the highest yield (1494 kg/ha), followed by Dian 86-5 (1364 kg/ha) (Table 5).
According to Board et al. (1997) soybean yield is basically determined by seed size (grams per 100 seed) and seed number (number per square meter). Seed number is determined by seed per pod (number) and pod number (number per square meter) and pod number can be influenced by pod per reproductive node (number), repro-ductive node number (number per square meter), percent nodes becoming repro-ductive (percent) and node number (number per square meter). In this study, none of the cultivars was superior in all grain yield components. They varied from one or few superior components on the one side to medium or inferior components on the other side. Hence, the level of grain yield was in fact combinations of grain yield components and harvested plants per unit area (data not shown). Moreover, matu-rity days were varied depending on sowing date and altitude of tested area. Results showed that the maturity days of the tested variety were shorter in Yezin compared to other tested locations. It was due to Yezin is at lower latitude and altitude.
Figure2: Pod filling stage of Diancanga 2

118 Mar Mar Win , Myat Nwe Nwe and Tun Shwe
Demonstration PlotThe demonstration yield trials were conducted during the monsoon season, 2014. The promising varieties of Yunnan soybean- Diancanga 2 and Dian 86-5 were com-pared to local variety at different locations. Diancanga 2 was observed as adaptable variety with good yield at Yezin, Loikaw and Aungban locations (Figure 2). Dian 86-5 was taken into account as high yielding variety at Loikaw. These results were in line with INTSOY Newsletter (1980) that indicated the cultivars developed in temperate zones can provide large yield under experimental conditions in the tropics and subtropics and widely adapted than expected.
CoNCLUSIoNThe results of these experiments revealed that the yields of soybean varieties varied significantly in different growing season of Yezin and Aungban environment and monsoon season of Taryaw, Kengtung and Loikaw. By these results, it is concluded that Diancanga 2 was the most suitable variety with stable yield for different envi-ronments of Yezin and Aungban. Dian 86-5 was also promising variety for Keng-tung and Loikaw environments. These varieties had early maturity and had large seed size of good grain quality. Therefore, with the introduction of Diancanga 2, the area under soybean will also expand resulting in a high soybean production.
REFERENCESBoard, J. E., M. S. Kang, and B. G. Harville. 1997. Path analyses identify indirect
selection criteria for yield of late-planted soybean. Crop Sci. 37: 879-884.Hulse, J.H. 1996. Soybeans: Biodiversity and nutritional quality. In: The 2nd Interna-
tional Soybean Processing and Utilization Conference. Ministry of Agriculture and Cooperative, Bangkok, Thailand. 1-13.
INTSOY Newsletter (1980). INTSOY research highlight on history of soy in Southeast Asia: Soybean genetic improvement program. No. 20. p. 1-2, Feb.
MOAI (Ministry of Agriculture and Irrigation). 2014. Myanmar Agriculture at a Glance. Department of Agricultural Planning, Ministry of Agriculture and Irrigation.

119
Traditional Homestead Management in Floodplain Bangladesh
Keiko YoshinoAssociate Professor, Department of Geography, Tokyo University of Agriculture
(Mail: [email protected])
ABSTRACTThis paper discusses the traditional homestead management performed in rural floodplain Bangladesh. Homesteads provided the living base through-out the year protecting inhabitants from windows and flooding. Home-steads were constructed by double mounding, and continuous maintenance was needed. By mounding soil, various plants and livestock could be kept. Homestead was the man-made subsistence forest garden. In homesteads, communal function such as mutual help existed based on non-monetary activities. The subsistence nature of homestead production enabled such social networks, and women have been the important actors in homestead management.
Key Words: Bangladesh, floodplain, homestead, subsistence, man-made forest, women
INtRoDUCtIoNBangladesh is located on the estuary of three huge international rivers; the Ganges, the Brahumaputra, and the Meghuna. In the active floodplain where land is inun-dated under the water in rainy season, people raise the land to get secure place from inundation as homestead. Homestead in Bangladesh is called bari, or barir-bhiti. Bari means “the place to live on”, and bhiti means “raised place”. The place where was raised to live on is barir bhiti. In the raised homestead, various plants are grown, and various livestock is kept. Homestead used to be made up by tremendous manual la-bor, but these days, situation changed. The occurrence and the degree of floods have decreased because of embankments construction and the change of water flow from upper stream (the change of water use and also the change of climate). In addition, machineries have come to be used for the construction of homesteads.

120 Keiko Yoshino
This paper focuses on the traditional homestead management in active flood-plain in Bangladesh performed by the 1990’s, in which local people’s deep under-standing of surrounding nature and devices to maintain their basic livelihood can be realized.
RESEARCH VILLAgE AND tHE BASIC StRUCtURE oF HoME-StEADDakshin Chamuria village (D village hereinafter) in Tangail district, located in the active Jamuna floodplain is the research village (Figure 1). D village is inundated in rainy season, and to get safe homestead, mounding is needed.
Before around the end of twenty century since when the cycle of floods changed and flooding became seldom, fields inundation used to start in June when the rainy season set off, and in August, the water level reached the peak which ranges one to three meter depth. Then the water level decreased gradually, and when the dry season came in November, the flood disappeared. Homestead in D village had been formulated on the point bars where the land is relatively high. Homesteads were constructed by raising the land. Basically homesteads were constructed by making use of natural micro topography, and offered villagers with the place free from inun-dation in rainy season, and living base where people could walk freely.
D village is composed of four hamlets (para); north, middle, east and south paras. In a para, there are several chaklas (cluster of homesteads adjoining one each other) where one can move without any vehicles even in flooded season. One chakla in the middlle para was selected as the sample chakla (Figure 2). The total number of households increased from 538 in 1992 to 627 in 2006. In 1992, there were 206 households (khanas) (38% of total households) that had no farmland but there were only 21households (4%) that did not own homestead.
Figure3 is the layout of sample chakla. The typical components of homestead are, from the south to the north, “Kachar/dhar” (slope), palan (inner garden): ‘uthan’
Plate1: Homestead from the sky (in 1994.7) (Plate by author)
Plate2: Homesteads like islands (in 1994.7)(Plate by author)

121Traditional Homestead Management
(middle yard), ‘jongol’ (backyard) and ‘doba’ (ditch). The position of each component was decided by considering both protection from the north-west monsoon during the winter season and the flow of floodwater also from the north-west.
Here were 19 households of four patrilineal groups in 1992 in Figure 3. Each household had distinct border of its homestead. As mentioned before, homestead is raised several meters higher than fields, and the place from where the soil was dug
Figure1: Location of D village(source by Yoshino, 2009)
Figure3: Layout of sample chakla in D village in 1992(source by Yoshino, 2009)
Figure2: Distribution of homesteads in D village in 1990 (Source: Topographical data from Ando et al. 1990)

122 Keiko Yoshino
Figure4: Typical structure of homestead in D village(source by Yoshino, 2009)
Plate 3: slope (Kachar) covered with climbing vegetables (in 1994.)
Plate 4: Taro on the upper part of kachar (in 1989.1)
Plate 5: Inner part of homestead (in 1989.1)
Plate 6: Homestead is the place for livestock raising (in 1994.1)
Plate 8: Coppice and ditch from the north side (in 1993.2)
Plate 7: Various work is done in homestead (in 1988.12)
Plate 9: Ditch. boat is sunk dur-ing dry season (in 1993.2)
Plate 10: Fishing in the pond (in1988.12)
(Plates by author)

123Traditional Homestead Management
becomes the hole, and water gathers there. This water ditch is called doba or pagar distinguished by pukur that means ponds.
The slope from homestead to the fields (khet in Bengali) is called kachar or dhar. Slope is sunny but inundation prone space, and used for winter vegetable (dry season) growing. In winter season, slope used to be covered with climbing vegetables (Plate 3).
There is a small patch of cultivated land in-between slope and fields. This land is called palan, and used in different way (seedbeds and vegetable & spice growing etc.) from fields. Palan will be the part of homestead when it is expanded in the future, and usually, the owner of the homestead owns the adjacent palan as well. Gar-dens in homestead are also called palan. Palan used to mean “garden” formerly, but this word has expanded its meaning these days, and “the land around the homestead” has come to be called palan. Homestead and palan were regarded as the territory within where women could move by their own customarily.
Uthan (middle yard) is not only a place for daily living but for production, in particular, for growing vegetables fruit trees, and raising livestock such as cat-tle, goats, chicken, geese, and pigeons. Since it had not been thought of to be the good manner for women to move outside freely, yard was the only place where adult women could move freely (Plates 5,6,7).
Jongol (coppice) in D village had danger to be inundated since it is lower than yard. Coppice is covered with denser vegetation and maintained with less care than other components. Coppice provided wood for timber and fuel, and also other materials such as fiber, oil, medicine and so forth (Plate 8). It was also the place for excretion and storage of ash and fallen leaves as organic matter, too. Since homestead in D village is constructed on the naked land, every plant in homestead is the result of selection by the inhabitants although it seems like a weed.
Water reservoirs such as tank and ditches are used for fishing, bathing, and washing clothes. Ditches used to be the place for the processing of jute, too. Fish culture in ponds attracted villagers because of its high profit.
to Have own HomesteadWhen one constructed a new homestead, he needed to prepare the land both for homestead and for digging soil for mounting. He had to prepare the expense for hiring digging labor, too. For the construction of new homestead, it was generally thought that it costed two thousand taka (one taka was equivalent to about 3 yen in June, 1994. The average wage of day laborer was 20 taka) per one decimal to manage the expense for buying land and hiring the labor. Making new homestead meant the loss of cultivated land, on the other hand. Because of the importance of homestead
(Plates by author)
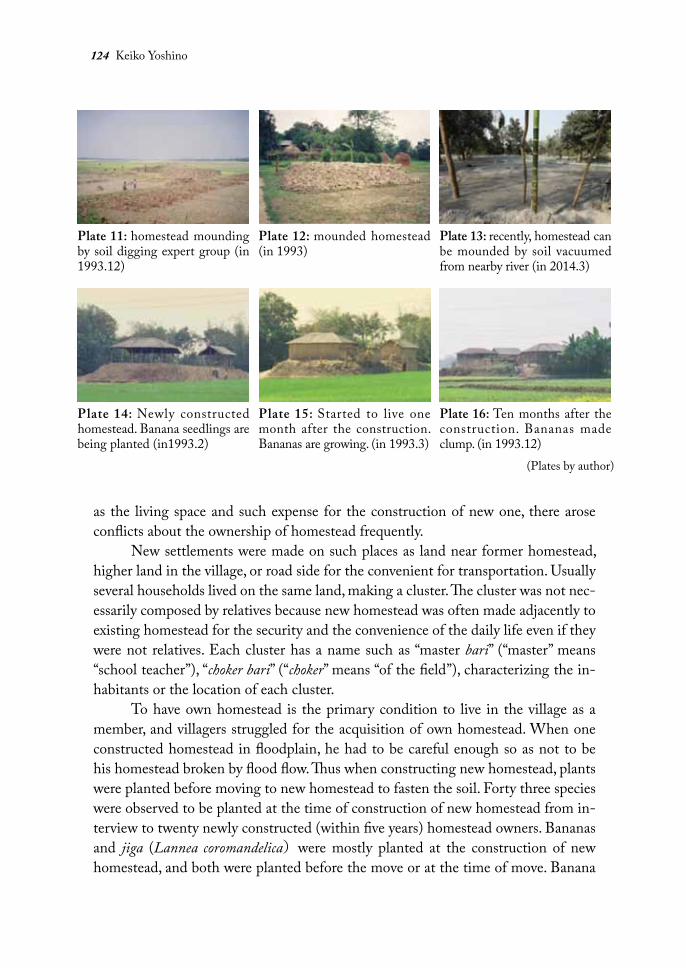
124 Keiko Yoshino
as the living space and such expense for the construction of new one, there arose conflicts about the ownership of homestead frequently.
New settlements were made on such places as land near former homestead, higher land in the village, or road side for the convenient for transportation. Usually several households lived on the same land, making a cluster. The cluster was not nec-essarily composed by relatives because new homestead was often made adjacently to existing homestead for the security and the convenience of the daily life even if they were not relatives. Each cluster has a name such as “master bari” (“master” means “school teacher”), “choker bari” (“choker” means “of the field”), characterizing the in-habitants or the location of each cluster.
To have own homestead is the primary condition to live in the village as a member, and villagers struggled for the acquisition of own homestead. When one constructed homestead in floodplain, he had to be careful enough so as not to be his homestead broken by flood flow. Thus when constructing new homestead, plants were planted before moving to new homestead to fasten the soil. Forty three species were observed to be planted at the time of construction of new homestead from in-terview to twenty newly constructed (within five years) homestead owners. Bananas and jiga (Lannea coromandelica)were mostly planted at the construction of new homestead, and both were planted before the move or at the time of move. Banana
Plate 11: homestead mounding by soil digging expert group (in 1993.12)
Plate 14: Newly constructed homestead. Banana seedlings are being planted (in1993.2)
Plate 12: mounded homestead (in 1993)
Plate 15: Started to live one month after the construction. Bananas are growing. (in 1993.3)
Plate 13: recently, homestead can be mounded by soil vacuumed from nearby river (in 2014.3)
Plate 16: Ten months after the construction. Bananas made clump. (in 1993.12)
(Plates by author)

125Traditional Homestead Management
grows first, and the early harvest could be expected. In addition, local variety with seeds is regarded to be tolerant with water inundation to some extent, and suitable for soil fastening. Jiga can also survive under the water, and can be propagated eas-ily by cutting and revives from the root. With such strength, jiga had been used as border tree of homestead. Besides banana and jiga, important fruit trees like mango, jackfruits, and useful plant like bamboos, and the plants for fastening the soil like Saccharum spontaneum and Ipomoea fistulosa were planted.
Villagers make up their own small forests in homestead. New homestead is poor in vegetation, but the soil is fertile. With fewer plants, it is sunny place, too. Thus the vegetable planting before moving was thought to be preferable. Among research households, pumpkin, potato, tomato, and egg plant were planted before move. If one had time to move, it was preferable to wait for the soil to become firm by planting trees and growing vegetables one to two years before moving. In particu-lar, taro and turmeric were said to grow well.
Homestead construction does not end at once. Homestead was damaged by flood water every year, and sometimes inundated. At the time of severe flood in 1988, even homesteads that had existed since British period were inundated as shown in figure 5. After the flood was gone, inhabitants raised their homestead again. The regular showers in rainy season also do harm the surface of homestead and earthen building. The yard and the base of the buildings are regularly maintained by women. When the surface soil was washed away and the sand came to stand out, inhabit-ant thought that the homestead was at the danger to be broken. It also meant the decrease of soil fertility. To avoid the break down, villagers provided muddy soils from the bottom of the ditch. Soil of the bottom of ditch is clayey, and has power to fasten. Surface soil of homestead was gathered to the surrounding ditches, and it means regenerating the fertility.
To be able to expand the homestead, and to be able to get soil, neighboring
Plate 17: Clayey soil were be-ing dug from the base of ditch to maintain homestead floor. (in 2007.3)
Plate 18: Homestead border is mounded prevent the flow of rain water from adjacent house-hold. (in 1993.5)
Plate 19: Base of building is maintained regularly with care by women. (in 2007.3)
(Plates by author)
(Plates by author)

126 Keiko Yoshino
land was preferable to be owned by the inhabitant. Figure5 shows the owners, and it indicates that the homestead owners owned the neighboring land, too. In the ad-jacent garden (palan), women gathered cooking refuge, and gathered rubbish called jhadu by sweeping homestead. Jhadu contains excrete of livestock and cooking rub-bish, it is fertile.
Homestead as Production BaseHaving been free from submersion by flood, homestead enabled plants to grow throughout the year, and it provided the only place for growing perennial plants and raising animals. Cattle, goats, chickens, geese, pigeons are kept in case households.
With regards to plantation, we found 126 species in homesteads in 1992. Homestead was also the main growing place for vegetables as daily food material. In homestead, various traditional vegetables called torkari, were grown by women. Climbing species such as bottle gourd, pumpkin, and legumes like country beans, cow pea, and sword beans were planted.
All the usage by the plants observed in homestead was summarized into 13 usages (food material, medicine for human beings, fodder or medicine for livestock, timber and tool material, fuel, earth retaining, fence, hide for fish, play and orna-ment, and so forth). In homesteads in D villages, one plant was used for 2.5 usages on average. Perennial plants were used more diverse (2.8 usage on average) than an-nual plants (1.8 usage on average).
Picking up the plants that were used for multipurpose, six usages was most
Figure 5: Expansion and inundation of homestead by flood in 1988 in D village(source by Yoshino, 2009)

127Traditional Homestead Management
diverse observed on local banana, five usages on jackfruits, marmelo, tamarind, shobri banana and Aphanamixis polystachya. four usages on mango, jujube, date sugar palm, coconuts, Bengal persimmon, bottle gourd, Litsea monopetala, Phyllanthus reticula-tus, and Barringtonia acutangula. Vegetables were used only for limited purpose, but bottle gourd was used for multipurpose. Those plants, except for shobri banana and coconut, existed for generations in D village, and very common plants. Among such multipurpose plants, there were plants which no commercial value was found are contained. The usages of these plants were explored for generations to suffice the everyday needs in the life rather than commercial purpose.
The richness in species in homestead was outstanding compared to the other production area like fields (khet) and gardens (palan) (Figure 6). Homestead was expected to serve as the comfortable place to live, and to be the supplier of daily various needs why the production in homestead was so diverse. Homestead in D vil-lage is the artificial place made by the inhabitant, and only the place where perennial plants can grow. With limited space, planted plants or plant that were not removed are expected multiple roles from all the part of the plant.
The will of villagers to live on the floodplain and the wisdom and devices
Figure 6: Homestead as production base(source by Yoshino, 2009)

128 Keiko Yoshino
fostered for generations formulated the present status of homestead plant utilization which tried to make full use of all the parts of plants. The medicinal use typically shows inhabitants’ attitudes. To make full use of plants, to live with plants, this is the basic and typical characteristics of the plant utilization in flood plain in Bangladesh.
women’s Society Based on the HomesteadIn Bangladesh, most women marry in the husband’s homestead. They used to stay in homestead except for visiting father’s bari once or twice a year by1990’s. They visited neighboring houses, but it was few to go farther. When some accident happened in the village, they used to stand at the upper part in homestead to see what was hap-pening. Just the resource poor households who could not manage their own resourc-es by their own or purchasing, women went out from homestead to get food and fuel sources such as fallen cow dung, left over of rice straw, wild vegetables and so forth. They also worked out for helping postharvest work to get by products as reward。
On the other hand, men stayed outside for many hours. In addition to farming and other jobs, they gathered at tea stalls or groceries for conversation in the evening. Marketing at the bazaar was also men’s work. Through conversation, they got new information. Prayer in the Mosque, village gathering participation were also men’s activities. Wives knew the topics in village/hamlet gathering through husbands, neighbors and those who visited their homestead.
In the 1990’s, there were few households that owned TV, and at night, many neighbors regardless the sex or age would gathered to the TV owner’s house and would enjoy the dramas together. At the chilly night in winter season, the voices of conversation would be heard around the cooking stove until late among neighboring women and men who could not sleep well by the coldness.
It is generally said that women’s activity area expanded by the penetration of market economy. Since around 1990, various NGOs started activities in D village and offered various chances to go outside the village. But rural women’s activities kept quite unchanged in general, and activities were still performed based on home-stead.
Figure 6 shows the acquisition routes of plant resources and the sharing of use of facilities of tube well and dhenki(threshing pedal). There were four patrilineal groups (A-D&P, E&F, J&K, L-N)
Tube wells and threshing pedals were privately owned, and not all possessed although they were necessary to live in the village. Tube well sand threshing ped-als were mostly used by women. You can see that tube well and threshing pedal were commonly shared among neighbors. It was not the matter on which patrilineal group the household belongs to. Rather, the performance of each facility was prior-itized, and there was no question for hiring.

129Traditional Homestead Management
With regards to the plant resource acquisition routes, the thickness of the line reflects the amount of move of the resources. Women got more ratios within chakla than men. Those women who got resources from outside chakla was the widowed woman, aged women and unmarried daughters, who were allowed relatively free movement. As the suppliers of plant resources, Family E and Family L were the major suppliers. Their homesteads were wider and the plant diversity was higher.
CoNCLUSIoNHomesteads provided the living base throughout the year protecting inhabitants from windows and flooding. Especially for homesteads in floodplain, the prepar-edness for the floods was needed. Traditionally, homesteads were constructed by double mounding preparing for flood, and also continuous maintenance was needed to avoid collapse. By mounding their living base, inhabitants could move without any vehicles even in flooded period, and working space was also secured. Since free movement of women was not thought of to be good manner, homesteads was the almost only place for women’s daily activities.
By mounding soil, various plants, especially for perennial plants, could grow, and also various livestock could be kept. Homestead was the man-made subsistence
Figure 7: The routes of pant resource, and the communal use of homestead facilities(source by Yoshino, 2009)

130 Keiko Yoshino
forest garden based on deep understanding of nature by local people fostered gen-erations of interaction. Women were the main care takers of homestead, and provid-ers of daily necessities from homestead production.
Homesteads are comprised of non-relative families, Communal function such as mutual help existed based on non-monetary activities. The subsistence nature of homestead production enabled such social networks.
REFERENCESAndo K. Tanaka K., Keshav R, and Mukai S., 1990, Cropping Patterns in Lower
Bengal Delta, South East Asian Studies (28)3:286-301. (in Japanese)Kaida Y. (ed), 2003, Action Research Study on Rural Development in Bangladesh,
The Commons, Tokyo (in Japanese)Yoshino K., 2013, Homesteads and Indigenous Knowledge, Kyoto University Press,
Kyoto.(in Japanese)Yoshino K., 2009. Homestead Plantation in Bangladesh, Kyoto University (disserta-
tion, in Japanese).

131
Workshop on reduction of severe wind damages in Bangladesh
Yusuke YamaneFaculty of education, Tokoha University, Shizuoka, JAPAN
(Mail:[email protected])
ABSTRACTThis paper speaks of the outcome of workshop to minimise damage of se-vere local storm, such as tornado, in Bangladesh. The workshop was held for local people in rural area in Bangladesh. The detailed of the workshop enhances motivation for learning more about severe local storm with risk reduction and perception. And, we noticed that it is necessary to include visual material such as photograph and movie and practical exercise in the program.
Key Words: severe local storm, workshop, damage reduction, Bangladesh
INtRoDUCtIoNSevere local storms, such as tornadoes, frequently occur in Bangladesh, and cause damages almost every year. There are many severe local storms during the pre-mon-soon season from March to May, peaking in April (Yamane et al., 2010a). Tornado occurred in Mymensingh on 14 April 2004 and caused 66 deaths. Tornado occurred in Tangail on 13 May caused 700 deaths and 34105 injured.
Interview survey by local people was investigated to clarify actual situations of damages of severe local storms in Aug. 2009 and Aug. 2010.
We organized the workshop to enhance knowledge and skill of local people for minimising damages of severe local storms. We attempt to promote knowledge, skill and awareness of local people for disaster prevention through workshop in lo-cal area. This paper summarizes the results of questionnaires to participators in the workshop.
SUMMARy oF tHE woRKSHoP CoNDUCtED IN tHE PRESENt StUDyThe place and date of workshop
• Kazir Shimla Government Primary School, Mymensingh, Bangladesh

132 Yusuke Yamane
• 23 August, 2015Contents of the workshops• Lecture on basic knowledge of severe local storms based on the results of
Yamane et al. (2010a) and Yamane et al. (2013)• Group discussion about proper behaviors when facing to severe local
storms in the following situations:» When you are in the present building» When you are in a vulnerable house common in rural areas in Bang-
ladesh» When you are in a play ground
• Presentation of the summary of group discussion• Information about participators
» Number of participators:19 (Male:15 Female:4)» Job (Teacher:6 Agriculture:3 Business:3 Service:1 Journalist:1 Oth-
er:5)» Age (20-29:2 persons 30-39:2 persons 40-49:4 persons 50-59:5 per-
sons 60-69:5 persons 70~:1 person)
RESULt AND DISCUSSIoNThe summaries of questionnaire are as follows:
• I want to know more about severe local storm and risk reduce skill.• This workshop is important and should be held regulary in other places
for involvement of more people.• I wanted to know more about technic to avoid damages of storms and
daily preparations.
Most of participators were satisfied with the workshop and could understand its utility. Almost all participators think this workshop should be held in the future. While most of participators were interested in almost all contents of the workshop, the number of participators who felt usefulness and importance counts a little.
CoNCLUDINg REMARKSIt is necessary to come our program of workshop into great prominance in the fu-ture. This should be as follows:
• To suit the programs well and daily preparations to minimise damages.• To utilize more photographs and movies to grasp visually.• Use is made of practical exercises in workshop program.

133Workshop on reduction of severe wind damages
REFERENCESY. Yamane, M. Kiguchi, T. Hayashi, A. M. Dewan and T. Terao, 2013: Characteris-
tics of damages of severe local storms based on field surveys in Bangladesh, Journal of Disaster Research, vol.8, No.6, 1052-1060.
Y. Yamane, T. Hayashi, A. M. Dewan and F. Akter, 2010: Severe local convective storms in Bangladesh: Part 1. Climatology, Atmospheric Research, 95, 400-406.


135
Rural Development in Bhutan: A case study of Chokhortoe Village
Jigme NorbuStudent, BA (Economics & Geography) Sherubtse College, Royal University of Bhutan
(Mail: [email protected])
ABSTRACTA rural place in Bhutan provides space to more than 60% population of Bhutan. Developing such area has a long term effect in mitigating some of national issues. This paper focuses on general scenario of rural development in Bhutan specifically concerning Chokhortoe village. Since there is no study done specifically focusing on rural development in any rural area of Bhutan, this paper is fully developed based on observation of the area over the years. This study is done so as to provide platform to do comprehensive and empirical study on the rural development. As for the objective of the study, it gives the general scenario of the Chokhortoe Village. Transition in variables such as source of income and living standard are looked into to understand the developmental process. Potato and Corycep has provided good source of income for people of Chokhortoe village. This has some-how saved the area from infecting with the issues of rural-urban migration which is very interesting one. Upcoming development of very important institution such as GNH Center is expected to further benefit the people of Chokhortoe in times of need.
Key Words: rural development, source of income, rural-urban migration, future prospective
INtRoDUCtIoNWith its more than 60% of population living in rural area, Bhutan has considered pushing its priority in development of rural areas. The means of transportation is the key factor to the development process the first constitutionally elected government focused on connecting all the Gewogs with roads. Increased in accessibility has had positive impact on the rural development in all the regions of Bhutan. Chokhortoe a village in Bumthang Dzongkhag is one of the rural areas experiencing the influx of new development.

136 Jigme Norbu
Bumthang one of the districts located centrally, have most of the dwellings originated in the fertile plains along the river or streams. It is located on the southern slope of Himalayan ranges gives the impression of the snowy, misty tall and glister-ing peaks, lush forests, snaking rivers and limited human settlement scenario. The spread of household were scattered in the valley of Chokhortoe with a distance of a mile between households. The patrilineal and matrilineal inheritance system was followed by the residents and there was increase of number of households around the main settlement (Challis, n.d. & Costello, 1978). At that time the density of population is very low where the tradition and culture had strong hold. The advance-ment in economic development increased the accessibility to the modern amenities and the population density too (Chetri1, 2012).
There was a significant development in the chokhortoe village after 2008. Ba-sic amenities such as road, electrification and telecommunication were introduced. Therefore this paper does qualitative analysis on the development in terms of living standards, challenges and future prospective of the Chokhortoe Village.
In order to find out the development level in the Chorkhortoe village, few variables such as Source of income and living standard are evaluated based on ob-servation.
SoURCE oF INCoMEClustered settlements in Chokhortoe are generally located in the fertile land of val-leys depending upon the agriculture activities. It allows the framers to cultivate vari-ties of agriculture products. In early days most of the cultivation was done based on subsistence farming. Farmers produce to consume constraining them from reliable source of income. Later with the time of development different strategies were sort
Figure1: Geo view of proper chokhortoe village (Source: Google earth)
Chokhortoe

137Rural Development in Bhutan
to build solid source of income. Some of the primary source of income for the people of chorkhortoe are:
Potato CultivationPotato is main cash crop cultivated by the villager towards the end of autumn sys-tem. This has made possible for the people to survive a whole year. Development of technology has also ease the farming activities and helped to increase its productivity in double fold. The harvest was done and people sell that to earn enough income to sustain their families for a year. The harvest was mainly exported to India through government auction house.
CordycepToday the main source of income for the people of Chokhortoe is through collection
Figure2: Farmers cultivating potato in Chokhortoe village(Source: Self-Captured)
Figure3: Collection of Cordycep

138 Jigme Norbu
of Cordycep. The legalization of its collection was done in 1998. Since then, people fully depend their livelihood on collection of cordycep. It is regulated by government.
LIVINg StANDARDThe living standard of the people of Chokhortoe was done by comparative study considering the time period. The following vairables were studied based on observa-tion.
ShelterThe first variable to study the living standard is shelter. The people at Chokhortoe village have maintained the traditional design of buildings but the quality of materi-als were far better. The buildings were painted beautifully and the surroundings were maintained very clean. The development in accessibility has brought in best modern materials to build reliable and clan shelter.
Cooking, Heating and LightingCooking and lighting are also one of primary variables which determine the liv-ing standard of the people. In Chokhortoe village, there is a great transformation in case of source of energy for cooking and lighting. Previous the people fully rely upon wood for all heating, cooking and lighting. Later the people started to using solar panel gfor lighting which is being illegally imported from Tibet. With the development, rural electrification has been successfully completed. Electricity then is used for heating, lighting and partially for cooking too. Majority use gasoline for the purpose of cooking.
CHALLENgESComparing other rural area in Bhutan Chokhortoe Village is not affected with many problems. But the major challenge for people in the region is human-wildlife con-flict. The wild boar and deer is still considered as major threat to the harvest of the farmers in the village. The wild boar not only harms the crop cultivated in the fields but also destroys the vegetables in the kitchen. However the government has plan to secure the crops by electric fencing with the development.
Future Prospective Chokhortoe has been blessed with variety medical herbs which have a high commer-cial value. Currently income in millions has been generated by residents of Chok-hortoe through sale of Corpycep (ascomycete fungi) every year. Besides availability of abundant stock of cordycep in the mountains, discovery of new medicinal herb every year of high commercial value makes the region prospective.
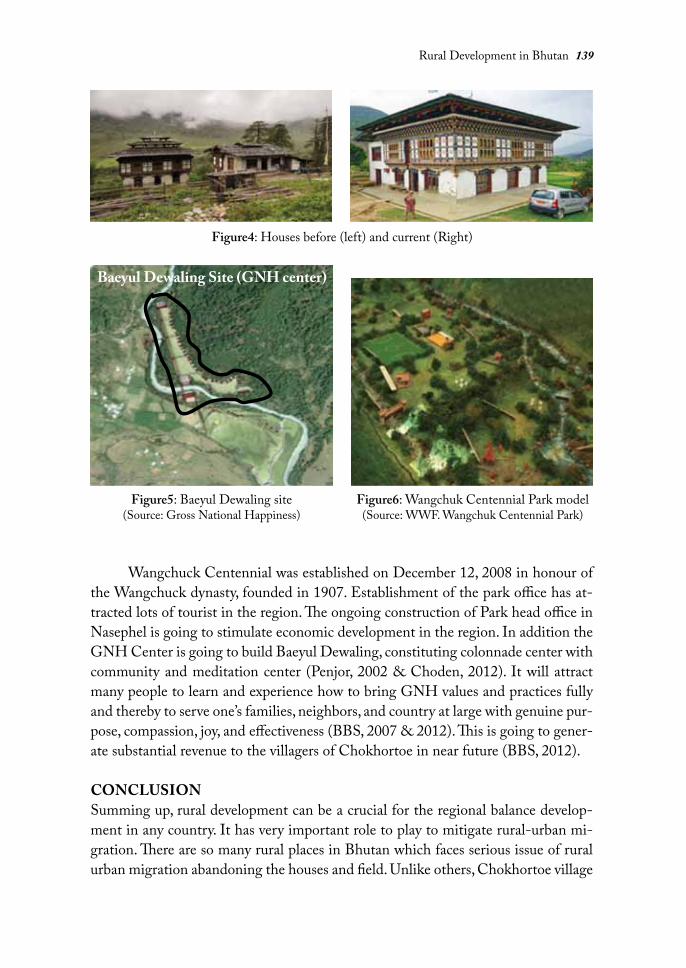
139Rural Development in Bhutan
Wangchuck Centennial was established on December 12, 2008 in honour of the Wangchuck dynasty, founded in 1907. Establishment of the park office has at-tracted lots of tourist in the region. The ongoing construction of Park head office in Nasephel is going to stimulate economic development in the region. In addition the GNH Center is going to build Baeyul Dewaling, constituting colonnade center with community and meditation center (Penjor, 2002 & Choden, 2012). It will attract many people to learn and experience how to bring GNH values and practices fully and thereby to serve one’s families, neighbors, and country at large with genuine pur-pose, compassion, joy, and effectiveness (BBS, 2007 & 2012). This is going to gener-ate substantial revenue to the villagers of Chokhortoe in near future (BBS, 2012).
CoNCLUSIoNSumming up, rural development can be a crucial for the regional balance develop-ment in any country. It has very important role to play to mitigate rural-urban mi-gration. There are so many rural places in Bhutan which faces serious issue of rural urban migration abandoning the houses and field. Unlike others, Chokhortoe village
Figure4: Houses before (left) and current (Right)
Figure5: Baeyul Dewaling site(Source: Gross National Happiness)
Figure6: Wangchuk Centennial Park model(Source: WWF. Wangchuk Centennial Park)
Baeyul Dewaling Site (gNH center)

140 Jigme Norbu
as for now does not face the rural urban migration. It has seen increase in number of houses in the village every year.
Chokhortoe provides housing for a non-agrarian society, basic amenities have moved in and some rural settlements have been turned into health and education in-stitution and centers. The residents of Chokhotoe have gone through different stages of transition in the way people earn for living. Fertile land with perennial flowing water appears to be the suitable for harvest. Availability of variety of medicinal herb and establishment of Baeyul Dewaling and Wangchuk Centennial Park made the region a very prospective one. This transformation process has also added knowledge on the cultural value of these historic sites. Every possible effort to prevent tradi-tional assets from falling apart and preserve for coming generations can go along way to keep rich tradition sustaining. REFERENCESBhutan broadcasting Service (2007, December 17). Wangchuck Centennial Park in-
augurated. Retrieved from http://www.bbs.com.bt/Wangchuck%20Centen-nial%20Park%20inaugurated.html
Bhutan broadcasting Service (2007, December 17). Construction of GNH centre de-layed. http://www.bbs.bt/news/?p=18433
Challis, K., (n.d.) Settlement Morphology and Medieval Village Planning: A Case Study at Laxton, Nottinghamshire. University of Birmingham, Birmingham
Chetri1, s., (2012, Julu 20). Bhutan’s GNH Center. The Bhutanese. Thimphu. Re-treieved from http://www.thebhutanese.bt/bhutans-gnh-center/
Choden, S., (2012, May, 2). GNH Center Master Plan Changed, to be completed next year. The Bhutanese. Thimphu. Retrieved from http://www.thebhutanese.bt/gnh-center-master-plan-changed-to-be-completed-next-year/
Costello, V. F., (1978). The Morphology of Tehran: A Preliminary Study Alexandrine Press. Retrieved from http://www.jstor.org/stable/23289157 Georgalli, M.C., (1991). The morphology of traditional dwellings within an insular
context: Amorgos, Greece. Traditional Dwellings and Settlements Review, Vol. 2, No. 2 Retrieved from http://www.jstor.org/stable/41757112 .
Gross National Happiness (2010). Retrieved from http://www.gnhbhutan.org/World Wild Fund, (2011, March 23). Second nomads’ festival. Retrieved from
http://www.wwfbhutan.org/?199741/Second-Nomads-Festival

141
Transition of Man-made Landscape and Contemporary Problems of Mountainous villages in Japan
Yoshio AkamatsuCenter for Southeast Asian Studies, Kyoto University
ABSTRACTThis study speaks of the transition of rural landscapes with change of liveli-hoods based on two case studies in mountainous villages of Japan. It is said that traditional rural landscape has been formed by long-term interaction between human and nature, and these landscape are recognized as source of imagination and creativity. However, rural landscapes have drastically changed since the mid-twenty century with changing of people’s lifestyles. Use of forests was concentrated on timber production to earn the money and conifer plantations were spread out in the villages. At present, timber production is facing serious depression and unmanaged plantations are in-creasing. Depopulation and aging of society also accelerate devastation of rural landscape and new potential for revitalization and rural development is limited with mono forest resources.
Key Words: rural landscape, transformation of livelihoods, conifer planta-tion
INtRoDUCtIoNThe landscape surrounding rural village has been formed by long-term interaction between human activities and nature. The landscape comprised of different kinds of environments, such as paddy fields, uplands, swidden fields, orchards, irrigation ponds and channels, pristine forests and various succession stage of secondary for-ests. These complicated mosaic spatial structure caused by natural topography and human disturbances provides animals and plants with various different habitats and result in existence of rich biodiversity and complex ecosystems in rural areas.
In Japan, residential area is usually surrounded by arable lands, secondary forest comprised of deciduous broad-leaved trees, bamboo groves, grasslands and pristine forests. The tract of these secondary environments which were utilized by peoples in supporting their lives is called satoyama and maintained by active and

142 Yoshio Akamatsu
sustainable use of natural resources (GoJ, 2009). Secondary woodland consists of motley deciduous trees and shrubs are used for producing charcoals. Leaf litter is collected especially from the woodland consist of Quercus acutissima, Q. serrata and Q. crispula for compost. Bamboo grove provides materials and food and grove itself become an evacuation shelter of earthquake. Furthermore, rural landscape includes satoyama have played important role on Japanese people in terms of deep emotional attachment which calls for imagination and creativity (GoJ, 2009). However, rural landscape and utilization of forest resources has changed with rural people’s life-styles since the mid of twenty century.
Rural lifestyles and interrelationship between human and nature drastically changed especially during the period of high economic growth period from 1960s to 1970s. Energy source for cooking and heating shifted from firewood and charcoal to propane gas, electricity and petroleum oil. Use of chemical fertilizers instead of compost, pesticides and herbicides became popular and motive energy of agriculture shifted from man and animal power to machines. To gain these convenient energy sources and materials, Forest was commercialized on large scale and rural landscapes have dramatically changed. This study aims at showing transition of rural landscapes and current situation and problems in mountainous village based on two case studies in Japan.
StUDy AREATsubayama village is located in Niyodogawa City, Kochi Prefecture and the popula-tion is 16 with 10 households in 2007. Tsubayama had attracted researchers by their traditional agricultural practice, swidden agriculture. Swidden agriculture had been practiced commonly in mountainous villages until the mid-twentieth century and Tsubayama village was one of the last villages practicing swidden agriculture in Ja-pan (Tanabe 2000). Sasari village is in Nantan City, Kyoto Prefecture and the popu-lation is 23 with 12 households in 2014. Two villages are surrounded by forests and mountains. Population of both villages show sharp drop after the mid of 1960s and identified as genkai-shuraku now. Genkai-shuraku is defined as a community in which the population of above sixty-five year old accounts for more than fifty percent of to-tal population and facing difficulty to maintain cooperative community works such as maintenance of community shrine, temple, irrigation channels, etc. The number of communities identified as genkai-shuraku is 7,878 in 2006 and 10,091 in 2010 in Japan (MoIAC 2011).
RESULt AND DISCUSSIoNtransition of Landscape in tsubayama villageResidences of Tsubayama village are clustered on the mountainside and there is

143Transition of Man-made Landscape and Contemporary Problems of Mountainous villages
no rice paddy. According to Fukui (1974), land use of the village is arranged in a concentric pattern. Uplands and forests are arranged centrifugally from residential area. Uplands surrounded residence is categorized into four types. Saenba is located nearby residence and cultivated various vegetables through out the year. Maize, sor-ghum and other vegetables are cultivated in the upland located the outside of saenba, called koyashi. Upland scattered in the fringe of the residential area is called imoji and potato and wheat is cultivated without fertilizer. The forests for swidden agri-culture, collection of firewood and leaf litter and producing charcoal extend outward. Staple foods such as millets, buckwheat and beans were cultivated in swidden fields and cropping pattern varied depending on topographical and micrometeorological conditions of the slopes (Fukui, 1974). In addition to food crops, oriental paper-bush (Edgeworthia chrysantha) was also cultivated in the swidden as second year crop. Oriental paperbush was started functioning on Kochi Prefecture in 1892 as a cash crop and became an important income source for people living in mountainous area. Oriental paperbush produce yellow flowers throughout the months of March until April and the village was surrounded by beautiful scenery of fresh green leaves and yellow flowers in the spring. However, cultivation of oriental paperbush faded into the wallpaper because of depression and unstable market price since 1950s and took a turning point with boom of conifer plantation. Timber of conifer trees, espe-cially sugi (Cyptomeria japonica) and hinoki (Chamaecyparis obtusa), comes into great prominance from ancient times in Japan. Demand and market price of timber was in rise year by year through postwar reconstruction and high economic growth period,
Figure1: Distribution of conifer plantation in 1960 and 2008 (land cover of conifer plantation in 1960 was refered to Fukui(1973))

144 Yoshio Akamatsu
and people began to divert time and energy to plant conifer trees and expansion of conifer plantation. The government policies also strongly emphasized the expan-sion of plantation. As a result, total 240 hectare of forests around the village was transformed into conifer plantation from 1960 to 1970 in Tsubayama (Fukui 1974). Increase of risk of burning vegetation with expansion of conifer plantation and job opportunities, the size of swidden agriculture was shrunk year by year. According to Tanabe (2000), the last swidden practiced in Tsubayama was in 1987. As villager mentioned that conifer trees were planted in all available lands in the village, most of secondary forests used for swidden and collection of natural resources were turned into plantation and present village is covered with dark evergreen leaves of conifer trees (Figure 1).
transition of Landscape in Sasari villageResidences of Sasari are located at the foot of mountains and relatively scattered. Kitchen garden is attached to homestead and main paddy fields readjusted in 1980s are located in flat floors nearby residence. However, no small area of paddy fields is also found along with rivers. Not only paddies but also bean was cultivated in the ridge of paddy fields. Agricultural fields were fallowed in winter season due to heavy snowfall. Swidden agriculture has not been practiced in Sasari, but forests surround-ed the village provided daily essentials and job opportunities. Perennial herb, called Kaya (Kaya is a Japanese generic term used to refer to Poaceae and Cyperaceae used for roofing material or fodder) were collected annually from the place called kaya-ba and stored in the attic for re-thatching or repairing the roof. The shrub, comprise of deciduous oak, acer and hornbeam, was called shiba-yama and played important role on agriculture. Coppicing stocks of these trees were cut by sickle and piled up in
Photo1: Conifer trees planted in paddy field

145Transition of Man-made Landscape and Contemporary Problems of Mountainous villages
shiba-yama during autumn season. Dried stocks were carried down to home at the end of autumn and made compost mixed with cattle dung for distribute agricultural fields in spring season. Almost all households raised two to three cattle for agricul-ture purpose or sale to buyers. Kaya-ba and shiba-yama were distributed behind a house and nearby agricultural fields, and girdle of trees around agricultural fields took special care not to make a shadow over the fields. Most of forests around the village were community forests and managed based on community/village rules. For example, village act for illegal logging of four useful species (Aesculus turbinate, Cer-cidiphyllum japonicum, Paulownia tomentosa and Morus bombycis) was implemented in 1684 (Publication Committee of Chii Village History 1998). These community forests were used by not only villager but also outsider including nomadic woodturn-ers and charcoals and timbers were produced to export in Kyoto city.
In a high economic growth period (1960s-70s), timber production was com-mercialized on a large scale and many parts of community forests were turned into conifer plantations. Paddy fields apart from residential area also transferred into co-nifer plantations (Photo 1). Thatched roof was regarded as a symbol of un-develop-ment and poor with modernization. Traditional roofs in the village were replaced with tile or zinc roof and vegetation of some kaya-ba got changed from grasslands to secondary forests. Shiba-yama also had less value with use of chemical fertilizer and replaced with conifer plantation or turned into secondary forests.
Contemporary problems and changed rural landscapeForestry in Japan is facing an alarming situation since 1980s due to increase of im-ported cheaper timber and materials and decrease of demands. Although matured sugi trees over forty years old of stand age account for 68.6 percent in Tsubayama,
Photo2: Thatch roof farmer’s houses in Kita village

146 Yoshio Akamatsu
it has kept intact today because of money-losing forestry business. Unmanaged co-nifer plantations such as un-logging and pruning have also rise due to aging of forest workers and absence of the successor. Furthermore, progression of depopula-tion and aging of village population has accelerated devastation of rural landscape including run-down empty houses and weed-covered abandoned fields. Kita vil-lage, located only 11 km apart from Sasari and traditional thatched roofing houses and well-maintained rural landscape remained, has attracted many tourists from urban and foreign countries today (Photo 2). The villager in Tsubayama mentioned that if secondary or pristine forests had remained around the village, we could have enjoyed the changing colors of autumn leaves and it might have attracted tourists too. However, widespread mono vegetation and less cared landscape seem to limit the new potential and opportunity to utilize rural resources along at the demand of era. It is not appropriate to suggest keeping traditional lifestyle, but passing down their knowledge and traditional way of life in rural villages might be important for reevaluate the living in rural village and getting hint of revitalization forward into the future.
REFERENCESGoJ., 2009, The Satoyama Initiative – A Vision for Sustainable Rural Societies in
Harmony with Nature, Ministry of Environment, Government of JapanMoIAC, 2011, Kaso-chiiki tou ni okeru syuuraku no joukyo ni kansuru genjohaaku-chosa
(report on current situation of the villages facing depopulation problems), Ministry of Internal Affairs and Communications
Fukui, K.., 1974, Yakihata no Mura (the village of swidden agriculture), asahi shin-bun-sya.
Publication Committee of Chii Village History, 1998, Chii-son-shi (the history of Chii village),

147
Potential and Necessity of Establishment of Strong Academic Collaboration among Myanmar, Bangladesh, Bhutan and
Japan for Research and Higher Education
Kazuo AndoHead, Department of Practice-orineted Area Studies, Center for Southeast Asian Studies, Kyoto
University, Japan (E-mail:[email protected])
ABSTRACTThis paper aims at discussing potential and necessity of establishment of strong academic collaboration among Myanmar, Bangladesh, Bhutan and Japan for research and higher education. Reason and purpose of learning and teaching in academism, advantage of Area studies as a discipline, real understanding through field work, contemporary complicated problem in Myanmar, Bhutan, Bangladesh and Japan, Advantage of linking among Myanmar, Bhutan and Japan is discussed. In conclusion, practical way and hope of linking is illustrated.
Key Words: Myanmar, Bhutan, GNH, alternative development way of My-anmar, depopulation, abandoning farming, rural development
INtRoDUCtIoNThis paper was originally presented as “How to apply action research for mutual learning to research and higher education by inter-connection among Myanmar, Bangladesh, Bhutan and Japan in the International Workshop on Environmental Problem and Its Possible Mitigation for Sustainable Development, Date: 6, Febru-ary,2016, Time:10:30-12:30, Place: Tonantei, Inamori Building 2F”. This workshop has been collaboratively organized by the following research projects such as Kyoto University SPIRITS Program: Mitigation Cyclone and Flood Damages in Myan-mar: Applying the Bangladesh’s Successful Experience, ISS Hoga Project: Action research on knowledge from experience and its practical use about disaster preven-tion and mitigation for natural disaster in Bangladesh: Application of Sustainability Science to Area Studies, Program of Collaborative Research on Transitional Justice and Inclusive Economic Development in Developing ASEAN Countries, and Chal-lenging Exploratory Research Project of “Study of a Site-Specific Rural Develop-ment Model through Alternative Zaichi (existing locally) Cultural Formation” and

148 Kazuo Ando
also we have conducted a series of workshops of the Kyoto University Program :Pro-motion of International Collaboration on Bioresources Management in Myanmar (PICBiRMa) headed by Professor Mamoru Kanzaki. In the Center for Southeast Asian Studies, Kyoto University, the department of Practice-oriented Area Studies has participated in these projects for implementation. A series of workshops of these projects were planned with the following background.
The socio-cultural impact of economic globalization and excessive moderni-zation has induced rapid change in agriculture and life style without concerning in ecology and climate change etc. in last two decades. It results in occurrance of the problem such as depopulation, abandoning farming, artificial salinity damage in ag-riculture and damage by super cyclone, flood and earthquake etc. in Asian Countries. The recent situation of agriculture and rural development of Myanmar, Bangladesh and Bhutan is not an exception. In order to realize mitigation for sustainable devel-opment in agriculture and rural development in future, the countries facing these problems are requested to exchange their experience for finding an alternative way to overcome negative impact of globalization of excessive economic oriented devel-opmental way.
The workshop held on Feb. 6, 2016 at the CSEAS has been planned to ful-fill this aim in collaboration with the different projects, which the department of practice-oriented area studies, CSEAS, Kyoto University has participated in. On the basis of my experience through participation in the projects, this paper is written with purpose of conceptual discussion for potential and necessity of establishment of strong academic collaboration among Myanmar, Bangladesh, Bhutan and Japan for research and higher education, particularlly, between Myanmar and Bhutan contain-ing an approah to the area studies.
MEtHoDoLogIES AND MAtERIALSConceputal analysis on the author’s own experience in the field work in rural area of Myanmar, Bhutan, Bangladesh and Japan since 1978 right up to now is adopted in this paper. Author has continued to raise a question against authentic academism, and is based on the views of the area studies as a discipline, of which author under-went a training since he was a graduate school student in CSEAS.
RESULt AND DISCUSSIoNwhy Are we Learning in Academics or Conducting teaching and Research in Academics?The nesessity of learning may be to realize maintainance of better life. It can be explained in another way that living better is to overcome a problem in life with a

149Potential and Necessity of Establishment of Strong Academic Collaboration
feeling of reality. I believe that a person cannot get a feeling of reality of living better in life without co-existing feeling with other persons. Truth of Academics is to en-courage a person to learn to take action for changing oneself to realize one’s “aim” to overcome a problem to be shared. Academics and Culture have emerge originally “a defiant attitude to authority” or “challenging common sense” against common sense to make a problem not solved or changeable.
what is the Advantage of the Area Studies as a Discipline in CSEAS and Kyoto University?It is nowadays a common sense of the social science that “object” is to be set up clearly as the natural science does. Area studies is usually considered in Japan as one of the social science by approaching such an area to be learned or studied as man makes an “area” as a society or a world with integrating the socio-culture and the physical environment. Therefore, the area studies of CSEAS, Kyoto university has strongly involved in the natural science such as agricultural science, medical science etc. Therefore, the approach adopted in CSEAS has sought integration of liberal arts and science or integration of social and natural sciences since it was established in 1960s. However, it usually occurs among the scholar of the area studies who is engaged in conducting the field work at the site that a feeling of reality of his/her existing at an “area” is automatically induced after continuation of staying at the site, with the result that the scholar as a field worker is sharing the problems faced by the people living in the site or an “area” as an “object”. It may be noticed that the area studies, particularly initiated by CSEAS, Kyoto University, have started paying at-tention to an academic exercise by getting a feeling of reality as the natural science does. The observation by own eye, listing of own ear, conversation by own mouse, and thinking by own idea at the site during the field work are essential and important methdologies of perception.
Real Understanding through Field workThe real understanding against a “area” can be made only on the basis of a feeling of reality against a “object” through each approach of liberal art and science. It is also reasonable that a reality can be achieved only by understanding with a sixth sense through sharing experience or practice. A reality of sharing existence insists that a field worker looks into the reality of an area or a society where a field worker stands with people living in. A reality of sharing existence is, therefore, easily obtained by an action or a practice including together living, observing, talking, listening, working with local people at a site. A reality of sharing existence strongly promotes real un-derstanding through feed-back by practicing and thinking. It pushes a field worker toward challenging a problem perceived in an area or a society, at the time when local

150 Kazuo Ando
people or an “area” agaist a field worker has been changed its position from an object to a subject as an equal partner to overcome a problem. A field worker oneself would change one’s personality just like after regular mediation through Zen practice or running in a daily life.
what Are the Complicated Problems Commonly Faced by Myanmar, Bhutan, Bangladesh and Japan?What kind of the problems does the globalization of free marketing economy give us through living with economic development induced by simple economic develop-ment theory and happiness of materialism? In Myanmar, Bangladesh, Bhutan and Japan, it can be noticed by majority of people including the villagers discriminate agricultural occupation or physical labor and Rural life of Society & Culture in com-parison with urban society and livelihood willingly or without clear consciousness.
This conceptual value has been accelerated by rationalism and universalism given by reductionism of science which is successful in disclosing inefficient produc-tivity of agriculture and un-modernized life style, comparing to industrialized and commercialized highly materialistic urban life. The modernized people usually have less attention toward philosophy and essentialism to understand a life and a har-monious society. They prefer materialism and competition that they would confirm victory of them against the other. It result in rapid growth of anti-concept against happiness except economic development in the world. This global concept is spread-ing over Myanmar, Bangladesh and Bhutan at the present.
Advantage of Multi-learning among Myanmar and Bhutan in Particular Myanmar and Bhutan are sharing the societies and cultures based on Buddhism in daily life and rich practice of traditional ways in lifestyle and agriculture. Apart from the world trend of development, Bhutan is trying to realize own development policy by GNH (Gross National Happiness) instead of GNP (Gross National Product). In case of Myanmar, it may be a problem in future to continue to follow the economic globalization freely without making effort on building the original Myanmar way development like Bhutan. Myanmar must make the most of her opportunity of the last runner of the top runner in the “development race” in the world. The paradigm of development has already shifted from the rapid economic growth only human being to the sustainable harmonious development with nature. Surely, Myanmar and Bhutan are the top runner of the new paradigm of development, which is accepted by all the world in principle. Human being cannot build the concrete future world without this paradigm. The people challenging the problems of depopulation and abandoning farming in rural Japan are paying attention to the people of Bhutan and Myanmar; How will both countries overcome the problem of making the people

151Potential and Necessity of Establishment of Strong Academic Collaboration
of rural Japan being suffering in accordance with the rapid economic growth? The people, particularly, scholars of both the countries are expected to make joint effort to challenge the problem, against which most of the world people are giving up the challenge.
Advantage of Linkage among yAU, SEAMEo-CHAt of Myanmar, Sherubtse College of Bhutan and Kyoto University of JapanField station activities have been done jointly in Myanmar and Japan since 2005 and 2008 respectively. Student exchange program and joint studies have been im-plemented in Bhutan and Japan since 2008. Furthermore, Myanmar has opened the door to the foreigners and as a result that the universities of Myanmar become au-tonomous from April, 2016. Daw Aung San Suu Kyi stayed in Myanmar for several year with her husband, Dr.Michael Aris, most probably visited Sherubtse college and the CSEAS, Kyoto University for ten months in mid of 1980s respectively. The NLD is forming the new democratic government in Myanmar. The year 2016 is suitable occasion to review the problem occurring in rural Asia and build an alter-native rural development policy on the basis of this reviewing. In order to achieve this task, it is most useful to link Myanmar, Bhutan and Japan by connecting each program running at the present between Kyoto University with the counterpart or-ganizations in Myanmar and Bhutan. It may start immediately at present.
CoNCLUSIoNHow to Develop the New Link and Let’s Start to Challenge the Common Sense SEMEO-CHAT is a small government organization in Myanmar but is the Inter-national organization of ASEAN. The full name of SEAMEO-CHAT is Southeast Asian Ministers of Education Organization Centre for History and Tradition. The name SEAMEO-CHAT is well indicating that SEAMEO-CHAT is a suitable organization to link up the three organizations under their institutional aim. The al-ternative development paradigm must be based on Culture, Tradition and Culture. It can be proposed as conclusion of the paper that GNH concept and policy in Bhutan is properly studied jointly by Myanmar people to establish the alternative develop-ment way ore Myanmar way of Development in collaboration with the counterparts of Bhutan and Japan. Exchange of Students and Staff through PLA and PWS in rural areas under the field station programs is to be extended in Myanmar, Bhutan and Japan so that advance of each countries is to learn to overcome the problem and give wonderment to the world people having the common sense of unchangeable be liveness on economic development theory.

152 Kazuo Ando
REFERENCESKazuo Ando 2011 KEYNOTE SPEECH: Let us share experiences internationally
and learn each other for sustainable development, Integrated Study on Sus-tainable Agriculture and Rural Development towards Research and Education in Myanmar and Surrounding Countries, Practice-oirented Area Studies Series No.2, YAU: 11-14.
Kazuo Ando 2013 Changing Traditional Cropping Systems in Rural Rakhaine: Meaning of “Traditional” in Rural Development Study, Change of Rural So-ciety and Local Agro-ecological Knowledge in Myanmar, Practice-oriented Area Studies Series No.4, SEAMEO-CHAT: 19-32.


154
International workshop on “Environmental Problem and Its Possible Mitigation for Sustainable Development”
In collaboration with the following projects.1. Kyoto University SPIRITS Program: Mitigation Cyclone and Flood Damages in My-
anmar: Applying the Bangladesh’s Successful Experience” 2. ISS Hoga Project: Action research on knowledge from experience and its practical use
about disaster prevention and mitigation for natural disaster in Bangladesh: Application of Sustainability Science to Area Studies
3. Program of Collaborative Research on Transitional Justice and Inclusive Economic Development in Developing ASEAN Countries
4. Challenging Exploratory Research Project of “Study of a Site-Specific Rural Develop-ment Model through Alternative Zaichi (existing locally) Cultural Formation”
Date: Febuary 6, 2016Time: 10:30-12:30Place: Tonantei, Inamori Building 2F
Aim of the Workshop:Recent Situation of Agriculture and Rural Development in the developing coun-tries such as Myanmar, Bangladesh, Bhutan have changed much in accordance with the socio-cultural impact of economic globalization, excessive modernization in Agriculture with paying less regard to the ecology and climate change etc beyond the common sense in last two decades, such as depopulation, abandoning farming, artificial salinity problem in agriculture, super cyclone & flood etc. To realize miti-gation for sustainable development in Agriculture and rural development in future, the countries facing these problems are to exchange their experience possibly so that the alternative ways for overcoming the problem can be considered. This small workshop is planned to fulfill this aim by connecting the several different projects implemented by the department of practice-oriented area studies, CSEAS, Kyoto University.

155
workshop Program
10:30-10:35 Opening remarks by Kazuo Ando (CSEAS)10:35-10:55 Natural Hazards Induced Salt- affected Soils for Rice Produc-
tion in Myanmar by Soe Soe Thein (Yezin Agricultural University, Myanmar)10:55-11:15 The Characteristics and Role of Homestead in Bangladesh by Keiko Yoshino (Tokyo University of Agriculture)11:15-11:35 Rural Development in Bhutan: a Case Study of Chokhortoe
Village by Jime Norbu (Sherubtse College, Bhutan) 11:35-11:55 How to apply action research for mutual learning to research
and higher education by inter-connection among Myanmar, Bangladesh, Bhutan and Japan
by Kazuo Ando (CSEAS)11:55-12:25 General Discussion ( with reference of the PRA of Bhutan
Sherubtse College Team in Japan from Jan.26 to Feb.7, 2015) Comment by Haruo Uchida (CSEAS), Yoshio Akamatsu
(CSEAS)12:25-12:30 Concluding Remarks by Kazuo Ando (CSEAS) 12:30- 13:30 Lunch Gathering (Lunch Box)
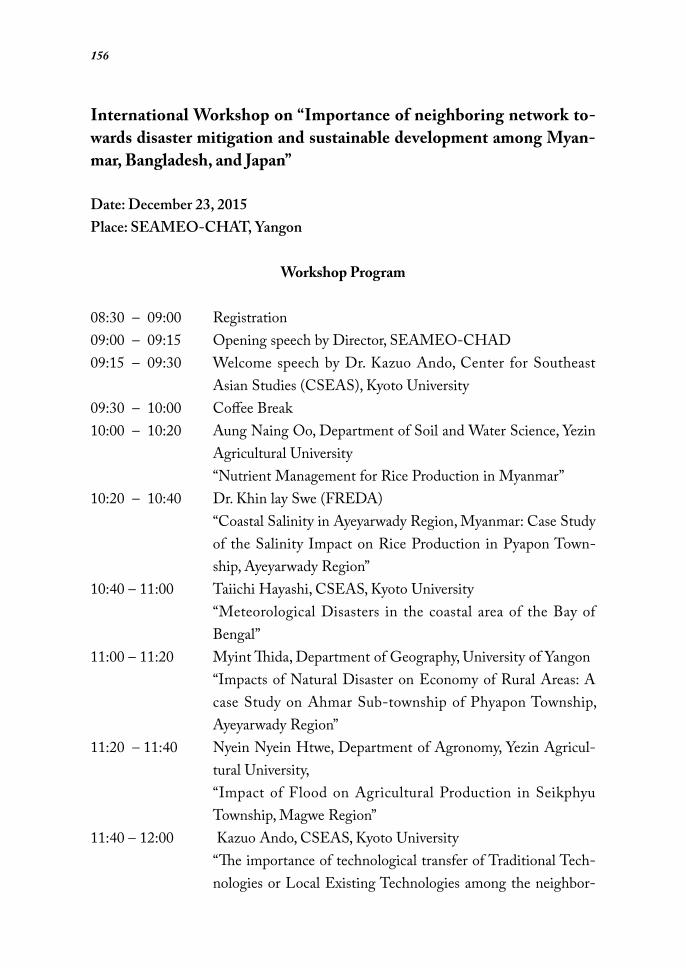
156
International workshop on “Importance of neighboring network to-wards disaster mitigation and sustainable development among Myan-mar, Bangladesh, and Japan”
Date: December 23, 2015Place: SEAMEO-CHAT, Yangon
workshop Program
08:30 – 09:00 Registration09:00 – 09:15 Opening speech by Director, SEAMEO-CHAD09:15 – 09:30 Welcome speech by Dr. Kazuo Ando, Center for Southeast
Asian Studies (CSEAS), Kyoto University 09:30 – 10:00 Coffee Break10:00 – 10:20 Aung Naing Oo, Department of Soil and Water Science, Yezin
Agricultural University “Nutrient Management for Rice Production in Myanmar”10:20 – 10:40 Dr. Khin lay Swe (FREDA) “Coastal Salinity in Ayeyarwady Region, Myanmar: Case Study
of the Salinity Impact on Rice Production in Pyapon Town-ship, Ayeyarwady Region”
10:40 – 11:00 Taiichi Hayashi, CSEAS, Kyoto University “Meteorological Disasters in the coastal area of the Bay of
Bengal”11:00 – 11:20 Myint Thida, Department of Geography, University of Yangon “Impacts of Natural Disaster on Economy of Rural Areas: A
case Study on Ahmar Sub-township of Phyapon Township, Ayeyarwady Region”
11:20 – 11:40 Nyein Nyein Htwe, Department of Agronomy, Yezin Agricul-tural University,
“Impact of Flood on Agricultural Production in Seikphyu Township, Magwe Region”
11:40 – 12:00 Kazuo Ando, CSEAS, Kyoto University “The importance of technological transfer of Traditional Tech-
nologies or Local Existing Technologies among the neighbor-

157
ing countries around Myanmar ” 12:00 – 13:00 LUNCH13:00 – 13:20 Nandar Aye Chan, Department of Agricultural Economics,
Yezin Agricultural University “Study on Agricultural Labor Migration of Selected Farm
Households in Kyaukpadaung Township” 13:20 – 13:40 Yusuke Yamane, Faculty of Education, Tokoha University “Workshop for reducing severe wind damages in Bangladesh”13:40 – 14:00 Dr.Lwin Lwin Naing (ECCDI) ”SUSTAINING COMMUNITY AND FOREST DEVEL-
OPMENT THROUGH COMMUNITY FOREST EN-TERPRISE - A CASE STUDY IN SOUTHERN SHAN STATE”
Yoshio Akamatsu, CSEAS, Kyoto University “Transition of man-made landscape and contemporary prob-
lems of mountain villages in Japan”14:00 – 14:20 Dr. Mar Mar Win, Food Legumes Section, Department of
Agricultural Research, Yezin, Nay Pyi Taw, Myanmar. “Adaptation of Yunnan Soybean in Hilly Region of Shan State”14:20 – 14:40 Mu Mu Age, West Yangon Technological University, “Climate resilient and low carbon development research and
activities in Myanmar”14:40 – 15:00 Closing Remark by Dr. Ando
BannerInternational Workshop on “Importance of neighboring network towards disaster mitigation and sustainable development among Myanmar, Bangladesh, and Japan”
Sponsored by Center for Southeast Asian Studies, Kyoto University, SEAMEO, YAU, FREDA
158
Index (List of Key words)
Aabandoning farming 147adaptation strategies 15agricultural production 47agriculture 65alternative development 9alternative development way of Myanmar 147amendments 27anticancer resource 103
BBangladesh 119, 131Bhutan 147
Cclimate change 15community forest (CF) 61conifer plantation 141cropping patterns 47
Ddamage reduction 131depopulation 147Diancanga 2 111
Eethnobotany 103
Ffarmer’s concept 15fishing 65flood 47floodplain 119forest and farm facility (FFF) 57

159
future prospective 135
gglobal modernism 9GNH 147
Hhandling practices 91high yielding rice 37, 57, 158hilly region 111homestead 119hybrid rice 37
Iimpacts 65
Llabor 75lunar calendar 27
Mmacronutrients 37making thatch 65man-made forest 119migrant 75migration 75Myanmar 103, 147
Nnatural hazards 27nutrient management 37Nypa thatch 15
Ppackaging materials 91postharvest transportation and supply chain 91

160
pull factors 65push factors 65
Rremittance 75rural development 135, 147rural economy 65rural landscape 141rural-urban migration 135
Ssalinity 27salinity problem 9salt affected soil 15salt tolerant rice varieties 27SEAMEO-CHAT 9Seikphyu Township 47severe local storm 131sodic 27source of income 135southern Shan State 57subsistence 119
ttraditional practitioners 103transformation of livelihoods 141
Vvarietal improvement 111
wwomen 119workshop 131
yYunnan soybean varieties 111

PRACTICE-ORIENTED AREA STUDIES SERIESMuhammad Salim & Kazuo Ando
TRADITIONAL AGRICULTURAL IMPLEMENTS OF BANGLADESH(Practice-oriented area studies series, no. 1)
Kazuo Ando & Khin Lay SweINTEGRATED STUDY ON SUSTAINABLE ARGICULTURE AND RU-RAL DEVELOPMENT TOWARDS RESEARCH AND EDUCATION IN
MYANMAR AND SURROUNDING COUNTRIES(Practice-oriented area studies, no. 2)
Hiroyuki TsunashimaAN ALTERNATIVE WAY OF AGRICULTURAL DEVELOPMENT BY
THE KOYA PEOPLE IN ANDHRA PRADESH, INDIA(Practice-oriented area studies series, no. 3)
Tun Aung Chain & Kazuo Ando, editedCHANGE OF RURAL SOCIETY AND LOCAL AGRO-ECOLOGICAL
KNOWLEDGE IN MYANMAR(Practice-oriented area studies series, no. 4)
Haruhisa AsadaCLIMATE AND RICE CROPPING SYSTEMS IN THE BRAHMAPUTRA
BASIN: AN APPROACH TO AREA STUDIES ON BANGLADESH AND ASSAM
(Practice-oriented area studies series, no. 5)
Tomo RibaSHIFTING CULTIVATION AND TRIBAL CULTURE OF TRIBES OF
ARUNACHAL PRADESH, INDIA(Practice-oriented area studies series, no. 6)
Md. Rashedur RahmanSHRIMP BASED RICE CROPPING SYSTEM IN THE COASTALAREA OF BANGLADESH: AN APPROACH TO AREA STUDIES
(Practice-oriented area studies series, no. 7)
Yoshio AkamatsuCHANGES OF LIVELIHOOD AND ITS CONTEMPORARY
PROBLEMS IN MOUNTAINOUS VILLAGES OF EASTERN BHUTAN(Practice-oriented area studies series, no. 8)
The Practice-oriented Area Studies aim at the alternative Area Studies to establish the conscious-ness of “ZAICHI” (Locally existing) in the researchers’ mind and attitude by mutual enlighten-ment to collaborate with the local people conducting their “Practice” in their living areas. The Practice-oriented Area Studies Series are to publish the research outcome on the basis of these researchers’ consciousness.
Coordinator, Practice-oriented Area Studies Series Kazuo Ando

ISBN 978-4-906332-34-2