Embed Size (px)
Citation preview
Lab #7: Mapping US Census Data Objectives:
• Access US Census Data via the Web • Download census data in excel format • Create new variables based on calculations • Create key fields for merging with NYC Planning shapefiles • Download shapefiles showing census tracts • Creating thematic maps based on data
Steps:
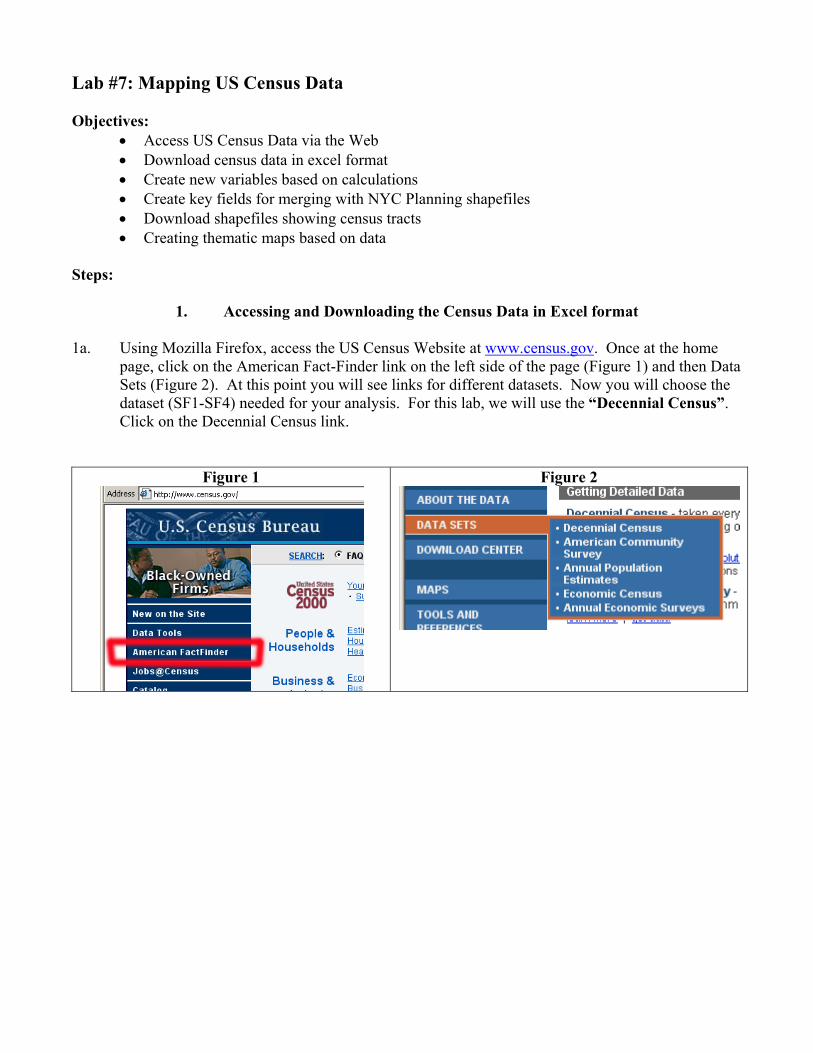
1. Accessing and Downloading the Census Data in Excel format 1a. Using Mozilla Firefox, access the US Census Website at www.census.gov. Once at the home
page, click on the American Fact-Finder link on the left side of the page (Figure 1) and then Data Sets (Figure 2). At this point you will see links for different datasets. Now you will choose the dataset (SF1-SF4) needed for your analysis. For this lab, we will use the “Decennial Census”. Click on the Decennial Census link.
Figure 1 Figure 2
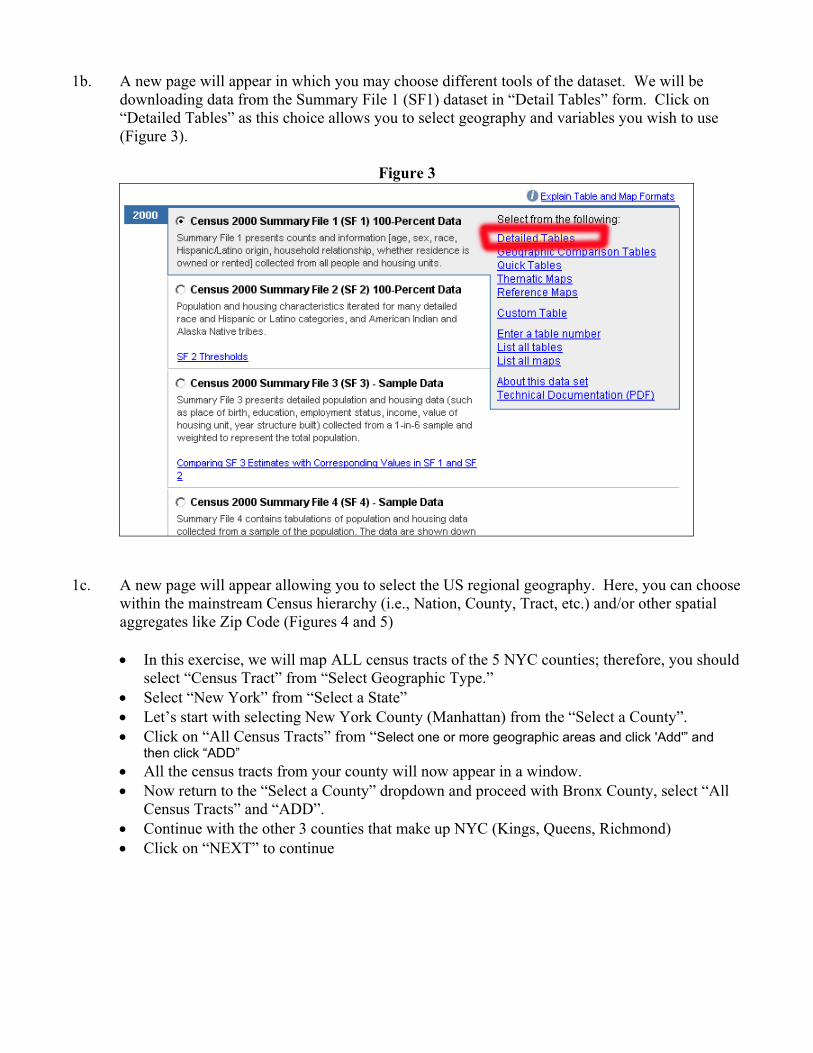
1b. A new page will appear in which you may choose different tools of the dataset. We will be downloading data from the Summary File 1 (SF1) dataset in “Detail Tables” form. Click on “Detailed Tables” as this choice allows you to select geography and variables you wish to use (Figure 3).
Figure 3
1c. A new page will appear allowing you to select the US regional geography. Here, you can choose
within the mainstream Census hierarchy (i.e., Nation, County, Tract, etc.) and/or other spatial aggregates like Zip Code (Figures 4 and 5)
• In this exercise, we will map ALL census tracts of the 5 NYC counties; therefore, you should
select “Census Tract” from “Select Geographic Type.” • Select “New York” from “Select a State” • Let’s start with selecting New York County (Manhattan) from the “Select a County”. • Click on “All Census Tracts” from “Select one or more geographic areas and click 'Add'” and
then click “ADD” • All the census tracts from your county will now appear in a window. • Now return to the “Select a County” dropdown and proceed with Bronx County, select “All
Census Tracts” and “ADD”. • Continue with the other 3 counties that make up NYC (Kings, Queens, Richmond) • Click on “NEXT” to continue
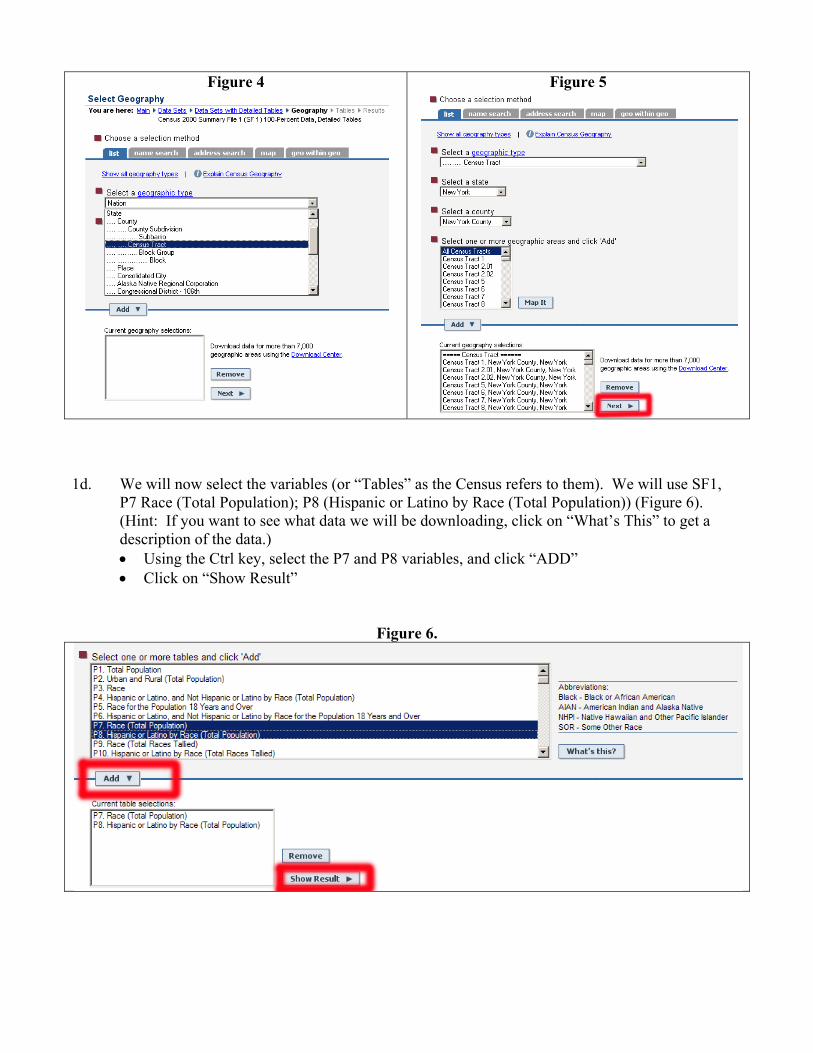
Figure 4
Figure 5
1d. We will now select the variables (or “Tables” as the Census refers to them). We will use SF1,
P7 Race (Total Population); P8 (Hispanic or Latino by Race (Total Population)) (Figure 6). (Hint: If you want to see what data we will be downloading, click on “What’s This” to get a description of the data.) • Using the Ctrl key, select the P7 and P8 variables, and click “ADD” • Click on “Show Result”
Figure 6.
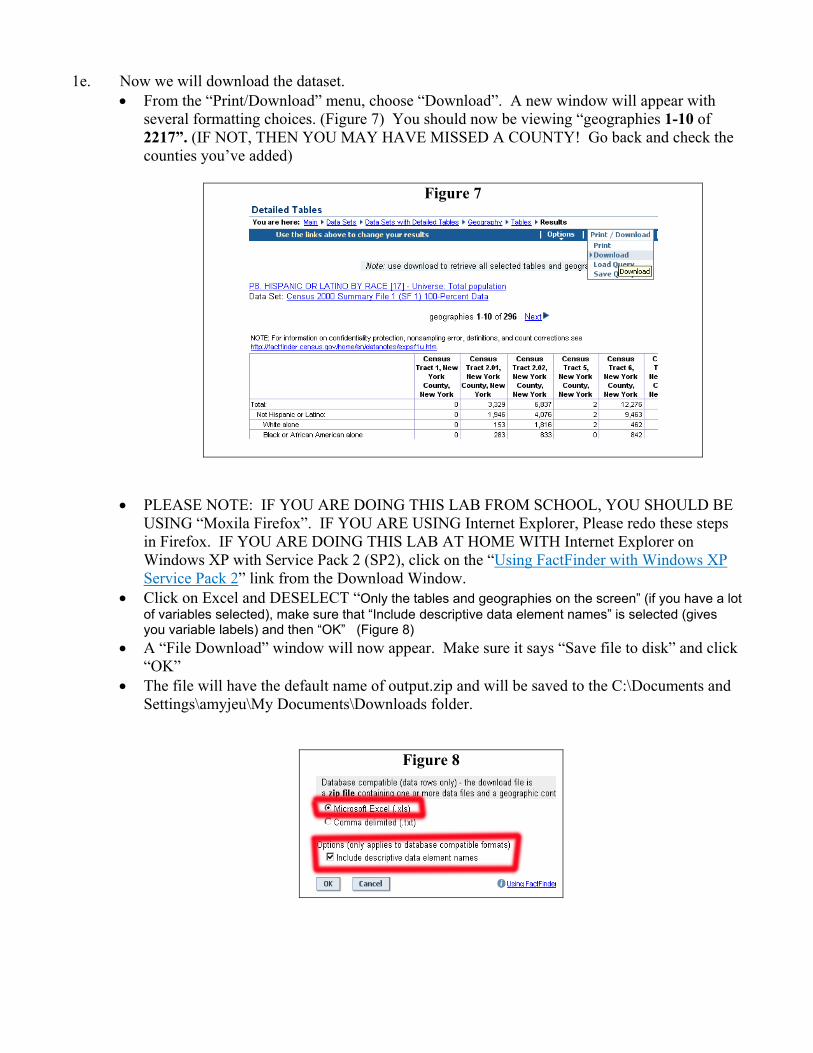
1e. Now we will download the dataset. • From the “Print/Download” menu, choose “Download”. A new window will appear with
several formatting choices. (Figure 7) You should now be viewing “geographies 1-10 of 2217”. (IF NOT, THEN YOU MAY HAVE MISSED A COUNTY! Go back and check the counties you’ve added)
Figure 7
• PLEASE NOTE: IF YOU ARE DOING THIS LAB FROM SCHOOL, YOU SHOULD BE USING “Moxila Firefox”. IF YOU ARE USING Internet Explorer, Please redo these steps in Firefox. IF YOU ARE DOING THIS LAB AT HOME WITH Internet Explorer on Windows XP with Service Pack 2 (SP2), click on the “Using FactFinder with Windows XP Service Pack 2” link from the Download Window.
• Click on Excel and DESELECT “Only the tables and geographies on the screen” (if you have a lot of variables selected), make sure that “Include descriptive data element names” is selected (gives you variable labels) and then “OK” (Figure 8)
• A “File Download” window will now appear. Make sure it says “Save file to disk” and click “OK”
• The file will have the default name of output.zip and will be saved to the C:\Documents and Settings\amyjeu\My Documents\Downloads folder.
Figure 8
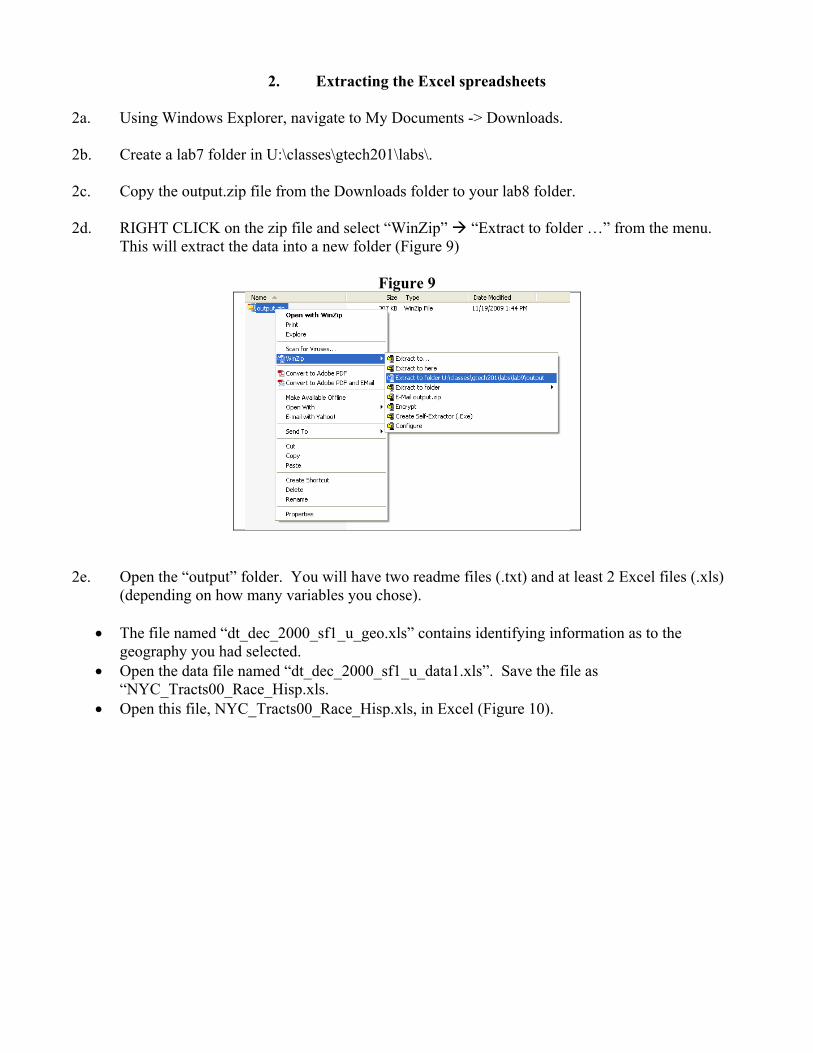
2. Extracting the Excel spreadsheets 2a. Using Windows Explorer, navigate to My Documents -> Downloads. 2b. Create a lab7 folder in U:\classes\gtech201\labs\. 2c. Copy the output.zip file from the Downloads folder to your lab8 folder. 2d. RIGHT CLICK on the zip file and select “WinZip” “Extract to folder …” from the menu.
This will extract the data into a new folder (Figure 9)
Figure 9
2e. Open the “output” folder. You will have two readme files (.txt) and at least 2 Excel files (.xls)
(depending on how many variables you chose).
• The file named “dt_dec_2000_sf1_u_geo.xls” contains identifying information as to the geography you had selected.
• Open the data file named “dt_dec_2000_sf1_u_data1.xls”. Save the file as “NYC_Tracts00_Race_Hisp.xls.
• Open this file, NYC_Tracts00_Race_Hisp.xls, in Excel (Figure 10).
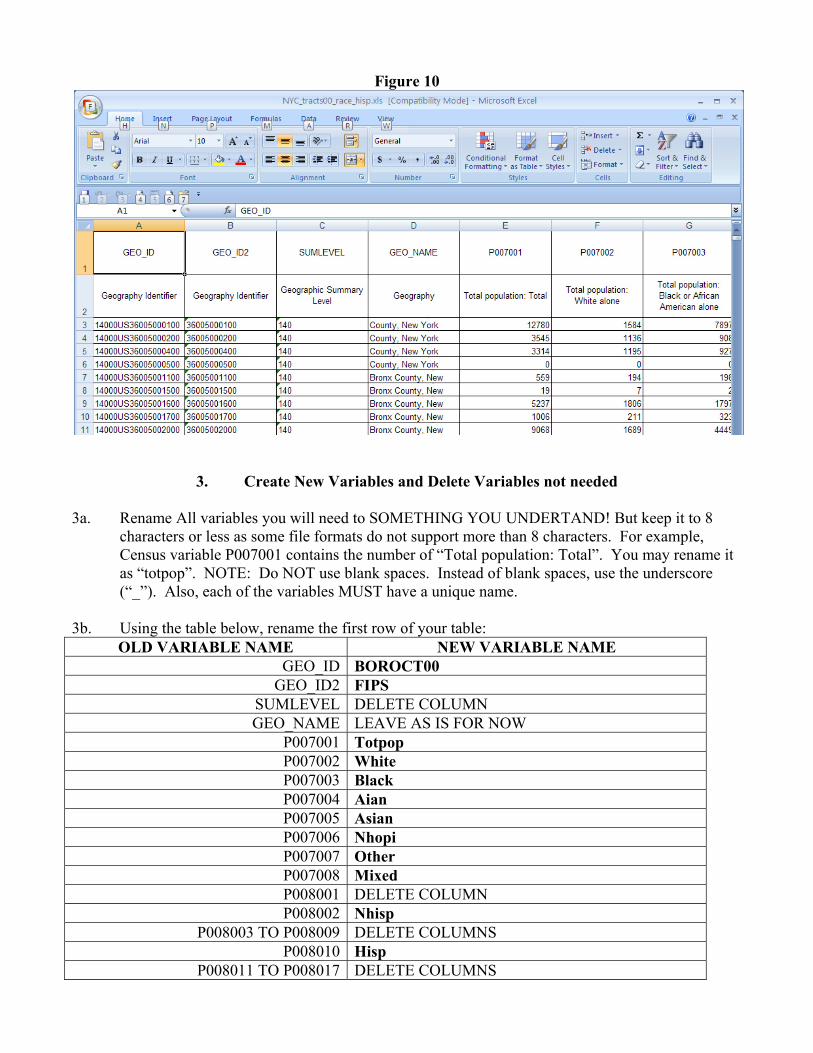
Figure 10
3. Create New Variables and Delete Variables not needed
3a. Rename All variables you will need to SOMETHING YOU UNDERTAND! But keep it to 8 characters or less as some file formats do not support more than 8 characters. For example, Census variable P007001 contains the number of “Total population: Total”. You may rename it as “totpop”. NOTE: Do NOT use blank spaces. Instead of blank spaces, use the underscore (“_”). Also, each of the variables MUST have a unique name.
3b. Using the table below, rename the first row of your table:
OLD VARIABLE NAME NEW VARIABLE NAME GEO_ID BOROCT00
GEO_ID2 FIPS SUMLEVEL DELETE COLUMN GEO_NAME LEAVE AS IS FOR NOW
P007001 Totpop P007002 White P007003 Black P007004 Aian P007005 Asian P007006 Nhopi P007007 Other P007008 Mixed P008001 DELETE COLUMN P008002 Nhisp
P008003 TO P008009 DELETE COLUMNS P008010 Hisp
P008011 TO P008017 DELETE COLUMNS
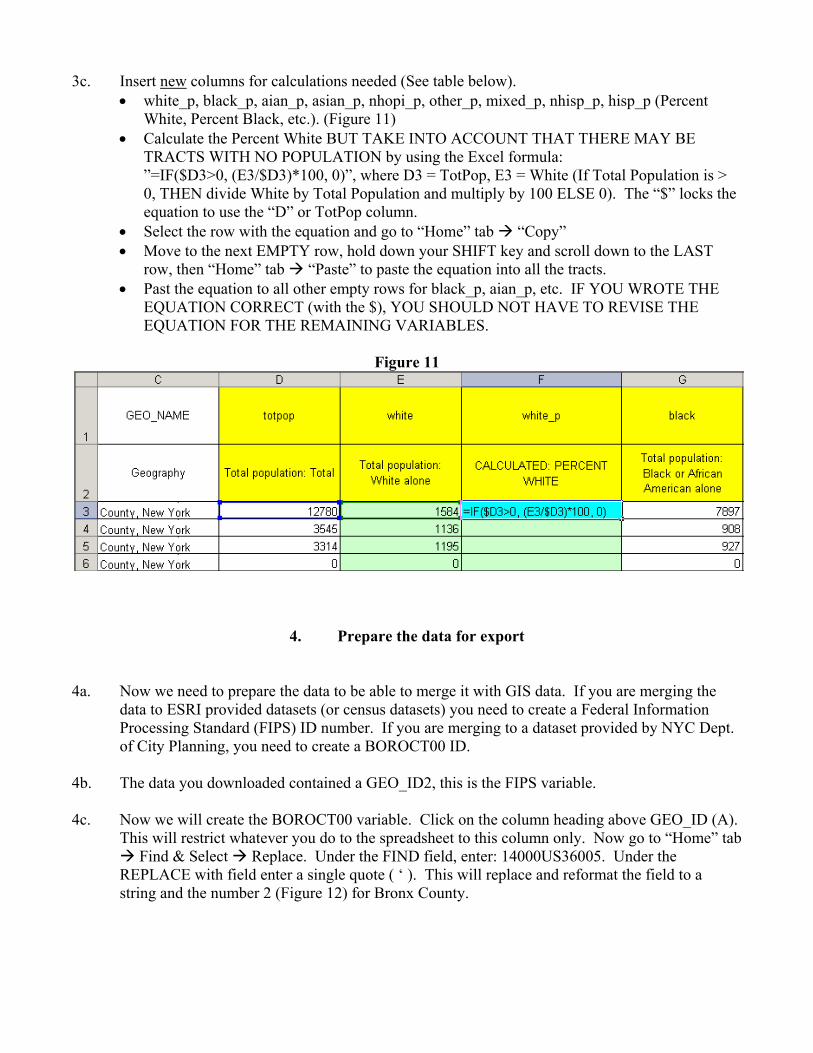
3c. Insert new columns for calculations needed (See table below). • white_p, black_p, aian_p, asian_p, nhopi_p, other_p, mixed_p, nhisp_p, hisp_p (Percent
White, Percent Black, etc.). (Figure 11) • Calculate the Percent White BUT TAKE INTO ACCOUNT THAT THERE MAY BE
TRACTS WITH NO POPULATION by using the Excel formula: ”=IF($D3>0, (E3/$D3)*100, 0)”, where D3 = TotPop, E3 = White (If Total Population is > 0, THEN divide White by Total Population and multiply by 100 ELSE 0). The “$” locks the equation to use the “D” or TotPop column.
• Select the row with the equation and go to “Home” tab “Copy” • Move to the next EMPTY row, hold down your SHIFT key and scroll down to the LAST
row, then “Home” tab “Paste” to paste the equation into all the tracts. • Past the equation to all other empty rows for black_p, aian_p, etc. IF YOU WROTE THE
EQUATION CORRECT (with the $), YOU SHOULD NOT HAVE TO REVISE THE EQUATION FOR THE REMAINING VARIABLES.
Figure 11
4. Prepare the data for export 4a. Now we need to prepare the data to be able to merge it with GIS data. If you are merging the
data to ESRI provided datasets (or census datasets) you need to create a Federal Information Processing Standard (FIPS) ID number. If you are merging to a dataset provided by NYC Dept. of City Planning, you need to create a BOROCT00 ID.
4b. The data you downloaded contained a GEO_ID2, this is the FIPS variable. 4c. Now we will create the BOROCT00 variable. Click on the column heading above GEO_ID (A).
This will restrict whatever you do to the spreadsheet to this column only. Now go to “Home” tab Find & Select Replace. Under the FIND field, enter: 14000US36005. Under the
REPLACE with field enter a single quote ( ‘ ). This will replace and reformat the field to a string and the number 2 (Figure 12) for Bronx County.
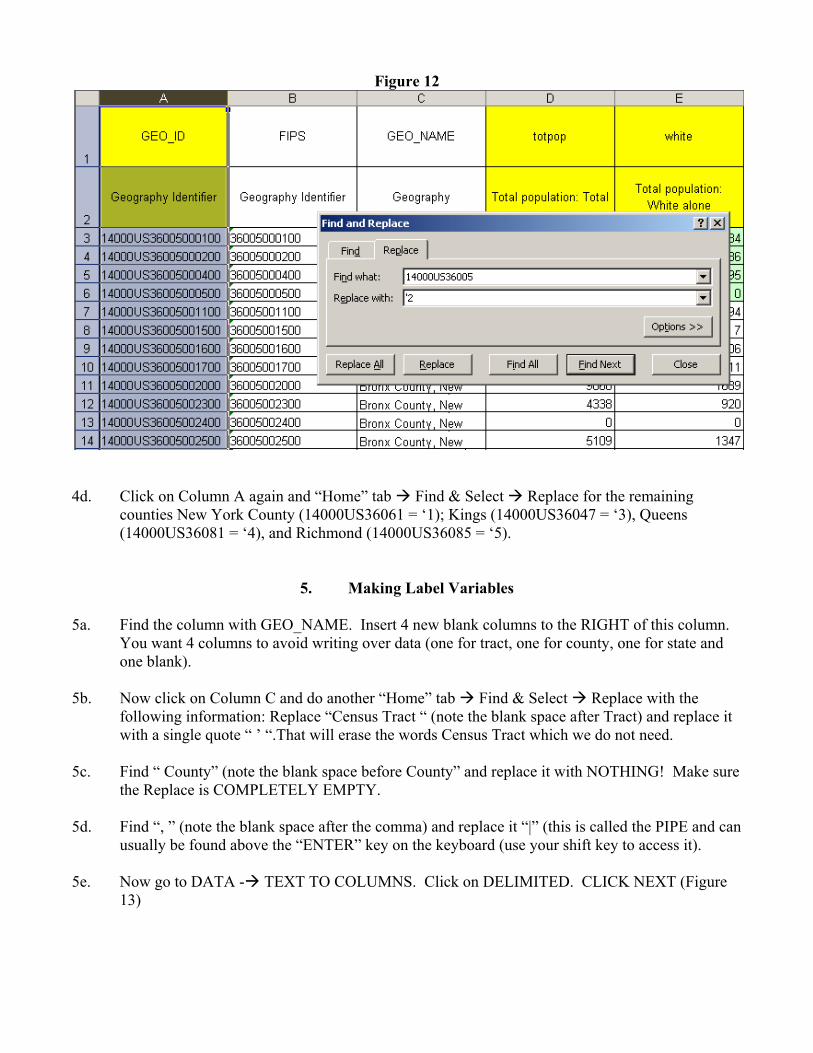
Figure 12
4d. Click on Column A again and “Home” tab Find & Select Replace for the remaining
counties New York County (14000US36061 = ‘1); Kings (14000US36047 = ‘3), Queens (14000US36081 = ‘4), and Richmond (14000US36085 = ‘5).
5. Making Label Variables 5a. Find the column with GEO_NAME. Insert 4 new blank columns to the RIGHT of this column.
You want 4 columns to avoid writing over data (one for tract, one for county, one for state and one blank).
5b. Now click on Column C and do another “Home” tab Find & Select Replace with the
following information: Replace “Census Tract “ (note the blank space after Tract) and replace it with a single quote “ ’ “.That will erase the words Census Tract which we do not need.
5c. Find “ County” (note the blank space before County” and replace it with NOTHING! Make sure
the Replace is COMPLETELY EMPTY. 5d. Find “, ” (note the blank space after the comma) and replace it “|” (this is called the PIPE and can
usually be found above the “ENTER” key on the keyboard (use your shift key to access it). 5e. Now go to DATA - TEXT TO COLUMNS. Click on DELIMITED. CLICK NEXT (Figure
13)
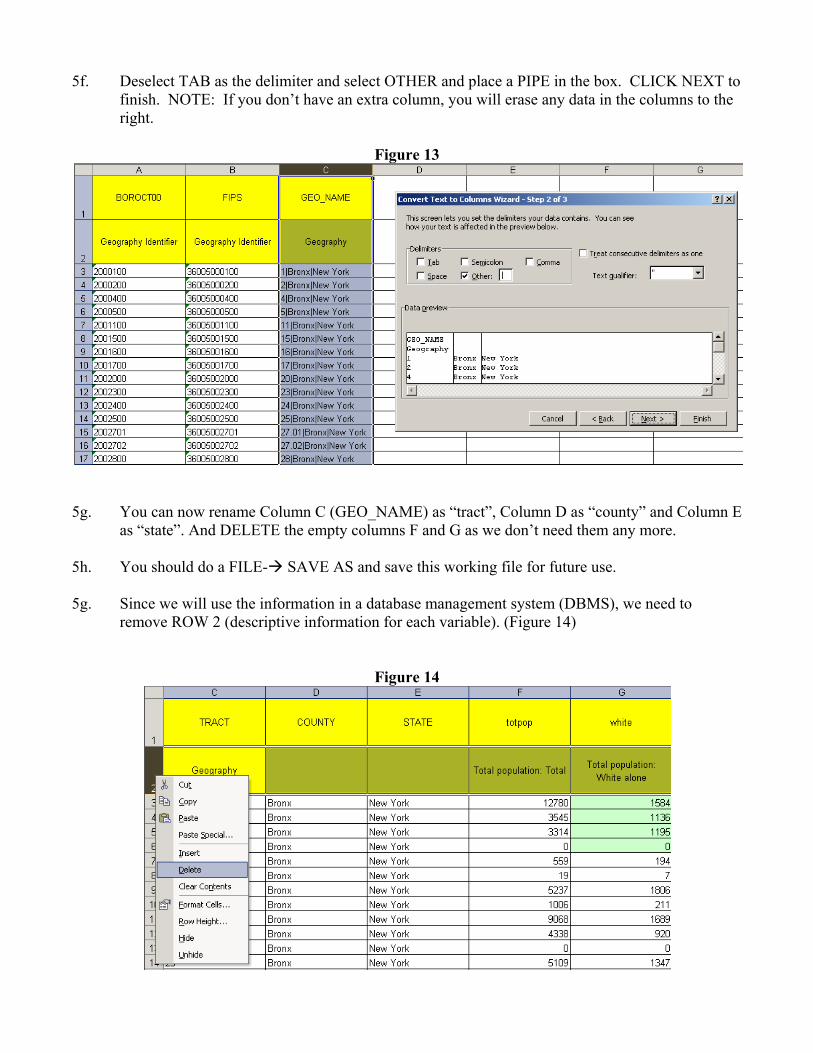
5f. Deselect TAB as the delimiter and select OTHER and place a PIPE in the box. CLICK NEXT to finish. NOTE: If you don’t have an extra column, you will erase any data in the columns to the right.
Figure 13
5g. You can now rename Column C (GEO_NAME) as “tract”, Column D as “county” and Column E
as “state”. And DELETE the empty columns F and G as we don’t need them any more. 5h. You should do a FILE- SAVE AS and save this working file for future use. 5g. Since we will use the information in a database management system (DBMS), we need to
remove ROW 2 (descriptive information for each variable). (Figure 14)
Figure 14
6. Join the Data
ArcGIS 9.3 supports directly importing data from Excel. 6a. First, add the shapefile that contains census tracts for NYC. To make sure our new variables
work, we’ll use one from NYC Department of City Planning (NYCDCP) (http://www.nyc.gov/html/dcp/html/bytes/dwndistricts.shtml) and one from ESRI (http://arcdata.esri.com/data/tiger2000/tiger_download.cfm). DO THEM ONE AT A TIME AS THEY HAVE DIFFERENT PROJECTIONS! So let’s first add the NYCDCP shapefile.
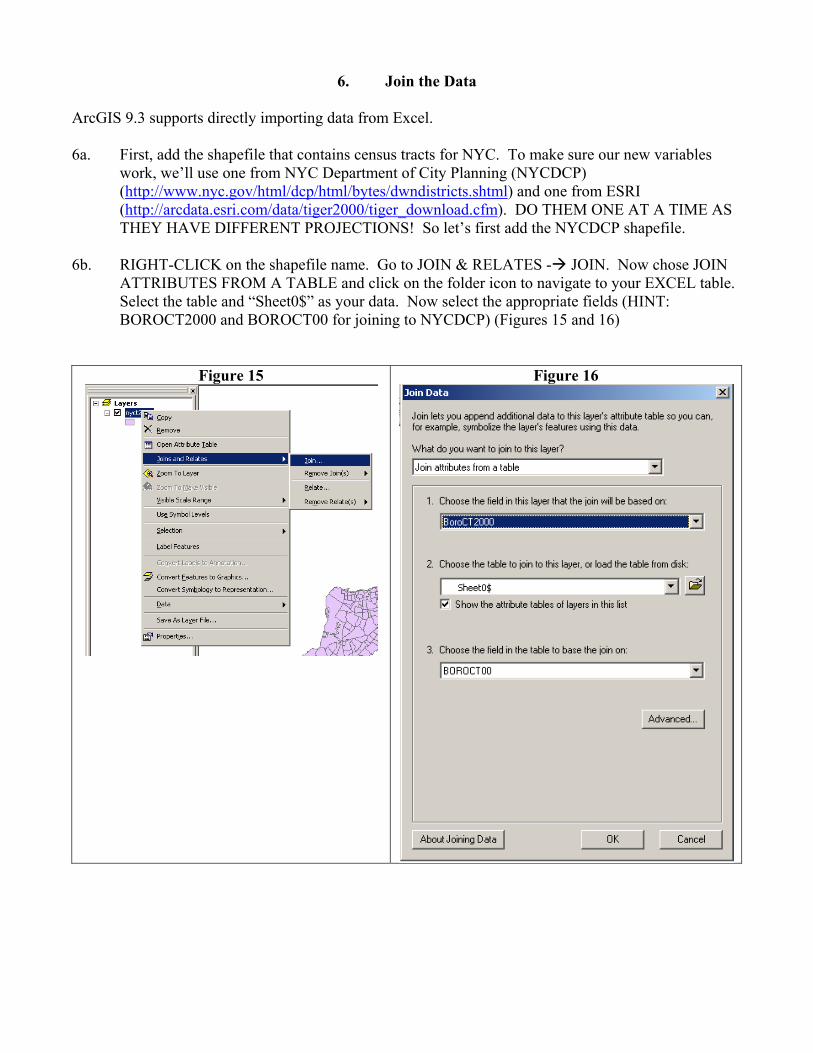
6b. RIGHT-CLICK on the shapefile name. Go to JOIN & RELATES - JOIN. Now chose JOIN
ATTRIBUTES FROM A TABLE and click on the folder icon to navigate to your EXCEL table. Select the table and “Sheet0$” as your data. Now select the appropriate fields (HINT: BOROCT2000 and BOROCT00 for joining to NYCDCP) (Figures 15 and 16)
Figure 15
Figure 16

6c. Once joined, you should open up your shapefile’s attributes to see if it joined properly. (NOTE: Sometimes ARCMAP gives you an error and the whole thing is blank. If this happened, EXPORT the shapefile to a NEW shapefile (RIGHT-CLICK on shapefile name, DATA - EXPORT DATA). This will correct the problem). You will have the variables from shapefile followed by the variables from your table (Figures 17 and 18).
Figure 17
Figure 18.
6d. If there is info on the first few columns (original shapefile variables) and <NULL> the variables
with your data, something did not work! Try it again!
7. Create your Thematic Map 7a. Right-click on your shapefile and scroll down to properties. This will bring up a dialog box with
several tabs. Click on the “SYMBOLOGY” tab. 7b. Select QUANTITIES GRADUATED COLOR. For FIELDS VALUE, select a variable of
interest and click OK. For this example, we are using the Percent White we created. NOTE: It may be tough for you to see the variable name. There are ways to fix this but we won’t do this in this lab. (Figure 19)
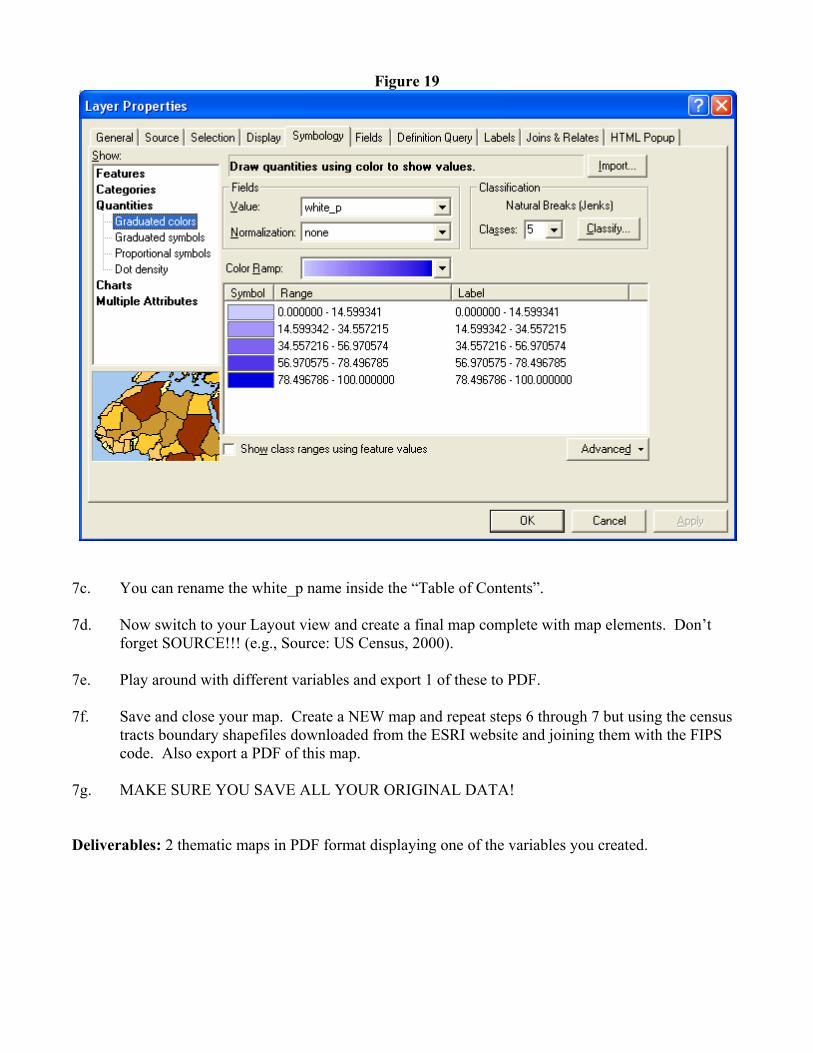
Figure 19
7c. You can rename the white_p name inside the “Table of Contents”. 7d. Now switch to your Layout view and create a final map complete with map elements. Don’t
forget SOURCE!!! (e.g., Source: US Census, 2000). 7e. Play around with different variables and export 1 of these to PDF. 7f. Save and close your map. Create a NEW map and repeat steps 6 through 7 but using the census
tracts boundary shapefiles downloaded from the ESRI website and joining them with the FIPS code. Also export a PDF of this map.
7g. MAKE SURE YOU SAVE ALL YOUR ORIGINAL DATA! Deliverables: 2 thematic maps in PDF format displaying one of the variables you created.