Embed Size (px)
Citation preview

Real-Time Information 2800 Eisenhower Avenue 703-373-5100 1-877-INFOSEC ProtectionSM Alexandria, VA 22314 703-329-3100 Fax www.riptech.com
©2002 by Riptech, Inc. All Rights Reserved
January 28, 2002 An Important Message from the President: Over the past four years, Riptech has developed and refined an advanced infrastructure to deliver managed security services. Leveraging this infrastructure, Riptech continually conducts sophisticated data mining and expert analysis of security data to detect and respond to cyber attacks in real time on behalf of its clients. As a by-product of this service, Riptech maintains a vast repository of analyzed attack data. This repository of attack data was recently analyzed to identify cyber attack trends over time. Prior to the production of this report, attempts to summarize network attack trends were based mainly on the statistical analysis of raw firewall log and intrusion detection alert data, which for a variety of reasons tend to overestimate the true intensity of attacks and provide misleading conclusions regarding the true nature of Internet-based threats. Other techniques rely strictly on survey results, which suffer from inconsistent attack detection capabilities, as well as inherent inaccuracies associated with self-reporting of security incidents. In sum, while both of these methods provide a baseline understanding of cyber attack activity, each lacks a systematic process for detecting, analyzing, and validating security attacks that are used in the trending analysis. As the observations discussed in the Internet Security Threat Report demonstrate, Riptech is uniquely positioned to provide a more refined picture of cyber attack trends over time. In many cases, the findings simply confirm observations set forth by others, while in other cases, the findings directly conflict with conventional wisdom. Findings presented in this report are enlightening and, in several instances, uncover previously unknown observations about the nature of cyber attack activity and intensity. In summary, we believe that a wide variety of audiences stand to benefit from this report. Security administrators at individual companies will use this information to gain a more precise understanding of their unique risk profile and thereby create more informed mitigation decisions. Members of the media will use the report as a source of information concerning the nature of the cyber threat. Finally, members of the information security community will use this information to obtain more clarity on the nature of cyber security threats and thereby provide a higher level of security to their clients. We hope that you find the observations in this report to be useful, and we look forward to sharing additional insights in future issues of the report. Sincerely, Amit Yoran President and Chief Executive Officer

©2002 by Riptech, Inc. All Rights Reserved
Riptech Internet Security Threat Report Attack Trends for Q3 and Q4 2001 Introduction Riptech’s Internet Security Threat Report offers a broad quantitative analysis of Internet-based attacks targeted at hundreds of organizations during the last half of 2001. Because of the large sample size of the organizations studied (selected from Riptech’s client base), the trends presented in this report provide an overall indicator of threats faced by the entire Internet community. Trends presented in this report are made possible by Riptech’s managed security service. Enabled by the CaltarianSM technology platform, Riptech analyzes data produced by numerous brands of firewalls and intrusion detection systems (IDSs) used by hundreds of clients throughout the world. Using a sophisticated combination of technology and human expertise to analyze this data, Riptech identifies and investigates cyber attacks that occur on client networks in real-time. A by-product of this daily investigation of Internet attacks is a vast amount of data on cyber threats that can be analyzed to reveal interesting and actionable trends. Due to the nature of the data that is collected, it is important to note that the majority of detected attacks are from external threats. While internal attacks (i.e., those launched by company insiders) are also detected, the trends in this report focus on the threat of attacks launched from the outside. We believe this study provides a uniquely accurate view of the state of Internet threats. Over the past six months alone, Riptech investigated 128,678 cyber attacks on behalf of its clients. These attacks were detected by analyzing more than 5.5 billion firewall logs and IDS alerts. Trends discussed in this report are based on the historical analysis of these attacks. Because the analysis is based on consistent, comparable data reviewed by expert analysts, the findings offer a more reliable view of the state of Internet security as compared to studies that rely on less controlled methodologies.1 For example, survey-based studies suffer from the widely disparate ways in which organizations detect, track, calculate, and report security incidents. Open source data collection services, which are based on the automated analysis of firewall and IDS logs submitted voluntarily by companies, suffer from the inclusion of large numbers of false-positive security events. In sum, the Riptech Internet Security Threat Report is the first large-scale study to analyze Internet attacks based on actual empirical attack data that have been consistently collected and analyzed over an extended period of time.
1 See Appendix A for a detailed discussion of different types of methodologies that organizations use to investigate Internet-based attack trends.
January 2002 Riptech, Inc. 2800 Eisenhower Avenue Alexandria, VA 22314 703-373-5100
Primary Authors
Tim Belcher Chief Technology Officer
Elad Yoran Founder & Executive Vice President Contributing Authors
Mark Higgins Brian Dunphy Jeff Odom Media Contact
Michael Adler Dir., Corp. Communications 703-373-5163 [email protected]
In order to ensure that the Internet community is informed of future attack trends that emerge on the Internet,Riptech will continue to publish the Internet Security Threat Report on a semi-annual basis. In addition to revisiting trends addressed in this report (e.g., attack intensity by industry), future reports will investigate entirely new trends and hypotheses in order to provide even deeper insights into the nature of the Internet security threat and how it is evolving over time.
TIMELINE FOR FUTURE REPORTS

Riptech, Inc. 2800 Eisenhower Avenue Alexandria, VA 22314 (703)-373-5100 Page 2
©2002 by Riptech, Inc. All Rights Reserved
TABLE OF CONTENTS
EXECUTIVE SUMMARY 3 DEMOGRAPHICS OF THE SAMPLE SET 5 � INDUSTRY CLASSIFICATION 5 � COMPANY SIZE 6 � OWNERSHIP TYPE 6 METHODOLOGY 7 � ATTACK IDENTIFICATION AND CLASSIFICATION 7 � CLIENT CLASSIFICATIONS 8 � ATTACK METRICS 9 GENERAL ATTACK TRENDS 12 � ATTACKER INTENT 12 � ATTACK INTENSITY 13 � ATTACK SCOPE AND SEVERITY 14 � ATTACK SOURCE 15 COMMON ATTACK ACTIVITY 17 � OVERVIEW 17 � TOP TEN ATTACKS 17 THREAT VARIANCE BY TYPE OF COMPANY 19 � ATTACKS BY INDUSTRY 19 � ATTACKS BY COMPANY SIZE AND OWNERSHIP TYPE 21 CONCLUSIONS 23 APPENDIX A—VALUE OF ANALYZED ATTACK DATA A-1 � OVERVIEW A-1 � ANALYSIS OF UNANALYZED VERSUS VALIDATED ATTACKS A-2 � CONCLUSIONS A-3 APPENDIX B—ANALYSIS OF CODE RED AND NIMDA B-1 � BACKGROUND B-1 � CODE RED B-2 � CODE RED II B-3 � NIMDA B-4 � DISCUSSION B-5

Riptech, Inc. 2800 Eisenhower Avenue Alexandria, VA 22314 (703)-373-5100 Page 3
©2002 by Riptech, Inc. All Rights Reserved
EXECUTIVE SUMMARY Riptech’s analysis of attack data revealed a wealth of interesting observations, many of which represent original findings. Overall, it appears that the external threat is increasing steadily, and may, in fact, be increasing more rapidly than is commonly reported by other Internet security studies. In addition, while the Internet community as a whole appears to suffer from an increased threat from outside attacks, the relative threat to individual organizations appears to vary significantly depending on factors such as company size, company ownership, and industry affiliation. Major findings discussed in this report are summarized below.
Major Findings
� The growing threat of worm-related activity
- Not surprisingly, the Nimda and Code Red worms generated the majority of attack activity, accounting for 63% of all attack activity detected by Riptech.
- The enormous impact of these two worms, which only targeted a handful of web server vulnerabilities, demonstrates the persistent, broad-scale prevalence of vulnerabilities to major attacks.
- New worms and variants of existing worms will certainly appear in the future, as hackers discover new vulnerabilities and innovative ways to exploit existing vulnerabilities.
- As a final note on worm activity, because the data set was so heavily affected by these two events, subsequent analysis removes these two incidents from consideration (unless otherwise noted) in order to reveal other underlying trends and issues.2
� The rate of attack activity increased substantially over the past six months
- Average attacks per company increased by 79% between July and December 2001.
- While less than 1% of all attacks detected by Riptech posed a severe and immediate threat to clients, the raw number of severe attacks (i.e., nearly 1,000 critical and emergency attacks), was still substantial due to the sheer volume of total attacks.
- Furthermore, over the past six months more than 43% of companies suffered at least one attack that would have resulted in a successful breach had intervention not occurred on the client’s behalf.
� A substantial percentage of attacks appeared to be deliberately targeted at a
specific organization - 39% of attacks appeared to be a deliberate attempt to compromise a
specific target system or company; 61% of attacks appeared to be opportunistic in nature (i.e., the attacker was broadly searching for any vulnerable system on the Internet).
- The rate of targeted attacks was 42% for companies with greater than 1,000 employees, directionally suggesting that larger, higher profile companies may be the victims of deliberate attacks more frequently than lower profile companies.
2 See Appendix B for a detailed discussion of the Code Red and Nimda worms.

Riptech, Inc. 2800 Eisenhower Avenue Alexandria, VA 22314 (703)-373-5100 Page 4
©2002 by Riptech, Inc. All Rights Reserved
� The vast majority of attacks against the sample were launched from a small
number of countries - Ten countries were the source of approximately 70% of all attacks against
the sample. - The United States (30%), South Korea (9%), and China (8%) were the
most frequent sources of attack, accounting for approximately 47% of all attacks.
- In terms of the number of attacks launched per Internet user, Israel was by a wide margin the largest source of attack activity; in addition, five of the top ten attacking countries per Internet user are located in the Pacific Rim, including Hong Kong, Thailand, South Korea, Malaysia, and Taiwan.
- South Korea, France, and Taiwan were top ten attack sources BOTH in terms of total attacks and attacks per Internet capita.
� Different industries suffer significantly different rates of attack intensity and
severity - High Tech, Financial Services, Media/Entertainment, and Power and
Energy companies showed the highest intensity of attacks per company; each averaged more than 700 attacks per company over the past six months.
- Power and Energy companies suffered severe attacks at a rate that was more than twice the mean of all companies in the sample set.
- Power and Energy companies suffered attacks from the Middle East at a rate that was more than 3 times greater than the mean for all companies in the sample set.
- High Tech and Financial Services companies suffered attacks from Asia at a rate that was 55-70% greater than the mean for all companies in the sample set.
� Attack intensity and intent varied moderately depending on company size and
significantly based on ownership type - Companies with greater than 500 employees suffered at least 50% more
attacks per company than companies with fewer than 500 employees. - Attackers are slightly more likely to launch targeted attacks against
companies with more than 1,000 employees than companies with less than 1,000 employees.
- Public companies suffered approximately twice the number of attacks per company as private and nonprofit companies.
It is important to note that the majority of the analysis presented in this report excludes attacks associated with the Code Red and Nimda worms. This decision was made because while these two incidents only represent two distinct events that occurred over the past six months, they accounted for approximately 63% of the malicious activity detected by Riptech. When evaluating overall attack trends, Nimda and Code Red are discussed as two distinct security-related events during the study period. If Riptech were to include Code Red and Nimda in the overall analysis of attack activity, all major trends in the report would primarily reflect activity associated with these two single events. Therefore, unless otherwise indicated, trends in this report do not include attack activity associated with these worms.
AN IMPORTANT NOTE ABOUT CODE RED AND NIMDA

Riptech, Inc. 2800 Eisenhower Avenue Alexandria, VA 22314 (703)-373-5100 Page 5
©2002 by Riptech, Inc. All Rights Reserved
DEMOGRAPHICS OF THE SAMPLE SET
The sample set from which the attack trends in this report were derived consists of more than 300 companies, located in more than 25 countries throughout the world. Combined, the security devices at these companies protect more than 1 million Internet-connected hosts. In terms of diversity, the sample set includes a broad array of organizations as measured by criteria such as industry, size, and ownership type. Key characteristics of the sample set are outlined in greater detail throughout the remainder of this section.
� Industry Classification
Industry segments with the strongest representation include Business Services, High Tech, and Financial Services. Figure 1 presents the industry break down of the sample set in percentage terms.
Business Services25%
High Tech14%
Financial Services11%E-Commerce
9%
Other8%
Manufacturing8%
Healthcare6%
Media/Entertainment6%
Power & Energy5%
Nonprofit4%
ASP4%
FIGURE 1—INDUSTRY BREAK DOWN OF SAMPLE
* ”Other” includes industries that each represents less than 2% of the sample size. Industries that are accounted for in this category include retail, telecommunications, transportation, education, legal, government, and real estate.

Riptech, Inc. 2800 Eisenhower Avenue Alexandria, VA 22314 (703)-373-5100 Page 6
©2002 by Riptech, Inc. All Rights Reserved
� Company Size
The total number of employees was used as a proxy to measure company size. Figure 2 indicates the break down by company size for the sample set.
� Ownership Type
Privately owned companies constitute the majority of the sample set. Nonprofit and government entities combined represent approximately 11% of the sample. Figure 3 indicates the break down by ownership type for the sample set.
1,000 - 4,99912%
5,000+11%
500 - 9998%
Fewer than 50069%
FIGURE 2—COMPANY SIZE BY NUMBER OF EMPLOYEES FOR THE SAMPLE
P riva t e72 %
P ub lic17%
N o np ro f i t7%
Go v e rnme nt4%
FIGURE 3—COMPANY OWNERSHIP TYPE FOR THE SAMPLE

Riptech, Inc. 2800 Eisenhower Avenue Alexandria, VA 22314 (703)-373-5100 Page 7
©2002 by Riptech, Inc. All Rights Reserved
METHODOLOGY
Trends discussed in this report are based solely on the analysis of cyber attacks that were directed at a sample of organizations selected from among Riptech’s client base. The subset consisted of well over 300 companies that subscribed to Riptech’s real-time security monitoring service over the past six months. Each attack that was analyzed for this report was identified, investigated, and commented on by Riptech’s Security Operations Center (SOC) analysts. False positive signs of malicious activity (which often constitute up to 99% of raw IDS alerts) are excluded from this analysis, as these alerts provide a misleading perception of the true nature of the Internet security threat. Over the past six months, Riptech analyzed, confirmed, and categorized 128,678 attacks, which were generated from the analysis of more than 5.5 billion firewall logs and IDS alerts. It is these 128,678 attacks that were analyzed for this report. In order to provide a detailed understanding of how attack trends were determined, this section outlines the following three critical components of Riptech’s methodology:
� Attack Identification and Classification—This is the process that Riptech uses to
identify, investigate, and classify attacks that are directed toward clients. The attack identification and classification process enables Riptech to focus the analysis in this report exclusively on actual confirmed attacks.
� Client Classification—Riptech categorizes each of its clients according to a wide
range of criteria, such as industry, company size, and company ownership type. Categorizing clients by different criteria enables Riptech to observe how attack trends vary for different types of organizations.
� Attack Metrics—Riptech used five attack metrics to determine the nature of attack
activity against Riptech’s clients over time. Metrics used in this report include attack intensity, attack severity, attack type, attack source, and attacker intent.
Each of the three core components of Riptech’s methodology is summarized in greater detail throughout the remainder of this section. � Attack Identification and Classification Identification and classification of attacks is the end result of a sophisticated process that involves the use of complex technology and analysis by Riptech security experts. Through this process Riptech is able to analyze every firewall log and IDS alert generated by client devices and isolate and investigate entire attack sequences in real time. The combination of sophisticated technology and expert human analysis ensures that the attack identification process is comprehensive and consistent over time. Figure 4 outlines the key steps of the attack identification and classification process.

Riptech, Inc. 2800 Eisenhower Avenue Alexandria, VA 22314 (703)-373-5100 Page 8
©2002 by Riptech, Inc. All Rights Reserved
FIGURE 4—ATTACK IDENTIFICATION AND CLASSIFICATION PROCESS
Stage of Analysis Description Data Generated during the Six-Month Period
Stage #1—Collection and Normalization of Security Data from Clients’ Firewalls and IDSs
Security data is imported from firewalls and/or IDSs, normalized into a standard format, and stored in a dedicated client database.
5.5 billion firewall logs and IDS alerts
Stage #2—Data Mining of Normalized Security Data
Security data is continuously mined by Caltarian to isolate occurrences and/or patterns of potentially malicious activity. Once identified, such patterns or occurrences of malicious activity are stored as sub-events in a separate table within the database.
3.2 million sub-events
Stage #3—Security Event Correlation and Presentation
Security sub-events generated during the data mining stage are linked by logical criteria, such as attack type, attack direction, and source IP. For example, a correlated security event may present all signs of attacks detected from a single IP address in China. Security events are then posted to a graphical user interface (GUI) in the Riptech SOC, and security analysts review and investigate each event to determine the type and severity of the event.
652,605 possible attacks
Stage #4—Attack Classification
After completing an investigation of the possible attack, attacks that are determined to be “false positive” are eliminated from consideration.* Confirmed attacks are assigned a signature that indicates the type of attack that has occurred. Based upon the apparent intent and sophistication of the activity, attacks are also assigned a severity level. Only attacks that are assigned a signature number and severity level are analyzed in this report.
128,678 validated attacks
* False positive attacks represent attacks that were initially flagged as potentially malicious, but later determined to be benign after evaluation by a Riptech security analyst. Over the past six months 523,927 possible attacks were determined by analysts to be “false positives.”
� Client Classifications The sample set was classified according to a wide variety of criteria. Classifications were based on information obtained from the client and from public sources. Organizations were categorized according to 9 different classifications: � Industry � Company size (by number of employees) � Company location � Ownership type (public, private, etc.) � Membership in Fortune 500 � Multinational presence � Parent company � Security device type (e.g., firewall or IDS) � Security device brand and version For this report, Riptech focused on trends related to industry, company size, and ownership type, as these classifications demonstrated the most significant variance in threat exposure. For future reports, other classifications, such as geographic location, may also be highlighted. In addition, several new classifications will be added in future reports and will be used to determine additional risk factors that affect the nature of the cyber security threats for different types of companies.

Riptech, Inc. 2800 Eisenhower Avenue Alexandria, VA 22314 (703)-373-5100 Page 9
©2002 by Riptech, Inc. All Rights Reserved
� Attack Metrics Riptech uses five basic metrics to determine trends in attack activity over time. These metrics are then applied to different classifications of clients to determine how the cyber-security threat differs for companies that share common characteristics. For example, attack intensity is evaluated for companies that reside in different industries to see if certain industries are more prone to attack than others. Each metric used to measure the relative cyber security threat is summarized throughout the remainder of this section. Attack Intensity Overall, attack intensity was determined by looking at the total number of attacks per company that were detected against the sample over a set time (i.e., day, week, month, etc.). By calculating the average attacks per company each day, and then averaging the sum of these averages over six months, Riptech was able to accurately account for clients that were added to the sample set throughout the past six months. In sum, these formulas ensured that changes to the Riptech client base over time did not affect measures of attack intensity. Attack Severity Every attack that is identified and investigated by Riptech security analysts is assigned a severity rating. The primary purpose of this rating system is to enable Riptech’s clients to prioritize their review of security events based upon the relative level of danger that the event presents to their organization. A determination of severity is made by considering characteristics of an attack, defense mechanisms used by the client, and the value of the assets that are at risk. For the purposes of this report, the severity rating enabled Riptech to determine differences in the danger faced by various types of organizations over time. Figure 5 outlines the four severity ratings that Riptech assigns to attacks and explains the types of attacks that are included in each category.

Riptech, Inc. 2800 Eisenhower Avenue Alexandria, VA 22314 (703)-373-5100 Page 10
©2002 by Riptech, Inc. All Rights Reserved
FIGURE 5—EVENT SEVERITY SCALE
Severity Level Description
Informational
These events consist of scans for malicious services and IDS events that do not have a significant impact on the client’s network. Example: � Scans for vulnerable services where all connection attempts are dropped by the firewall.
Warning
These events represent malicious attacks that were successful in bypassing the firewall, but did not compromise the intended target systems. Example: � Scans/horizontal sweeps where some connections were allowed, but a compromise has not occurred.
Critical
These events are malicious in nature and require action on the part of Riptech or the client to remedy a weakness or actual exploit of the client network or devices. By definition, if a critical event is not addressed with countermeasures, the attack may result in a successful compromise of a system. Examples: � Continuous attacks by a single IP address against the client network. � A significant vulnerability on the customer's network that was identified by either an attacker or the
Security Operations Center (SOC). For example, a web exploit is observed and appears to be successful, but there is no observed follow-up activity to take advantage of the vulnerability.
� Unknown suspicious traffic that warrants an investigation by the client to track or eliminate the traffic flow.
Emergency
These events indicate that a security breach has occurred on the client’s protected network. An emergency event requires the client to initiate some form of recovery procedure. Examples: � Successful exploit of a vulnerable web server. � Successful compromise of a system by a worm (e.g., Nimda).
Attack type In order to gain a better understanding of attack trends over time, Riptech analysts categorize attack activity of a similar nature using a numbering system.3 In effect, each type of attack activity that is identified by Riptech is assigned a signature number that indicates the specific actions taken by an attacker. For example, an attempt by an attacker to exploit the Microsoft IIS Unicode vulnerability is assigned a unique signature number each time it is detected by Riptech analysts. Currently, Riptech tracks thousands of different forms of attack activity, and analysts are adding new signatures daily as new vulnerabilities and attack methods emerge. In order to measure the frequency of different types of attack activity, Riptech measured the percentage of validated attacks that contained specific forms of attack activity.
3 Due to the large number of attack signatures (and the fact that these signatures are considered valuable intellectual property), a comprehensive listing of specific signatures tracked by Riptech is not included in this report.

Riptech, Inc. 2800 Eisenhower Avenue Alexandria, VA 22314 (703)-373-5100 Page 11
©2002 by Riptech, Inc. All Rights Reserved
Attack Source Riptech identified the national and regional source of attacks by cross-referencing source IP addresses of every attack with several third party databases that are able to link the geographic location of hosts to the source IP address. While these databases are reliable at a high level, there is some margin of error. Currently, Riptech cross references source IPs of attacks against every country in the world and also analyzes attack trends according to the following regions as defined by the 2001 CIA World Fact Book: � Africa � Asia � Caribbean � Eastern Europe � Latin America
� Middle East � North America � Oceania � South America � Western Europe
Attacker Intent In order to determine general attacker objectives, Riptech looked at a sample of more than 100 clients who share a common network block. Riptech then examined all attacks launched against these clients, and determined the percentage of clients that suffered targeted versus opportunistic attacks. Figure 6 outlines how each type of attack was categorized as targeted versus opportunistic.
FIGURE 6—DEFINITIONS OF ATTACKER INTENT
Objective Description
Opportunistic
Opportunistic attacks appear to be intent on locating any vulnerable system that exists on the Internet regardless of who owns the system or the specific function of the system. In this situation the victim of the attack was not identified in advance, but rather was selected after being identified as a vulnerable system. Typically, these attacks are preceded by a scan of many systems on the Internet until the attacker pinpoints a system that has vulnerabilities that he/she knows how to compromise.
Targeted
Targeted attacks appear to be directed at a specific organization. In theory, attackers who launch these types of attacks have identified the target company in advance and have made a conscious and deliberate attempt to gain access to their network. In this situation, the attacker is not looking for a specific vulnerability to gain access to ANY organization, but rather is looking for ANY vulnerability that will enable them to gain access to a specific system. For this report, these include all attacks in which the attacker did not perform any scan on any other networks within the network block of the sample set. In this situation, the attacker has only shown signs of malicious activity against one client.*
* It is important to note that it is possible that some attacks that appear targeted are actually opportunistic in nature. This is due to the fact that some attackers may use tools that randomly select a target without systematically scanning an entire network block for vulnerable systems. While it is expected that the number of these occurrences is small, this does introduce some margin of error in this calculation.

Riptech, Inc. 2800 Eisenhower Avenue Alexandria, VA 22314 (703)-373-5100 Page 12
©2002 by Riptech, Inc. All Rights Reserved
GENERAL ATTACK TRENDS An analysis of attacks against the sample set revealed several interesting findings. Overall, these findings strongly suggest that attack activity is severe, diverse, and steadily increasing. In order to provide a broad sense of the attack trends observed against the entire sample set, findings related to each of Riptech’s five attack metrics are discussed throughout this section. � Attacker Intent One of the most intriguing and challenging questions about Internet attacks is that of intent—was the attacker targeting a specific organization, or simply trolling the Internet and searching for an opportunity to exploit any vulnerable systems. The electronic data trail leaves few clues around this issue, since the same exploits and methodologies are frequently used for both types of attacks. That said, Riptech has created a methodology to separate two general classes of attack: those that are opportunistic (i.e., the attack is intended to exploit any vulnerable organization discovered on the Internet), and those that are targeted specifically at a given organization.
The results of Riptech’s analysis of targeted versus opportunistic attacks suggest that 39% of attacks were targeted toward a specific organization, while 61% were opportunistic in nature. While some number of the attacks classified as targeted may simply result from hackers that randomly selected targets (without scanning a network block to systematically identify vulnerable systems), it appears that the percentage of total attacks that are targeted in nature is significantly larger than is typically reported.
Op portunis t ic Attacks6 1%
Targ eted Attacks3 9%
FIGURE 7—ATTACKS BY ATTACKER INTENT
Note: The methodology to determine the frequency of each type of attack is described in further detail in the Methodology section of this report under Figure 6.

Riptech, Inc. 2800 Eisenhower Avenue Alexandria, VA 22314 (703)-373-5100 Page 13
©2002 by Riptech, Inc. All Rights Reserved
� Attack Intensity An analysis of overall attack activity over the past six months indicates that the intensity of cyber attacks is severe and increasing steadily. The average Riptech client suffered approximately 25 attacks per week over the six-month period. Figure 8 shows total attack activity by week over the past six months. Based on Figure 8, several observations are worthy of note. � Steady Rise in Attack Intensity—The intensity of attacks against the sample set
rose nearly 79% in the past six months. This rise began in the third week of September, peaked during the middle of November, and has shown a slight decline since the first week in December. While this rise in intensity may be magnified to some extent by the fact that Riptech is constantly adding new attack signatures to its database, overall, there is little doubt that the rate of attacks increased measurably over the past six months.
� Impact of September 11th Terrorist Attacks—Excluding Nimda, there was no
noticeable impact on attack activity during the week following September 11th. However, attack intensity rose precipitously within two weeks of the terrorist attacks. It is not clear whether there is a causal relationship, but the change in attack rates soon after September 11th is substantial.
� Code Red and Nimda Effect—While activity associated with these two worms is
not included in Figure 8, these events were responsible for approximately 63% of the overall malicious activity detected by Riptech over the past six months. As such, these two worms presented two of the most significant challenges to the Internet community during this time period.
0
5
10
15
20
25
30
35
40
45
8-Ju
l15
-Jul
22-Ju
l29
-Jul
5-Au
g12
-Aug
19-A
ug26
-Aug
2-Se
p9-
Sep
16-S
ep23
-Sep
30-S
ep7-
Oct
14-O
ct21
-Oct
28-O
ct4-
Nov
11-N
ov18
-Nov
25-N
ov2-
Dec
9-De
c16
-Dec
23-D
ec30
-Dec
Week
Ave
rage
Atta
cks P
er C
ompa
ny
FIGURE 8—ATTACKS PER COMPANY PER WEEK
Note: Date labels indicate the last day of the week for each data point. It is important to note that in order to provide a full week worth of data, attacks detected on December 31, 2001 were excluded from this analysis.

Riptech, Inc. 2800 Eisenhower Avenue Alexandria, VA 22314 (703)-373-5100 Page 14
©2002 by Riptech, Inc. All Rights Reserved
� Attack Scope and Severity The scope of attack activity over the past six months was extremely broad. In fact, 100% of the sample experienced some form of attack activity. This discovery strongly indicates that the extent of the threat on the Internet may be even greater than indicated by several recent reports. In fact, our findings strongly suggest that once companies connect their systems to the Internet, they are virtually guaranteed to suffer some form of attack activity. Figure 9 illustrates this point by highlighting the percentage of companies that suffered at least one attack in different severity levels. Despite the high percentage of clients that suffered attacks over the past six months, it is important to note that, on a percentage basis, the vast majority of attacks were relatively benign in nature. In fact, approximately 99% of the attacks detected against Riptech’s clients were informational in nature and presented no immediate threat. That said, critical and emergency-level events have been detected on the networks of 43% of Riptech’s clients, indicating that, without real-time intervention, actual security breaches were imminent at some point in the past six months for nearly half of Riptech’s clients.4
4 Clients that suffered emergency events are not necessarily a subset of clients that suffered critical events; therefore, the number of clients that suffered either a critical or emergency event is slightly higher than the number of clients that suffered a critical event only.
100.0%
93.0%
41.0%
12.7%
0%
20%
40%
60%
80%
100%
120%
Informational Warning Critical Emergency
Severity Level
Perc
ent o
f Com
pani
es
Suff
erin
g at
leas
t One
Eve
nt
FIGURE 9—PERCENTAGE OF COMPANIES SUFFERING ATTACKS BY SEVERITY
Note: Refer to Figure 5 for a full description of the type of activity associated with each severity level.

Riptech, Inc. 2800 Eisenhower Avenue Alexandria, VA 22314 (703)-373-5100 Page 15
©2002 by Riptech, Inc. All Rights Reserved
� Attack Source The breadth of attack activity against the sample set was equally diverse in terms of attack source. Over the past six months alone, Riptech detected attacks originating from 140 countries; however, it is important to add that 70% of these attacks originated from only 10 countries. The United States was the source of the largest number of attacks, which is most likely because the U.S. maintains the largest Internet user base (148 million according to 2001 CIA estimates), as well as the fact that many global ISPs register all IP space in the U.S.5 South Korea and China, also with large Internet user bases, were the second and third largest sources of attack. Figure 10 shows the top ten attacking countries against the sample set. Riptech also analyzed the relative intensity of attacks originating in different countries, as measured by the number of attacks generated by that country in relation to the number of Internet users. Figure 11 shows the top ten attacking countries as a function of attacks per 10,000 Internet users within the country.
5 Central Intelligence Agency. 2001 World Fact Book. http://www.cia.gov/cia/publications/factbook
2.0% 2.5% 2.5% 2.6%3.9% 4.5%
5.9%7.8%
8.8%
29.6%
0%
5%
10%
15%
20%
25%
30%
35%
Japa
n
Grea
t Brit
ain Italy
Taiw
an
Cana
da
Fran
ce
Germ
any
Chin
a
Sout
h Kor
ea
Unite
d Stat
esOrigin of Attack
Perc
enta
ge o
f Tot
al A
ttack
s
FIGURE 10—TOP TEN ATTACK SOURCES BY COUNTRY
Note: Figure 10 shows the percentage of attacks that came from the ten most frequent sources of attack. Overall, these 10 countries were the source of 70% of the attacks against the sample set.

Riptech, Inc. 2800 Eisenhower Avenue Alexandria, VA 22314 (703)-373-5100 Page 16
©2002 by Riptech, Inc. All Rights Reserved
Adjusting for the number of Internet users in each country revealed several interesting findings: � Despite showing only a modest overall number of attacks, the intensity of attacks
from Israel is nearly double the attack intensity rate of any other individual country. � Five of the top ten attacking countries are located in the Pacific Rim; these include
Hong Kong, South Korea, Thailand, Taiwan, and Malaysia. � South Korea, France, and Taiwan rated high on BOTH the total attack and attack
intensity scale. � Despite the overwhelming number of attacks originating from the United States, the
U.S. has a relatively low rate of attack intensity (averaging only 3.5 attacks per 10,000 Internet users).
Possible contributing factors to these differences among country attack rates include: varying legislation around computer crime; varying levels of security awareness leaving countries more vulnerable to being used as a launching point for attacks; presence of state-sponsored cyber espionage; and other social, political, and cultural issues.
7.07 7.10 7.52 7.74 7.85 8.6010.03
11.57
14.50
26.16
0
5
10
15
20
25
30De
nmar
k
Taiw
an
Polan
d
Mala
ysia
Turk
ey
Fran
ceSo
uth K
orea
Thail
and
Hong
Kon
g
Israe
l
Origin of Attacks
Atta
cks p
er 1
0,00
0 In
tern
et U
sers
FIGURE 11—TOP TEN ATTACK SOURCES PER INTERNET CAPITA
Note: Figure 11 shows the top ten attack sources in terms of the number of attacks per 10,000 Internet users in the country. In order to ensure that this measure is statistically significant, this metric was only applied to countries with more than 1,000,000 Internet users. The number of Internet users in each country was derived from the CIA’s 2001 World Fact Book.

Riptech, Inc. 2800 Eisenhower Avenue Alexandria, VA 22314 (703)-373-5100 Page 17
©2002 by Riptech, Inc. All Rights Reserved
COMMON ATTACK ACTIVITY � Overview The diversity of attacks detected over the past six months against the sample is significant. In fact, Riptech detected the use of several thousand different types of attack activity. Despite this diversity, it is important to note that approximately 63% of all malicious activity detected over the past six months was related to the outbreak of the Code Red and Nimda worms. Overall, Microsoft's Internet Information Services IIS vulnerabilities, which only affect Windows-based systems, were the target of the majority of attacks. While there are several other high impact vulnerabilities that affect Windows systems, many of these were successfully mitigated by the use of firewalls. � Top Ten Attacks When analyzing the most common ten attacks detected against the sample, a majority of the attacks targeted either public services (e.g., Web) or remote access services (e.g., FTP, SSH). Riptech expects that this trend will continue in the future, mainly due to the fact that firewalls, which most companies have in place at their Internet gateways, offer adequate protection against many other common vulnerabilities. As such, in many cases, public and remote access services are the only services that are accessible (and thus exploitable) from the Internet. Figure 12 lists the top ten attacks that Riptech detected over the past six months. It is important to note that these observations include activity associated with Code Red and Nimda.
FIGURE 12—TOP TEN ATTACKS
Activity Type
Percentage of Attacks Containing
Activity∗∗∗∗
Description
Microsoft Index Services ISAPI Overflow Attack
47.8%
Microsoft's Internet Information Services (IIS) server contains an idq.dll file, which attackers can access via the web. The idq.dll is a dynamic link library (DLL) that supports Microsoft's Index Server. This DLL is installed by default with IIS and is exposed to compromise on servers that run IIS (regardless of whether or not the index server is actually enabled). A buffer overflow vulnerability in the idq.dll in IIS 4.0/5.0 allows a remote attacker to execute commands on the server with system-level permissions. This vulnerability was originally published in June 2001 and was widely exploited by Code Red. The high frequency of this exploit is attributable mainly to activity associated with the Code Red Worm.
Generic "root.exe" Request Attack
25.1%
When attacking a Windows system, an intruder often renames 'cmd.exe' to 'root.exe' and moves the file to a more accessible directory on the web server. This allows the intruder to execute commands on the web server even if it is subsequently patched for the published IIS vulnerabilities. Code Red II left a copy of root.exe in the /scripts directory, which was later exploited by the Nimda worm (and variants). Therefore, the high frequency of this exploit is attributable mainly to activity associated with the Nimda worm.
Microsoft IIS Directory Traversal (Unicode) Attack
23.5%
Microsoft's IIS 4.0/5.0 and Windows 98 hosts running Microsoft Personal Web Server are vulnerable to this directory traversal vulnerability if extended UNICODE character representations are used in substitution for '/' and '\,' e.g. http://target/scripts/.%c1%1c../ path/file.ext. This vulnerability was published by Microsoft in October 2000 and, since then, continues to be one of the most widely exploited IIS vulnerabilities. This was one of the exploits used by Nimda. Although this exploit is frequent regardless of worm activity, the particularly high frequency of this exploit over the past six months is mostly attributable to the spread of the Nimda worm.

Riptech, Inc. 2800 Eisenhower Avenue Alexandria, VA 22314 (703)-373-5100 Page 18
©2002 by Riptech, Inc. All Rights Reserved
FIGURE 12 (CONTINUED)
Name Percentage of Attacks∗∗∗∗ Description
Microsoft IIS Superfluous Decode Attack
17%
A vulnerability in Microsoft's IIS servers allows remote attackers to execute arbitrary commands on the system by simply encoding the URL twice. The second decode is the actual vulnerability as most web servers will decode the URL once correctly. This vulnerability was published in May 2001, and has been widely exploited since. While Nimda certainly increased the frequency of this attack, it is likely that many of these attacks were not associated with the worm.
Generic "cmd.exe" Request Attack
16.5%
While not considered a vulnerability in and of itself, many different IIS web attacks access cmd.exe if the exploit is successful. Many attackers then either use cmd.exe directly to execute commands on the remote web servers such as "copy", "dir", "tftp", etc., or make a copy of the file and rename it root.exe for future access (example: Code Red II). Because cmd.exe requests are a common secondary sign of attack, this type of activity was observed frequently against the sample set.
Scan for 27374/tcp (SubSeven)
5%
Probes against port 27374/tcp, which are consistently one of the most common scans detected against the sample, increased 170% over the past 6 months. In the past, hackers have used Port 27374 for a variety of backdoor and trojan horse programs. The most common of these is known as “SubSeven.” SubSeven is a trojan horse program that runs on Windows systems and allows an attacker to remotely control the system. There was even a worm, W32/Leaves in July that targeted the SubSeven Trojan in order to obtain access to systems. While the sample was a target of many of these scans, very few were followed up with attempted exploits. This is probably due to the fact that the primary targets of these scans are home systems that are not protected by firewalls and/or Antivirus software.
Scan for vulnerable and/or misconfigured FTP servers
3.8%
Throughout the past 6 months, probes for FTP services were consistently high. In many cases, attackers are probing for either vulnerable versions of FTP servers or misconfigured FTP servers with a writeable directory. When attackers identify a writeable directory, they can then use the server to distribute illegal material, such as pornography, pirated mp3s, and pirated software.
Scans for systems with RPC (tcp) enabled
2.8%
Scans for RPC services, while also very high, actually decreased by 29% over the past 6 months. RPC is used primarily by a variety of UNIX system services, each of which are vulnerable to a number of exploits. Services exploited via RPC include CDE Tooltalk, snmpXdmid, and rpc.statd. Almost all of the attacks observed against the sample set were dropped by the perimeter firewall, so Riptech was unable to identify the specific vulnerabilities that were targeted. RPC vulnerabilities remain very popular due to the large number of potentially vulnerable UNIX systems on the Internet.
Scans for SSH service 1.3%
SSH is used as a secure alternative to Telnet. Due to the strong encryption capabilities of this service, as well as a variety of strong authentication options, SSH provides remote users with a secure mechanism to access systems remotely. Unfortunately, many older distributions/versions of SSH are plagued with several vulnerabilities. As a result, SSH scans not only rank in the top 5 services scanned for, but also increased by 341% over the past six months. Many sites utilize SSH to remotely access and manage critical servers, so the recent vulnerabilities provide attackers with the capability to compromise high profile systems,. The attractiveness of these targets is probably related to the high level of interest in this service.
Scans for LPD service 1.2% LPD probes decreased by 29% over the past 6 months. LPD or Line Printer Daemon provides printing service for a variety of operating systems, but primarily UNIX systems. Most implementations of LPD are exposed to a variety of these vulnerabilities, several of which allow a remote attacker to gain system access.
∗ This figure represents the total number of attacks that included the specified type of activity. It is important to note that the sum of these percentages is greater than 100% because many attacks include several of these activities.

Riptech, Inc. 2800 Eisenhower Avenue Alexandria, VA 22314 (703)-373-5100 Page 19
©2002 by Riptech, Inc. All Rights Reserved
THREAT VARIANCE BY TYPE OF COMPANY � Attacks by Industry Despite the steady increase in overall attacks against organizations in the sample set, the nature and severity of the cyber threat appears to differ significantly by industry segment. Most notable is the observation that high tech, power and energy, and financial services companies appear to suffer the greatest level of attack intensity and severity. Figure 13 and Figure 14 illustrate these trends.
0.16 0.331.06 1.19 1.42 1.45
2.052.62
6.62
9.23
12.50
0.00
2.00
4.00
6.00
8.00
10.00
12.00
14.00
ASP
E-Com
merce
Nonpro
fit
Media/
Enterta
inmen
tOthe
r
Healthc
are
Manufac
turing
Busines
s Serv
ices
High Tech
Financ
ial Serv
ices
Power
& Energy
Industry
Seve
re A
ttac
ks P
er C
ompa
ny
FIGURE 14—SEVERE ATTACKS PER COMPANY BY INDUSTRY
Figure 14 shows the average number of severe attacks over the past six months for different industries. Severe attacks include those that are categorized as either emergency or critical.
422 439477
520561 592 600
706 725
895961
0
200
400
600
800
1,000
1,200
Other
Healthc
are
E-Com
merce
ASP
Manufa
cturin
g
Nonpro
fit
Busine
ss Serv
ices
Media/
Enterta
inmen
t
Power
& Energy
Financ
ial Serv
ices
High Tech
Industry
Att
acks
Per
Com
pany
FIGURE 13—ATTACKS PER COMPANY BY INDUSTRY
Figure 13 indicates the average number of attacks per company in each industry over the past six months.
Riptech, Inc. 2800 Eisenhower Avenue Alexandria, VA 22314 (703)-373-5100 Page 20
©2002 by Riptech, Inc. All Rights Reserved
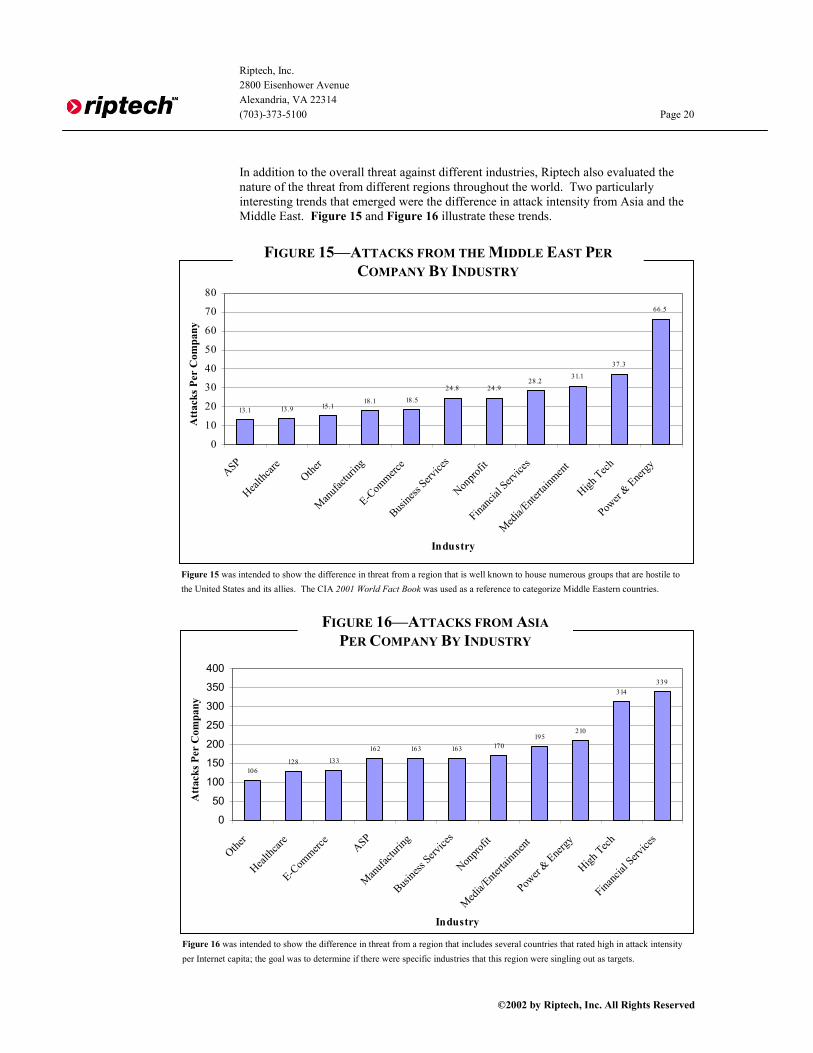
In addition to the overall threat against different industries, Riptech also evaluated the nature of the threat from different regions throughout the world. Two particularly interesting trends that emerged were the difference in attack intensity from Asia and the Middle East. Figure 15 and Figure 16 illustrate these trends.
13.1 13.9 15.118.1 18.5
24.8 24.928.2
31.1
37.3
66.5
0
10
20
30
40
50
60
70
80
ASP
Healthc
areOthe
r
Manufac
turing
E-Com
merce
Busine
ss Serv
ices
Nonpro
fit
Financ
ial Serv
ices
Media/
Enterta
inmen
t
High Tech
Power
& Energy
Industry
Att
acks
Per
Com
pany
FIGURE 15—ATTACKS FROM THE MIDDLE EAST PER COMPANY BY INDUSTRY
Figure 15 was intended to show the difference in threat from a region that is well known to house numerous groups that are hostile to the United States and its allies. The CIA 2001 World Fact Book was used as a reference to categorize Middle Eastern countries.
106128 133
162 163 163 170195
210
314339
0
50
100
150
200
250
300
350
400
Other
Healthc
are
E-Com
merce
ASP
Manufac
turing
Busine
ss Serv
ices
Nonpro
fit
Media/
Enterta
inmen
t
Power
& Energy
High Tech
Financ
ial Serv
ices
Industry
Att
acks
Per
Com
pany
FIGURE 16—ATTACKS FROM ASIA PER COMPANY BY INDUSTRY
Figure 16 was intended to show the difference in threat from a region that includes several countries that rated high in attack intensity per Internet capita; the goal was to determine if there were specific industries that this region were singling out as targets.
Riptech, Inc. 2800 Eisenhower Avenue Alexandria, VA 22314 (703)-373-5100 Page 21
©2002 by Riptech, Inc. All Rights Reserved
The previous figures clearly demonstrate that the cyber security threat is particularly intense in three or four key industries. These findings provide an opportunity for organizations to assess their security postures with respect to the relative threat rates present in each industry. Major observations include: � The four most frequently targeted industries are High Tech, Financial Services,
Media/Entertainment, and Power and Energy. � Power and Energy companies suffer a significantly higher rate of severe attacks than
other industries. The rate of severe attacks per company for the Power and Energy industry is more than twice the mean of the entire sample set.
� Power and Energy companies suffered a substantially higher rate of attacks per
company from the Middle East. The rate of attack for Power and Energy companies is more than twice the average rate for the entire sample set.
� High Tech and Financial Services companies suffer a higher rater of attacks from
Asia. The rate of attacks for companies in these industries is 55-70% higher than the mean rate of the entire sample set.
� E-Commerce companies show low rates of attack intensity and severity. Despite the
fact that these companies receive prominent attention when security breaches occur, the threat exposure for this industry appears to be substantially below the average.
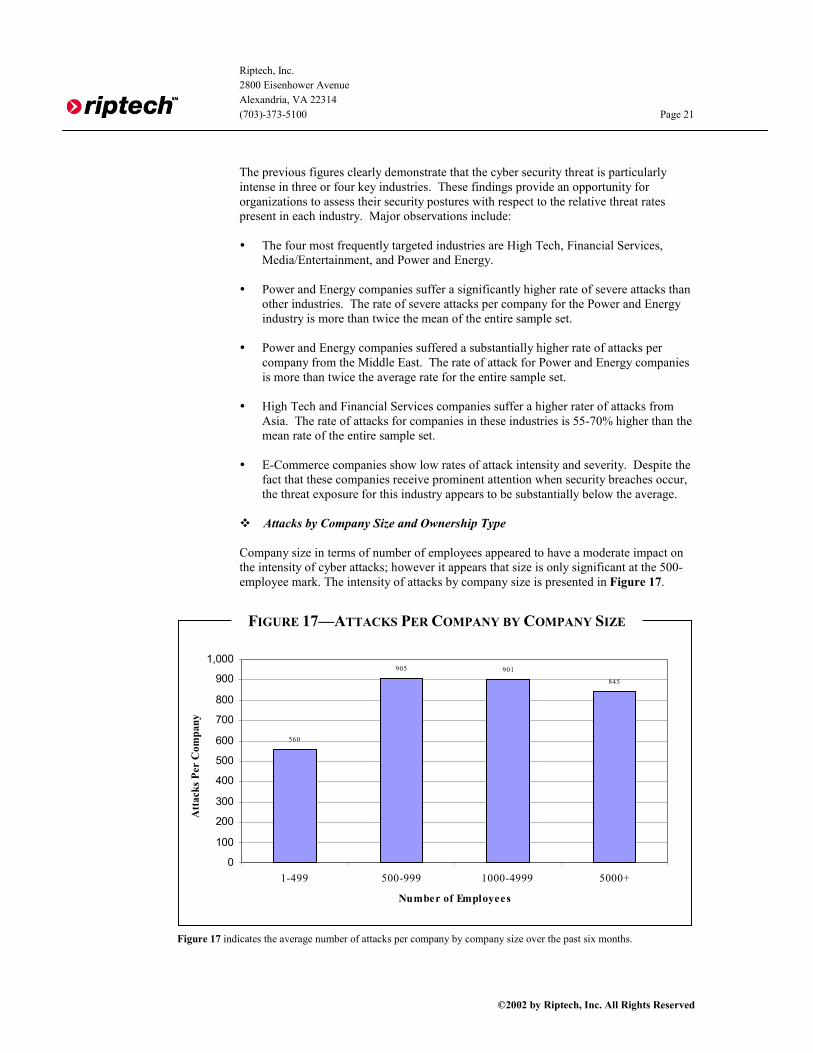
� Attacks by Company Size and Ownership Type Company size in terms of number of employees appeared to have a moderate impact on the intensity of cyber attacks; however it appears that size is only significant at the 500-employee mark. The intensity of attacks by company size is presented in Figure 17.
560
905 901
845
0
100
200
300
400
500
600
700
800
900
1,000
1-499 500-999 1000-4999 5000+
Number of Employees
Att
acks
Per
Com
pany
FIGURE 17—ATTACKS PER COMPANY BY COMPANY SIZE
Figure 17 indicates the average number of attacks per company by company size over the past six months.
Riptech, Inc. 2800 Eisenhower Avenue Alexandria, VA 22314 (703)-373-5100 Page 22
©2002 by Riptech, Inc. All Rights Reserved
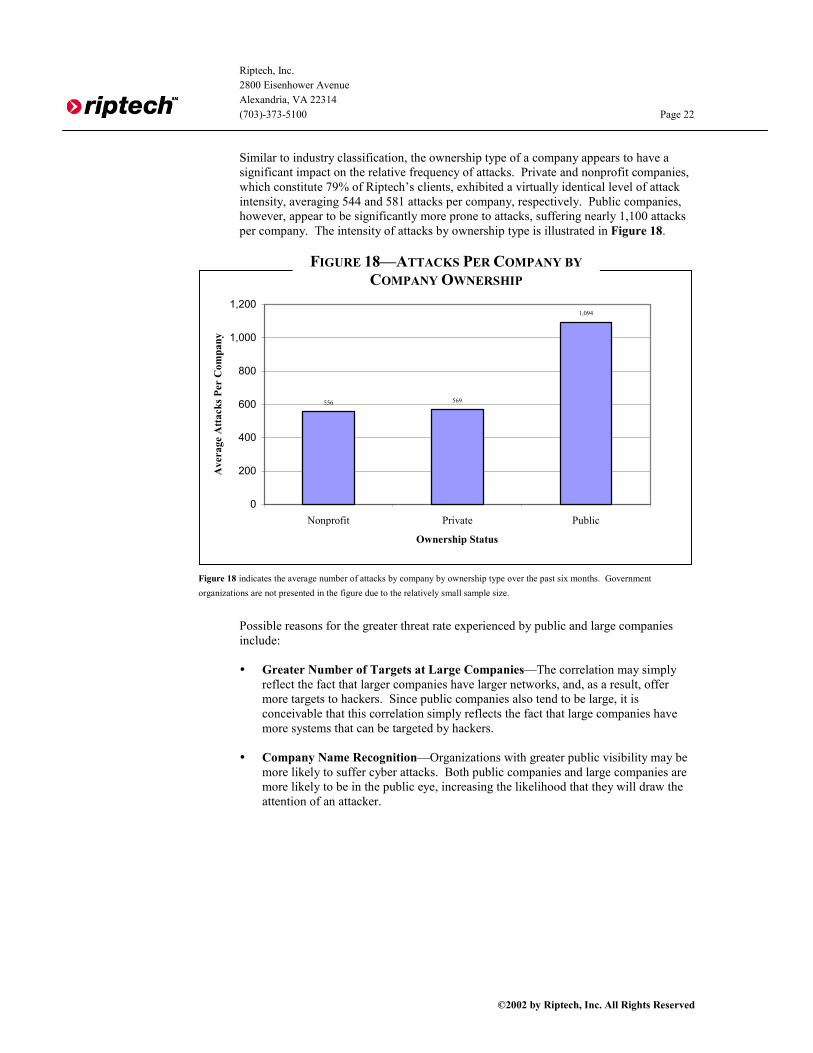
Similar to industry classification, the ownership type of a company appears to have a significant impact on the relative frequency of attacks. Private and nonprofit companies, which constitute 79% of Riptech’s clients, exhibited a virtually identical level of attack intensity, averaging 544 and 581 attacks per company, respectively. Public companies, however, appear to be significantly more prone to attacks, suffering nearly 1,100 attacks per company. The intensity of attacks by ownership type is illustrated in Figure 18.
Possible reasons for the greater threat rate experienced by public and large companies include: � Greater Number of Targets at Large Companies—The correlation may simply
reflect the fact that larger companies have larger networks, and, as a result, offer more targets to hackers. Since public companies also tend to be large, it is conceivable that this correlation simply reflects the fact that large companies have more systems that can be targeted by hackers.
� Company Name Recognition—Organizations with greater public visibility may be
more likely to suffer cyber attacks. Both public companies and large companies are more likely to be in the public eye, increasing the likelihood that they will draw the attention of an attacker.
556 569
1,094
0
200
400
600
800
1,000
1,200
Nonprofit Private Public
Ownership Status
Ave
rage
Atta
cks P
er C
ompa
ny
FIGURE 18—ATTACKS PER COMPANY BY COMPANY OWNERSHIP
Figure 18 indicates the average number of attacks by company by ownership type over the past six months. Government organizations are not presented in the figure due to the relatively small sample size.

Riptech, Inc. 2800 Eisenhower Avenue Alexandria, VA 22314 (703)-373-5100 Page 23
©2002 by Riptech, Inc. All Rights Reserved
CONCLUSIONS The findings presented in Riptech’s Internet Security Threat Report reveal that the external threat is diverse, growing, and significant. The findings also suggest that the external threat is perhaps even more severe than is indicated by several recent studies on Internet security. More than 40% of the sample experienced an attack that required immediate intervention to prevent a security breach. Furthermore, the fact that the Internet security threat rate appears to be substantially higher for the financial services, high tech, and power and energy industries provides an opportunity for IT and risk management executives in these industries to review their security postures in light of these findings. And above all, this report should clearly illustrate that the Internet security threat is real, pervasive, and perhaps more severe than previously anticipated. Stakeholders of Internet-connected organizations should ensure that appropriate measures have been taken to address this increasing threat rate.
Riptech, Inc., the premier provider of scalable, real-time managed security services, protects clients through advanced outsourced security monitoring and professional services. Riptech's unique CaltarianSM technology platform provides Real-Time Information ProtectionSM through around-the-clock monitoring, analysis, and response. The Caltarian technology is capable of processing large volumes of network security data to separate security threats from false positives in real-time, with carrier-class scalability. Additionally, Riptech's Security Professional Services group provides security policy development, assessment and auditing, penetration testing, incident forensics, and response. Riptech security specialists have secured hundreds of organizations including Fortune 500 companies and federal agencies. Founded in 1998 by former Department of Defense security professionals and market experts, Riptech is headquartered in Alexandria, Virginia with offices in San Jose, California, and New York City.
ABOUT RIPTECH

Riptech, Inc. 2800 Eisenhower Avenue Alexandria, VA 22314 (703)-373-5100 Page A-1
©2002 by Riptech, Inc. All Rights Reserved
APPENDIX A—VALUE OF ANALYZED ATTACK DATA � Overview In order to understand why the Riptech Internet Security Threat Report offers a uniquely accurate view of attack trends, it is important to compare Riptech’s methodology to those used by other organizations that report on attack trends. The three types of methodologies that are generally used to determine Internet-based attack trends are listed below in Figure A-1.
FIGURE A-1—ATTACK TRENDING METHODOLOGIES
Methodology Description
Methodology #1—Analysis of Survey Data
Several attack reports draw from periodic surveys that solicit feedback regarding security incidents that companies detected over a specified period of time. While these types of surveys are excellent sources for more subjective types of information, such as the financial impact of security breaches, surveys only provide a rudimentary view of attack trends by criteria such as intensity, severity, and origin. Analogy: This type of analysis would be similar to a crime survey that polled households to estimate the number and cost of specific crimes that occurred over the past year.
Methodology #2—Automated Analysis of Raw Security Device Data
Companies that subscribe to this methodology rely entirely on the automated or statistical analysis of firewall and IDS data that are submitted voluntarily by organizations throughout the world. Companies that use this methodology conduct a high-level analysis of these data to detect trends in network usage and attack patterns. Because this approach does not involve the validation of each attack by security experts, it is probable that false positive signs of attack activity significantly affect the accuracy of the results. Analogy: This type of analysis would be similar to a crime report that was based on every security alarm that was set off at companies throughout the world (regardless of whether the alarm was actually triggered by malicious activity).
Methodology #3—Examination of Validated Cyber Attacks
Riptech’s methodology determines attack trends by reconstructing entire attack sequences and then ensuring validation of each attack by security experts. Prior to validation, security experts initially detect these attacks by using powerful software tools that isolate attack sequences from billions of firewall logs and IDS alerts. For a full description of Riptech’s Methodology, see page 7 of the report. Analogy: This type of analysis would be similar to a crime report that was based on the historical analysis of every successful or attempted crime that was detected, investigated, and validated by a security company over the past year. Alarms that turned out to be false positives would be eliminated from consideration.

Riptech, Inc. 2800 Eisenhower Avenue Alexandria, VA 22314 (703)-373-5100 Page A-2
©2002 by Riptech, Inc. All Rights Reserved
� Analysis of Unanalyzed Versus Validated Attacks The analysis of raw security data and the analysis of validated attacks are the only two methodologies that are based entirely on empirical data. While the analysis of survey data is valuable in some situations (particularly when attempting to assess the financial impact of security breaches), it is based entirely on human perception rather than actual empirical evidence of attacks. This being the case, survey results may provide a false impression of the true state of cyber attack trends. For example, due to the fact that many organizations choose not to report security breaches, surveys may substantially underestimate the true threat of cyber attacks. In contrast, the analysis of raw security data and the analysis of validated attacks are based entirely on empirical data. However, although these two approaches are similar in several ways, there are also significant differences. In sum, the two major advantages of Riptech’s methodology, which is based entirely on the analysis of validated cyber attacks, are as follows: � Use of Powerful Attack Reconstruction Tools—In order to identify attacks among
billions of lines of log data, Riptech uses powerful software tools to detect and isolate entire attack sequences. This process ensures that the attack identification process is comprehensive (i.e., all attacks evident in the log data are identified) and mutually exclusive (i.e., all signs of malicious activity associated with a single attack are only counted once during the trend analysis process).
� Validation of Attacks by Security Experts—Real-time investigations of attack
sequences by security experts eliminate false positive signs of attacks from the data set. This process ensures that actual, validated attacks are the only data source. False positive signs of attack activity, which can produce misleading observations about the volume and nature of cyber attacks, are eliminated from the data set.
The automated analysis of raw log data, while still based on empirical data, suffers from several flaws, each of which has the potential to distort attack trends. The two most significant flaws of this approach are listed below.
� Precision of Attack Identification—This type of analysis does not examine entire
attack sequences, which often include a number of individual signs of malicious activity. Therefore, a single attack may be treated for analysis purposes as several different attacks. For example, a sequence of seven different forms of attack activity from a single source IP may be treated as seven distinct attacks rather than a single event. Because of this flaw, observations may overestimate the overall intensity of attack activity, as well as distort the apparent nature of cyber attacks (e.g., relative frequency of different types of exploits).
� Influence of False Signs of Attacks—This type of analysis does not filter out false
signs of malicious activity. As a result, attack intensity is significantly overestimated. Figure A-2 illustrates this point by showing Riptech’s calculation of total attack activity (i.e., individual signs of potential malicious activity) detected over the six-month period versus total validated attacks. As the figure illustrates the average rate of attack activity based solely on the analysis of potential malicious activity is approximately 20 times the average rate of attacks based on validated data.

Riptech, Inc. 2800 Eisenhower Avenue Alexandria, VA 22314 (703)-373-5100 Page A-3
©2002 by Riptech, Inc. All Rights Reserved
� Conclusions Organizations use three basic methodologies to summarize cyber attack trends. For a variety of reasons, the analysis of validated attacks provides a more precise and comprehensive picture of attack activity over time. Survey results, while valuable in several ways, tend to under-report attack intensity and fail to capture trends based on empirical data. The analysis of raw security data, while based on empirical evidence, suffers from a significant distortion of results due to a failure to isolate entire attack sequences and eliminate false positive signs of attack activity. In sum, Riptech’s Internet Security Threat Report, which is the only report based on validated, empirical attack data, represents a uniquely accurate study of Internet-based attack activity.
Total signs of potential attack activity per company Total validated attacks per company
Week
0200400600800
1,0001,2001,4001,6001,8002,000
7/8/20
01
7/22/2
001
8/5/20
01
8/19/2
001
9/2/20
01
9/16/2
001
9/30/2
001
10/14
/2001
10/28
/2001
11/11
/2001
11/25
/2001
12/9/
2001
12/23
/2001
05
1015202530354045
7/8/20
01
7/22/2
001
8/5/20
01
8/19/2
001
9/2/20
01
9/16/2
001
9/30/2
001
10/14
/2001
10/28
/2001
11/11
/2001
11/25
/2001
12/9/
2001
12/23
/2001
Atta
cks P
er C
ompa
ny
FIGURE A-2—UNANALYZED ATTACK ACTIVITY VERSUS VALIDATED ATTACKS

Riptech, Inc. 2800 Eisenhower Avenue Alexandria, VA 22314 (703)-373-5100 Page B-1
©2002 by Riptech, Inc. All Rights Reserved
APPENDIX B—ANALYSIS OF CODE RED AND NIMDA � Background
A comprehensive analysis of Internet attack trends for Q3 and Q4 of 2001 clearly must address the Code Red and Nimda worms. However, because of their widespread impact, it is important to note that many information security professionals have already conducted a substantial amount of research regarding these worms. As such, this section is only intended to provide a high-level synopsis of these events, rather than a detailed technical analysis. In sum, the widespread outbreak of the Code Red and Nimda worms arguably established 2001 as ‘The Year of the Worm.’6 While Code Red, Code Red II, and Nimda were not the only worms launched during this time period, these worms were by far the most severe. Due to the high profile nature of these events, each is discussed in greater detail throughout the remainder of this appendix. In addition, a timeline of major worm-related activity and basic description of each worm is presented in Figure B-1 and Figure B-2.
FIGURE B-1–TIMELINE OF SIGNIFICANT WORM ACTIVITY
Date Activity July 13, 2001 First version of Code Red is reported
July 19, 2001 Code Red (CRv2) rapidly spreads across the Internet
July 20, 2001 Code Red (CRv2) unsuccessfully launches a DDoS attack against www.whitehouse.gov
Aug. 1, 2001 Code Red (CRv2) is reactivated and spreads rapidly across the Internet again.
Aug. 4, 2001 Code Red II (CRII) outbreak begins
Sept. 18, 2001 Nimda outbreak begins
6 As was previously explained in the introduction, Riptech made a conscious decision to separate Code Red and Nimda related activity from the majority of the trend analysis due to the fact that all other observations of attack activity would otherwise be overshadowed due to the sheer magnitude of these three events.

Riptech, Inc. 2800 Eisenhower Avenue Alexandria, VA 22314 (703)-373-5100 Page B-2
©2002 by Riptech, Inc. All Rights Reserved
FIGURE B-2–WORM DETAILS Worm Target Vulnerabilities Impact
Code Red � Microsoft IIS Index Service ISAPI Overflow
� Vandalized English web pages � Unsuccessfully launched DDoS attack on the 20th-27th of
every month � Had potential to overload and crash systems as a result of
scans for new victims
Code Red II � Microsoft IIS Index Service ISAPI Overflow
� Created two backdoors on infected systems by renaming ‘cmd.exe’ to ‘root.exe’ and then placing the renamed file in a directory that is accessible via the web server, as well as placing a Trojan horse named ‘explorer.exe’ on systems so the C: and D: drives are shared out
� Had potential to overload and crash systems as a result of scans for new victims
Nimda
� Backdoor left by Code Red II and sadmind/IIS worms∗
� Microsoft IIS Directory Traversal vulnerabilities (UNICODE)
� Automatic execution of embedded MIME types (used to facilitate propagation via e-mail and files on network shares)
� Had potential to overload and crash systems as a result of scans for new victims
� Shares the c: drive as C$ � Creates a Guest account and adds the account to the
Administrator group
∗ sadmind/IIS worm spread across the Internet compromising Solaris systems and vandalizing Microsoft IIS servers in May 2001. � Code Red Information security professionals first reported the existence of the Code Red worm on Friday, July 13, 2001. However, early versions of Code Red suffered from a flaw that severely hampered its propagation potential. As a result, the scope of the outbreak was limited to a small portion of the Internet. Riptech first observed an early version of Code Red on July 14, and due to the limited outbreak, Riptech only logged a few additional reports of activity until July 19. Primary Attack Activity On the morning of July 19, a new version of the Code Red worm, which some referred to as Code-Redv27 first appeared on the Internet in mass. This particular version had resolved the propagation flaw and thus began to infect hosts at an exponential rate. Within 14 hours of Code Red’s re-release, over 300,000 hosts were infected and actively attacking other hosts on the Internet. On July 20, 2001 (00:00 GMT), Code Red entered the final stage of the attack sequence. At this point, the propagation scans ceased and the compromised systems launched a distributed denial of service (DDoS) attack against www.whitehouse.gov. This attack was largely unsuccessful due to the successful execution of countermeasures by White House domain administrators and cooperating Internet service providers (ISPs).
7 CRv2 is an alternative name for the Code Red worm and should not be confused with the Code Red II worm.
Riptech, Inc. 2800 Eisenhower Avenue Alexandria, VA 22314 (703)-373-5100 Page B-3
©2002 by Riptech, Inc. All Rights Reserved
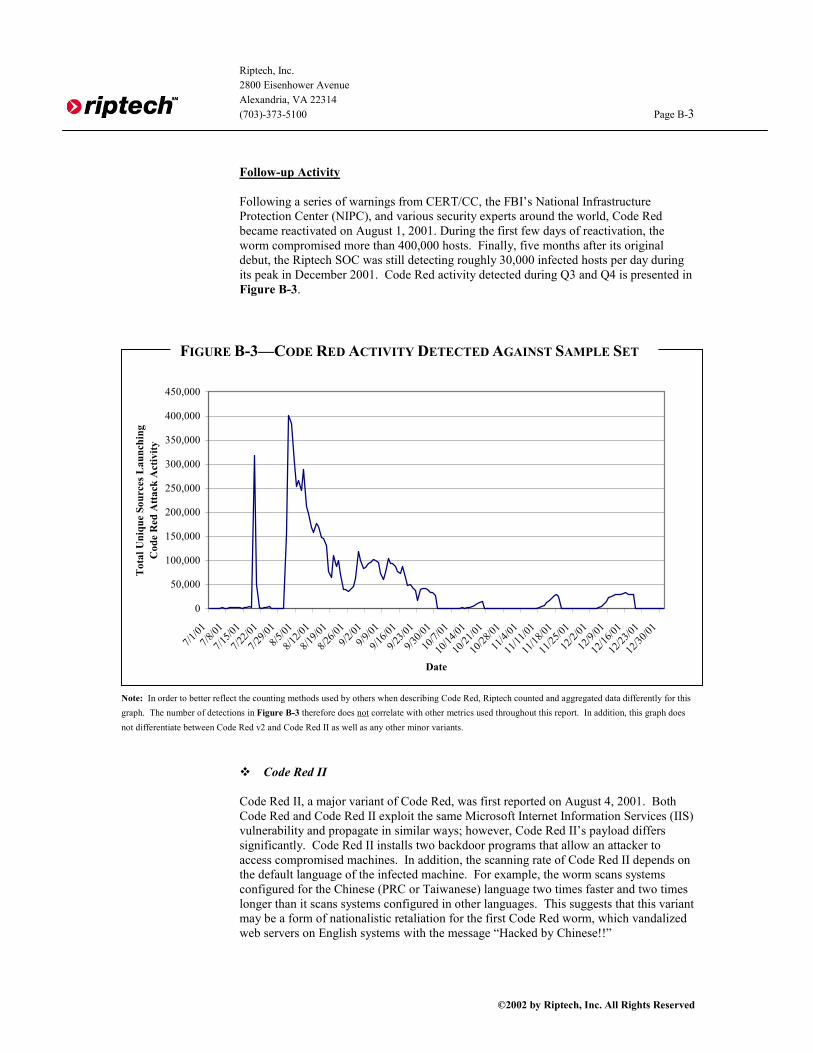
Follow-up Activity Following a series of warnings from CERT/CC, the FBI’s National Infrastructure Protection Center (NIPC), and various security experts around the world, Code Red became reactivated on August 1, 2001. During the first few days of reactivation, the worm compromised more than 400,000 hosts. Finally, five months after its original debut, the Riptech SOC was still detecting roughly 30,000 infected hosts per day during its peak in December 2001. Code Red activity detected during Q3 and Q4 is presented in Figure B-3.
� Code Red II
Code Red II, a major variant of Code Red, was first reported on August 4, 2001. Both Code Red and Code Red II exploit the same Microsoft Internet Information Services (IIS) vulnerability and propagate in similar ways; however, Code Red II’s payload differs significantly. Code Red II installs two backdoor programs that allow an attacker to access compromised machines. In addition, the scanning rate of Code Red II depends on the default language of the infected machine. For example, the worm scans systems configured for the Chinese (PRC or Taiwanese) language two times faster and two times longer than it scans systems configured in other languages. This suggests that this variant may be a form of nationalistic retaliation for the first Code Red worm, which vandalized web servers on English systems with the message “Hacked by Chinese!!”
0
50,000
100,000
150,000
200,000
250,000
300,000
350,000
400,000
450,000
7/1/01
7/8/01
7/15/0
1
7/22/0
1
7/29/0
18/5
/01
8/12/0
1
8/19/0
1
8/26/0
19/2
/019/9
/01
9/16/0
1
9/23/0
1
9/30/0
1
10/7/
01
10/14
/01
10/21
/01
10/28
/01
11/4/
01
11/11
/01
11/18
/01
11/25
/01
12/2/
01
12/9/
01
12/16
/01
12/23
/01
12/30
/01
Date
Tot
al U
niqu
e So
urce
s Lau
nchi
ng
Cod
e R
ed A
ttack
Act
ivity
FIGURE B-3—CODE RED ACTIVITY DETECTED AGAINST SAMPLE SET
Note: In order to better reflect the counting methods used by others when describing Code Red, Riptech counted and aggregated data differently for this graph. The number of detections in Figure B-3 therefore does not correlate with other metrics used throughout this report. In addition, this graph does not differentiate between Code Red v2 and Code Red II as well as any other minor variants.

Riptech, Inc. 2800 Eisenhower Avenue Alexandria, VA 22314 (703)-373-5100 Page B-4
©2002 by Riptech, Inc. All Rights Reserved
From a network perspective, the differences between Code Red and Code Red II are subtle, and it is not possible to differentiate between the two worms based solely on the analysis of firewall logs (a substantial source of data for this report). However, based on Riptech’s observations, a bulk of the exploits detected during Q4 follow the timing window of the first Code Red worm, suggesting that Code Red II activity is now significantly less common than Code Red. � Nimda Upon its September 18, 2001 release, the Nimda worm infected a large portion of the Internet with victims ranging from end users who accidentally visited infected websites to administrators who failed to eliminate the backdoors left by Code Red a month earlier. The widespread impact of Nimda was mostly attributable to the range of propagation methods, which allowed the worm to spread rapidly once it gained a foothold on a network. The Nimda worm has few similarities with Code Red and Code Red II. Nimda targeted different vulnerabilities, used different mechanisms to propagate and used different types of backdoors. Overall, Nimda’s most unique characteristic—one that will likely appear in future worms—was its wide variety of propagation capabilities, which included:
� Reading infected e-mail � Executing and/or browsing infected files on network shares � Visiting infected web sites � Scanning for IIS servers vulnerable to the Microsoft Directory Traversal
(UNICODE) vulnerability � Scanning for IIS servers in which Code Red II previously installed the backdoor
executable “root.exe.” Figure B-4 illustrates the impact of Nimda on the sample set during Q3 and Q4
Note: In order to better reflect the counting methods used by others when describing Nimda, Riptech counted and aggregated data differently for this
graph. The number of detections in Figure B-4 therefore does not correlate with other metrics used throughout this report.
0
50,000
100,000
150,000
200,000
250,000
300,000
350,000
7/1/20
01
7/8/20
01
7/15/2
001
7/22/2
001
7/29/2
001
8/5/20
01
8/12/2
001
8/19/2
001
8/26/2
001
9/2/20
01
9/9/20
01
9/16/2
001
9/23/2
001
9/30/2
001
10/7/
2001
10/14
/2001
10/21
/2001
10/28
/2001
11/4/
2001
11/11
/2001
11/18
/2001
11/25
/2001
12/2/
2001
12/9/
2001
12/16
/2001
12/23
/2001
12/30
/2001
Date
Tot
al U
niqu
e So
urce
s Lau
nchi
ng
Nim
da A
ttack
Act
ivity
FIGURE B-4—NIMDA ACTIVITY DETECTED AGAINST SAMPLE SET

Riptech, Inc. 2800 Eisenhower Avenue Alexandria, VA 22314 (703)-373-5100 Page B-5
©2002 by Riptech, Inc. All Rights Reserved
� Discussion As of the publication of this report, Code Red, Nimda, and variants of both worms are still active on the Internet on a daily basis. These and future worms are best viewed as a virtual plague that spreads as a result of insecure software and inattentive network administration practices. Historically, malicious code, which includes exploits, viruses, and worms, tend to evolve over time as new programmers use previous code as a foundation on which to base new forms of malicious code. Thus, companies throughout the world should not only expect future worms, but should also actively prepare for such events. With such a wide variety of vulnerabilities that currently remain unexploited, additional worms are certain to surface in the future. While it is difficult to predict the precise characteristics of future worms, several high-risk services, such as the following, will likely impact the form of these worms. High-Risk Services A public service/application that must be accessible to the Internet is much more likely to be targeted by future worms than other services. Therefore, any new vulnerabilities that affect these services may be the target of the next worm. Three probable targets of future worm activity include:
� Domain Name Service (DNS)—DNS translates host and domain names to IP
addresses and vice-versa. All networks not only must have DNS servers, but also must publish their exact locations (IP addresses) in order to function effectively. High-profile vulnerabilities have plagued DNS since its inception, and a few worms have even been written specifically to exploit these vulnerabilities. Given the widespread deployment of DNS servers, coupled with the presence of well-known vulnerabilities, there is a high probability that future worms will target this service. Unfortunately, if a worm successfully targets this service, not only could the worm propagate very rapidly, there is also a high probability that Internet availability would severely deteriorate due to the critical role that DNS plays in Internet communications.
� E-mail—Several past forms of malicious code, such as LoveLetter, Melissa, and
Nimda, propagated successfully via e-mail. E-mail is an effective method of transport mainly because it allows text and data to move from untrusted networks (such as the Internet) to trusted networks (such as a protected internal network) countless times each day with limited security checks. In order to counteract this type of activity many companies have deployed anti-virus filters to protect against known malicious code. But if these software programs are not updated immediately upon the discovery of new malware, they are rendered useless. In addition, as e-mail clients, such as Microsoft Outlook, become more feature-rich, the ability of attackers to create new, and possibly more destructive, worms increases.

Riptech, Inc. 2800 Eisenhower Avenue Alexandria, VA 22314 (703)-373-5100 Page B-6
©2002 by Riptech, Inc. All Rights Reserved
� Web Servers—By design, public web servers respond to requests from remote
systems on the Internet. Any flaw in processing these requests can result in the emergence of a high-risk vulnerability virtually overnight. Code Red is a perfect example of this. Firewalls are largely ineffective against this type of threat because most operate on a simple model of allow/deny. Therefore, if the firewall is configured to allow web connections to a web server, the firewall will also allow web attacks to the same server. Some content-filtering proxies and firewalls are designed to address this problem, but these systems negatively impact performance and are far from 100% effective. As illustrated by the simple fact that both Nimda and Code Red are still very much alive on the Internet after six months, these services remain a viable target of attack. Unfortunately, there are additional web server vulnerabilities that have been disclosed in the past year. These vulnerabilities, as well as others that may emerge in the future, are attractive targets for new worms.