Embed Size (px)
Citation preview
“A STUDY ON CUSTOMER SATISFACTION OF THE SERVICES PROVIDED BY ATHIYA ORGANIZATIONAL COMPETENCIES (P) LIMITED”
1 | P a g e DEPT OF BBM JAN-MAY 2014
INTRODUCTION
Markets:
A market consists of all potential customers sharing particular need or want who might be
willing and able to engage in exchange in exchange to satisfy that need or want.
Marketing:
The marketing concept holds that the key to achieving organizational goals consists in
determining the needs and wants of target market and delivering the desired satisfactions more
effectively than competitors.
Nature and scope of marketing:
Marketing is an ancient art and is everywhere. Formally or informally, people and
organizations engage it in a vast numbers of activities that could be called marketing. Good
marketing has become an increasingly vital ingredient for the success of business. Marketing
deals with identifying and meeting human and social needs or it can be defined as “meeting
needs profitably”.
The American Marketing Association has defined marketing as “an organizational function
and a set of processes for creating, communicating and delivering value to the customers and
for managing customer’s relations in ways that benefit the organization and the stake holders
“A STUDY ON CUSTOMER SATISFACTION OF THE SERVICES PROVIDED BY ATHIYA ORGANIZATIONAL COMPETENCIES (P) LIMITED”
2 | P a g e DEPT OF BBM JAN-MAY 2014
Marketing management:
Marketing management is the process of planning and executing the conception, pricing,
promotion, and distribution of ideas, goods and services to create exchanges that satisfy
individual and organizational objectives.
Core concepts of marketing:
Need, wants and demand.
Products.
Value, cost and satisfaction.
Exchange, transactions and relationships.
Markets.
Marketing and marketers.
The selling concept:
The selling concept holds that consumers, if left alone, will ordinarily not buy enough of the
organization’s products. The organization must therefore undertake an aggressive selling and
promotion effort.
7 P’s of marketing:
Product.
Price.
Place.
Promotion.
People.
Process.
Physical evidence.
“A STUDY ON CUSTOMER SATISFACTION OF THE SERVICES PROVIDED BY ATHIYA ORGANIZATIONAL COMPETENCIES (P) LIMITED”
3 | P a g e DEPT OF BBM JAN-MAY 2014
Customer satisfaction:
Customer satisfaction is a term used in marketing which is a measure of how products and
services supplied by a company meet or surpass customer expectation. Customer
satisfaction is defined as "the number of customers, or percentage of total customers, whose
reported experience with a firm, its products, or its services, through ratings exceeds
specified satisfaction goals. “In a competitive marketplace where businesses compete for
customers, customer satisfaction is seen as a key differentiator. In researching satisfaction,
firms generally ask customers whether their product or service has met or exceeded
expectations. Thus, expectations are a key factor behind satisfaction. When customers have
high expectations and the reality falls short, they will be disappointed and will likely rate
their experience as less than satisfying.
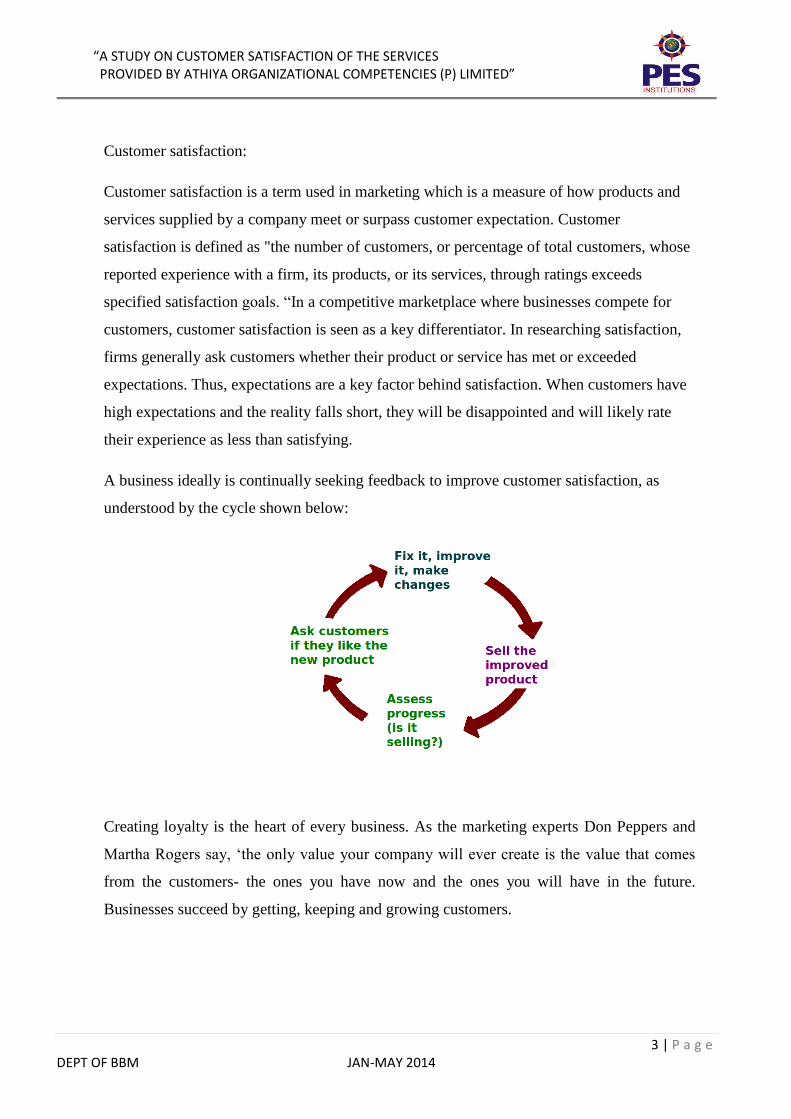
A business ideally is continually seeking feedback to improve customer satisfaction, as
understood by the cycle shown below:
Creating loyalty is the heart of every business. As the marketing experts Don Peppers and
Martha Rogers say, ‘the only value your company will ever create is the value that comes
from the customers- the ones you have now and the ones you will have in the future.
Businesses succeed by getting, keeping and growing customers.
“A STUDY ON CUSTOMER SATISFACTION OF THE SERVICES PROVIDED BY ATHIYA ORGANIZATIONAL COMPETENCIES (P) LIMITED”
4 | P a g e DEPT OF BBM JAN-MAY 2014
Customers are the reason you build factories, hire employees, schedule meetings, lay fore-
optic lines, or engage in any business activity.
Without customers, you don’t have a business.’
This is the reason keeping a customer satisfied is given utmost importance.
Customer satisfaction is related to any human activity that is directed towards satisfying
human wants through the exchange of goods and services.
Total customer satisfaction:
Whether the buyer is satisfied after the purchase depends on the offer’s performance in
relationship to the buyer’s expectations, and whether the buyer interprets any deviations
between the two. In general, ‘satisfaction’ is a person’s feelings or pleasure or disappointment
that result from comparing a product’s perceived performance (or outcome) to their
expectations. If the performance falls short of expectations, the customer is dissatisfied.
If the performance matches the expectations, the customer is satisfied. If the performance
exceeds expectations, the customer is highly satisfied or delighted. Customer assessments of
product performance depend on many factors, especially the type of loyalty relationship the
customer has with the brand. Customers often form more favourable perceptions of a product
with the brand they already feel positive about.
Although the customer- centred firm seeks to create high customer satisfaction that is not the
ultimate goal. If the company increases the customer satisfaction by lowering its price or
increasing its services, the result may be lower profits. The company might be able to increase
its profitability by means other than increased satisfaction (example, by improving
manufacturing process or investing more in R&D). Also, the company has many stakeholders,
including employees, dealers, suppliers, and stockholders. Spending more to increase
customer satisfaction might divert funds from increasing the satisfaction of other “partners”.
“A STUDY ON CUSTOMER SATISFACTION OF THE SERVICES PROVIDED BY ATHIYA ORGANIZATIONAL COMPETENCIES (P) LIMITED”
5 | P a g e DEPT OF BBM JAN-MAY 2014
Ultimately, the company must operate on the philosophy that is trying to deliver a high level
of customer satisfaction subject to delivering acceptable levels of satisfaction to the other
stakeholders, given its total resources.
How do buyers form their expectations? Expectations result from the past buying experience,
friends’ and associates’ advice, the marketers’ and competitors’ information and promises. If
marketers raise expectations too high, the buyer is likely to be disappointed. However, if the
company sets expectations too low, it won’t attract enough buyers (although it will satisfy
those who do buy). Some of today’s most successful companies are raising expectations and
delivering performances to match. A customer’s decision to be loyal or to defect is the sum
of many small encounters with the company.
Monitoring satisfaction:
Many companies are systematically measuring how well they treat their customers,
identifying the factors shaping satisfaction, and making changes in their operations and
marketing as a result. A company would be wise to measure customer satisfaction regularly,
because one key to customer retention is customer satisfaction. A highly satisfied customer
generally stays loyal longer, buys more as the company introduces new products and upgrades
existing products, talks favourably to others about the company and its products, pays less
attention to the competing brands and is less sensitive to price, offers product or service ideas
to the company, and costs less o serve than new customers because transactions can become
routine. Greater satisfaction has also been linked to higher returns and lower risk in the stock
market.
The link between customer satisfaction and customer loyalty, however, is not proportional.
Suppose customer satisfaction is rated on a scale from 1 to 5. At a very low level of customer
satisfaction (level 1), customers are likely to abandon the company and even bad-mouth it. At
levels 2 to 4, customers are fairly satisfied but still find it easy to switch when a better offer
comes along. At level 5, the customer is likely to purchase and even good word of mouth
about the company. High satisfaction or delight creates an emotional bond with the brand or
company, not just a rational preference.
“A STUDY ON CUSTOMER SATISFACTION OF THE SERVICES PROVIDED BY ATHIYA ORGANIZATIONAL COMPETENCIES (P) LIMITED”
6 | P a g e DEPT OF BBM JAN-MAY 2014
When customers rate their satisfaction with an element of the company’s performance- say,
delivery- the company needs to recognise that the customers vary in how they define good
performance. Good delivery could mean early delivery, on- time delivery, order completeness
and so on. The company must also realise that two customers can report being “highly
satisfied” for different reasons. One may be easily satisfied most of the time and the other
might be hard to please but was pleased on this occasion.
Measurement techniques:
A number of methods exist to measure customer satisfaction. Periodic surveys can track
customer satisfaction directly and also ask additional questions to measure repurchase
intention and the respondent’s likelihood or willingness to recommend the company and
brand to others.
Besides conducting periodic surveys, the company can monitor their customer loss rate and
contact customers who have stopped buying or who have switched to another supplier to find
out why. Finally, companies can hire mystery shoppers to pose as potential buyers and report
on strong and weak points experienced in buying the company’s and competitors’ products.
Managers themselves can enter company and competitors sales situations where they are
unknown and experience first-hand, the treatment they receive, or they can phone their own
company with questions and complaints to see how employees handle the calls.
In addition to tracking customer value expectations and satisfaction for their own firms,
companies need to monitor their competitors’ performance in these areas. Influence of
customer satisfaction: for customer-centred companies, customer satisfaction is both a goal
and a marketing tool. Companies need to be especially concerned with their customer
satisfaction level because the internet provided a tool for consumers to quickly spread bad
word of mouth- as well as good word of mouth- to the rest of the world. Some customers even
set up their own websites to air their grievances and dissatisfaction. Describing events and
actions as being wronged by the company, these websites often attempt to galvanise consumer
discontent and protest. Companies that do achieve high customer satisfaction ratings make
sure their target market knows it.
“A STUDY ON CUSTOMER SATISFACTION OF THE SERVICES PROVIDED BY ATHIYA ORGANIZATIONAL COMPETENCIES (P) LIMITED”
7 | P a g e DEPT OF BBM JAN-MAY 2014
Customer complaints:
Some companies think that they are getting a sense of customer satisfaction by tallying
complaints, but studies of customer dissatisfaction show that customers are dissatisfied with
their purchases about 25% of the time but that only about 5% complain. The other 95% wither
feel complaining is not worth the effort, or they do not know how or to whom to complain,
and they just stop buying.
Of the customers who register a complaint, about 54% and 70% will do business with the
organisation again if their complaint is resolved. The figure goes up to a staggering 95% if
the customer feels the complaint was resolved quickly. Customers have also complained to
an organisation and had their complaints satisfactorily resolved, tell an average of five people
about the good treatment they received. The average dissatisfied customer, however, grips to
11 people. If each of them tells still other people, the number of people exposed to bad word
of mouth may grow exponentially.
The fact is, no matter how perfectly designed and implemented a marketing program is,
mistakes will happen. The best thing a company can do is to make it easy for the customer to
complain. Suggestion forms, toll free numbers, websites, email addressed allow for
improvement ideas come from listening to customer complaints.
Given the potential downside of having an unhappy customer, it’s critical that the marketers
deal with the negative experience properly. Beyond that, the following procedures can help
to recover customer goodwill.
Set up a 7-day, 24-hour toll free hotline (by phone, fax or e-mail) to receive and act on
customer complaints.
Contact the complaining customer as quickly as possible. The slower the company is to
respond, the more dissatisfaction may grow and lead to negative word of mouth.
Accept responsibility for the customer’s disappointment; don’t blame the customer.
Use customer-service people who are empathic.
Resolve the complaint swiftly and to the customer’s satisfaction. Some complaining
customers are not looking for compensation so much as a sign that the company cares.
“A STUDY ON CUSTOMER SATISFACTION OF THE SERVICES PROVIDED BY ATHIYA ORGANIZATIONAL COMPETENCIES (P) LIMITED”
8 | P a g e DEPT OF BBM JAN-MAY 2014
Product and service quality:
Satisfaction will also depend on product and service quality. What exactly is quality? Various
experts have defined it as ‘fitness for use’, ‘conformance to requirements’, ‘freedom from
variation’, and so on. The American Society for Quality Control’s definition states: Quality
is the totality of features and characteristics of a product or service that bear on its ability to
satisfy stated or implied needs. This is clearly a customer-centred definition. We can say that
the seller has delivered quality whenever it product or service meets or exceeds the customer’s
expectations. A company that satisfies most of its customers’ needs most of the time is called
a quality company, but we need to distinguish between conformance quality and performance
quality (or grade).
Impact of quality:
Product and service quality, customer satisfaction, and company profitability are intimately
connected. Higher levels of quality result in higher levels of customer satisfaction, which
support higher prices and lower costs. Studies have shown a high correlation between relative
product quality and company profitability.
Quality is the key to value creation and customer satisfaction
Total quality:
Total quality is everyone’s job, just as marketing is everyone’s job. Marketers play several
roles in helping their companies define and deliver high quality goods and services to target
customers.
First, they bear the major responsibility for correctly identifying the customers’ needs and
requirements.
Second, they must communicate customer expectations properly to product designers.
Third, they must make sure that the customers’ orders are filled correctly and on time.
Fourth, they must check that customers have received proper instructions, training, and
technical assistance in the use of the product.
“A STUDY ON CUSTOMER SATISFACTION OF THE SERVICES PROVIDED BY ATHIYA ORGANIZATIONAL COMPETENCIES (P) LIMITED”
9 | P a g e DEPT OF BBM JAN-MAY 2014
Fifth, they must stay in touch with the customers after the sale to ensure they are satisfied and
they remain satisfied.
Sixth, the much gather customer ideas for product and service improvements and convey them
to the appropriate departments.
When marketers do all this, they are making substantial contributions to total quality
management and customer satisfaction, as well as to customer and company profitability.
Maximising Customer Lifetime Value (CLV):
Ultimately, marketing is the art of attracting and keeping profitable customers. Yet, every
company loses money on some of its customers. The well known 20-80 rule says that20% of
the customers often generate 80% or more of the company’s profits. In some cases, the profit
distribution may be more extreme- the most profitable 20% of customers (on a per capita
basis) may contribute as much as 150% to 300% of profitability. The least profitable 10% to
20% of the customers, on the other hand, can actually reduce profits between 50% and 200%
per account, with the middle 60% to 70% breaking even.
It’s not always the company’s largest customers who yield the most profits. The largest
customer can demand considerable service and receive deepest discounts. The smallest
customer may pay full price and receive minimal service, but the costs of transacting with
them can reduce their profitability. The midsize customers who receive good service and pay
nearly full price are often the most profitable.
Customer profitability:
A profitable customer is person, household, or company that over tome yields a revenue
stream that exceeds by an acceptable amount the company’s cost stream for attracting, selling,
and servicing that customer. Note that emphasis is on the lifetime stream of revenue and cost,
not on the profit from a particular transaction. Marketers can access customer profitability
individually, by market segment or by a channel.
“A STUDY ON CUSTOMER SATISFACTION OF THE SERVICES PROVIDED BY ATHIYA ORGANIZATIONAL COMPETENCIES (P) LIMITED”
10 | P a g e DEPT OF BBM JAN-MAY 2014
Although many companies measure customer satisfaction, most companies fail to measure
individual customer profitability. However, the number of unprofitable customers in their
customer base has appalled the companies that have succeeded in linking customer
transactions.
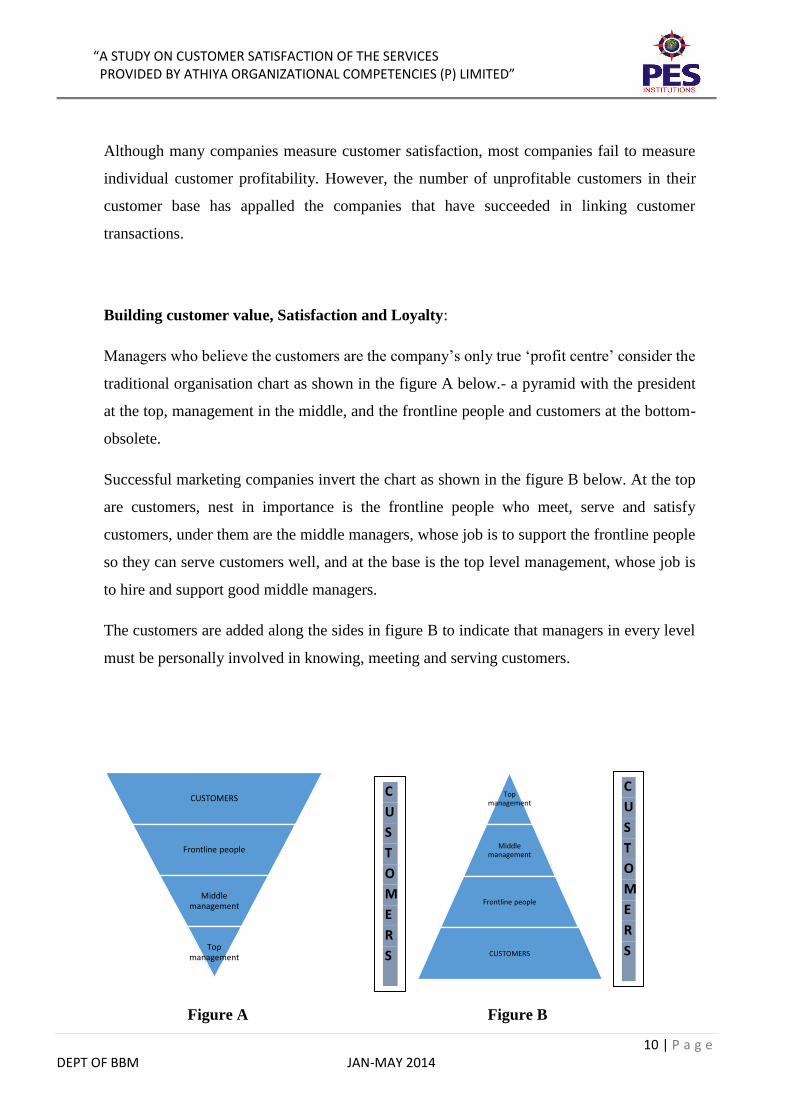
Building customer value, Satisfaction and Loyalty:
Managers who believe the customers are the company’s only true ‘profit centre’ consider the
traditional organisation chart as shown in the figure A below.- a pyramid with the president
at the top, management in the middle, and the frontline people and customers at the bottom-
obsolete.
Successful marketing companies invert the chart as shown in the figure B below. At the top
are customers, nest in importance is the frontline people who meet, serve and satisfy
customers, under them are the middle managers, whose job is to support the frontline people
so they can serve customers well, and at the base is the top level management, whose job is
to hire and support good middle managers.
The customers are added along the sides in figure B to indicate that managers in every level
must be personally involved in knowing, meeting and serving customers.
Figure A Figure B
CUSTOMERS
Frontline people
Middle management
Top management
Top management
Middle management
Frontline people
CUSTOMERS
C
U
S
T
O
M
E
R
S
C
U
S
T
O
M
E
R
S
“A STUDY ON CUSTOMER SATISFACTION OF THE SERVICES PROVIDED BY ATHIYA ORGANIZATIONAL COMPETENCIES (P) LIMITED”
11 | P a g e DEPT OF BBM JAN-MAY 2014
Training & Development
Training and development play an important role in the effectiveness of organisations and to
the experiences of people in work. Training has implications for productivity, health and
safety at work and personal development. All organisations employing people need to train
and develop their staff. Most organisations are cognisant of this requirement and invest effort
and other resources in training and development. Such investment can take the form of
employing specialist training and development staff and paying salaries to staff undergoing
training and development. Investment in training and development entails obtaining and
maintaining space and equipment. It also means that operational personnel, employed in the
organisation’s main business functions, such as production, maintenance, sales, marketing
and management support, must also direct their attention and effort from time to time towards
supporting training development and delivery. This means they are required to give less
attention to activities that are obviously more productive in terms of the organisation’s main
business. However, investment in training and development is generally regarded as good
management practice to maintain appropriate expertise now and in the future.
What are soft skills?
“What exactly are soft skills?” This basic question is not easy to answer, because the
perception of what is a soft skill differs from context to context. A subject may be considered
a soft skill in one particular area, and may be considered a hard skill in another. On top of it
the understanding of what should be recognised as a soft skill varies widely. Knowledge in
project management for instance is “nice to have” for an electrical engineer, but it is a “must
to have” for a civil engineer. Training in cultural awareness might be useful for a chemist, but
it is an absolute necessity for public or human resources management in societies of diverse
cultures.
“A STUDY ON CUSTOMER SATISFACTION OF THE SERVICES PROVIDED BY ATHIYA ORGANIZATIONAL COMPETENCIES (P) LIMITED”
12 | P a g e DEPT OF BBM JAN-MAY 2014
Interesting enough the internationally renowned encyclopaedias have little to say about soft
skills. The online encyclopaedia “Wikipedia” gives a very broad definition of soft skills,
which leaves much room for discussion:
“Soft skills refer to the cluster of personality traits, social graces, facility with language,
personal habits, friendliness, and optimism that mark people to varying degrees. Soft skills
complement hard skills, which are the technical requirements of a job.”
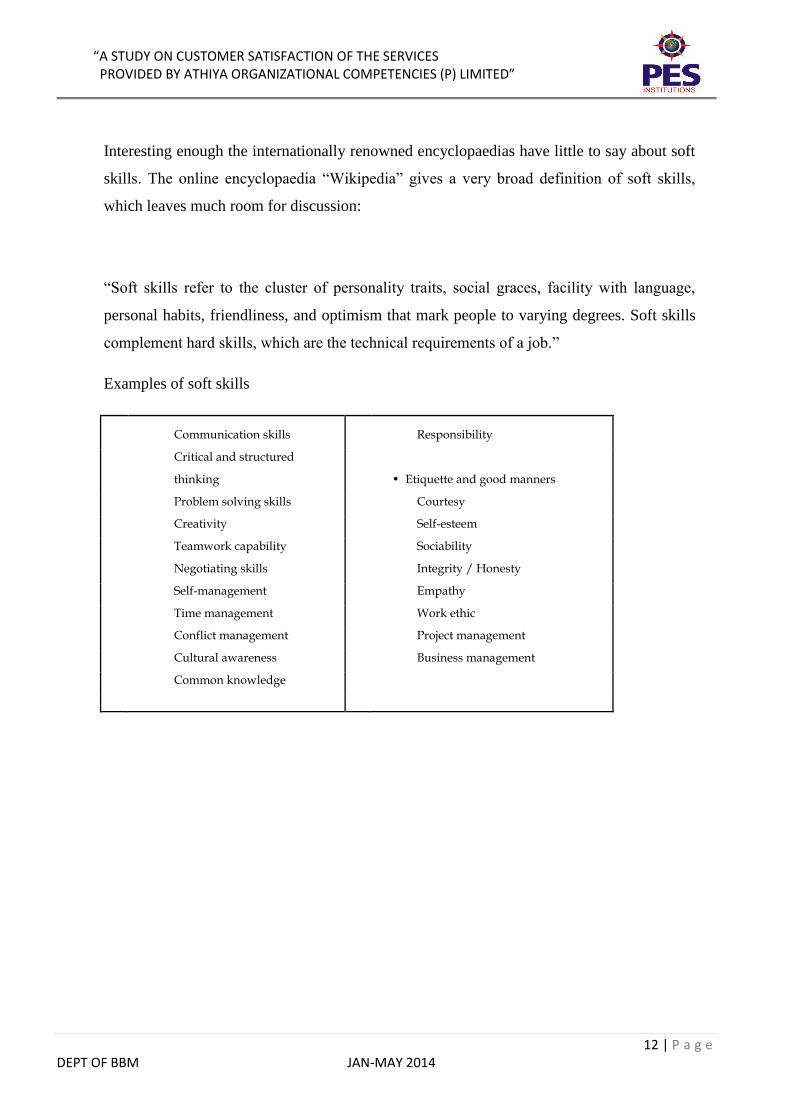
Examples of soft skills
• Communication skills • Responsibility
•
Critical and structured
thinking • Etiquette and good manners
• Problem solving skills • Courtesy
• Creativity • Self-esteem
• Teamwork capability • Sociability
• Negotiating skills • Integrity / Honesty
• Self-management • Empathy
• Time management • Work ethic
• Conflict management • Project management
• Cultural awareness • Business management
• Common knowledge
“A STUDY ON CUSTOMER SATISFACTION OF THE SERVICES PROVIDED BY ATHIYA ORGANIZATIONAL COMPETENCIES (P) LIMITED”
13 | P a g e DEPT OF BBM JAN-MAY 2014
Why are soft skills training important?
After having elaborated so much on soft skills, the answer to why they are
considered as being so important is still open. There are numerous reasons for
having a critical look at a person’s soft skills.
One straightforward reason is today’s job-market, which in many fields is
becoming ever increasingly competitive. To be successful in this tough
environment, candidates for jobs have to bring along a “competitive edge” that
distinguishes them from other candidates with similar qualifications and
comparable evaluation results. And where do they find this competitive advantage?
In bringing along additional knowledge and skills, added up by convincing personal
traits and habits. This sounds familiar.
Understandably, employers prefer to take in job candidates who will be productive
from a very early stage on. If a graduate from university first has to be trained on
putting more than three sentences together, how to do a proper presentation, or how
to chat in a pleasant and winning manner with colleagues and customers, this
graduate will not qualify as a quick starter. Also basic knowledge in business
management, project management and general economy will improve the chances
of a job candidate considerably.
Where can soft skills be acquired?
There exists two methods of learning or improving soft skills. One way is enrolling
for formal training, e.g. taking evening classes on Rhetoric, languages, presentation
skills, conflict or cultural management. This is a well-proven concept with the
advantage of having some kind of certificate at the end of the course, which might
come in handy for job applications. It is not always guaranteed that a certain course
actually successfully enhanced a person’s soft skills.
The other way of acquiring soft skills we looked at is self-training, usually based on
books. Changing of personal traits often requires long-term practice and therefore
self-training might be more useful regarding the improvement of this category of
“A STUDY ON CUSTOMER SATISFACTION OF THE SERVICES PROVIDED BY ATHIYA ORGANIZATIONAL COMPETENCIES (P) LIMITED”
14 | P a g e DEPT OF BBM JAN-MAY 2014
soft skills. Additionally, during the last decade another method of self-training has
become increasingly popular: Electronic Learning, usually abbreviated to e-
learning.
Conclusion
Considering the fact that during the last decades in society the perceived
importance of soft skills has increased significantly, it is of high importance for
everyone to acquire adequate skills beyond academic or technical knowledge. This
is not particularly difficult. Once a shortcoming in a certain area of soft skills has
been identified at oneself, there are numerous ways of rectifying such a deficiency.
Soft skills fulfil an important role in shaping an individual’s personality by
complementing his/her hard skills. However, over-emphasising it to such an extent
should not taint the importance of soft skills, that hard skills, i.e. expert knowledge
in certain fields, are demoted to secondary importance.
“A STUDY ON CUSTOMER SATISFACTION OF THE SERVICES PROVIDED BY ATHIYA ORGANIZATIONAL COMPETENCIES (P) LIMITED”
15 | P a g e DEPT OF BBM JAN-MAY 2014
DESIGN OF THE STUDY
INTRODUCTION TO CUSTOMER SATISFACTION OF THE SERVICES
PROVIDED BY ATHIYA ORGANIZATIONAL COMPETENCIES (P)
LIMITED
Customer satisfaction plays a critical and crucial role as it deals with customers and
their needs. The major task of organisation is to satisfy customers by meeting their
needs and wants. The essence of an organisation is the customer and not the product.
It is the heart of the entire business system and emphasises on customer oriented
business. The policies and programs of an organisation are formulated in order to
serve the customer demand efficiently. Satisfaction of a customer is so basic that it
cannot be considered as a separate function in an organisation.
The project title “A Study on Customer Satisfaction of the services provided by
Athiya” focuses on the service facilities provided by them.
Athiya is an organisation that deals with soft skill and business skill training to larger
corporates. It is essential for the organisation to know its strengths and its weaknesses
for providing such services. The services provided by Athiya must be evaluated and
its effectiveness must be ascertained. The company must learn about the various
sectors that they are poor and weak in and must try improving at the same. Thus,
learning about the customer’s perception, their level of understanding and
satisfaction after utilising the service will help.
“A STUDY ON CUSTOMER SATISFACTION OF THE SERVICES PROVIDED BY ATHIYA ORGANIZATIONAL COMPETENCIES (P) LIMITED”
16 | P a g e DEPT OF BBM JAN-MAY 2014
STATEMENT OF THE PROBLEM
Athiya is an organisation that was established in the year 2004. Athiya’s main
domains are soft skill and business skill training to larger corporates. Apart from this,
Athiya are also into BEC (Business English Certificate) training which is a certificate
that is provided by the University of Cambridge, UK. The organisation helps
individuals in corporates to enhance their professional skills, personal skills and
business skills and thus become better individuals both professionally and personally.
Since Athiya is an organisation that aims at giving 100 percent always, they would
like to improve their performance and get complete satisfaction out of their
customers. The average scores out of a 5 point Likert scale that Athiya usually
reaches is around 4.53 every year. Therefore, a study on the satisfaction level of
customers on the services provided would help in evaluating the areas of
improvement and eventually reaching 4.9-5 henceforth.
“A STUDY ON CUSTOMER SATISFACTION OF THE SERVICES PROVIDED BY ATHIYA ORGANIZATIONAL COMPETENCIES (P) LIMITED”
17 | P a g e DEPT OF BBM JAN-MAY 2014
SCOPE OF STUDY
The scope of the study is limited to the customers of ATHIYA in cities like
Bangalore, Kolkata, and Pune etc.
The study helps understand the customers’ needs, preferences and their satisfaction
levels on the services provided by the business owners.
It also analyses the benefits accruing to the company as a result of these services.
The study is conducted in order to determine the level of satisfaction of customers
on the services of ATHIYA as well as their perceptions about it.
OBJECTIVES OF STUDY
To understand the customer perception on the services provided by ATHIYA through
questionnaire method.
To ascertain the satisfaction levels of customers.
To identify flaws and to provide the company with suitable solutions for the same
based on the feedbacks received by the customers.
To study and analyse various concepts of marketing such as creation of customer
value, satisfaction and loyalty, analysing consumer and business markets, segments
and targets.
“A STUDY ON CUSTOMER SATISFACTION OF THE SERVICES PROVIDED BY ATHIYA ORGANIZATIONAL COMPETENCIES (P) LIMITED”
18 | P a g e DEPT OF BBM JAN-MAY 2014
NEED FOR STUDY
Customer is the person whose needs and requirements are satisfied in order to receive
a consideration in return. The consideration may be in terms of money, time or
goodwill but there is certainly some form of payment.
Satisfaction is the feeling a person has when he or she compares one product or
service with another and his or her perception on the product or service based on his
or her expectations on the particular product or service. Therefore, satisfaction is the
level of difference between the actual performance and the customer’s expectations
The need for this study is to identify the levels of satisfaction of customers from the
services provided by ATHIYA ORGANIZATIONAL COMPETENCIES (P)
LIMITED and to analyse their perception. The basic need is to identify problems and
faults in the company regarding services and their reach to satisfy the customers to
the fullest extent and to provide them with appropriate solutions so that the company
can implement them and improve their service quality, thereby improving the
company’s sales volume and performance.
“A STUDY ON CUSTOMER SATISFACTION OF THE SERVICES PROVIDED BY ATHIYA ORGANIZATIONAL COMPETENCIES (P) LIMITED”
19 | P a g e DEPT OF BBM JAN-MAY 2014
OPERATIONAL DEFINITION OF CONCEPTS
Customer satisfaction:
Customer satisfaction is a term frequently used in marketing. It is a measure of how
products and services supplied by a company meet or surpass customer expectation.
Customer satisfaction is defined as "the number of customers, or percentage of total
customers, whose reported experience with a firm, its products, or its services, by
ratings, exceeds specified satisfaction goals."
Service:
A service is a set of one time consumable and perishable benefits delivered from
the accountable service provider, mostly in close coaction with his internal and
external service suppliers, effectuated by distinct functions of technical systems and
by distinct activities of individuals, respectively, commissioned according to the
needs of his service consumers by the service customer from the accountable
service provider, rendered individually to an authorized service consumer at his/her
dedicated trigger, and, finally, consumed and utilized by the triggering service
consumer for executing his/her upcoming business activity or private activity.
Product:
A product is the item offered for sale. A product can be a service or an item. It can
be physical or in virtual or cyber form. Every product is made at a cost and each is
sold at a price.
Tangibility:
A physical item that can be perceived by the sense of touch. Examples of a tangible
product include cars, food items, computers, telephones, etc.
Many businesses also need to provide packaging for a tangible product to provide
protection during its transportation.
“A STUDY ON CUSTOMER SATISFACTION OF THE SERVICES PROVIDED BY ATHIYA ORGANIZATIONAL COMPETENCIES (P) LIMITED”
20 | P a g e DEPT OF BBM JAN-MAY 2014
Intangibility:
Intangibility is used in marketing to describe the inability to assess the value gained
from engaging in an activity using any tangible evidence. It is often used to describe
services where there isn't a tangible product that the customer can purchase, that can
be seen, tasted or touched.
Perishability:
Perishability is used in marketing to describe the way in which service capacity
cannot be stored for sale in the future. It is a key concept of services marketing.
Inseparability:
Inseparability is used in marketing to describe a key quality of services as distinct
from goods. Inseparability is the characteristic that a service has which renders it
impossible to divorce the supply or production of the service from its consumption
Simultaneity:
Services are rendered and consumed during the same period of time. As soon as the
service consumer has requested the service (delivery), the particular service must be
generated from scratch without any delay and friction and the service consumer
instantaneously consumes the rendered benefits for executing his upcoming activity
or task.
Consumer:
The "consumer" is the one who consumes the goods and services produced. As such,
consumers play a vital role in the economic system of a nation because in the absence
of the effective demand that emanates from them, the economy virtually collapses.
“A STUDY ON CUSTOMER SATISFACTION OF THE SERVICES PROVIDED BY ATHIYA ORGANIZATIONAL COMPETENCIES (P) LIMITED”
21 | P a g e DEPT OF BBM JAN-MAY 2014
Competition:
The act or process of trying to get or win something (such as a prize or a higher level
of success) that someone else is also trying to get or win.
Questionnaire:
A questionnaire refers to a list of questions arranged in a sequence which is used by
a researcher for collecting data. The questionnaire is distributed among a set of
respondents from whom information is required. This questionnaire is filled by the
respondents. The questionnaire is considered as the heart of the survey since this is
what is used as the major method of collecting the primary data in this project.
“A STUDY ON CUSTOMER SATISFACTION OF THE SERVICES PROVIDED BY ATHIYA ORGANIZATIONAL COMPETENCIES (P) LIMITED”
22 | P a g e DEPT OF BBM JAN-MAY 2014
METHODOLOGY
The study is exploratory in nature and based on primary and secondary information.
Secondary information is collected from the different journals, internet and
periodicals. To elicit the responses, a detailed questionnaire has been designed and
surveyed online.
The questionnaire has been tried and tested before being submitted to the participants.
It is based on a 5 point Likert scale ranging from “Completely agree” at 5 points to
“Completely disagree” at 1 point.
Data collection method:
Data refers to any information or fact that is in raw form. It not only refers to
numerical figures but also includes descriptive facts. The methodology followed for
the process of data collection involves two types, namely, primary data and
secondary data.
With regard to this particular project, a structured and detailed questionnaire was
framed where the questions were formed in a way that met the objectives of the study.
The questionnaire contains definite and predetermined questions and the objective
was to obtain information regarding the service offered.
“A STUDY ON CUSTOMER SATISFACTION OF THE SERVICES PROVIDED BY ATHIYA ORGANIZATIONAL COMPETENCIES (P) LIMITED”
23 | P a g e DEPT OF BBM JAN-MAY 2014
RESEARCH DESIGN
There are several types of research design. The major ones are:
Descriptive research design
Exploratory research design
Experimental research design
In this project, “A Study on Customer Satisfaction of the services provided by
ATHIYA Organizational Competencies (p) Limited”, exploratory research has been
used to collect the primary data. The data obtained by exploratory research is through
questionnaires. The data collected has been gathered and analysed and suitable
conclusions have been drawn.
SAMPLING PLAN
Sampling is defined as a process used in statistical analysis in which a predetermined
number of observations will be taken from a larger population. The methodology
used to sample from a larger population will depend on the type of analysis being
performed, but will include simple random sampling, systematic sampling and
observational sampling. The sample should be a representation of the general
population.
Sample procedure:
Sampling is a procedure by which the respondents are selected. There are basically
two types of sampling methods are:
Probability sampling methods.
Non-Probability sampling methods.
In this study, the non-probability sampling method was adopted. The required
numbers of customers were selected according to area sampling procedure. The
sample size was chosen as 100.
“A STUDY ON CUSTOMER SATISFACTION OF THE SERVICES PROVIDED BY ATHIYA ORGANIZATIONAL COMPETENCIES (P) LIMITED”
24 | P a g e DEPT OF BBM JAN-MAY 2014
TOOLS AND TECHNIQUES FOR COLLECTION OF DATA
Research design tools:
To conduct any research, various tools are made use of to collect data from various
sources. The tools for collection of data in this particular study are:
Primary data:
Questionnaires
Secondary data:
Books on marketing management
Company manuals
All the questionnaires distributed were duly filled by the respondents.
“A STUDY ON CUSTOMER SATISFACTION OF THE SERVICES PROVIDED BY ATHIYA ORGANIZATIONAL COMPETENCIES (P) LIMITED”
25 | P a g e DEPT OF BBM JAN-MAY 2014
PLAN OF ANALYSIS
The area of focus in the project is on the Customer Satisfaction of the services
provided by ATHIYA organizational competencies (p) Limited. The objectives of
the study include:
To understand the customer perception on the services provided by ATHIYA through
questionnaire method.
To ascertain the satisfaction levels of customers and to understand the factors which
influence the satisfaction levels.
To identify flaws and to provide the company with suitable solutions for the same
based on the feedbacks received by the customers.
To study and analyse various concepts of marketing such as creation of customer
value, satisfaction and loyalty, analysing consumer and business markets, segments
and targets.
It must be seen to it that the questionnaire meets the objectives as mentioned above.
Analysis follows collection and gathering of data. That is done by distributing the
questionnaires to a 100 customers. The analysis is done by going through each of the
100 responses from the questionnaires and recording the options chosen by them.
These options are then analysed by projecting the recordings in graphical forms like
bar graphs and frequency polygons wherever necessary. The various measures of
central tendencies are calculated and skewness of the responses on the chart is also
measured.
“A STUDY ON CUSTOMER SATISFACTION OF THE SERVICES PROVIDED BY ATHIYA ORGANIZATIONAL COMPETENCIES (P) LIMITED”
26 | P a g e DEPT OF BBM JAN-MAY 2014
LIMITATIONS OF THE STUDY
As the time provided for the researcher was limited, time poses as one of the
limitations of the study.
The results of the study are based on assumption that all the information provided by
the respondents is correct.
The total respondents are limited to 100 since the number of participants is very high
and collection of data from such a large population would be tedious.
It is difficult to evaluate and get accurate results since the mood of the respondents
may vary from time to time.
There may also exist external factors which has got nothing to do with customers but
may still affect satisfaction.
The organization may not be able to get 100 percent results due to internal factors
like company policies, procedures and so on which may affect the performance.
“A STUDY ON CUSTOMER SATISFACTION OF THE SERVICES PROVIDED BY ATHIYA ORGANIZATIONAL COMPETENCIES (P) LIMITED”
27 | P a g e DEPT OF BBM JAN-MAY 2014
AN OVERVIEW OF CHAPTER SCHEME
Chapter 1:
This chapter contains a brief introduction to the subject and the topic of study. It
covers the subject background like markets, marketing, marketing management etc.
It also covers the research topic and the basic terms related to it such as customer,
consumer, customer satisfaction, post sales or after sales services, etc.
Chapter 2:
This chapter includes a brief introduction to the subject background, the problem
statement, scope and objectives of the study, operational definitions of concepts, the
methodology in which the study is conducted, sampling size, sampling plan, the tools
and techniques for collection of data, the plan of analysis and its limitations.
Chapter 3:
This chapter must comprise of the company profile, its history, nature of business,
products and services provided by them, their competitors, capital structure, turn
over, the number of branches spread across the city, staff pattern and organisation
structure, a complete SWOT analysis etc. All the mentioned points is in reference to
the research topic.
Chapter 4:
This chapter contains an analysis of the primary data in tune with the objectives. Each
question in the survey methodology is reduced into table form and is analysed with
the help of graphs and charts and other diagrams like pie charts and bar graphs, etc.
Each of these is then followed by explanations and inferences.
Chapter 5:
This chapter provided the summary of all findings and conclusions drawn from the
study. It also includes suggestions and ways of improvements for the company.
“A STUDY ON CUSTOMER SATISFACTION OF THE SERVICES PROVIDED BY ATHIYA ORGANIZATIONAL COMPETENCIES (P) LIMITED”
28 | P a g e DEPT OF BBM JAN-MAY 2014
COMPANY PROFILE
“Athiya” in Sanskrit means “excellence”.
Excellence is defined as “the quality of excelling or possessing good qualities in
hgh degree; it is an essential or distinguishing attribute of something or someone; it
is a prominent aspect of something or someone.”
About Athiya
Athiya develops and deploys strategic knowledge initiatives to promote corporate
excellence. They offer customised EDP & MDP learnings across various sectors. In
addition, they not only offer unique business coaching & HR support but also
develop content specific to corporate development needs. With its in-house
leadership team having a combined experience of more than 70 years in corporate
training, Athiya aims at being a corporate’s partner in long term people skills and
development.
Athiya was established in the year 2004. It is spearheaded by an industry veteran
who comes with more than 2 decades of experience Learning & Development &
HR consulting. It is a preferred partner in the workplace Learning & Development
space of all leading companies across verticals such as IT, ITeS, Telecom,
Manufacturing, and Financials.
ATHIYA comes with over 70 man years of experience in training
ATHIYA is the preferred L & D partner for top-notch multinational companies
across India
ATHIYA has trained over 4, 00,000 professionals across levels across industries
ATHIYA has trained companies on a wide range of training modules from Campus
to Corporate programs for their new recruits to Leadership programs for their senior
managers
“A STUDY ON CUSTOMER SATISFACTION OF THE SERVICES PROVIDED BY ATHIYA ORGANIZATIONAL COMPETENCIES (P) LIMITED”
29 | P a g e DEPT OF BBM JAN-MAY 2014
ATHIYA understands the profiles of professionals that companies look for, as it
has been involved in their recruitment process
ATHIYA has been involved with training in some of the top MNC’s in India. We
have trained from new recruits to senior managers. This has placed us in the
strategic position of understanding corporate needs.
ATHIYA is into training on language, V & A, Personal skills, Behavioural skills
and Leadership skills.
Vision
“We will provide you with key insights on people skills to make your organisation
“First among equals”
Mission
We will proactively develop products/services that will give our clients a
competitive edge. Through collaborative partnerships, we will help our clients in:
Mapping competencies
Identifying training needs
Designing customized training systems
Facilitating long term training initiatives.
“A STUDY ON CUSTOMER SATISFACTION OF THE SERVICES PROVIDED BY ATHIYA ORGANIZATIONAL COMPETENCIES (P) LIMITED”
30 | P a g e DEPT OF BBM JAN-MAY 2014
Nature of business and industry growth facts.
The education and training market is worth around Rs. Ten Thousand Crores with a
growth rate of approximately 25%. In this highly competitive environment,
training forms the key to a successful career path for potential candidates.
Employment in the Indian IT and ITeS Industry is over 2.5 million and expected to
grow at 15% YOY (year on year).
Revenues of all the IT/ ITeS companies in India are in excess of US$ 60 billion
and with one of the fastest growth rate.
With globalization, political boundaries have become non-existent in the corporate
world. Many non-English speaking countries like Japan, Germany, China, Spain,
France, etc., have accepted English as the link language in the business world.
Therefore, the ability to speak English drives success for the individual as well as
the country.
“A STUDY ON CUSTOMER SATISFACTION OF THE SERVICES PROVIDED BY ATHIYA ORGANIZATIONAL COMPETENCIES (P) LIMITED”
31 | P a g e DEPT OF BBM JAN-MAY 2014
Athiya’s service offerings
Athiya offer’s its service to both corporates and colleges.
ATHIYA has 2 of its popular and critical modules to offer colleges
Business English Certificate program is a training program for those who want to
develop their English communication skills. This certificate is issued by the
University of Cambridge. It is valid for life and is recognized by companies across
the world.
C2C - Campus to Corporate orients a student to face interviews confidently. It also
helps the student acquire those skills that are necessary to become a global
professional.
“A STUDY ON CUSTOMER SATISFACTION OF THE SERVICES PROVIDED BY ATHIYA ORGANIZATIONAL COMPETENCIES (P) LIMITED”
32 | P a g e DEPT OF BBM JAN-MAY 2014
Business English Certificate (BEC)
ATHIYA trains employees and students for Business English Certificate
examinations conducted by the University of Cambridge
The advantages of Business English Certificate training are:
BEC gives the opportunity to learn practical work-place English
BEC validates the learning one has undergone during the Business English training
Different levels of BEC give achievable goals and structure to English language
learning
Preparing for BEC improves one’s confidence in using business English,
particularly in speaking
The students will have great advantage taking up the BEC examination offered by
the University of Cambridge
Some of the leading MNC that endorse BEC are Infosys, Cognizant, Indian Oil
Corporation, Bank of America, L & T, Siemens, Tata Consultancy, Wipro,
Capgemini, HSBC, etc.
Campus2Corporate
Every year, a growing number of graduates come out of the campuses. However,
many recent surveys show that only a few are competent to secure a job in the
corporate world: the main reason being the mismatch between the skills of the job
aspirants and the requirements of the corporate sector.
This is where ATHIYA comes into the picture. These prospective young job-
seekers will go through a set of training modules on the basic skills required to
transition themselves from the campus to the corporate world.
Campus to corporate program also equips a student to write an effective resume,
participate in group discussions, communicate well and face interviews with
confidence.
“A STUDY ON CUSTOMER SATISFACTION OF THE SERVICES PROVIDED BY ATHIYA ORGANIZATIONAL COMPETENCIES (P) LIMITED”
33 | P a g e DEPT OF BBM JAN-MAY 2014
Athiya’s offerings to corporates are called ORGANIZATIONAL
DEVELOPMENT INITIATIVES (ODI)
ODI’s are a variety of customized, highly relevant professional development
programs across various levels within an organization.
Personal Skills enhancement programs
Programs that enhance an individual’s soft skills portfolio, including such popular
and well received ones as Emotional Intelligence, Stress Management, Time
Management, Achievement Motivation, Cross Cultural Sensitivity, Dining
Etiquette & Social Graces, etc.
Business Skills enhancement programs
Programs that add to an individual’s professional portfolio through enhancing
behavioural skills such as Business Communication & Presentation Skills, Problem
Solving & Decision Making, Working in teams, Eye for Detail, Sensitivity at the
workplace, Facilitation Skills, Work-Life Balance, etc.
Why Athiya?
Key inputs for program creation comes from an advisory group of industry veterans
and thought leaders, in addition to strategic collaboration with various sectors for
WL&D (Workplace learning and Development)
An in-house team of certified instructional designers and training specialists who
skilfully transform rich and relevant conceptual knowledge into experiential
learning
Need based behavioural enhancement through perfect blend of concept exploration
with real time simulations
Highly motivating, interactive program design for optimum learning
Stringent processes to maintain content relevance
Consistent high quality programs through a standardized implementation
methodology
“A STUDY ON CUSTOMER SATISFACTION OF THE SERVICES PROVIDED BY ATHIYA ORGANIZATIONAL COMPETENCIES (P) LIMITED”
34 | P a g e DEPT OF BBM JAN-MAY 2014
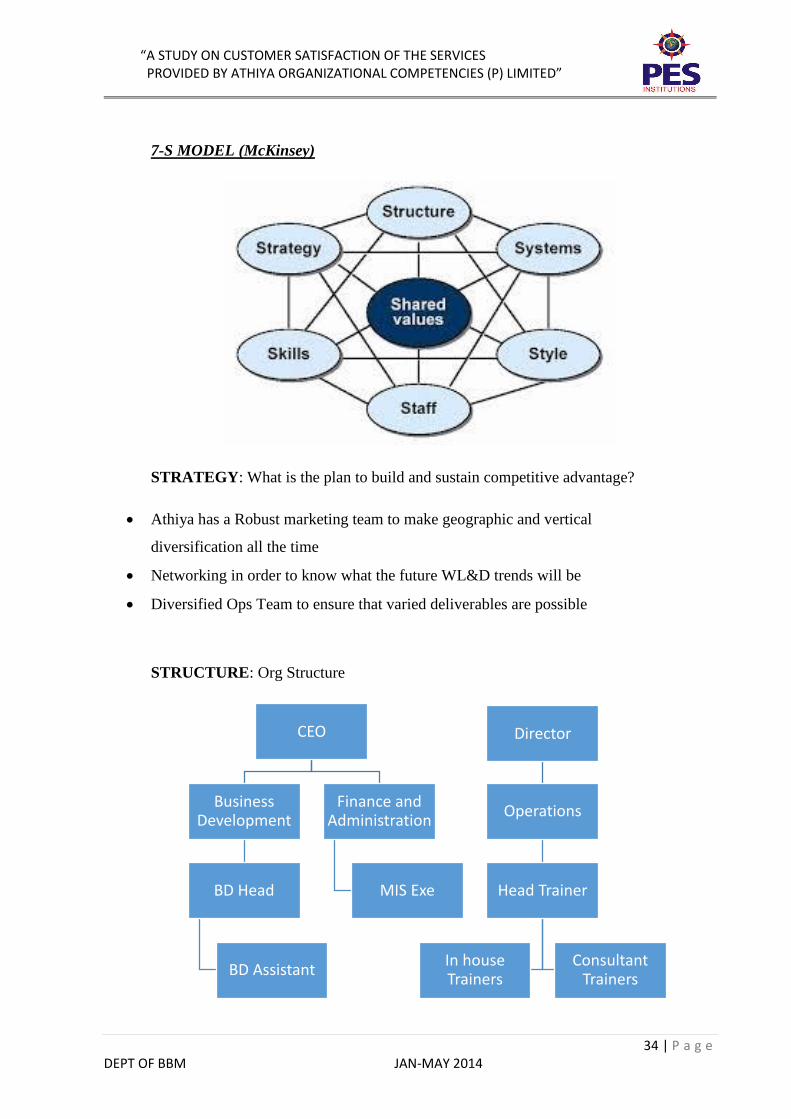
7-S MODEL (McKinsey)
STRATEGY: What is the plan to build and sustain competitive advantage?
Athiya has a Robust marketing team to make geographic and vertical
diversification all the time
Networking in order to know what the future WL&D trends will be
Diversified Ops Team to ensure that varied deliverables are possible
STRUCTURE: Org Structure
CEO
Business Development
BD Head
BD Assistant
Finance and Administration
MIS Exe
Director
Operations
Head Trainer
In house Trainers
Consultant Trainers
“A STUDY ON CUSTOMER SATISFACTION OF THE SERVICES PROVIDED BY ATHIYA ORGANIZATIONAL COMPETENCIES (P) LIMITED”
35 | P a g e DEPT OF BBM JAN-MAY 2014
BD & FIN: rests with CEO
BD has its own org structure
FIN has its own org structure
OPS: Rests with Director – L&D
Clear top-down structure exists
SYSTEMS: Processes, procedures used to accomplish tasks
Recruitment processes
HR policies and processes
Robust PMS for Ops Team
SHARED VALUES: Core values that are reflected in the culture and work ethic of
the organization
These are Athiya’s current core values:
Tenets
TIMELINE: Athiya will respect timelines and stay committed to their client’s
schedules.
VALUE ADDITION: Athiya will implement only those training initiatives that will
be true value additions to their client.
CUSTOMIZATION: Athiya will design unique corporate training programs that
completely match their client’s organizational development initiatives.
DETERMINATION: Athiya will do all it takes to fulfil their client’s expectations.
“A STUDY ON CUSTOMER SATISFACTION OF THE SERVICES PROVIDED BY ATHIYA ORGANIZATIONAL COMPETENCIES (P) LIMITED”
36 | P a g e DEPT OF BBM JAN-MAY 2014
Athiya does this all the time because they stretch themselves to deliver exactly what
the client wants; they constantly research to upgrade their content and delivery;
they are reasonable in their pricing so the client has a true value add when they
engage with Athiya.
STYLE: What type of leadership style is practiced?
Primarily Situational Leadership
STAFF: General description of staff members
We have beginners as well as veterans across the board. Each has a different set of
competencies but when put together, the team strength is formidable.
SKILLS: Specific competencies of staff members
Eg: Ops Team: ability to facilitate a training program; engage with a client SPOC
in meaningful interaction; content design and development
Eg: MIS: above average computer skills; ability to crunch numbers and present
data effectively
“A STUDY ON CUSTOMER SATISFACTION OF THE SERVICES PROVIDED BY ATHIYA ORGANIZATIONAL COMPETENCIES (P) LIMITED”
37 | P a g e DEPT OF BBM JAN-MAY 2014
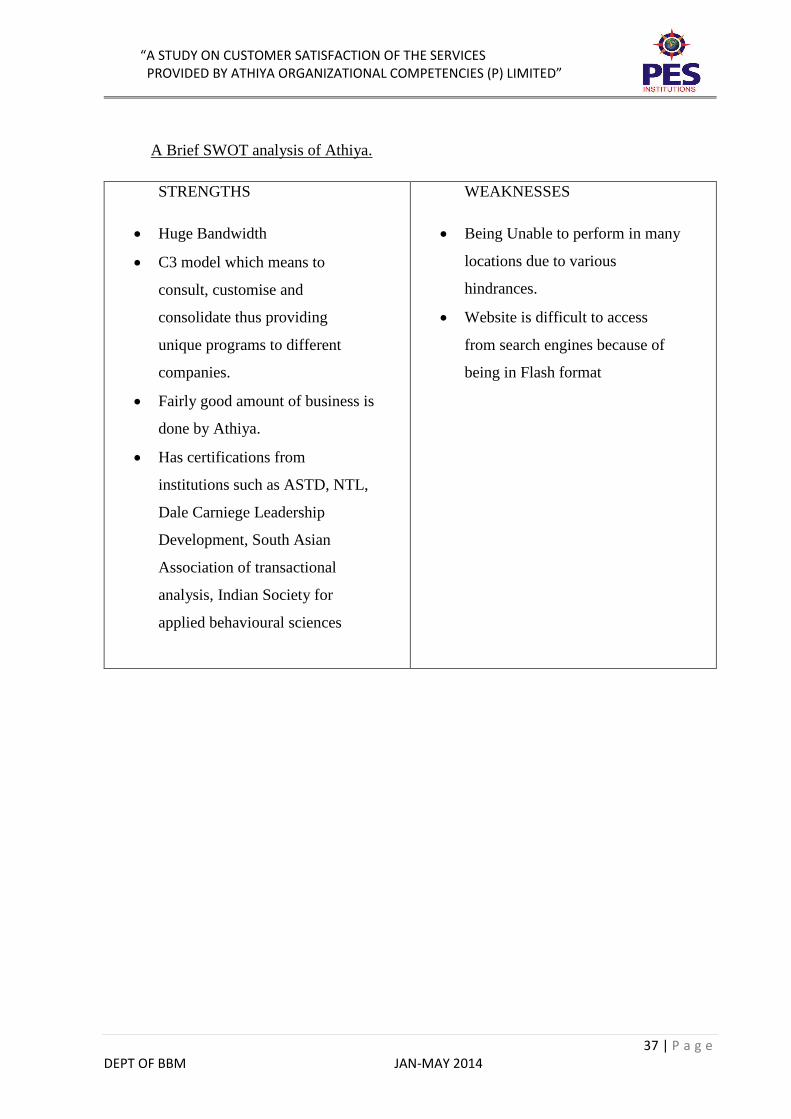
A Brief SWOT analysis of Athiya.
STRENGTHS
Huge Bandwidth
C3 model which means to
consult, customise and
consolidate thus providing
unique programs to different
companies.
Fairly good amount of business is
done by Athiya.
Has certifications from
institutions such as ASTD, NTL,
Dale Carniege Leadership
Development, South Asian
Association of transactional
analysis, Indian Society for
applied behavioural sciences
WEAKNESSES
Being Unable to perform in many
locations due to various
hindrances.
Website is difficult to access
from search engines because of
being in Flash format
“A STUDY ON CUSTOMER SATISFACTION OF THE SERVICES PROVIDED BY ATHIYA ORGANIZATIONAL COMPETENCIES (P) LIMITED”
38 | P a g e DEPT OF BBM JAN-MAY 2014
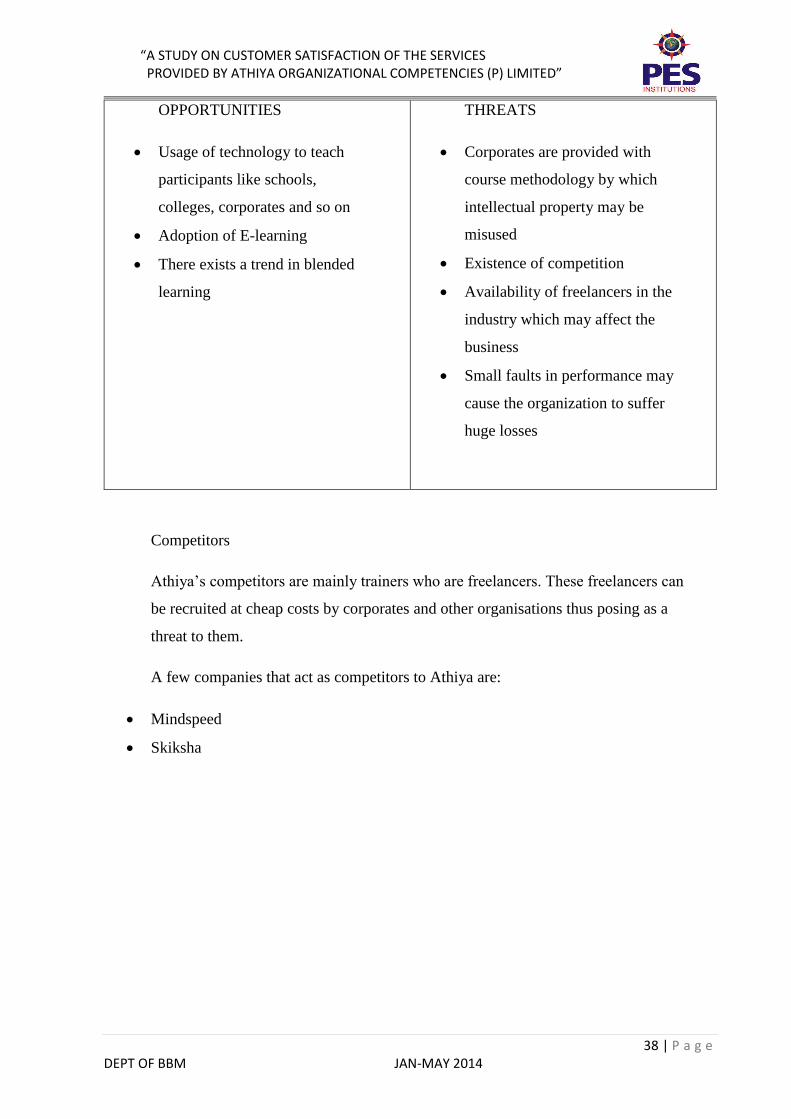
OPPORTUNITIES
Usage of technology to teach
participants like schools,
colleges, corporates and so on
Adoption of E-learning
There exists a trend in blended
learning
THREATS
Corporates are provided with
course methodology by which
intellectual property may be
misused
Existence of competition
Availability of freelancers in the
industry which may affect the
business
Small faults in performance may
cause the organization to suffer
huge losses
Competitors
Athiya’s competitors are mainly trainers who are freelancers. These freelancers can
be recruited at cheap costs by corporates and other organisations thus posing as a
threat to them.
A few companies that act as competitors to Athiya are:
Mindspeed
Skiksha
“A STUDY ON CUSTOMER SATISFACTION OF THE SERVICES PROVIDED BY ATHIYA ORGANIZATIONAL COMPETENCIES (P) LIMITED”
39 | P a g e DEPT OF BBM JAN-MAY 2014
ANALYSIS & INTERPRETATION
Question 1:
Trainer had adequate knowledge and expertise:
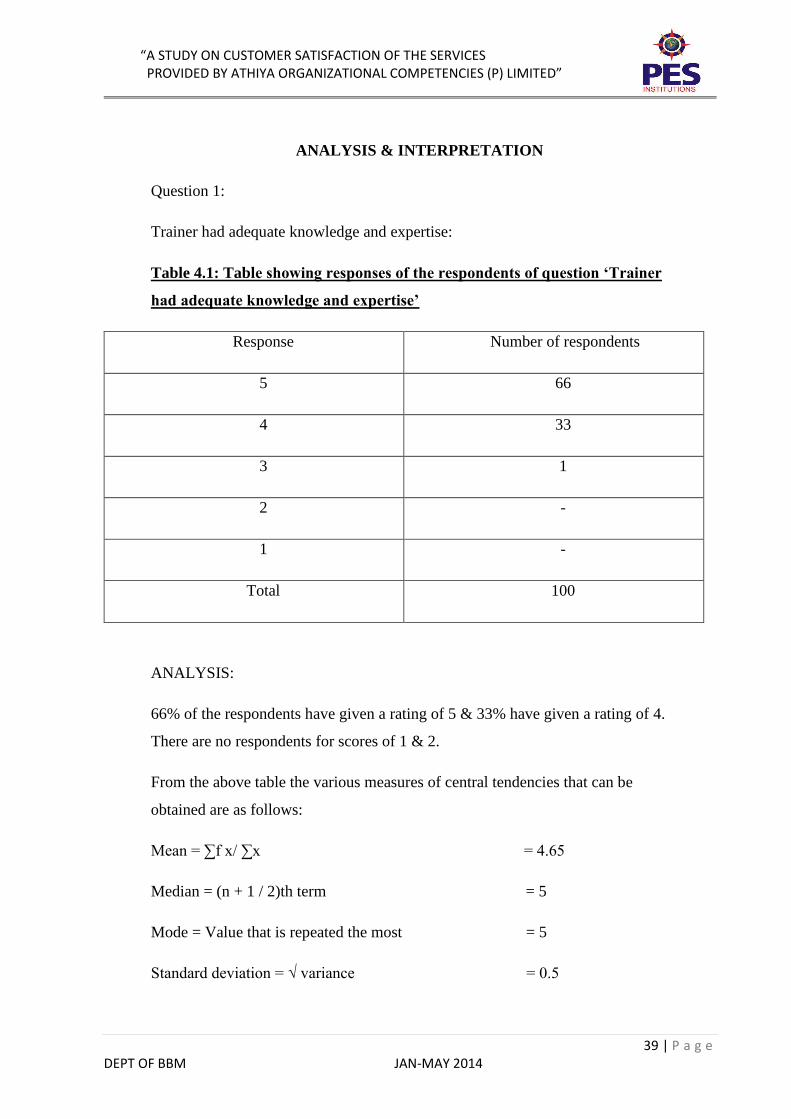
Table 4.1: Table showing responses of the respondents of question ‘Trainer
had adequate knowledge and expertise’
Response Number of respondents
5 66
4 33
3 1
2 -
1 -
Total 100
ANALYSIS:
66% of the respondents have given a rating of 5 & 33% have given a rating of 4.
There are no respondents for scores of 1 & 2.
From the above table the various measures of central tendencies that can be
obtained are as follows:
Mean = ∑f x/ ∑x = 4.65
Median = (n + 1 / 2)th term = 5
Mode = Value that is repeated the most = 5
Standard deviation = √ variance = 0.5
“A STUDY ON CUSTOMER SATISFACTION OF THE SERVICES PROVIDED BY ATHIYA ORGANIZATIONAL COMPETENCIES (P) LIMITED”
40 | P a g e DEPT OF BBM JAN-MAY 2014
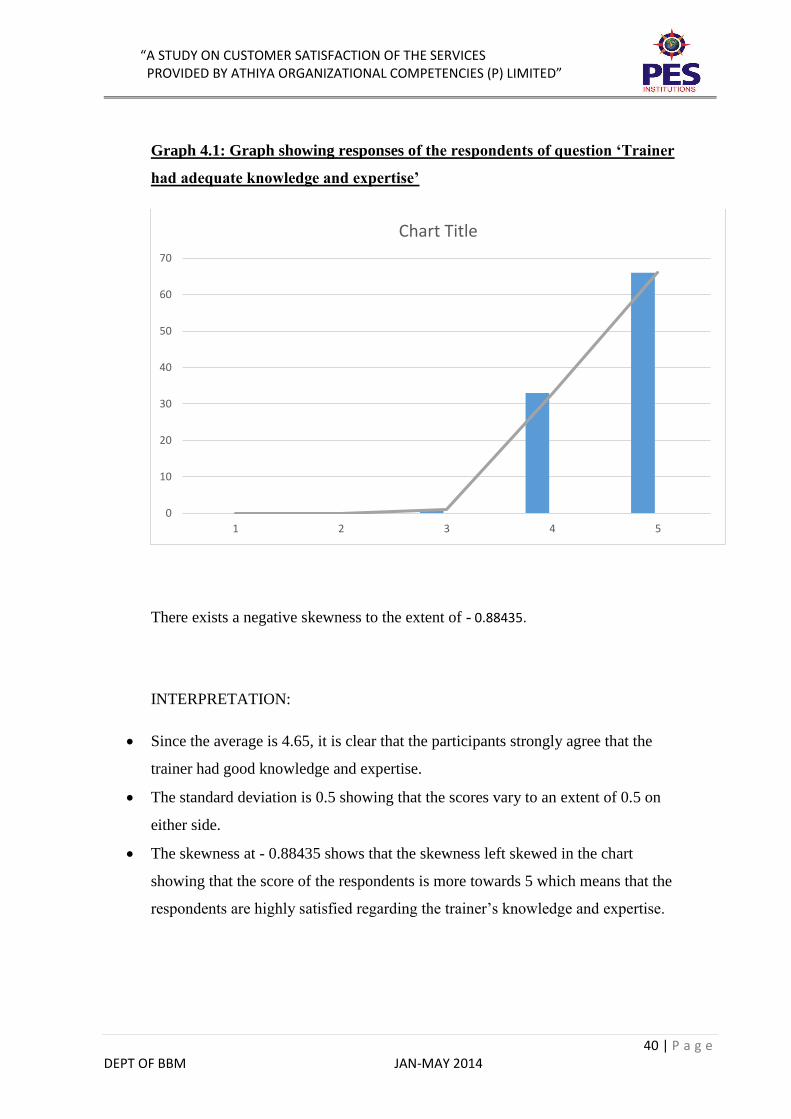
Graph 4.1: Graph showing responses of the respondents of question ‘Trainer
had adequate knowledge and expertise’
There exists a negative skewness to the extent of - 0.88435.
INTERPRETATION:
Since the average is 4.65, it is clear that the participants strongly agree that the
trainer had good knowledge and expertise.
The standard deviation is 0.5 showing that the scores vary to an extent of 0.5 on
either side.
The skewness at - 0.88435 shows that the skewness left skewed in the chart
showing that the score of the respondents is more towards 5 which means that the
respondents are highly satisfied regarding the trainer’s knowledge and expertise.
0
10
20
30
40
50
60
70
1 2 3 4 5
Chart Title
“A STUDY ON CUSTOMER SATISFACTION OF THE SERVICES PROVIDED BY ATHIYA ORGANIZATIONAL COMPETENCIES (P) LIMITED”
41 | P a g e DEPT OF BBM JAN-MAY 2014
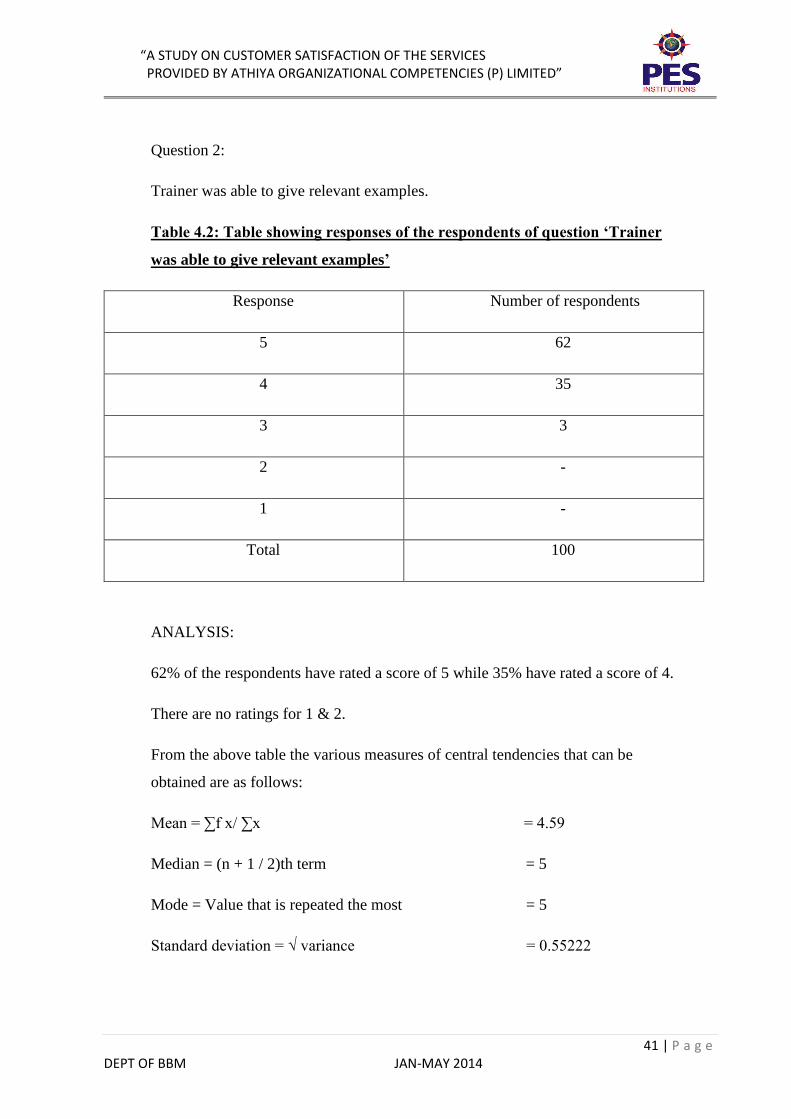
Question 2:
Trainer was able to give relevant examples.
Table 4.2: Table showing responses of the respondents of question ‘Trainer
was able to give relevant examples’
Response Number of respondents
5 62
4 35
3 3
2 -
1 -
Total 100
ANALYSIS:
62% of the respondents have rated a score of 5 while 35% have rated a score of 4.
There are no ratings for 1 & 2.
From the above table the various measures of central tendencies that can be
obtained are as follows:
Mean = ∑f x/ ∑x = 4.59
Median = (n + 1 / 2)th term = 5
Mode = Value that is repeated the most = 5
Standard deviation = √ variance = 0.55222
“A STUDY ON CUSTOMER SATISFACTION OF THE SERVICES PROVIDED BY ATHIYA ORGANIZATIONAL COMPETENCIES (P) LIMITED”
42 | P a g e DEPT OF BBM JAN-MAY 2014
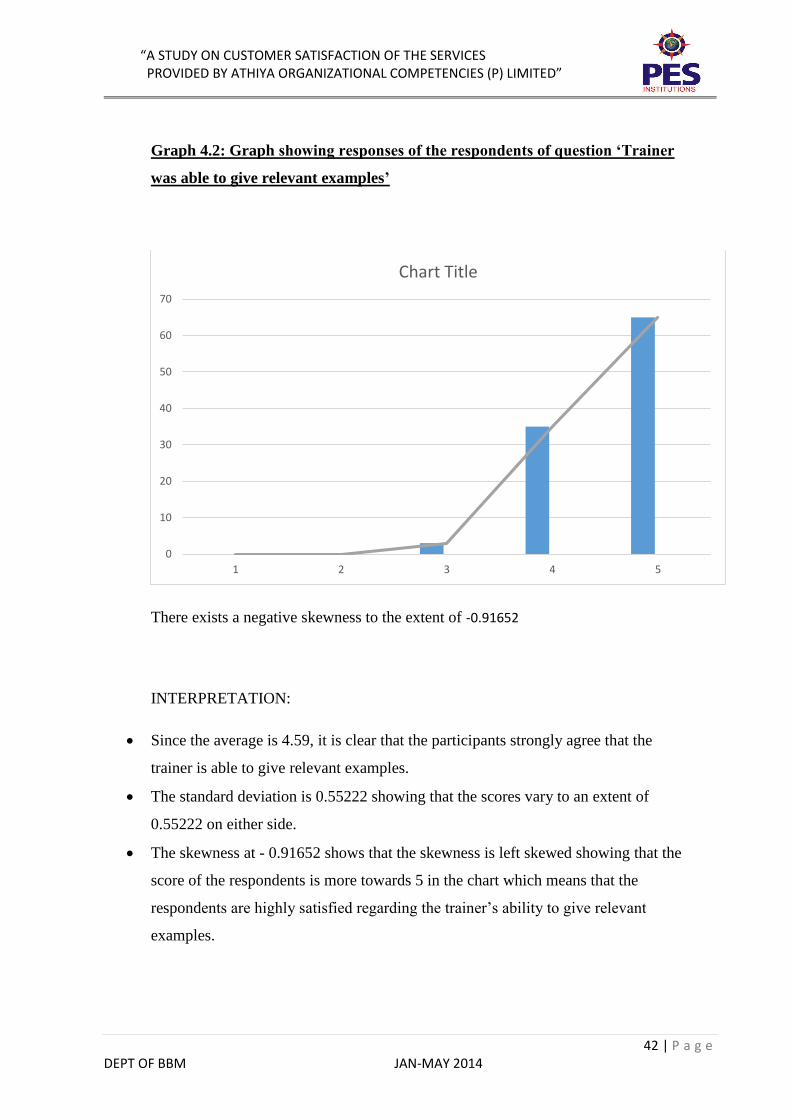
Graph 4.2: Graph showing responses of the respondents of question ‘Trainer
was able to give relevant examples’
There exists a negative skewness to the extent of -0.91652
INTERPRETATION:
Since the average is 4.59, it is clear that the participants strongly agree that the
trainer is able to give relevant examples.
The standard deviation is 0.55222 showing that the scores vary to an extent of
0.55222 on either side.
The skewness at - 0.91652 shows that the skewness is left skewed showing that the
score of the respondents is more towards 5 in the chart which means that the
respondents are highly satisfied regarding the trainer’s ability to give relevant
examples.
0
10
20
30
40
50
60
70
1 2 3 4 5
Chart Title
“A STUDY ON CUSTOMER SATISFACTION OF THE SERVICES PROVIDED BY ATHIYA ORGANIZATIONAL COMPETENCIES (P) LIMITED”
43 | P a g e DEPT OF BBM JAN-MAY 2014
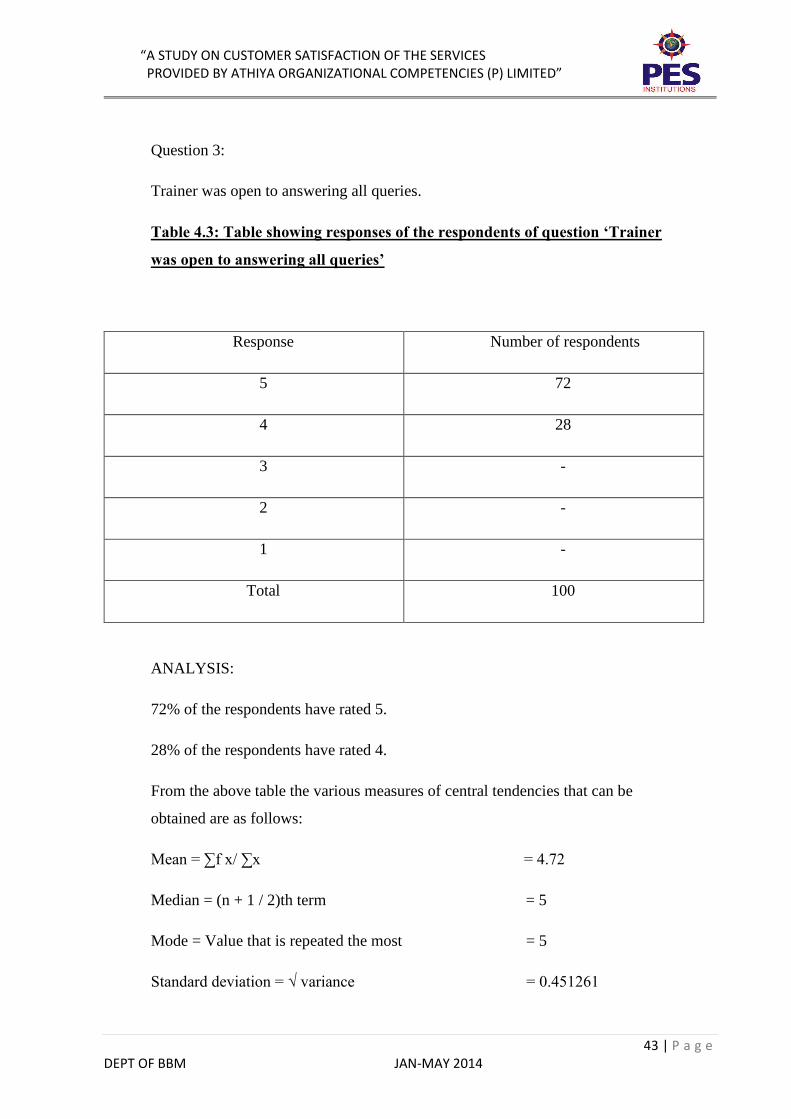
Question 3:
Trainer was open to answering all queries.
Table 4.3: Table showing responses of the respondents of question ‘Trainer
was open to answering all queries’
Response Number of respondents
5 72
4 28
3 -
2 -
1 -
Total 100
ANALYSIS:
72% of the respondents have rated 5.
28% of the respondents have rated 4.
From the above table the various measures of central tendencies that can be
obtained are as follows:
Mean = ∑f x/ ∑x = 4.72
Median = (n + 1 / 2)th term = 5
Mode = Value that is repeated the most = 5
Standard deviation = √ variance = 0.451261
“A STUDY ON CUSTOMER SATISFACTION OF THE SERVICES PROVIDED BY ATHIYA ORGANIZATIONAL COMPETENCIES (P) LIMITED”
44 | P a g e DEPT OF BBM JAN-MAY 2014
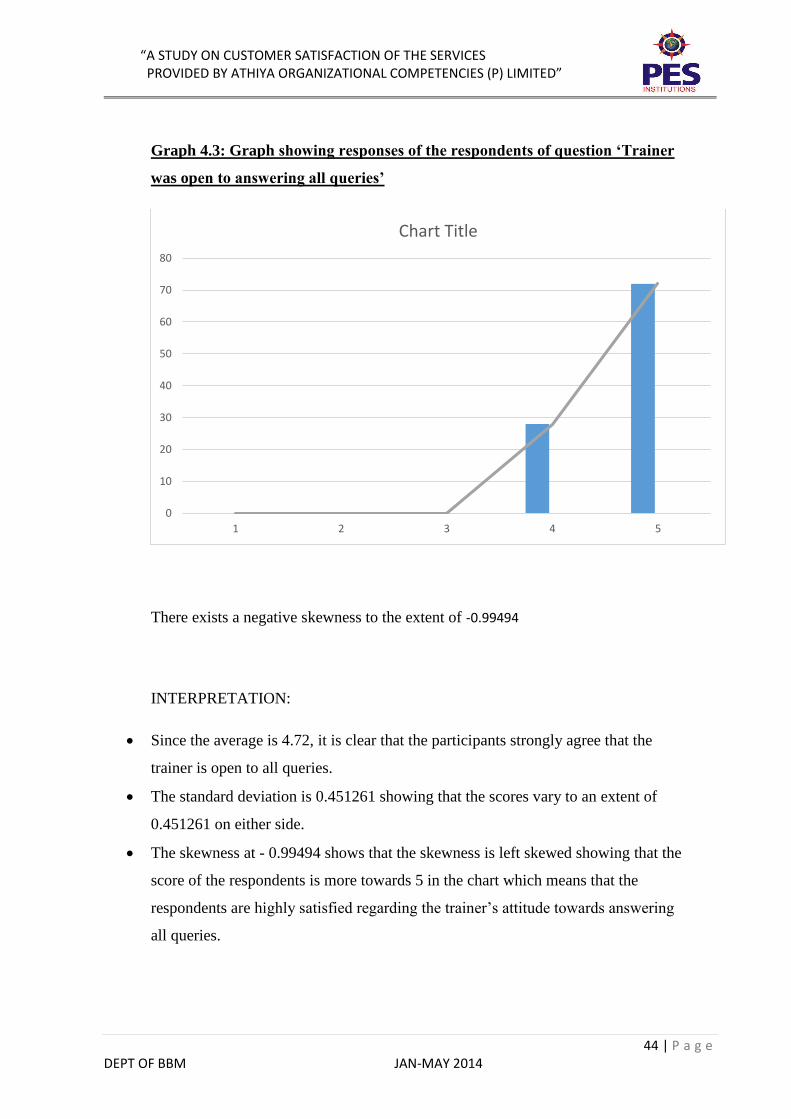
Graph 4.3: Graph showing responses of the respondents of question ‘Trainer
was open to answering all queries’
There exists a negative skewness to the extent of -0.99494
INTERPRETATION:
Since the average is 4.72, it is clear that the participants strongly agree that the
trainer is open to all queries.
The standard deviation is 0.451261 showing that the scores vary to an extent of
0.451261 on either side.
The skewness at - 0.99494 shows that the skewness is left skewed showing that the
score of the respondents is more towards 5 in the chart which means that the
respondents are highly satisfied regarding the trainer’s attitude towards answering
all queries.
0
10
20
30
40
50
60
70
80
1 2 3 4 5
Chart Title
“A STUDY ON CUSTOMER SATISFACTION OF THE SERVICES PROVIDED BY ATHIYA ORGANIZATIONAL COMPETENCIES (P) LIMITED”
45 | P a g e DEPT OF BBM JAN-MAY 2014
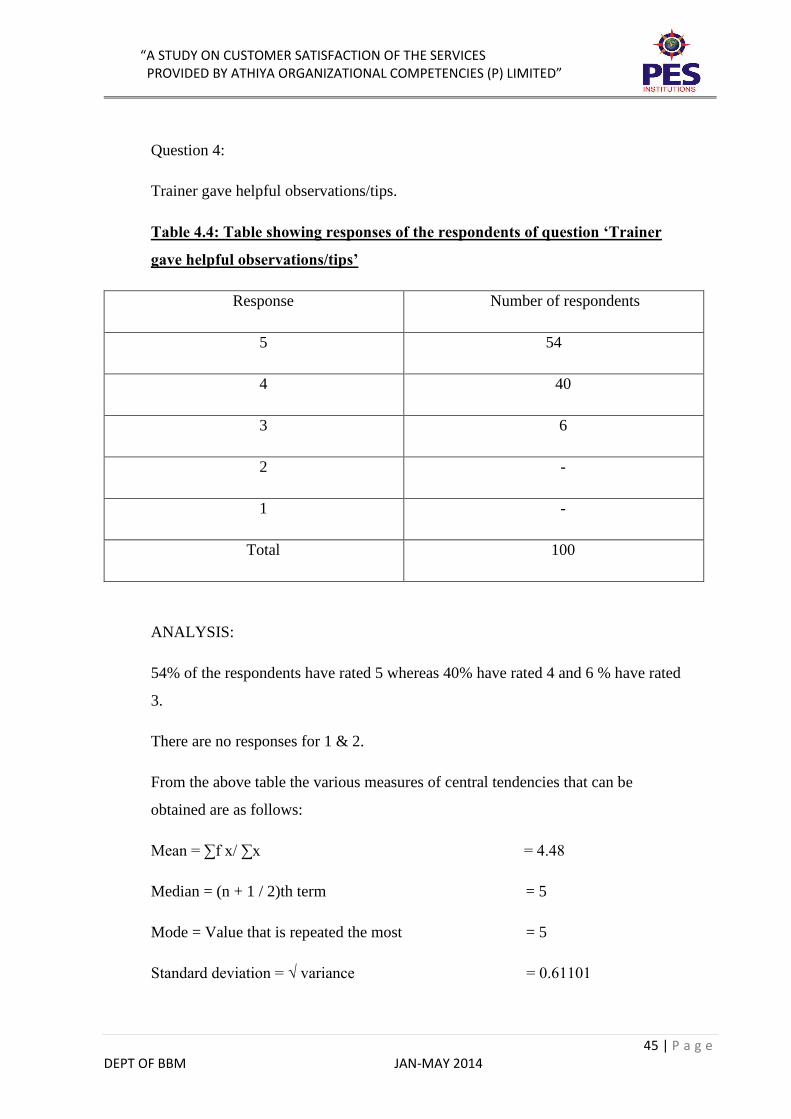
Question 4:
Trainer gave helpful observations/tips.
Table 4.4: Table showing responses of the respondents of question ‘Trainer
gave helpful observations/tips’
Response Number of respondents
5 54
4 40
3 6
2 -
1 -
Total 100
ANALYSIS:
54% of the respondents have rated 5 whereas 40% have rated 4 and 6 % have rated
3.
There are no responses for 1 & 2.
From the above table the various measures of central tendencies that can be
obtained are as follows:
Mean = ∑f x/ ∑x = 4.48
Median = (n + 1 / 2)th term = 5
Mode = Value that is repeated the most = 5
Standard deviation = √ variance = 0.61101
“A STUDY ON CUSTOMER SATISFACTION OF THE SERVICES PROVIDED BY ATHIYA ORGANIZATIONAL COMPETENCIES (P) LIMITED”
46 | P a g e DEPT OF BBM JAN-MAY 2014
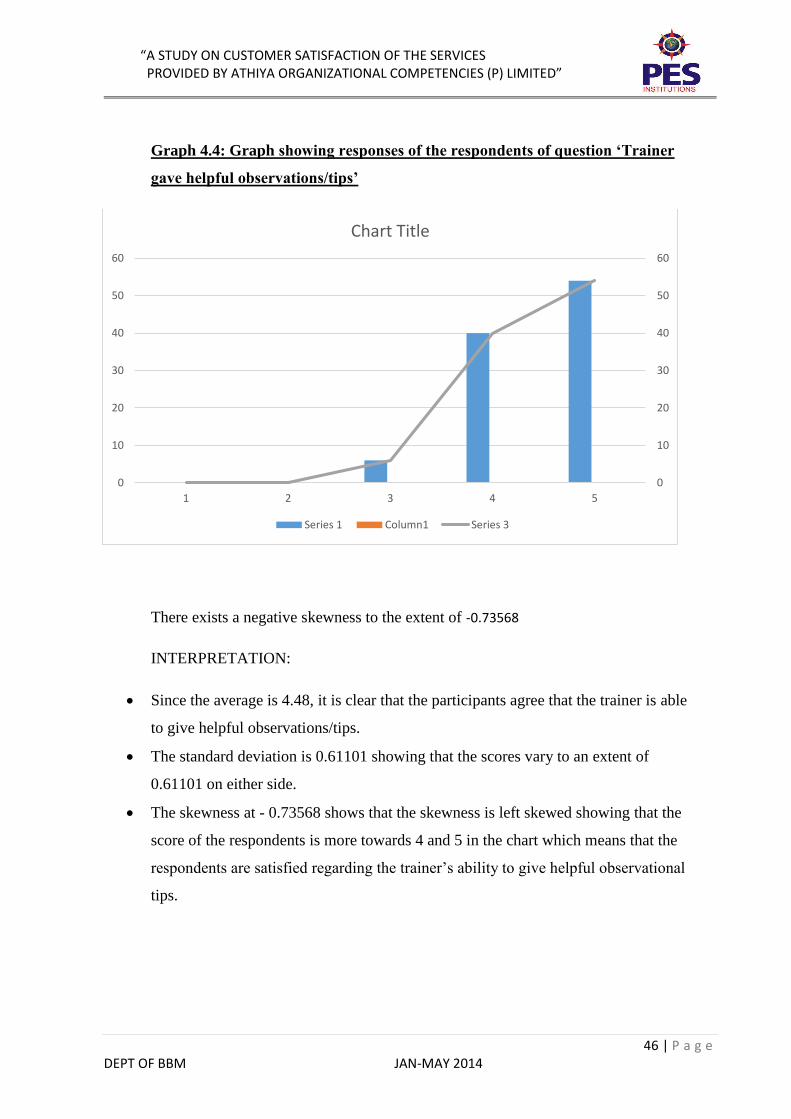
Graph 4.4: Graph showing responses of the respondents of question ‘Trainer
gave helpful observations/tips’
There exists a negative skewness to the extent of -0.73568
INTERPRETATION:
Since the average is 4.48, it is clear that the participants agree that the trainer is able
to give helpful observations/tips.
The standard deviation is 0.61101 showing that the scores vary to an extent of
0.61101 on either side.
The skewness at - 0.73568 shows that the skewness is left skewed showing that the
score of the respondents is more towards 4 and 5 in the chart which means that the
respondents are satisfied regarding the trainer’s ability to give helpful observational
tips.
0
10
20
30
40
50
60
0
10
20
30
40
50
60
1 2 3 4 5
Chart Title
Series 1 Column1 Series 3
“A STUDY ON CUSTOMER SATISFACTION OF THE SERVICES PROVIDED BY ATHIYA ORGANIZATIONAL COMPETENCIES (P) LIMITED”
47 | P a g e DEPT OF BBM JAN-MAY 2014
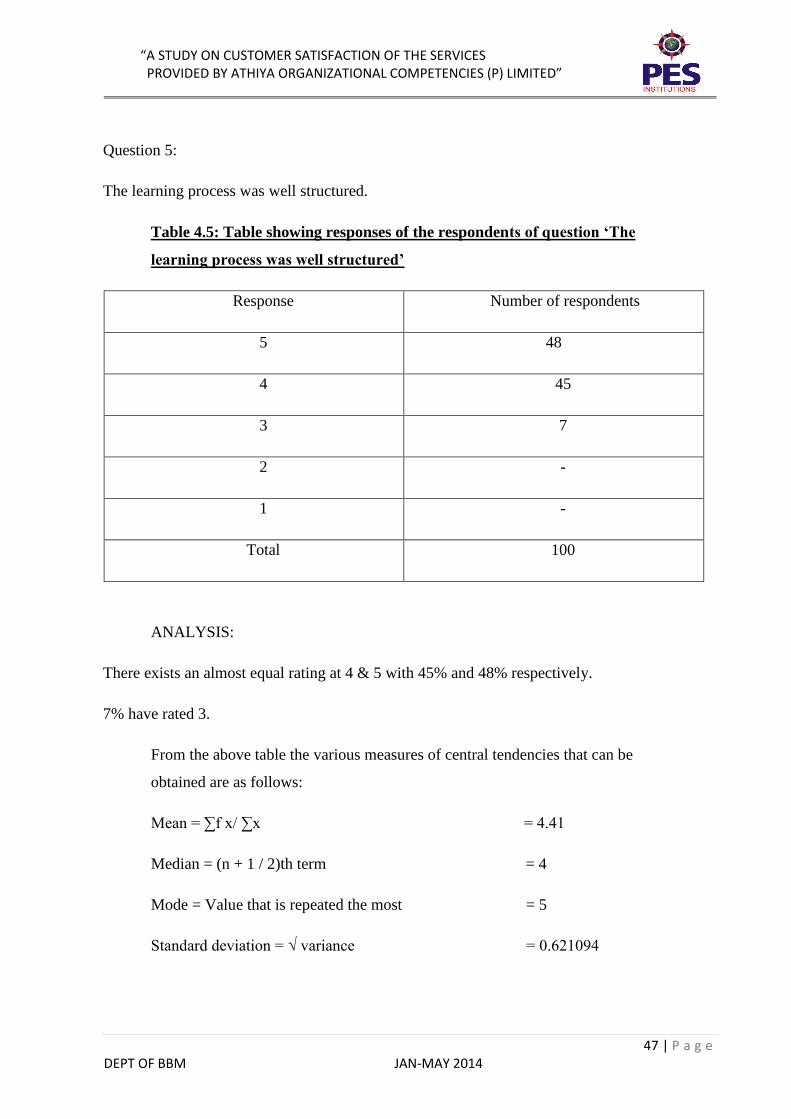
Question 5:
The learning process was well structured.
Table 4.5: Table showing responses of the respondents of question ‘The
learning process was well structured’
Response Number of respondents
5 48
4 45
3 7
2 -
1 -
Total 100
ANALYSIS:
There exists an almost equal rating at 4 & 5 with 45% and 48% respectively.
7% have rated 3.
From the above table the various measures of central tendencies that can be
obtained are as follows:
Mean = ∑f x/ ∑x = 4.41
Median = (n + 1 / 2)th term = 4
Mode = Value that is repeated the most = 5
Standard deviation = √ variance = 0.621094
“A STUDY ON CUSTOMER SATISFACTION OF THE SERVICES PROVIDED BY ATHIYA ORGANIZATIONAL COMPETENCIES (P) LIMITED”
48 | P a g e DEPT OF BBM JAN-MAY 2014
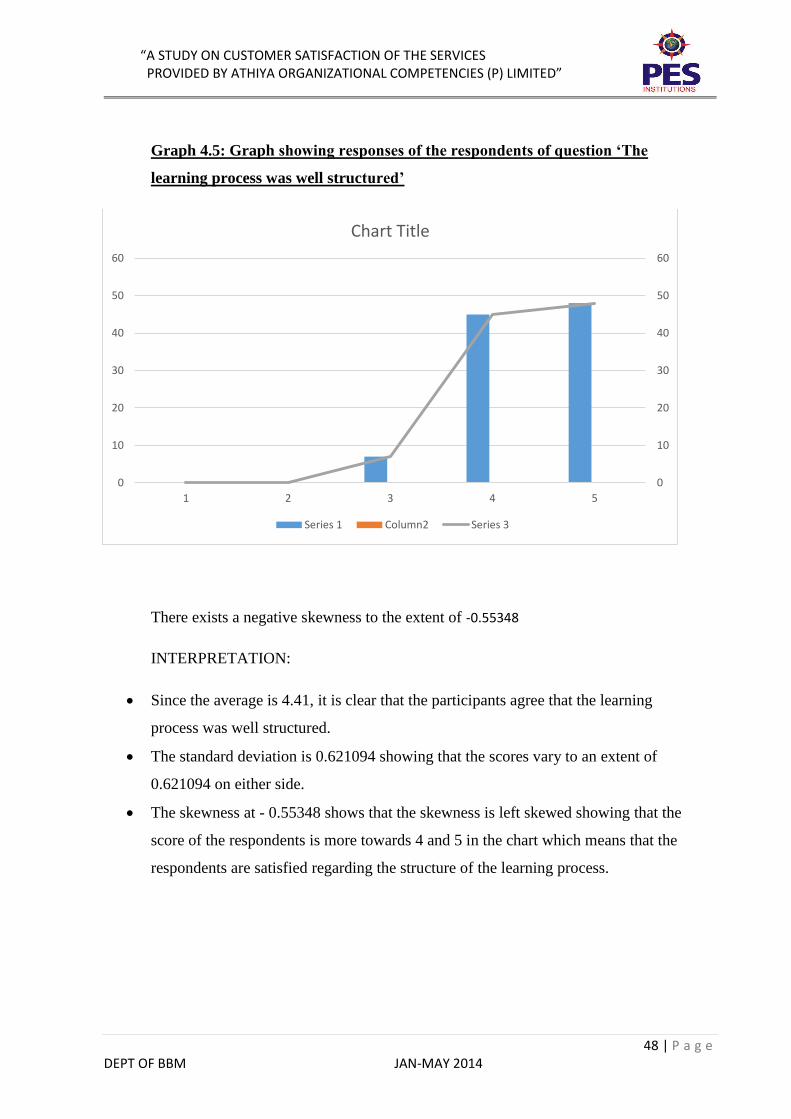
Graph 4.5: Graph showing responses of the respondents of question ‘The
learning process was well structured’
There exists a negative skewness to the extent of -0.55348
INTERPRETATION:
Since the average is 4.41, it is clear that the participants agree that the learning
process was well structured.
The standard deviation is 0.621094 showing that the scores vary to an extent of
0.621094 on either side.
The skewness at - 0.55348 shows that the skewness is left skewed showing that the
score of the respondents is more towards 4 and 5 in the chart which means that the
respondents are satisfied regarding the structure of the learning process.
0
10
20
30
40
50
60
0
10
20
30
40
50
60
1 2 3 4 5
Chart Title
Series 1 Column2 Series 3
“A STUDY ON CUSTOMER SATISFACTION OF THE SERVICES PROVIDED BY ATHIYA ORGANIZATIONAL COMPETENCIES (P) LIMITED”
49 | P a g e DEPT OF BBM JAN-MAY 2014
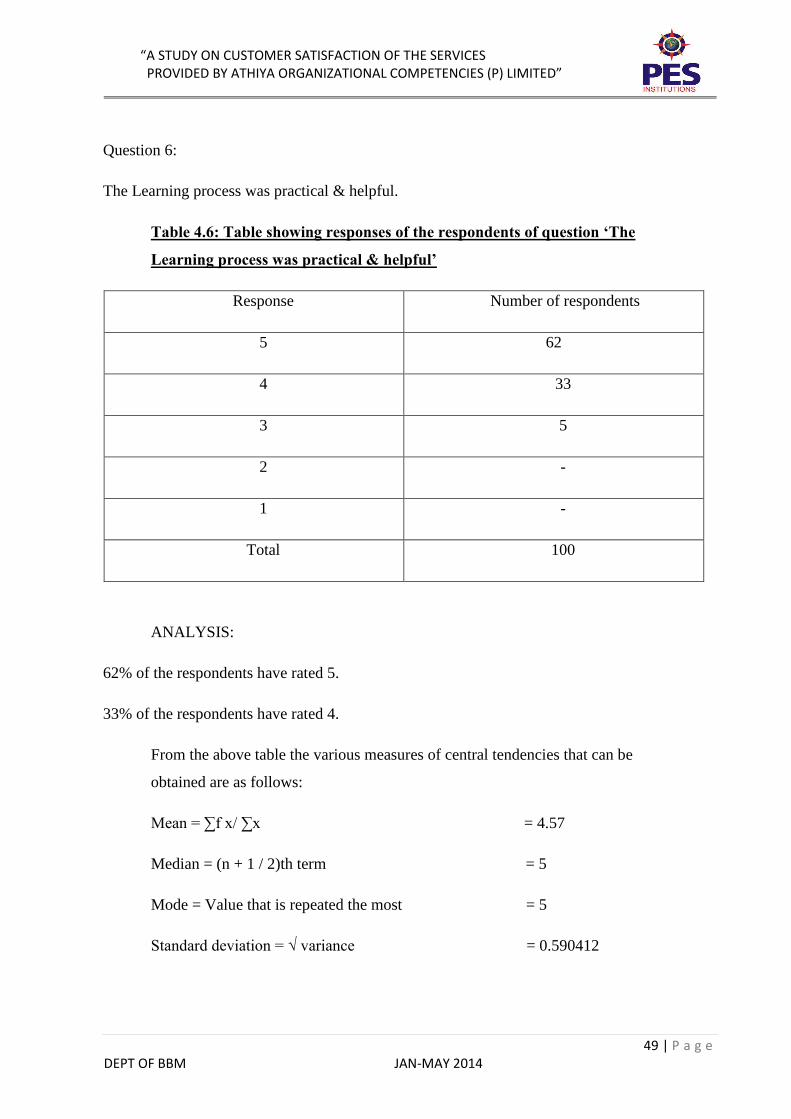
Question 6:
The Learning process was practical & helpful.
Table 4.6: Table showing responses of the respondents of question ‘The
Learning process was practical & helpful’
Response Number of respondents
5 62
4 33
3 5
2 -
1 -
Total 100
ANALYSIS:
62% of the respondents have rated 5.
33% of the respondents have rated 4.
From the above table the various measures of central tendencies that can be
obtained are as follows:
Mean = ∑f x/ ∑x = 4.57
Median = (n + 1 / 2)th term = 5
Mode = Value that is repeated the most = 5
Standard deviation = √ variance = 0.590412
“A STUDY ON CUSTOMER SATISFACTION OF THE SERVICES PROVIDED BY ATHIYA ORGANIZATIONAL COMPETENCIES (P) LIMITED”
50 | P a g e DEPT OF BBM JAN-MAY 2014
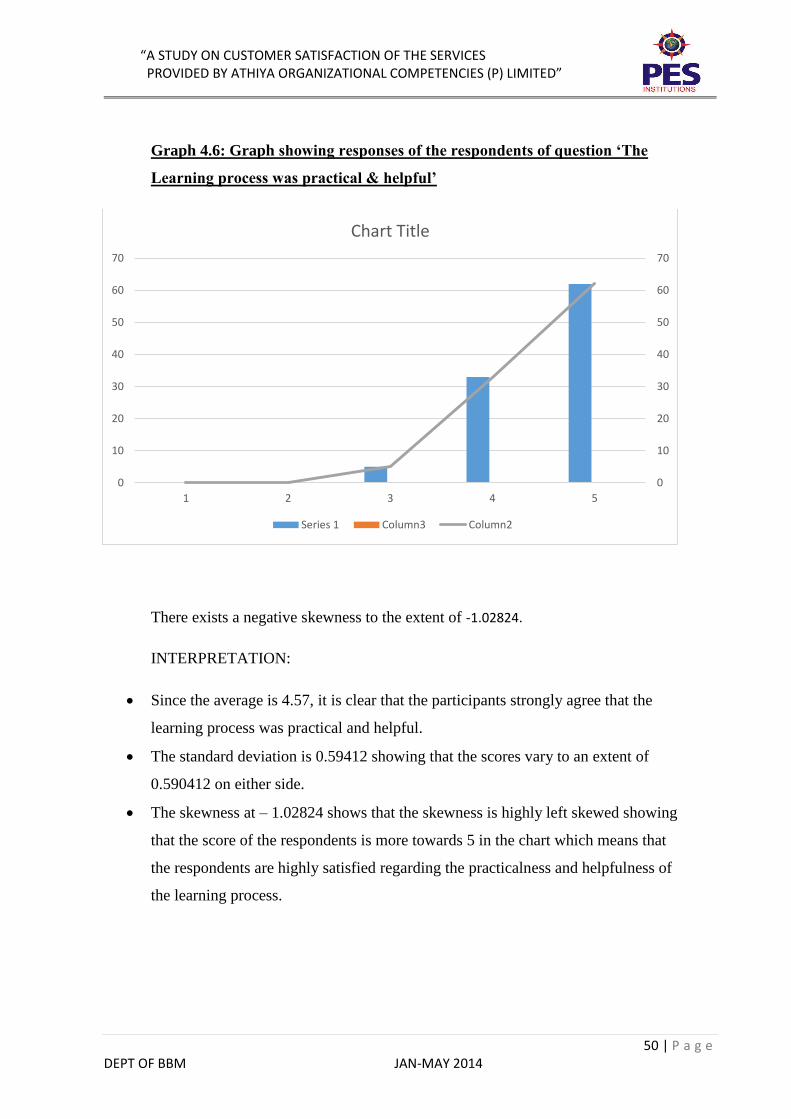
Graph 4.6: Graph showing responses of the respondents of question ‘The
Learning process was practical & helpful’
There exists a negative skewness to the extent of -1.02824.
INTERPRETATION:
Since the average is 4.57, it is clear that the participants strongly agree that the
learning process was practical and helpful.
The standard deviation is 0.59412 showing that the scores vary to an extent of
0.590412 on either side.
The skewness at – 1.02824 shows that the skewness is highly left skewed showing
that the score of the respondents is more towards 5 in the chart which means that
the respondents are highly satisfied regarding the practicalness and helpfulness of
the learning process.
0
10
20
30
40
50
60
70
0
10
20
30
40
50
60
70
1 2 3 4 5
Chart Title
Series 1 Column3 Column2
“A STUDY ON CUSTOMER SATISFACTION OF THE SERVICES PROVIDED BY ATHIYA ORGANIZATIONAL COMPETENCIES (P) LIMITED”
51 | P a g e DEPT OF BBM JAN-MAY 2014
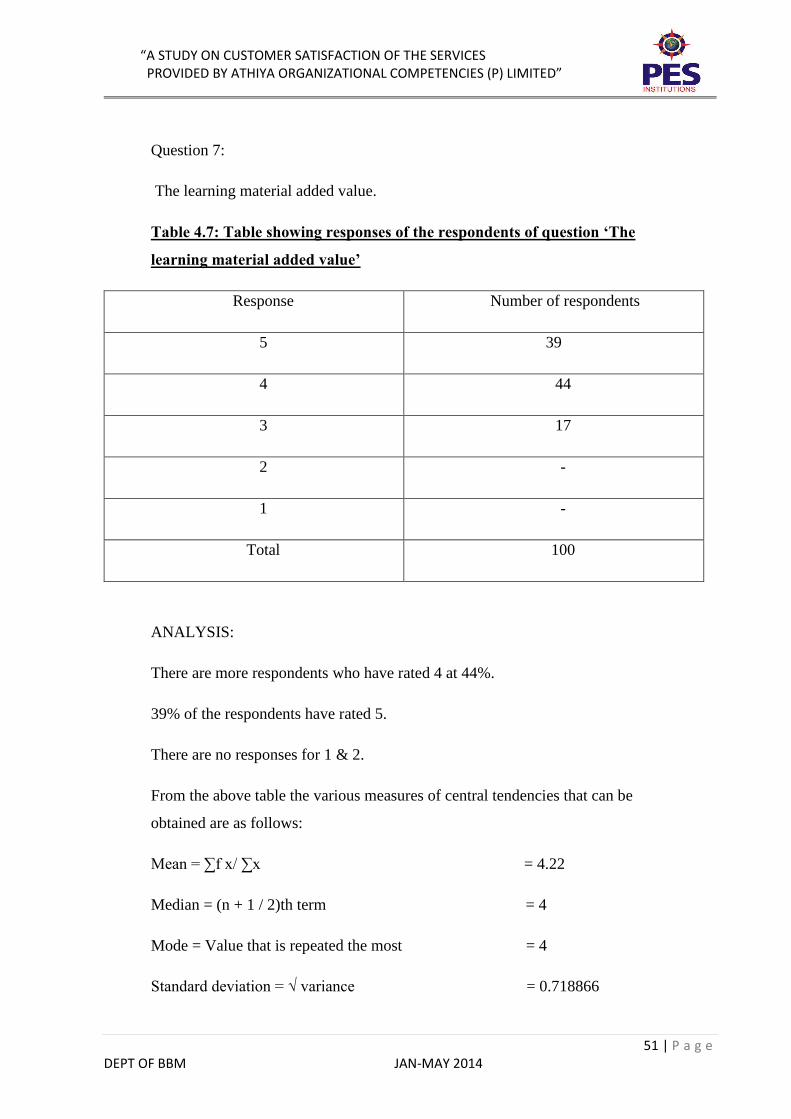
Question 7:
The learning material added value.
Table 4.7: Table showing responses of the respondents of question ‘The
learning material added value’
Response Number of respondents
5 39
4 44
3 17
2 -
1 -
Total 100
ANALYSIS:
There are more respondents who have rated 4 at 44%.
39% of the respondents have rated 5.
There are no responses for 1 & 2.
From the above table the various measures of central tendencies that can be
obtained are as follows:
Mean = ∑f x/ ∑x = 4.22
Median = (n + 1 / 2)th term = 4
Mode = Value that is repeated the most = 4
Standard deviation = √ variance = 0.718866
“A STUDY ON CUSTOMER SATISFACTION OF THE SERVICES PROVIDED BY ATHIYA ORGANIZATIONAL COMPETENCIES (P) LIMITED”
52 | P a g e DEPT OF BBM JAN-MAY 2014
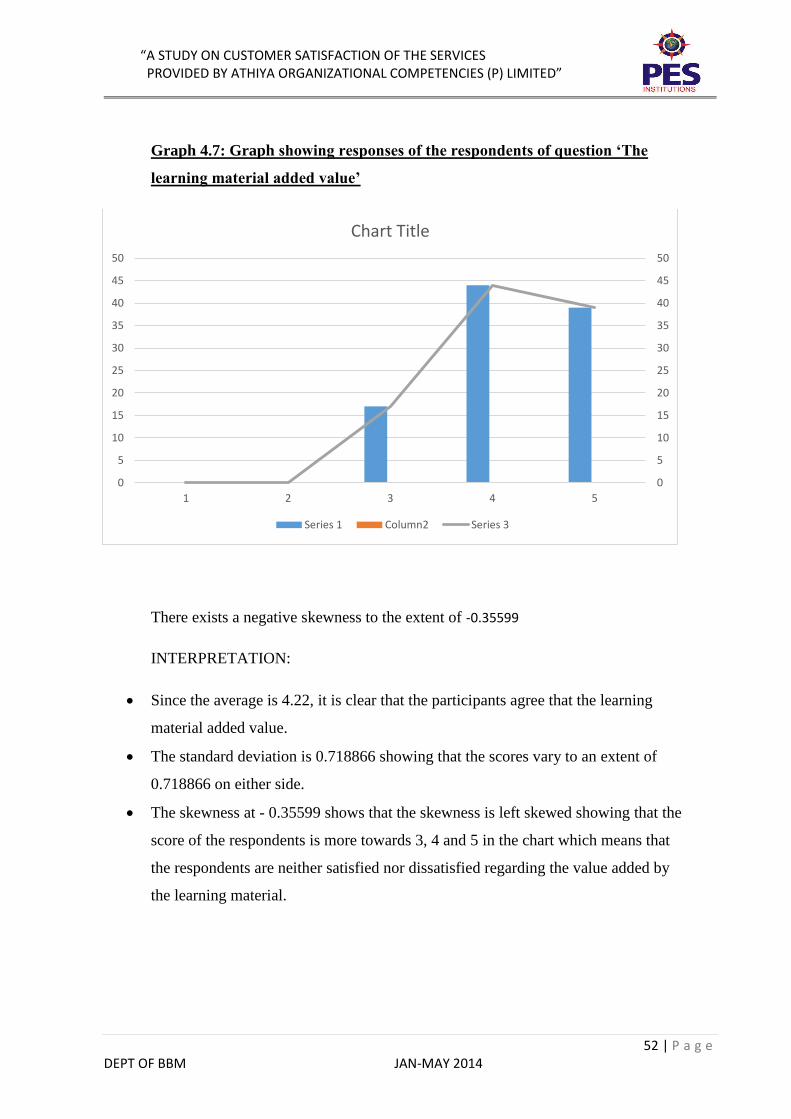
Graph 4.7: Graph showing responses of the respondents of question ‘The
learning material added value’
There exists a negative skewness to the extent of -0.35599
INTERPRETATION:
Since the average is 4.22, it is clear that the participants agree that the learning
material added value.
The standard deviation is 0.718866 showing that the scores vary to an extent of
0.718866 on either side.
The skewness at - 0.35599 shows that the skewness is left skewed showing that the
score of the respondents is more towards 3, 4 and 5 in the chart which means that
the respondents are neither satisfied nor dissatisfied regarding the value added by
the learning material.
0
5
10
15
20
25
30
35
40
45
50
0
5
10
15
20
25
30
35
40
45
50
1 2 3 4 5
Chart Title
Series 1 Column2 Series 3
“A STUDY ON CUSTOMER SATISFACTION OF THE SERVICES PROVIDED BY ATHIYA ORGANIZATIONAL COMPETENCIES (P) LIMITED”
53 | P a g e DEPT OF BBM JAN-MAY 2014
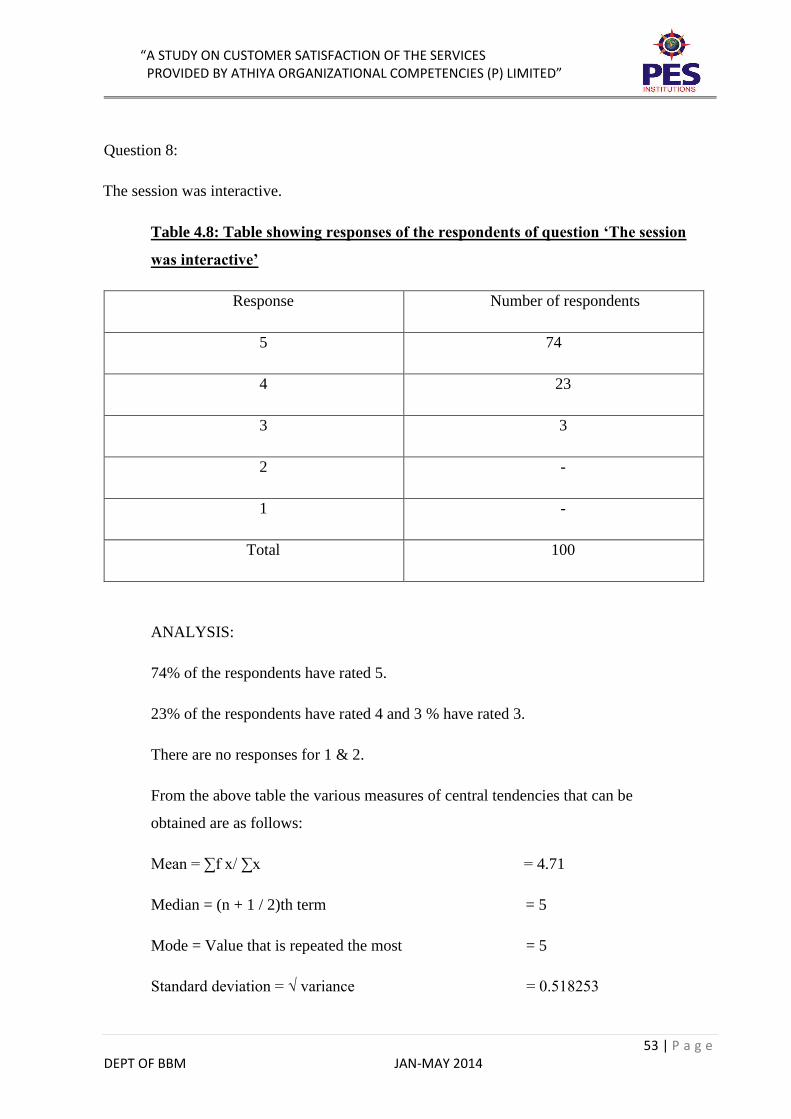
Question 8:
The session was interactive.
Table 4.8: Table showing responses of the respondents of question ‘The session
was interactive’
Response Number of respondents
5 74
4 23
3 3
2 -
1 -
Total 100
ANALYSIS:
74% of the respondents have rated 5.
23% of the respondents have rated 4 and 3 % have rated 3.
There are no responses for 1 & 2.
From the above table the various measures of central tendencies that can be
obtained are as follows:
Mean = ∑f x/ ∑x = 4.71
Median = (n + 1 / 2)th term = 5
Mode = Value that is repeated the most = 5
Standard deviation = √ variance = 0.518253
“A STUDY ON CUSTOMER SATISFACTION OF THE SERVICES PROVIDED BY ATHIYA ORGANIZATIONAL COMPETENCIES (P) LIMITED”
54 | P a g e DEPT OF BBM JAN-MAY 2014
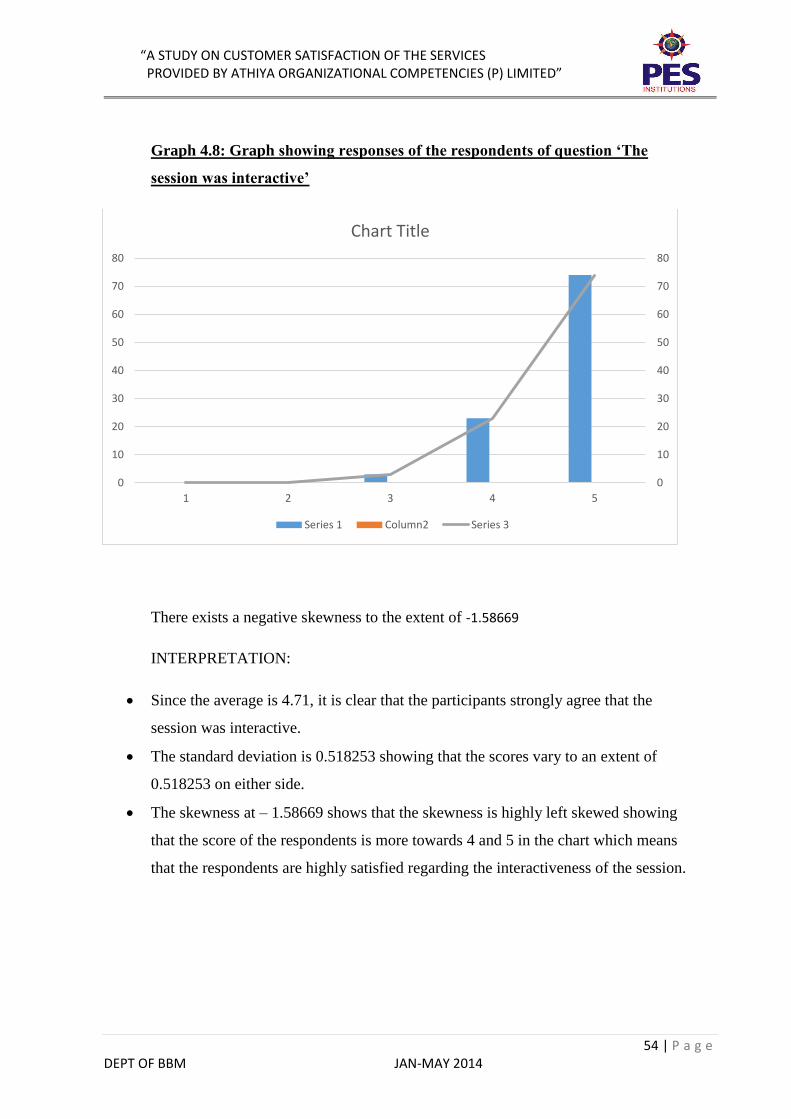
Graph 4.8: Graph showing responses of the respondents of question ‘The
session was interactive’
There exists a negative skewness to the extent of -1.58669
INTERPRETATION:
Since the average is 4.71, it is clear that the participants strongly agree that the
session was interactive.
The standard deviation is 0.518253 showing that the scores vary to an extent of
0.518253 on either side.
The skewness at – 1.58669 shows that the skewness is highly left skewed showing
that the score of the respondents is more towards 4 and 5 in the chart which means
that the respondents are highly satisfied regarding the interactiveness of the session.
0
10
20
30
40
50
60
70
80
0
10
20
30
40
50
60
70
80
1 2 3 4 5
Chart Title
Series 1 Column2 Series 3
“A STUDY ON CUSTOMER SATISFACTION OF THE SERVICES PROVIDED BY ATHIYA ORGANIZATIONAL COMPETENCIES (P) LIMITED”
55 | P a g e DEPT OF BBM JAN-MAY 2014
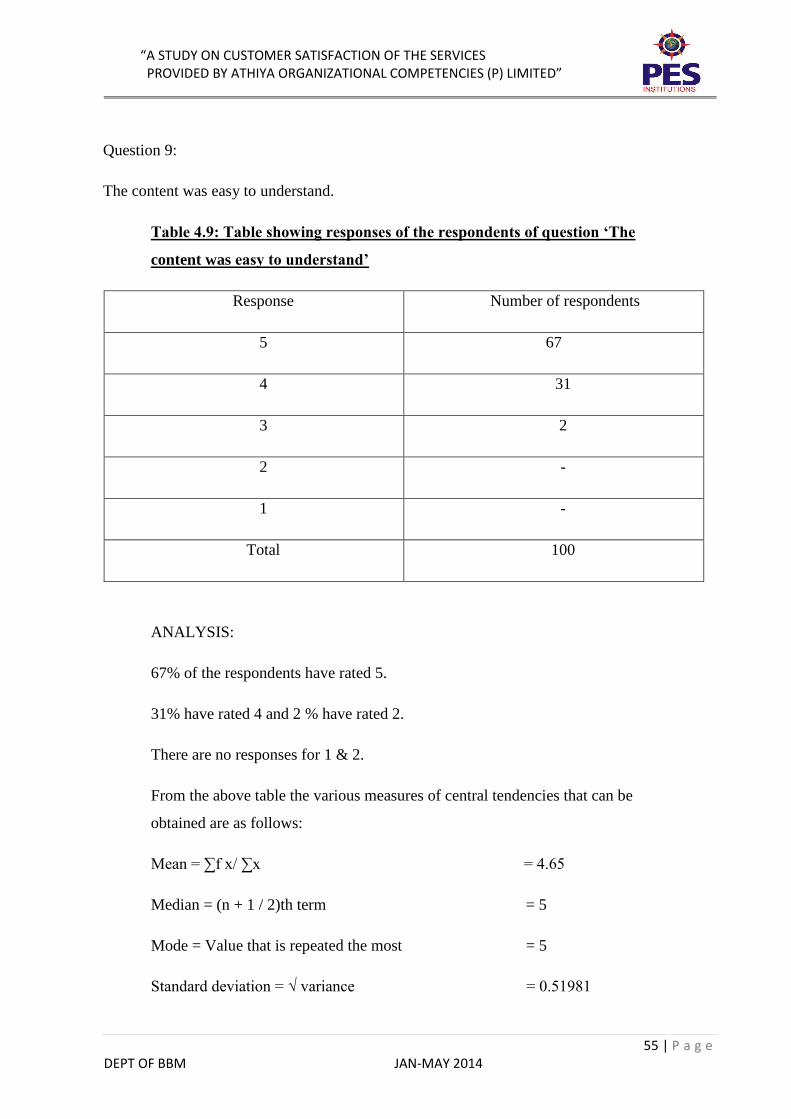
Question 9:
The content was easy to understand.
Table 4.9: Table showing responses of the respondents of question ‘The
content was easy to understand’
Response Number of respondents
5 67
4 31
3 2
2 -
1 -
Total 100
ANALYSIS:
67% of the respondents have rated 5.
31% have rated 4 and 2 % have rated 2.
There are no responses for 1 & 2.
From the above table the various measures of central tendencies that can be
obtained are as follows:
Mean = ∑f x/ ∑x = 4.65
Median = (n + 1 / 2)th term = 5
Mode = Value that is repeated the most = 5
Standard deviation = √ variance = 0.51981
“A STUDY ON CUSTOMER SATISFACTION OF THE SERVICES PROVIDED BY ATHIYA ORGANIZATIONAL COMPETENCIES (P) LIMITED”
56 | P a g e DEPT OF BBM JAN-MAY 2014
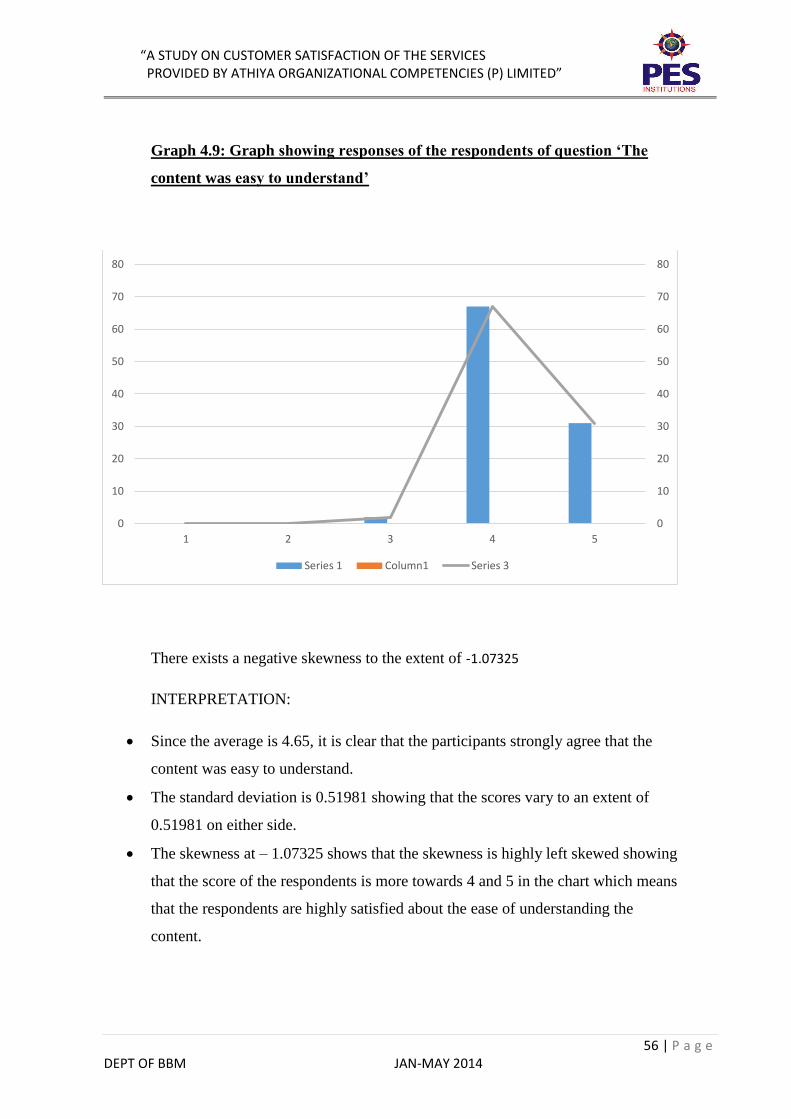
Graph 4.9: Graph showing responses of the respondents of question ‘The
content was easy to understand’
There exists a negative skewness to the extent of -1.07325
INTERPRETATION:
Since the average is 4.65, it is clear that the participants strongly agree that the
content was easy to understand.
The standard deviation is 0.51981 showing that the scores vary to an extent of
0.51981 on either side.
The skewness at – 1.07325 shows that the skewness is highly left skewed showing
that the score of the respondents is more towards 4 and 5 in the chart which means
that the respondents are highly satisfied about the ease of understanding the
content.
0
10
20
30
40
50
60
70
80
0
10
20
30
40
50
60
70
80
1 2 3 4 5
Series 1 Column1 Series 3
“A STUDY ON CUSTOMER SATISFACTION OF THE SERVICES PROVIDED BY ATHIYA ORGANIZATIONAL COMPETENCIES (P) LIMITED”
57 | P a g e DEPT OF BBM JAN-MAY 2014
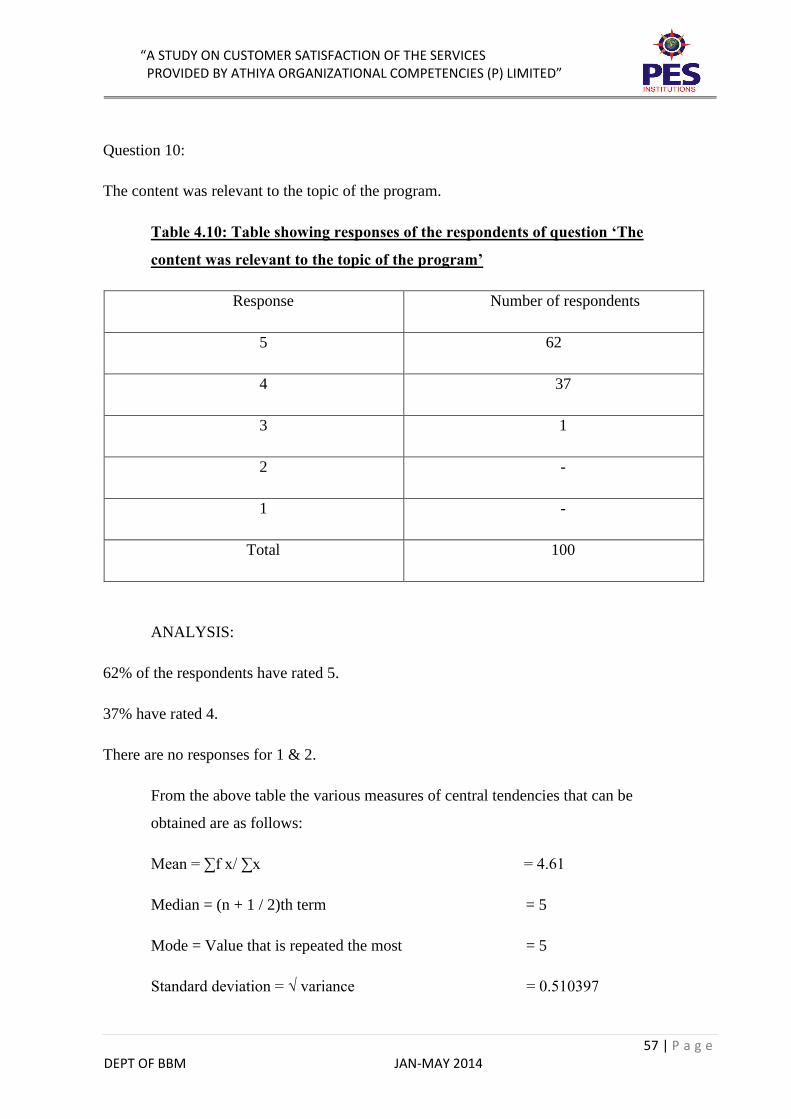
Question 10:
The content was relevant to the topic of the program.
Table 4.10: Table showing responses of the respondents of question ‘The
content was relevant to the topic of the program’
Response Number of respondents
5 62
4 37
3 1
2 -
1 -
Total 100
ANALYSIS:
62% of the respondents have rated 5.
37% have rated 4.
There are no responses for 1 & 2.
From the above table the various measures of central tendencies that can be
obtained are as follows:
Mean = ∑f x/ ∑x = 4.61
Median = (n + 1 / 2)th term = 5
Mode = Value that is repeated the most = 5
Standard deviation = √ variance = 0.510397
“A STUDY ON CUSTOMER SATISFACTION OF THE SERVICES PROVIDED BY ATHIYA ORGANIZATIONAL COMPETENCIES (P) LIMITED”
58 | P a g e DEPT OF BBM JAN-MAY 2014
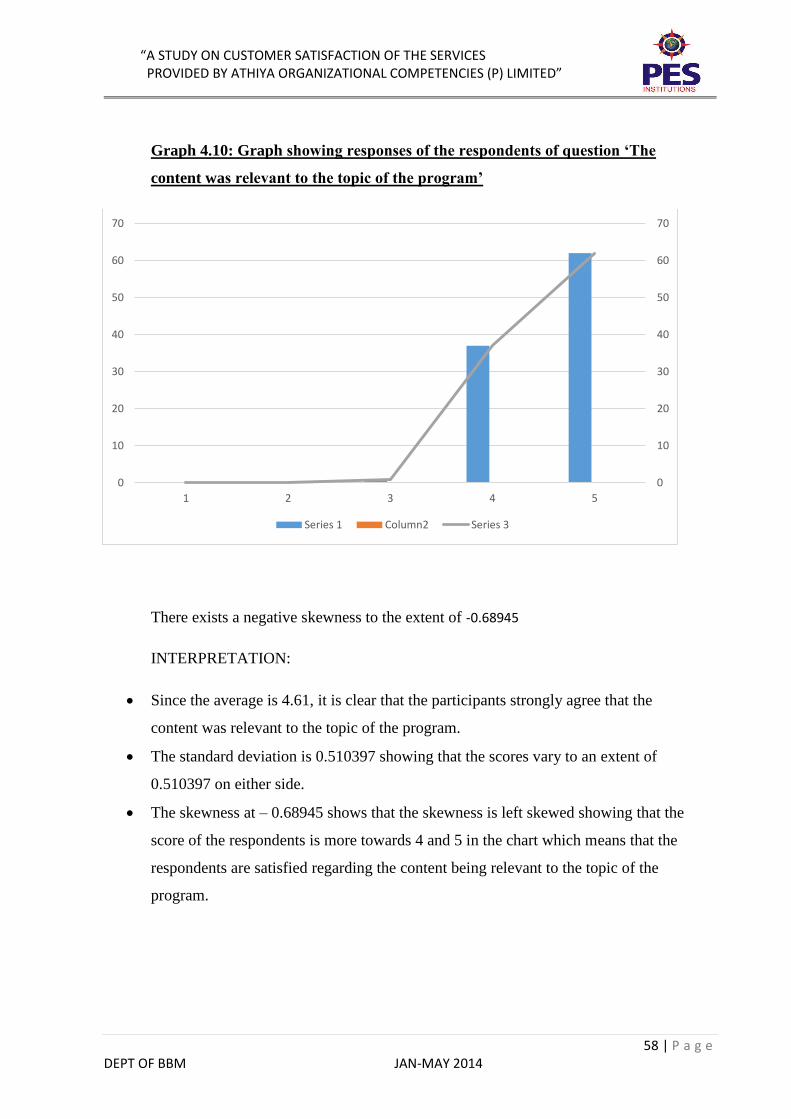
Graph 4.10: Graph showing responses of the respondents of question ‘The
content was relevant to the topic of the program’
There exists a negative skewness to the extent of -0.68945
INTERPRETATION:
Since the average is 4.61, it is clear that the participants strongly agree that the
content was relevant to the topic of the program.
The standard deviation is 0.510397 showing that the scores vary to an extent of
0.510397 on either side.
The skewness at – 0.68945 shows that the skewness is left skewed showing that the
score of the respondents is more towards 4 and 5 in the chart which means that the
respondents are satisfied regarding the content being relevant to the topic of the
program.
0
10
20
30
40
50
60
70
0
10
20
30
40
50
60
70
1 2 3 4 5
Series 1 Column2 Series 3
“A STUDY ON CUSTOMER SATISFACTION OF THE SERVICES PROVIDED BY ATHIYA ORGANIZATIONAL COMPETENCIES (P) LIMITED”
59 | P a g e DEPT OF BBM JAN-MAY 2014
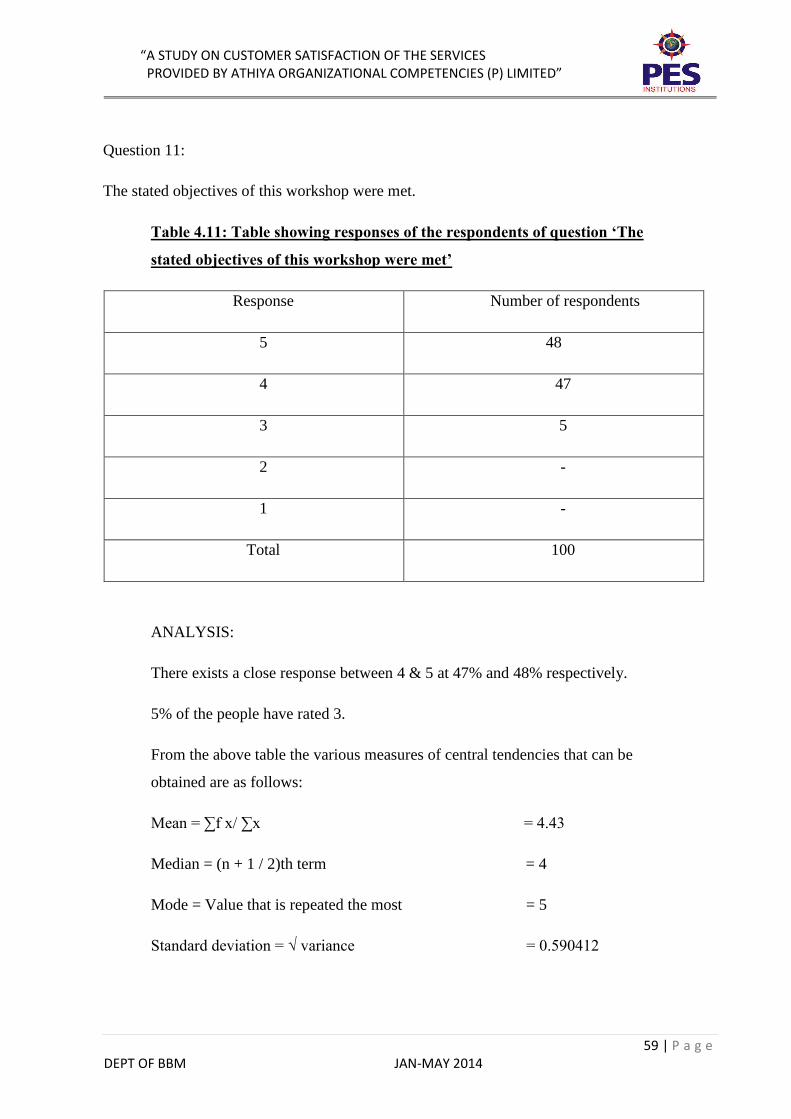
Question 11:
The stated objectives of this workshop were met.
Table 4.11: Table showing responses of the respondents of question ‘The
stated objectives of this workshop were met’
Response Number of respondents
5 48
4 47
3 5
2 -
1 -
Total 100
ANALYSIS:
There exists a close response between 4 & 5 at 47% and 48% respectively.
5% of the people have rated 3.
From the above table the various measures of central tendencies that can be
obtained are as follows:
Mean = ∑f x/ ∑x = 4.43
Median = (n + 1 / 2)th term = 4
Mode = Value that is repeated the most = 5
Standard deviation = √ variance = 0.590412
“A STUDY ON CUSTOMER SATISFACTION OF THE SERVICES PROVIDED BY ATHIYA ORGANIZATIONAL COMPETENCIES (P) LIMITED”
60 | P a g e DEPT OF BBM JAN-MAY 2014
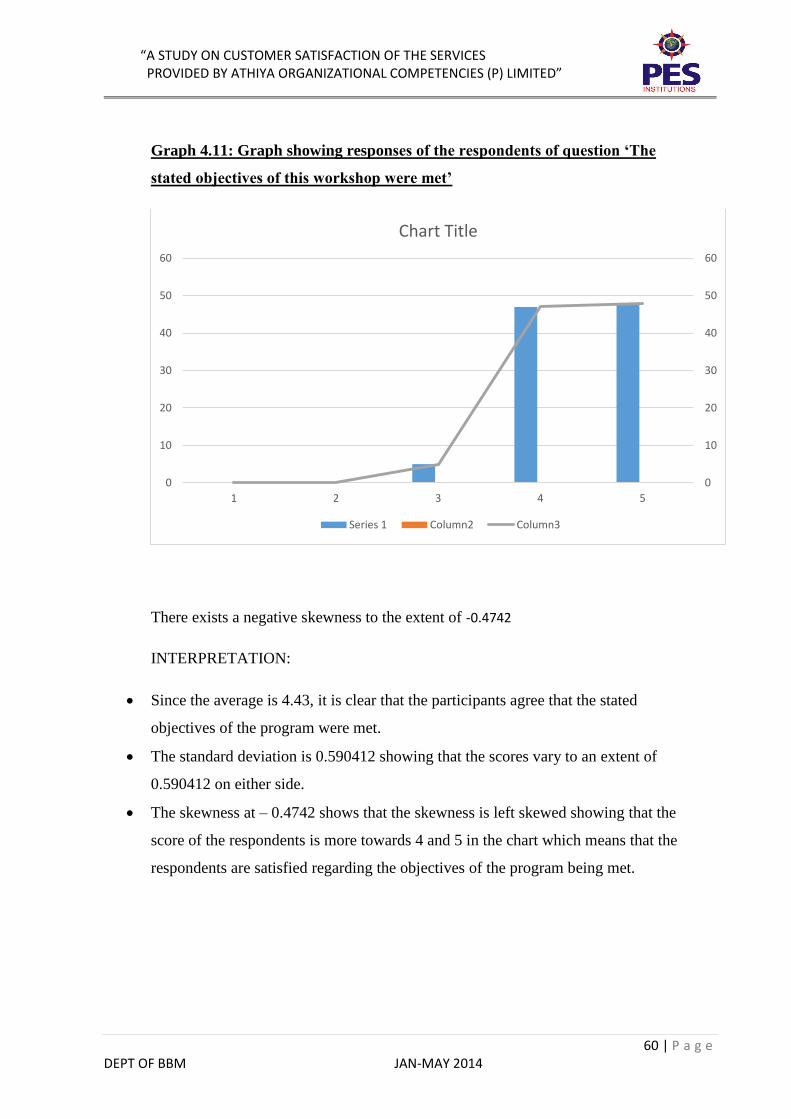
Graph 4.11: Graph showing responses of the respondents of question ‘The
stated objectives of this workshop were met’
There exists a negative skewness to the extent of -0.4742
INTERPRETATION:
Since the average is 4.43, it is clear that the participants agree that the stated
objectives of the program were met.
The standard deviation is 0.590412 showing that the scores vary to an extent of
0.590412 on either side.
The skewness at – 0.4742 shows that the skewness is left skewed showing that the
score of the respondents is more towards 4 and 5 in the chart which means that the
respondents are satisfied regarding the objectives of the program being met.
0
10
20
30
40
50
60
0
10
20
30
40
50
60
1 2 3 4 5
Chart Title
Series 1 Column2 Column3
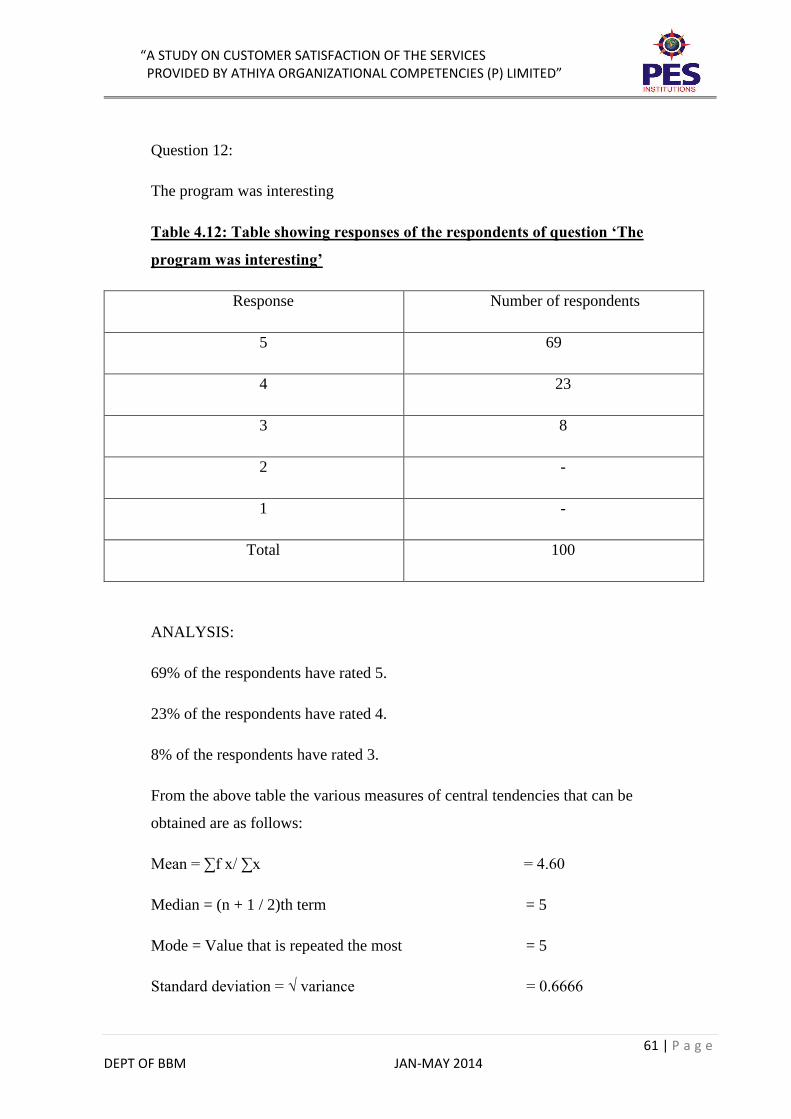
“A STUDY ON CUSTOMER SATISFACTION OF THE SERVICES PROVIDED BY ATHIYA ORGANIZATIONAL COMPETENCIES (P) LIMITED”
61 | P a g e DEPT OF BBM JAN-MAY 2014
Question 12:
The program was interesting
Table 4.12: Table showing responses of the respondents of question ‘The
program was interesting’
Response Number of respondents
5 69
4 23
3 8
2 -
1 -
Total 100
ANALYSIS:
69% of the respondents have rated 5.
23% of the respondents have rated 4.
8% of the respondents have rated 3.
From the above table the various measures of central tendencies that can be
obtained are as follows:
Mean = ∑f x/ ∑x = 4.60
Median = (n + 1 / 2)th term = 5
Mode = Value that is repeated the most = 5
Standard deviation = √ variance = 0.6666
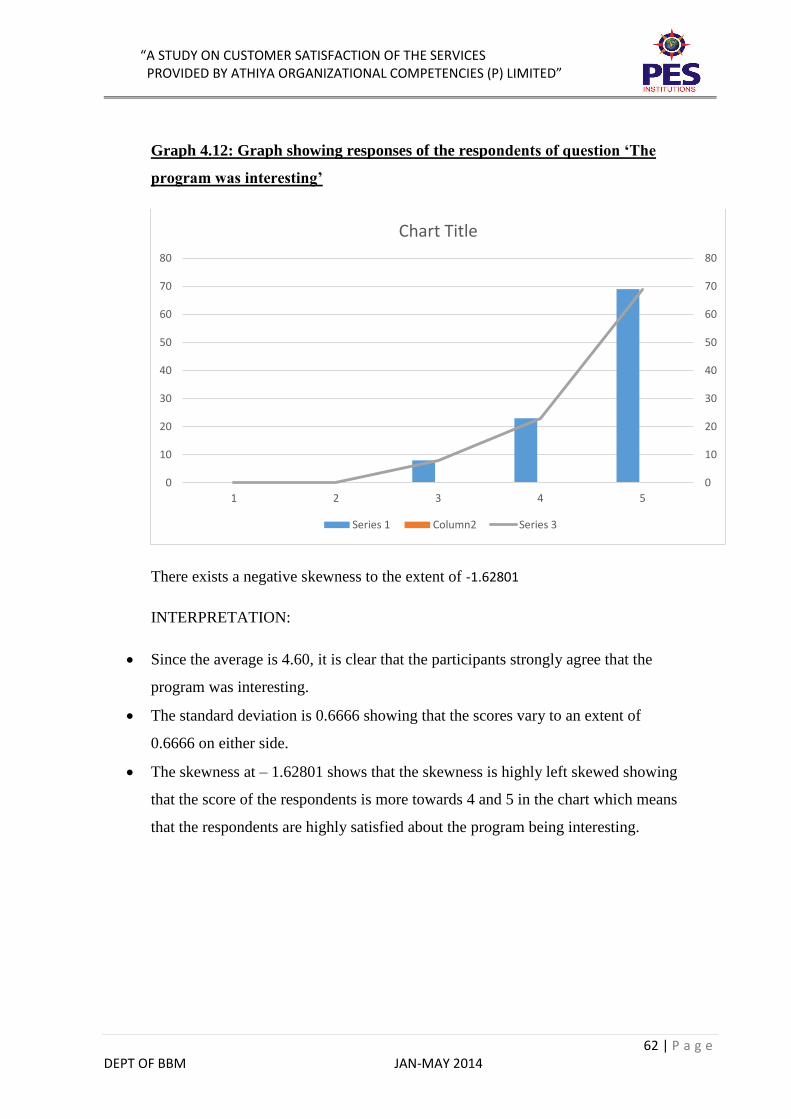
“A STUDY ON CUSTOMER SATISFACTION OF THE SERVICES PROVIDED BY ATHIYA ORGANIZATIONAL COMPETENCIES (P) LIMITED”
62 | P a g e DEPT OF BBM JAN-MAY 2014
Graph 4.12: Graph showing responses of the respondents of question ‘The
program was interesting’
There exists a negative skewness to the extent of -1.62801
INTERPRETATION:
Since the average is 4.60, it is clear that the participants strongly agree that the
program was interesting.
The standard deviation is 0.6666 showing that the scores vary to an extent of
0.6666 on either side.
The skewness at – 1.62801 shows that the skewness is highly left skewed showing
that the score of the respondents is more towards 4 and 5 in the chart which means
that the respondents are highly satisfied about the program being interesting.
0
10
20
30
40
50
60
70
80
0
10
20
30
40
50
60
70
80
1 2 3 4 5
Chart Title
Series 1 Column2 Series 3
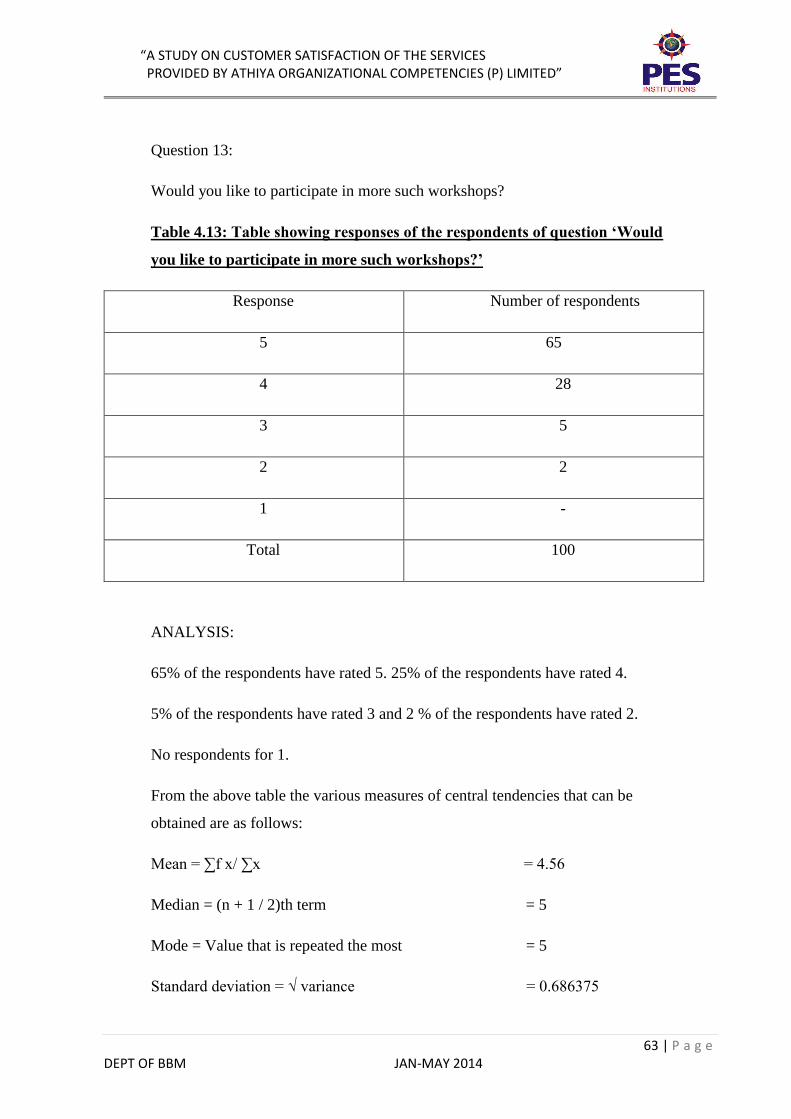
“A STUDY ON CUSTOMER SATISFACTION OF THE SERVICES PROVIDED BY ATHIYA ORGANIZATIONAL COMPETENCIES (P) LIMITED”
63 | P a g e DEPT OF BBM JAN-MAY 2014
Question 13:
Would you like to participate in more such workshops?
Table 4.13: Table showing responses of the respondents of question ‘Would
you like to participate in more such workshops?’
Response Number of respondents
5 65
4 28
3 5
2 2
1 -
Total 100
ANALYSIS:
65% of the respondents have rated 5. 25% of the respondents have rated 4.
5% of the respondents have rated 3 and 2 % of the respondents have rated 2.
No respondents for 1.
From the above table the various measures of central tendencies that can be
obtained are as follows:
Mean = ∑f x/ ∑x = 4.56
Median = (n + 1 / 2)th term = 5
Mode = Value that is repeated the most = 5
Standard deviation = √ variance = 0.686375
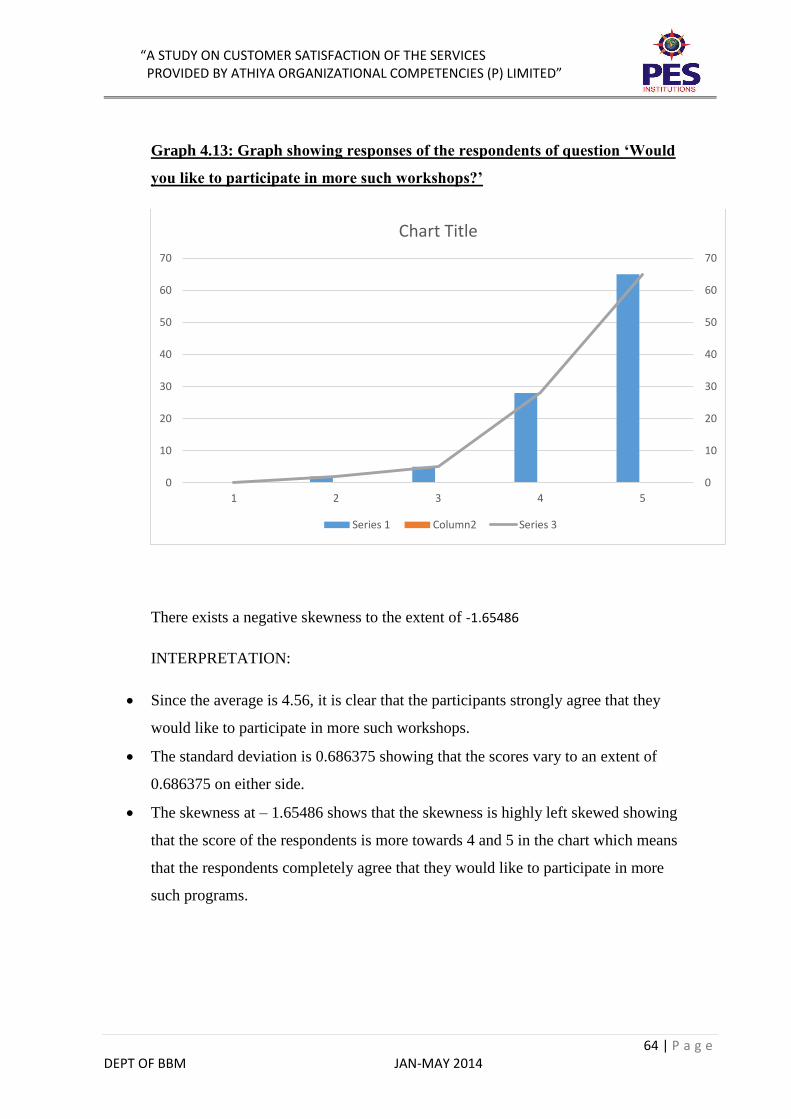
“A STUDY ON CUSTOMER SATISFACTION OF THE SERVICES PROVIDED BY ATHIYA ORGANIZATIONAL COMPETENCIES (P) LIMITED”
64 | P a g e DEPT OF BBM JAN-MAY 2014
Graph 4.13: Graph showing responses of the respondents of question ‘Would
you like to participate in more such workshops?’
There exists a negative skewness to the extent of -1.65486
INTERPRETATION:
Since the average is 4.56, it is clear that the participants strongly agree that they
would like to participate in more such workshops.
The standard deviation is 0.686375 showing that the scores vary to an extent of
0.686375 on either side.
The skewness at – 1.65486 shows that the skewness is highly left skewed showing
that the score of the respondents is more towards 4 and 5 in the chart which means
that the respondents completely agree that they would like to participate in more
such programs.
0
10
20
30
40
50
60
70
0
10
20
30
40
50
60
70
1 2 3 4 5
Chart Title
Series 1 Column2 Series 3
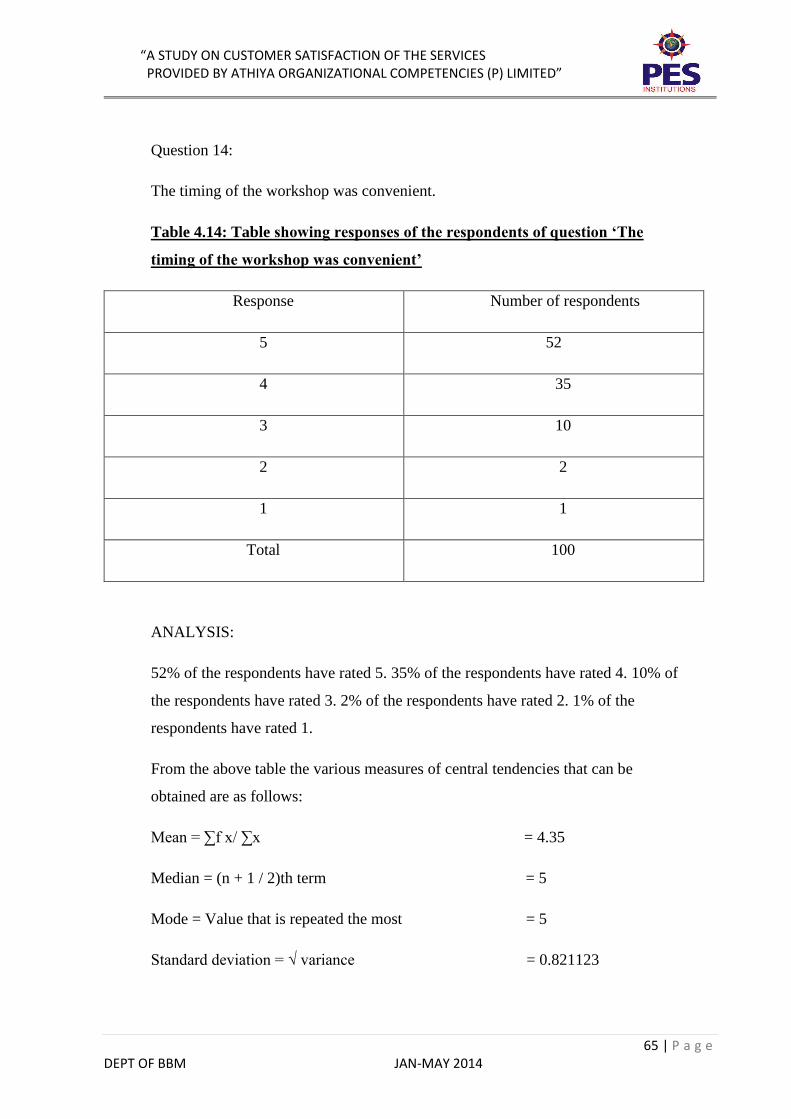
“A STUDY ON CUSTOMER SATISFACTION OF THE SERVICES PROVIDED BY ATHIYA ORGANIZATIONAL COMPETENCIES (P) LIMITED”
65 | P a g e DEPT OF BBM JAN-MAY 2014
Question 14:
The timing of the workshop was convenient.
Table 4.14: Table showing responses of the respondents of question ‘The
timing of the workshop was convenient’
Response Number of respondents
5 52
4 35
3 10
2 2
1 1
Total 100
ANALYSIS:
52% of the respondents have rated 5. 35% of the respondents have rated 4. 10% of
the respondents have rated 3. 2% of the respondents have rated 2. 1% of the
respondents have rated 1.
From the above table the various measures of central tendencies that can be
obtained are as follows:
Mean = ∑f x/ ∑x = 4.35
Median = (n + 1 / 2)th term = 5
Mode = Value that is repeated the most = 5
Standard deviation = √ variance = 0.821123
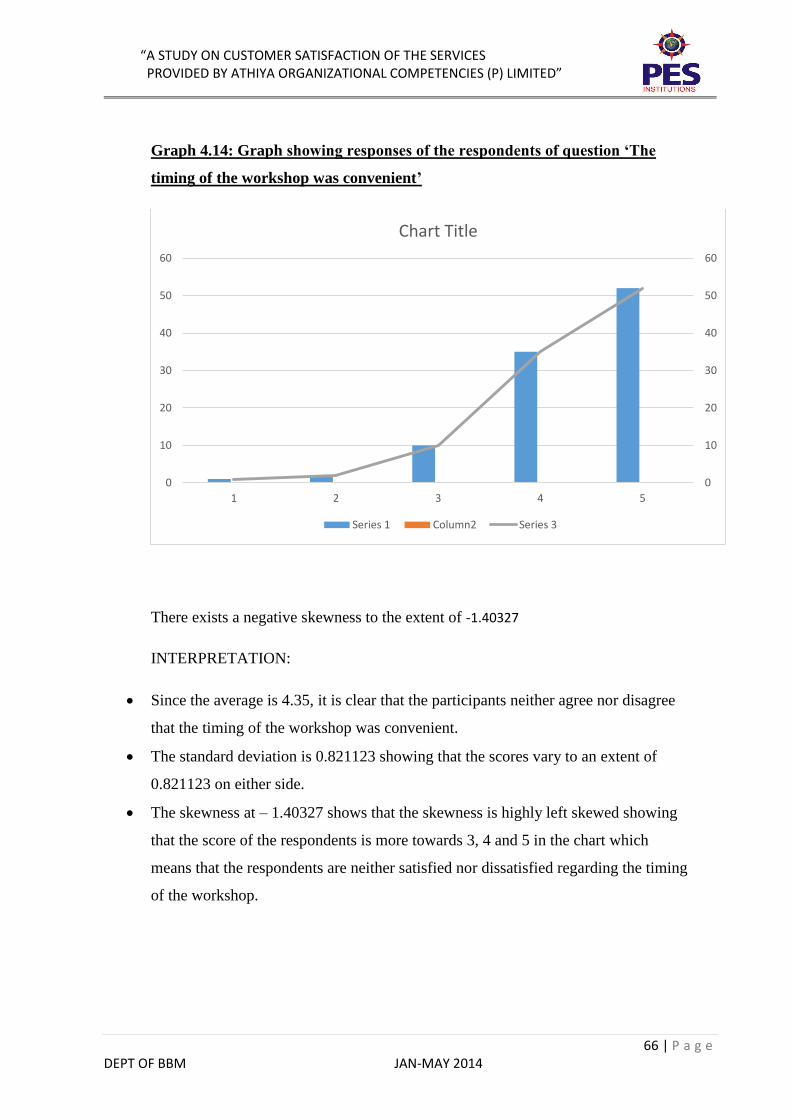
“A STUDY ON CUSTOMER SATISFACTION OF THE SERVICES PROVIDED BY ATHIYA ORGANIZATIONAL COMPETENCIES (P) LIMITED”
66 | P a g e DEPT OF BBM JAN-MAY 2014
Graph 4.14: Graph showing responses of the respondents of question ‘The
timing of the workshop was convenient’
There exists a negative skewness to the extent of -1.40327
INTERPRETATION:
Since the average is 4.35, it is clear that the participants neither agree nor disagree
that the timing of the workshop was convenient.
The standard deviation is 0.821123 showing that the scores vary to an extent of
0.821123 on either side.
The skewness at – 1.40327 shows that the skewness is highly left skewed showing
that the score of the respondents is more towards 3, 4 and 5 in the chart which
means that the respondents are neither satisfied nor dissatisfied regarding the timing
of the workshop.
0
10
20
30
40
50
60
0
10
20
30
40
50
60
1 2 3 4 5
Chart Title
Series 1 Column2 Series 3
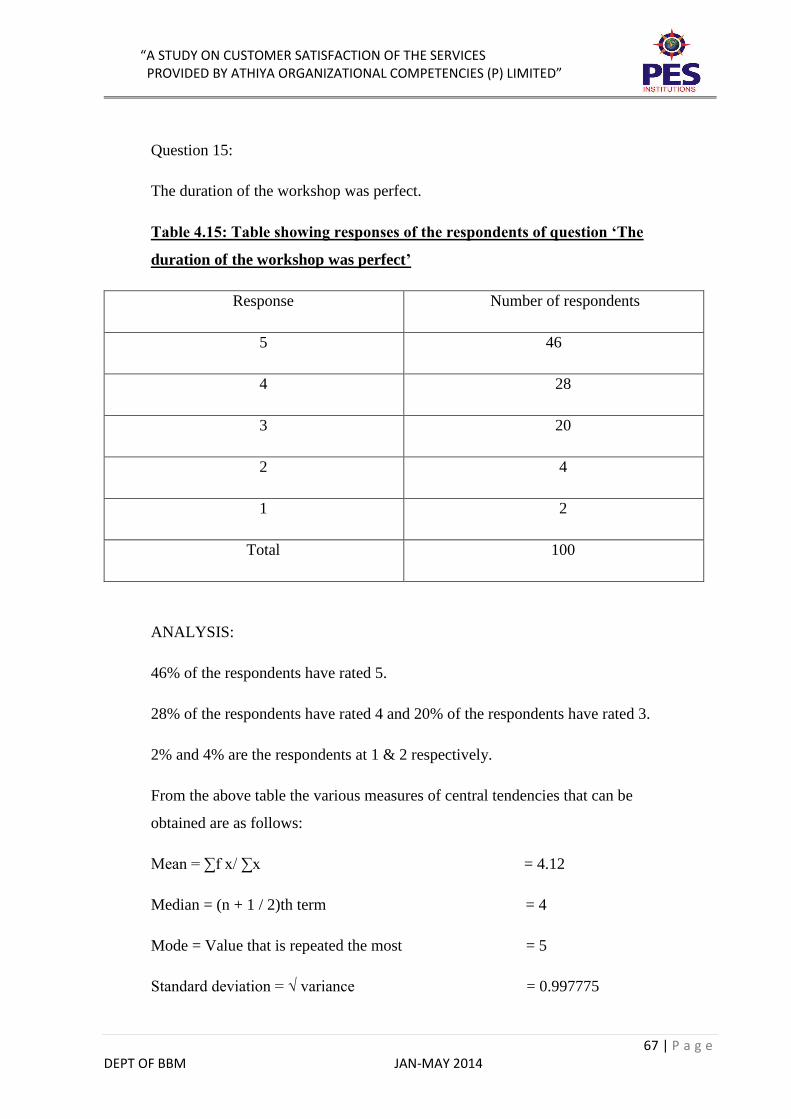
“A STUDY ON CUSTOMER SATISFACTION OF THE SERVICES PROVIDED BY ATHIYA ORGANIZATIONAL COMPETENCIES (P) LIMITED”
67 | P a g e DEPT OF BBM JAN-MAY 2014
Question 15:
The duration of the workshop was perfect.
Table 4.15: Table showing responses of the respondents of question ‘The
duration of the workshop was perfect’
Response Number of respondents
5 46
4 28
3 20
2 4
1 2
Total 100
ANALYSIS:
46% of the respondents have rated 5.
28% of the respondents have rated 4 and 20% of the respondents have rated 3.
2% and 4% are the respondents at 1 & 2 respectively.
From the above table the various measures of central tendencies that can be
obtained are as follows:
Mean = ∑f x/ ∑x = 4.12
Median = (n + 1 / 2)th term = 4
Mode = Value that is repeated the most = 5
Standard deviation = √ variance = 0.997775
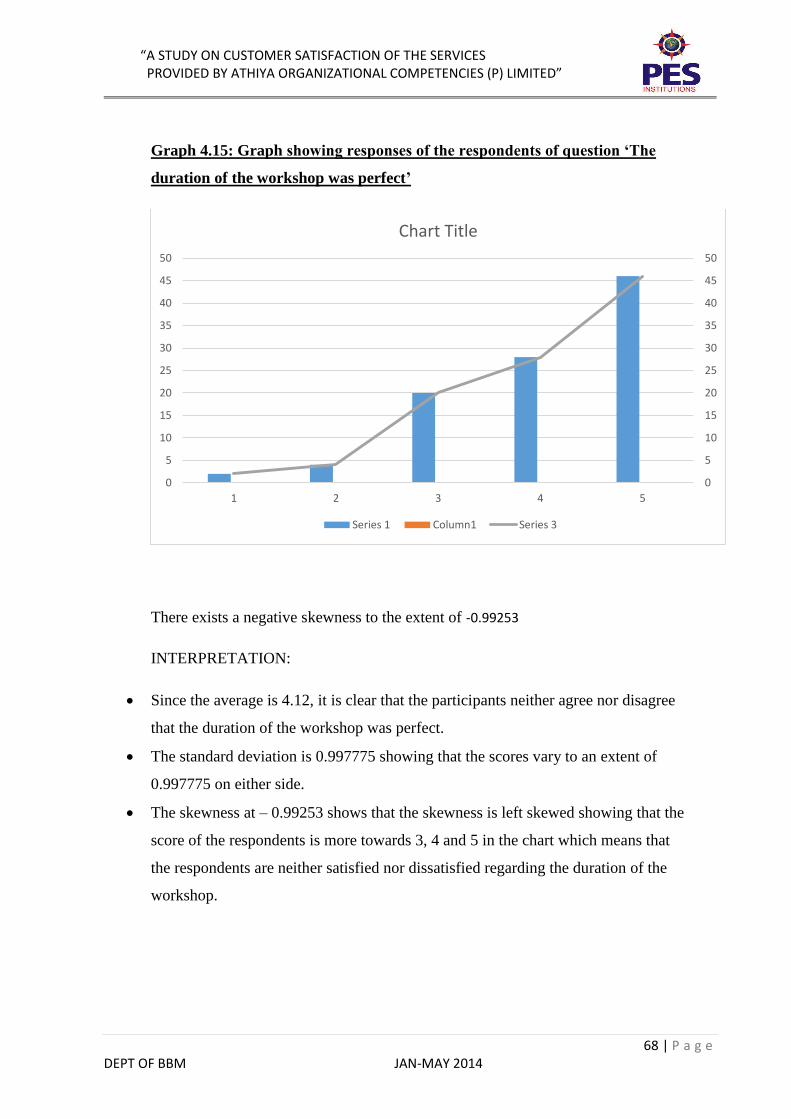
“A STUDY ON CUSTOMER SATISFACTION OF THE SERVICES PROVIDED BY ATHIYA ORGANIZATIONAL COMPETENCIES (P) LIMITED”
68 | P a g e DEPT OF BBM JAN-MAY 2014
Graph 4.15: Graph showing responses of the respondents of question ‘The
duration of the workshop was perfect’
There exists a negative skewness to the extent of -0.99253
INTERPRETATION:
Since the average is 4.12, it is clear that the participants neither agree nor disagree
that the duration of the workshop was perfect.
The standard deviation is 0.997775 showing that the scores vary to an extent of
0.997775 on either side.
The skewness at – 0.99253 shows that the skewness is left skewed showing that the
score of the respondents is more towards 3, 4 and 5 in the chart which means that
the respondents are neither satisfied nor dissatisfied regarding the duration of the
workshop.
0
5
10
15
20
25
30
35
40
45
50
0
5
10
15
20
25
30
35
40
45
50
1 2 3 4 5
Chart Title
Series 1 Column1 Series 3
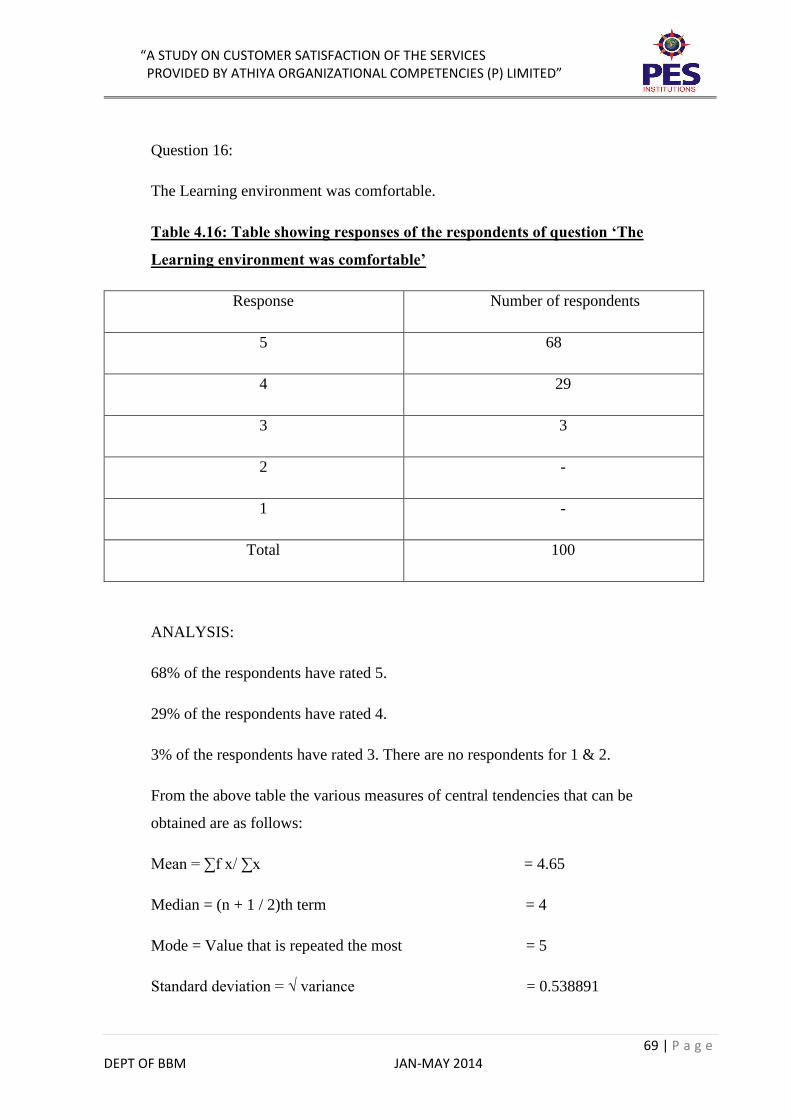
“A STUDY ON CUSTOMER SATISFACTION OF THE SERVICES PROVIDED BY ATHIYA ORGANIZATIONAL COMPETENCIES (P) LIMITED”
69 | P a g e DEPT OF BBM JAN-MAY 2014
Question 16:
The Learning environment was comfortable.
Table 4.16: Table showing responses of the respondents of question ‘The
Learning environment was comfortable’
Response Number of respondents
5 68
4 29
3 3
2 -
1 -
Total 100
ANALYSIS:
68% of the respondents have rated 5.
29% of the respondents have rated 4.
3% of the respondents have rated 3. There are no respondents for 1 & 2.
From the above table the various measures of central tendencies that can be
obtained are as follows:
Mean = ∑f x/ ∑x = 4.65
Median = (n + 1 / 2)th term = 4
Mode = Value that is repeated the most = 5
Standard deviation = √ variance = 0.538891
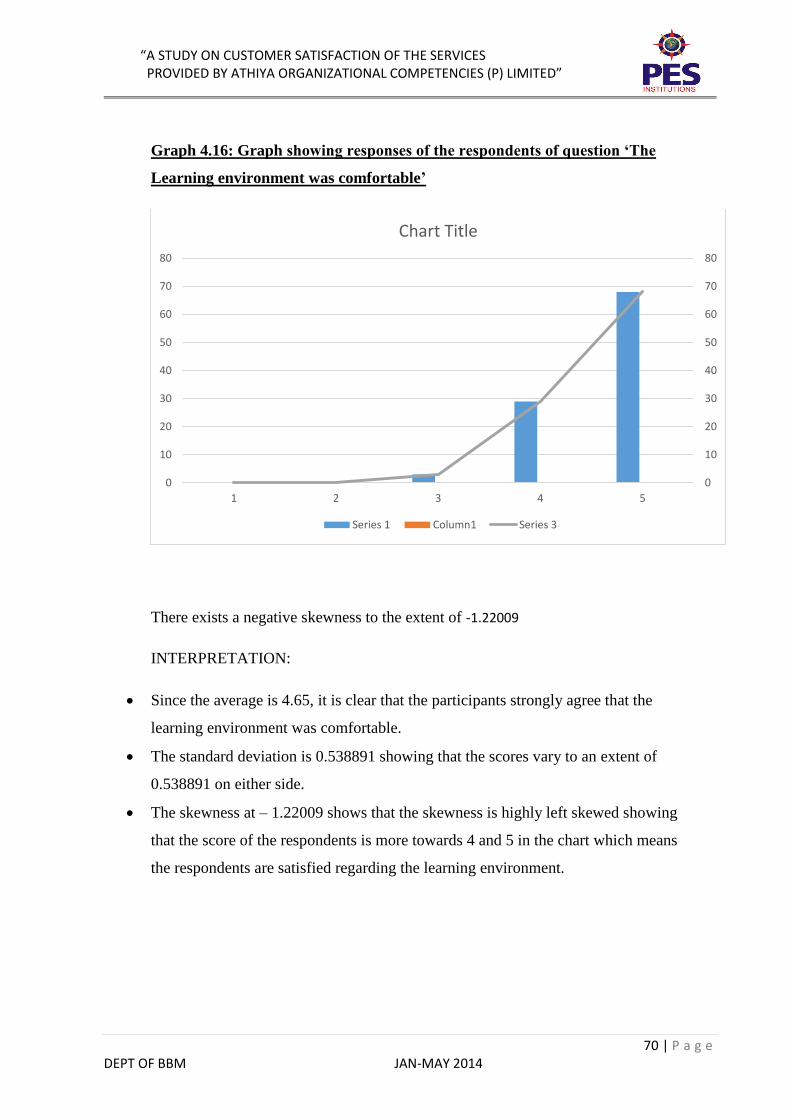
“A STUDY ON CUSTOMER SATISFACTION OF THE SERVICES PROVIDED BY ATHIYA ORGANIZATIONAL COMPETENCIES (P) LIMITED”
70 | P a g e DEPT OF BBM JAN-MAY 2014
Graph 4.16: Graph showing responses of the respondents of question ‘The
Learning environment was comfortable’
There exists a negative skewness to the extent of -1.22009
INTERPRETATION:
Since the average is 4.65, it is clear that the participants strongly agree that the
learning environment was comfortable.
The standard deviation is 0.538891 showing that the scores vary to an extent of
0.538891 on either side.
The skewness at – 1.22009 shows that the skewness is highly left skewed showing
that the score of the respondents is more towards 4 and 5 in the chart which means
the respondents are satisfied regarding the learning environment.
0
10
20
30
40
50
60
70
80
0
10
20
30
40
50
60
70
80
1 2 3 4 5
Chart Title
Series 1 Column1 Series 3
“A STUDY ON CUSTOMER SATISFACTION OF THE SERVICES PROVIDED BY ATHIYA ORGANIZATIONAL COMPETENCIES (P) LIMITED”
71 | P a g e DEPT OF BBM JAN-MAY 2014
FINDINGS, SUGGESTIONS &CONCLUSION
Findings
From the project “A study on customer satisfaction of the services provided by
Athiya Organizational Competencies (P) Limited”,
The following observations have been made from the questionnaire:
It is clear that the participants strongly agree that the trainer had good knowledge
and expertise as the mean is 4.65
It is clear that the participants strongly agree that the trainer is able to give relevant
examples as there exists a high negative skewness at -0.91652
The respondents are highly satisfied regarding the trainer’s attitude towards
answering all queries as the mean is high at 4.72
The respondents are satisfied regarding the trainer’s ability to give helpful
observational tips as there exists a negative skewness at -0.73568
It is clear that the participants agree that the learning process was well structured as
the average obtained is 4.41
It is clear that the participants strongly agree that the learning process was practical
and helpful since the skewness was high at – 1.02824
The respondents are neither satisfied nor dissatisfied regarding the value added by
the learning material since the average is low at only 4.22 and the standard
deviation at 0.718866. There also existed low skewness at 0.35599
The respondents are highly satisfied regarding the interactiveness of the session as
the mean obtained is 4.71
The participants strongly agree that the content was easy to understand as the mean
that is obtained is 4.65
The respondents are satisfied regarding the content being relevant to the topic of the
program as there exists a high negative skewness at -1.07325
The participants agree that the stated objectives of the program were met as the
mean obtained is 4.43
The participants strongly agree that the program was interesting as the skewness is
high at -1.62801
“A STUDY ON CUSTOMER SATISFACTION OF THE SERVICES PROVIDED BY ATHIYA ORGANIZATIONAL COMPETENCIES (P) LIMITED”
72 | P a g e DEPT OF BBM JAN-MAY 2014
The respondents completely agree that they would like to participate in more such
programs since there exists a high average at 4.56
The respondents are neither satisfied nor dissatisfied regarding the timing of the
workshop since the mean is low at 4.35
The respondents are neither satisfied nor dissatisfied regarding the duration of the
workshop since there exists a skewness at -0.99253 and the responses being close to
3, 4 and 5.
The respondents are satisfied regarding the learning environment since the mean is
high at 4.65
The following general observations have been made:
The workshops conducted have been useful to the customers to improve their
professional/business skills
The overall average of the customers who have availed the services of Athiya is
4.52 which on the likert scale lies between highly satisfactory and satisfactory thus
being a positive response.
Customers have a fairly decent impression regarding Athiya
Athiya’s primary focus is to ensure that the participants learn and understand what
is being taught by them
Most questions like trainer’s knowledge, relevant examples, attitude towards
answering queries, content and so on have had positive responses from the
customers
Timing and duration poses as a threat to customer satisfaction.
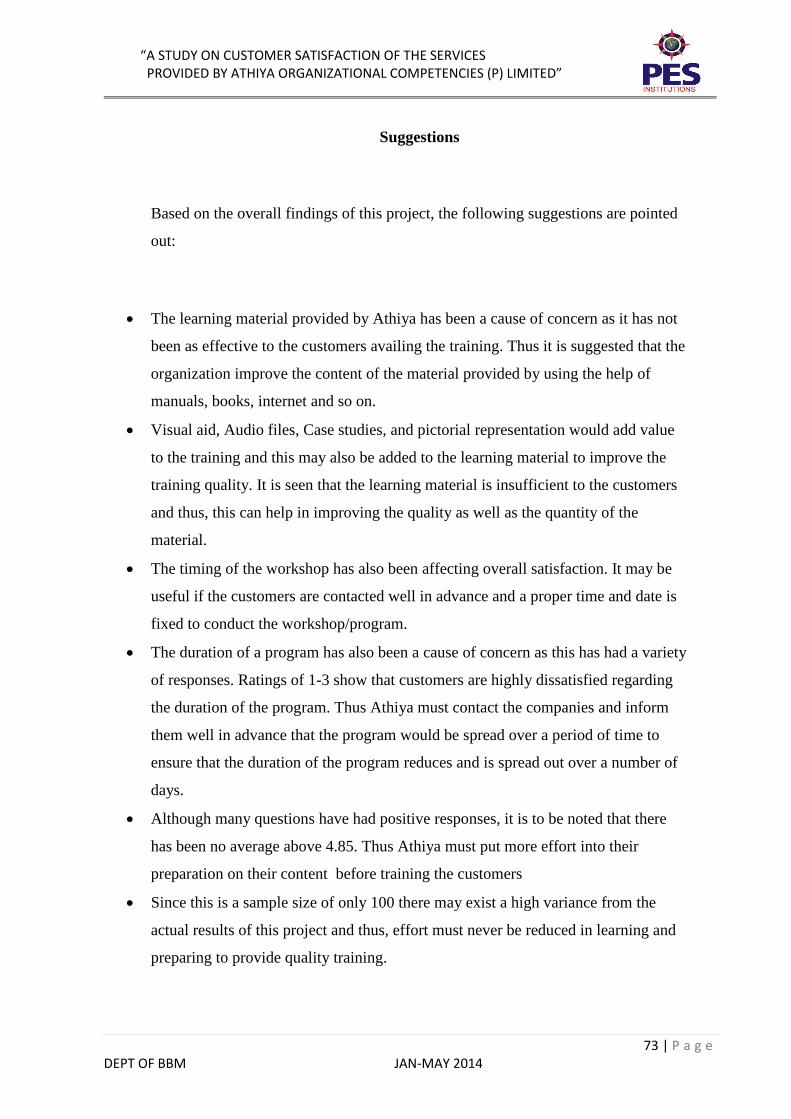
“A STUDY ON CUSTOMER SATISFACTION OF THE SERVICES PROVIDED BY ATHIYA ORGANIZATIONAL COMPETENCIES (P) LIMITED”
73 | P a g e DEPT OF BBM JAN-MAY 2014
Suggestions
Based on the overall findings of this project, the following suggestions are pointed
out:
The learning material provided by Athiya has been a cause of concern as it has not
been as effective to the customers availing the training. Thus it is suggested that the
organization improve the content of the material provided by using the help of
manuals, books, internet and so on.
Visual aid, Audio files, Case studies, and pictorial representation would add value
to the training and this may also be added to the learning material to improve the
training quality. It is seen that the learning material is insufficient to the customers
and thus, this can help in improving the quality as well as the quantity of the
material.
The timing of the workshop has also been affecting overall satisfaction. It may be
useful if the customers are contacted well in advance and a proper time and date is
fixed to conduct the workshop/program.
The duration of a program has also been a cause of concern as this has had a variety
of responses. Ratings of 1-3 show that customers are highly dissatisfied regarding
the duration of the program. Thus Athiya must contact the companies and inform
them well in advance that the program would be spread over a period of time to
ensure that the duration of the program reduces and is spread out over a number of
days.
Although many questions have had positive responses, it is to be noted that there
has been no average above 4.85. Thus Athiya must put more effort into their
preparation on their content before training the customers
Since this is a sample size of only 100 there may exist a high variance from the
actual results of this project and thus, effort must never be reduced in learning and
preparing to provide quality training.
“A STUDY ON CUSTOMER SATISFACTION OF THE SERVICES PROVIDED BY ATHIYA ORGANIZATIONAL COMPETENCIES (P) LIMITED”
74 | P a g e DEPT OF BBM JAN-MAY 2014
Conclusion
From this project “A study on customer satisfaction of the services provided by
Athiya Organizational Competencies (P) Limited”, it is evident that customers are an
integral part of every business organisation and ensuring their satisfaction is one of
its major functions in order, not only to attract them, but also to retain them.
Having stated this, the study of customer satisfaction shows that the company is
doing pretty well at ensuring that its customers are satisfied.
The Training and Knowledge industry is a customer oriented industry and apart from
the revenue aspect, which requires the company to attract customers, they must also
concentrate on retaining the customers, which can be accomplished by providing
appropriate services that ensures customer satisfaction.
This project helped ascertain the levels of satisfaction of customers and also to
identify the flaws of the company that affect the satisfaction level of the customers.
This project also helps to understand the various concepts, not only pertaining to
customer satisfaction, but also concepts of marketing as a whole.
“A STUDY ON CUSTOMER SATISFACTION OF THE SERVICES PROVIDED BY ATHIYA ORGANIZATIONAL COMPETENCIES (P) LIMITED”
75 | P a g e DEPT OF BBM JAN-MAY 2014
BIBLIOGRAPHY
Authors: Philip Kotler, Kevin Lane Keller
Title: Marketing Management 14th Edition
Edition: 13th
Publisher: Pearson
Wikipedia- The online encyclopaedia
Measures of central tendency
Terms of Marketing
Customer Satisfaction
www.athiya.com
Marketing Management 5th Edition
Authors: Namakumari, Ramaswamy
Publisher: McGraw Hill Education
www.businessdictionary.com
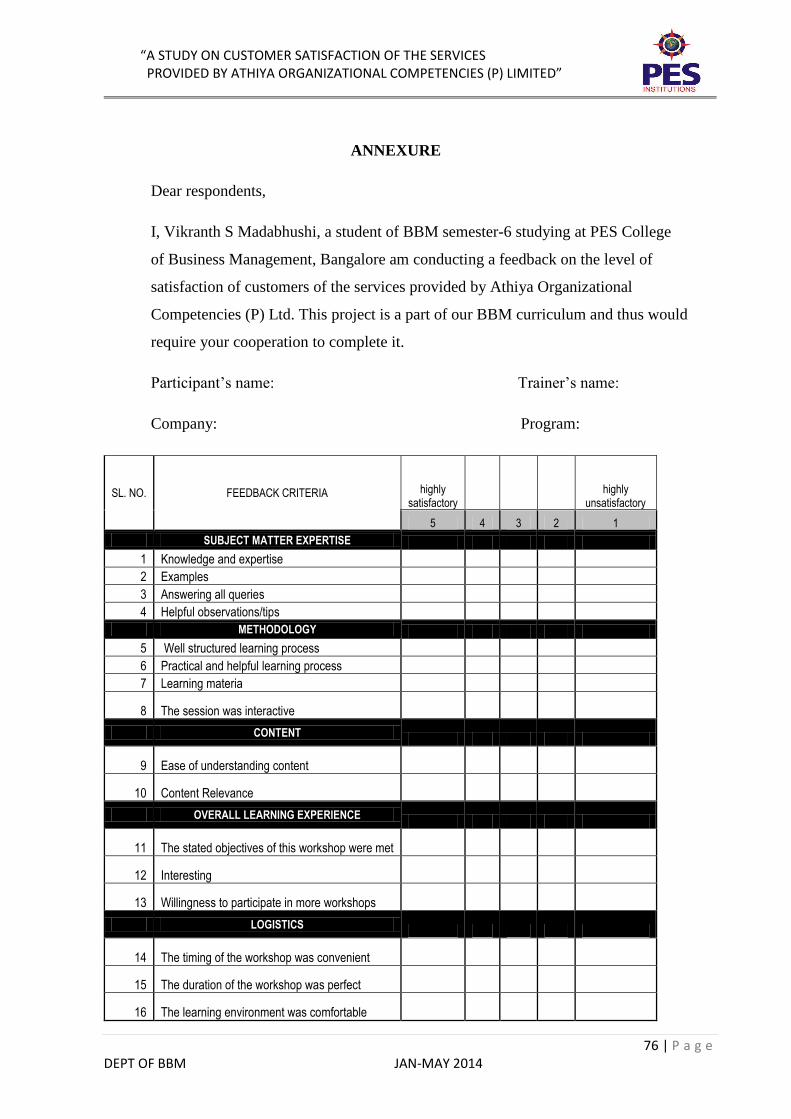
“A STUDY ON CUSTOMER SATISFACTION OF THE SERVICES PROVIDED BY ATHIYA ORGANIZATIONAL COMPETENCIES (P) LIMITED”
76 | P a g e DEPT OF BBM JAN-MAY 2014
ANNEXURE
Dear respondents,
I, Vikranth S Madabhushi, a student of BBM semester-6 studying at PES College
of Business Management, Bangalore am conducting a feedback on the level of
satisfaction of customers of the services provided by Athiya Organizational
Competencies (P) Ltd. This project is a part of our BBM curriculum and thus would
require your cooperation to complete it.
Participant’s name: Trainer’s name:
Company: Program:
SL. NO. FEEDBACK CRITERIA highly satisfactory
highly unsatisfactory
5 4 3 2 1
SUBJECT MATTER EXPERTISE
1 Knowledge and expertise
2 Examples
3 Answering all queries
4 Helpful observations/tips
METHODOLOGY
5 Well structured learning process
6 Practical and helpful learning process
7 Learning materia
8 The session was interactive
CONTENT
9 Ease of understanding content
10 Content Relevance
OVERALL LEARNING EXPERIENCE
11 The stated objectives of this workshop were met
12 Interesting
13 Willingness to participate in more workshops
LOGISTICS
14 The timing of the workshop was convenient
15 The duration of the workshop was perfect
16 The learning environment was comfortable

“A STUDY ON CUSTOMER SATISFACTION OF THE SERVICES PROVIDED BY ATHIYA ORGANIZATIONAL COMPETENCIES (P) LIMITED”
77 | P a g e DEPT OF BBM JAN-MAY 2014