Embed Size (px)
DESCRIPTION
Interparking Annual Report 2009
Citation preview

One GrOup’s visiOn, the pOwer Of quality
Annual Report 2009

Onze merkwaardige realisaties in 2009Key events in 2009
Contents
Belgium • Renovation and opening of the Albertine Square
car park (700 spaces) in Brussels (Palais des Congrès/Square).
• 19 car parks in Antwerp won a European Standard Parking Award.
• Opening of the Control room in Brussels: remote control and management for 21 car parks.
• Use of green energy and target to be 100% carbon neutral by 2010.
• Creation of the Interparking School: 958 training courses provided.
italy • Finalisation of the acquisition of sis,
Italy’s market leader for On Street parking (with a presence in 123 Italian towns).
• Acquisition of the Giolitti car park (453 spaces) in Rome.
france • Marbeuf/Champs-elysées car park in Paris
(585 spaces) added to the portfolio.
spain
• Acquisition of Metropark car parks (subsidiary of Metrovacesa), including 13 car parks (4 634 spaces) in Madrid, Valencia, Tenerife and Santiago de Compostela. Investment of €115.5 million.
• Acquisition of the Constitución car park in Jaén (291 spaces).
romania • Signature of a concession agreement for
the construction and operation of a car park in the centre of Bucharest (University Square).
Key events in 2009
Word of the Managing Director 01
Our history 03
Management report 04
2009 developments 06
Our activities 07
Our car parks 08
Our corporate social responsibility 09
Key figures 10
Consolidated balance sheet 12
Consolidated profit & loss 14
Appendices to the consolidated accounts 16
Balance sheet Interparking s.a. 22
Profit & loss account Interparking s.a. 24
Management 26
Joint statutory auditors’ report 28

word of the Managing Director
In spite of a particularly difficult economic environment, in 2009 Interparking not only demonstrated impressive financial resilience, but also managed to meet a number of diffi-cult challenges, including:
• Meeting the parking needs of around 70 000 000 customers in our 539 car parks.
• Consolidating our position as a market leader in Europe, and specifically in Spain, where we bought Metropark, one of Spain’s biggest public car park operators (investing nearly € 120 million).
• Offering our employees nearly 1 000 training opportunities in the “Interparking School”.
• Seeing 94 of our sites rewarded with a European Standard Parking Award.
• Opening the Control Room in Brussels, following in the footsteps of Antwerp and Berlin.
• Adopting the use of green energy at all of our Belgian sites before rolling out this type of energy across the board.
I would like to take this opportunity to thank all of our employees for the energy and enthusiasm that they have demonstrated in a year which has been full of challenges, as well as to thank our shareholders for the trust that they have had in our teams, and to our
clients for their loyalty.
Roland Cracco Managing Director
Onze merkwaardige realisaties in 2009
1

1 Parking Juan BravoMadrid, Spain
2 Parking Brussels AirportZaventem, Belgium
3 Parking Schloss-Strassen-CenterBerlin, Germany
4 Parking TronchettoVenice, Italy
5 Parking StationstraatUtrecht, The Netherlands
1
2
4 5
3
22

1958Brussels World Fair. To contribute to the event, in 1957, the first “ 58 car park ” was built by the limited company “Parking 58 S.A.”.
1966 First foreign investment: the Schouwburg car park in Rotterdam. Two years later, the subsidiary “ Parking 68 ” is founded. A number of car parks are developed in Brussels and Liège (Parking Cité).
1975 Creation of the Uniparc subsidiary in France.
1985 Creation of “Centre 85 Parkgaragen und Immobilien GmbH” and a 50% takeover of Contipark. Arrival in Austria via Europa Holding Parking.
1991Name changed to “ Interparking – Centre 58 SA ”, then to “ Interparking SA ” in 1993.
1995 50% takeover of Contipark in Spain which went on to become Interparking Hispania SA.
2001 Arrival in Italy when the Tronchetto car park in Venice was added to the portfolio.
2009539 car parks in 340 towns in seven countries in the European Union.
Founded in 1958 at the same time as the Brussels World Fair, Interparking has been able to anticipate urban development trends and the resulting needs in terms of parking and mobility.
For over 50 years, Interparking has been steadfast in its investment in staff, car parks and associated technology, to guarantee excellent service, security and comfort for its customers.
Its visionary choices and constant quest for quality have meant that the Group is now an exemplary leader in the European parking market.
« interparking is a company which has retained its
friendly, family feel whilst developing its international
scope and its determinedly forward-thinking vision.
within this framework, when it comes to managing our
employees, our priorities involve incorporating a policy
of real diversity and placing a great deal of importance
on the quality of our customer relationships. these
objectives do not just apply to the human resources
department, but also to all of the company’s employees
who are invited to take an active role in fulfilling them. »� Luc�Du�Bois,�Director�of�Human�Resources
Our history
a space in the ❤ of cities
3

We have the pleasure of presenting to you the con-solidated accounts of the Interparking Group as of 31 December 2009.
The past financial year was characterised by a major economic and financial crisis. Despite this context of severe recession, the car park business line posted growth both in terms of turnover and EBITDA. This was possible thanks to our policy of diversification, which again proved itself fruitful. The number of sites means that exposure to the main risks associated with our activity can be seriously reduced. The trends in various directions recorded by the concerns during 2009 bear witness to this. On 31 December 2009, Interparking managed more than 269,000 parking places in 340 cities in seven countries of the Euro zone. However, the Group’s consolidated sales fell by 0.8%, from EUR 286.6 million to EUR 284.3 million, and EBITDA dropped 1.5% to EUR 96.0 million, on account of the drop in rental revenue from our building located in Rue de l’Eveque, in accordance with our forecasts. The net result before taxes was EUR 41.4 million, compared with EUR 42.3 million in 2008.
In all the countries, the main developments chiefly served to consolidate positions in cities where the Group is already present.
Furthermore, in Spain the Group markedly strengthened its position thanks to the acquisition of the Metropark company, an operation that was concluded on 24 December 2009. Mainly located in Valencia, Madrid and Santiago de Compostela, the Metropark portfolio includes four hospital car parks, including car parks of the leading hospital in Madrid (“ La Paz ” Hospital) and the leading hospital in Valencia (“ La Fe ” Hospital). The suspensive conditions linked to this operation were raised, and the company was actually taken over on 27 January 2010.
In 2009 the Group continued its research and develop-ment activities, mainly in the field of multi-car park and intermodal products.
Parallel to this, major efforts continued to be made to renovate and modernise our existing portfolio. In this context, the Group increased the use of remote management centres. In addition, almost a hundred of our properties have now obtained the European Standard Parking Award, which certifies high-quality car parks.
sa interparkingManagement report on the consolidated accounts for the 2009 financial year
Management report
4

Interparking has also taken numerous measures aimed at reducing the company’s impact on the environment, without diminishing the quality of the service provided. In Belgium, Interparking SA only uses green electricity and aims to be C02 neutral in 2010.
Our company’s activity is clearly linked to the evolu-tion of the economic situation in the European coun-tries in which we are present, and more especially the indices of private consumption. However, our diversi-fication policy guarantees a recognised stability in our revenue thanks to the variety of the needs served by our car park facilities (leisure, shopping, work, airports, stations, hospitals, etc.) and the wide range of policies pursued by the cities and regions in which we operate in Europe.
The main specific risk that can affect our company’s development is the risk associated with accessibility by car and the commercial and cultural appeal of each of our car park sites. Therefore, Interparking places priority on concerns in cities that have strong and diversified pulling power.
The growing cost of using the car and a heightened awareness of environmental issues are prompting people to use their car more rationally and to change certain forms of behaviour. However, this negative effect is limited by the flexibility offered by this form of transport and is also offset by the need, on the part of towns and leisure or commercial centres wanting to retain their appeal, to continue to redevelop their areas of social interaction which hitherto have often been characterised by poorly organised or even uncontrolled parking.
All of these considerations and risks are taken into account when investment decisions are taken.
Furthermore, measures have been taken to reinforce the internal audit team at technical and financial level. This team is currently made up of six full-time equivalents.
Net financial expenses excluding depreciation on consolidation adjustments fell by almost 7.5%, from EUR 12.1 million in 2008 to EUR 11.2 million in 2009.
The company has not used financial instruments that are relevant for the valuation of its assets, liabilities, financial situation and losses or profits.
Taking into account depreciation, which was up 0.9%, the net result before taxes amounted to EUR 41,437,648, compared with EUR 42,309,182 in 2008, and the group share in the result for the financial year fell from EUR 30.1 million to EUR 24.8 million, following the increase in deferred taxes.
Apart from the Metropark acquisition being finalised, no major event has occurred since the closure of the accounts for the 2009 financial year which might have a significant effect on the company’s financial situation and results.
Brussels, 25 February 2010 The Board of Directors
5

Our vision is already becoming a reality
Our vision of expertiseGood quality service relies on human development. The first Interparking School opened in Brussels at the end of 2007. It provides technical, commercial and practical training, and is used as a test centre for our new facilities. 958 training courses were given there in 2009.
« the interparking school demonstrates our desire to develop and support our employees in their professional and personal lives. the training needs of each employee vary according to their experience, their job description and their place of work. it is our responsibility to provide a response which is suited to each training need, at the same time as taking into account each individual’s specific needs and expectations. with this in mind, we provide a wide variety of training options: as well as technical and equipment-related training, we also provide general training (first aid, languages, it) and behavioural training (attention to detail, stress management, customer relations etc.) »� Xavier�Ghysens,�Training�Manager
Our concern for each and every customerThe Control Rooms that have been set up in Belgium, Germany and The Netherlands reiterate our desire to offer our customers a “ nerve centre ” for the remote management of our car parks and their vehicles.
The benefits
• easier and more continuous access for our customers
• a speedy response to problems
• enhanced security
• rigorous management of traffic flow and available places
• adapted management of facilities (lighting, ventilation, techniques, parking equipment)
• comprehensive feedback statistics
« we have become experts in managing car parks via control rooms. this centralised supervision of our car parks helps us to improve communication and service for our customers significantly. Our strengths include improved service and specific statistical data to identify and resolve problems fast. »� Michel�Janssen,�Control�Room�Manager
2009 developments
6

Our activities
Interparking manages the issue of urban mobility and parking from all perspectives.
• Car park design.
• Development, construction and renovation of car parks.
• Management of on- and off-street car parks.
These skills are constantly updated, and where possible anticipate the development of mobility requirements. Their aim is to promote areas assigned to citizens by “ hiding ” cars in under-ground structures to give towns back to shops, cultural and leisure activities, and more generally, to its inhabitants.
Our choice of excellenceA number of our car parks have once again won the European Standard Parking Award. This industry standard, for which the criteria are defined by the sec-tor’s European professionals, assesses the quality of our facilities according to objective criteria: the quality of the buildings, lighting, access and available space, service and information. Interparking is the current leader in terms of this award (94 out of 200 awarded), and has also received a number of national prizes and certificates in The Netherlands and Germany.
« for interparking, the quality of our facilities and service is a permanent objective. we are convinced that in order to maintain our place as market leader, we need to offer flawless service: access and large spaces, easy and varied payment options, light, clean car parks etc. a happy customer comes back and enables our business to grow. » Nik�Subramanian,�International�Audit�Manager
Interparking and green energyOur commitment to the environment is cited as an example in the media, and is as much about a fundamental ethos (to be a 100% CO2 neutral company) as it is about making day-to-day changes to our car parks: economic lighting management, choosing a green power supplier, reducing vehicle emissions, programmed ventilation, electronic LED signage… These are just some of the areas developed in Interparking’s quest for responsible management, both for our environment. And our first car parks are fitted with electric charging points for electric cars (Cannes, France and Utrecht, The Netherlands).
« even though our company has not been subject to the demands of the Kyoto protocol, our commitment to the environment represents a clear desire to be an excellent economic example. we are currently working on an energy audit of all of our car parks in Belgium with the company CO2logic. a number of these are already CO2 neutral thanks to carbon offsetting by investing in renewable energy companies in india. we aim to roll out the environmental policy that we have started in Belgium to the rest of our network. »� Julien�Verdin,�Operations�Director,�Belgium
7

Cars, motorbikes and bicycles currently account for 80% of our movements. On top of that, one in every three people driving in town is looking for a parking space. By providing car parks for drivers, Interparking is not only responding to a need associated with mobility, it’s also reducing air, sound and visual pollution.
Public car parks (Off Street)By building and operating car parks in town centres, near hospitals, museums, cinemas, stations and airports, Interparking is giving its customers parking spaces which
• are near their end destination
• are accessible 24 hours a day
• are safe, clean and pleasant
• by their often intermodal nature, give our customers the opportunity to take public transport, trains, airplanes etc.
On Street parkingThese parking facilities, located on public roads and managed by Interparking, fulfil the need to be able to park in the immediate proximity of your destination, to load/unload your vehicle, do a quick shop and help local commerce and the town centre environment.
With its On Street parking management, Interparking facilitates the rotation of these facilities, and so keeps traffic to local shops and businesses healthy.
Finally, Interparking offers “ tailor-made ” parking pro-ducts and services:
• With Park&Shop and Park&Guest cards, independent shopkeepers, businesses and professionals can offer their clients parking spaces.
• People with PCards (Private and Corporate) can enter and exit our car parks without going through the pay stations, and with Corporate cards, you can claim the VAT back at the end of the month.
Our car parks
Car park solutions meeting specific needs
8

Faced with environmental challenges and the extension of urban centres, Interparking has reacted by :
• Promoting intermodal car parks where you don’t just park your car: you can also pick up a bike, catch a bus, train, tube, tram, airplane…
• Promoting the use of green energy in its facilities.
• Investing in its car parks to make them CO2 neutral (in progress).
• Making the first electric vehicles welcome at our faci-lities (Cannes, France and Utrecht, The Netherlands).
• Investing in energy-saving measures in terms of light-ing (replacing casings and installing new energy-saving light bulbs), ventilation and the speed at which cars can park (indication to free spaces).
• Investing in low CO2 emission vehicles and electric bicycles for its intervention team.
• Investing in a new “ house style ” to improve visibility, light and practicality in access and parking areas whilst improving signage in our car parks.
Our corporate social responsibility
Our 3 priorities
///// environment mobility ////////// quality
the challenge of a socially-responsible company
9

Key figuresin millions € 2005 2006 2007 2008 2009
Operating income 224,5 239,6 265,9 286,6 284,3
Operating result 61,8 63,4 69,7 67,5 65,4
Consolidated profit 23,7 25,7 30,0 30,8 25,5
Net current cash flow 57,9 61,2 68,1 73,2 68,2
Total shareholder’s equity 212,9 227,2 254,8 275,0 289,9
Group shareholder’s equity 207,2 220,1 249,1 269,2 284,0
Profit or loss 23,0 24,8 29,1 30,1 24,8
Total assets 769,8 801,6 593,0 592,1 670,3
Debts 534,6 551,2 312,8 298,5 359,0
franCe
24 car parks
13 801spaces
5cities
spain
40 car parks
14 012spaces
19cities
Operating income in millions €
eBitDa in millions €
net earning in millions €
Tenerife
10

539 car parks 340 cities 7 countries 269 348 spaces: 175 309 spaces off street, 94 039 spaces on street 1 915 employees 70 million customers/year
interparking in europe is :
GerMany
326 car parks
81 923spaces
161cities
austria
38 car parks
17 256spaces
7cities
italy
3 car parks
85 134spaces
125cities
netherlanDs
41 car parks
16 161spaces
13cities
BelGiuM
67 car parks
41 061spaces
10cities
11

Consolidated balance sheetassetsin ,000 € 2005 2006 2007 2008 2009
fixed assets 727 082 756 459 545 167 540 918 550 063
i. formation expenses 280 318 303 85 44
ii. intangible assets 41 262 46 455 51 958 49 522 25 231
iii. Consolidation differences 151 466 147 277 154 434 142 475 128 595
iv. tangible assets 310 037 331 295 333 649 342 270 385 540
a. land and buildings 202 089 233 998 231 777 272 911 318 024
b. plant, machinery and equipment 11 935 12 037 17 195 19 357 20 615
c. furniture and vehicles 2 369 2 848 3 062 3 664 3 691
d. leasing and other similar rights 63 790 60 852 57 915 33 422 23 166
e. Other tangible assets 4 757 5 003 5 226 8 004 12 210
f. assets under construction and advance payments 25 097 16 557 18 474 4 912 7 834
v. financial assets 224 037 231 114 4 823 6 566 10 653
a. Companies valued by the equity method 218 215 226 580 734 1 098 1 180
- Participation 218 215 226 580 734 1 098 1 180
b. Other companies 5 822 4 534 4 089 5 468 9 473
- Participations, shares and units 636 621 695 1 213 1 433
- Amounts receivable 5 186 3 913 3 394 4 255 8 040
current assets 42 723 45 173 47 861 51 180 120 216
vi. amounts receivable after more than one year 715 693 1 203 2 295 1 894
a. trade receivables 3 7 5 - -
b. Other amounts receivable 158 125 130 163 131
c. Differed taxes 554 561 1 068 2 132 1 763
vii. inventories and contracts in progress 235 154 504 823 731
a. inventories 235 154 504 823 731
viii. amounts receivable within one year 14 301 14 484 16 732 18 330 19 421
a. trade receivables 9 877 8 337 11 055 12 129 10 827
b. Other amounts receivable 4 424 6 147 5 677 6 201 8 594
iX. investments 4 430 7 180 3 329 2 169 71 137
a. Own shares - - - - -
b. Other investments and deposits 4 430 7 180 3 329 2 169 71 137
X. Cash at bank and in hand 19 427 18 371 22 375 22 791 20 733
Xi. Deferred charges and accrued income 3 615 4 291 3 718 4 772 6 300
total assets 769 805 801 632 593 028 592 098 670 279
12

liabilitiesin ,000 € 2005 2006 2007 2008 2009
capital & reserves 212 988 227 184 254 751 274 955 289 899
i. share capital 15 885 15 885 15 885 15 885 15 885
a. issued capital 15 885 15 885 15 885 15 885 15 885
b. uncalled capital - - - - -
ii. share premium account 38 729 38 729 38 729 38 729 38 729
iv. Consolidated reserves 148 996 161 868 190 956 211 052 225 795
v. Consolidation differences 3 546 3 546 3 577 3 577 3 577
vi. translation differences 111 111 - - -
vii. investment grant - - - - -
Minority interests 5 721 7 045 5 604 5 712 5 913
provisions 22 128 23 288 25 504 18 691 21 386
a. provisions for liabilities and charges 2 081 1 735 2 207 3 102 2 842
- Pensions and similar obligations 1 376 1 517 1 800 1 913 2 034
- Other liabilities and charges 705 218 407 1 189 808
b. Differed taxation 20 047 21 553 23 297 15 589 18 544
liabilities 534 689 551 160 312 773 298 452 358 994
X. amounts payable after more than one year 285 791 294 969 180 572 118 417 229 777
a. financial debts 281 662 290 836 176 457 114 274 221 185
- Subordinated loans - - - - -
- Unsubordinated debenture loans - - - - -
- Leasing and other similar obligations 28 415 20 353 10 738 6 047 17 691
- Banks and financial institutions 96 348 92 380 73 575 49 798 40 044
- Other loans 156 899 178 103 92 144 58 429 163 450
b. trade debts - - - - -
d. Other debt 4 129 4 133 4 115 4 143 8 592
Xi. amounts payable within one year 235 059 241 846 114 541 162 596 112 631
a. amounts > one year which are payable within the year
56 153 24 861 31 665 59 408 46 023
b. financial debts 148 247 169 212 37 452 37 685 16 404
- Banks and financial institutions 10 000 23 124 12 058 11 112 16 360
- Other loans 138 247 146 088 25 394 26 573 44
c. trade debts 17 791 21 145 23 658 27 926 24 117
d. advances received on orders in hand - - - - -
e. taxation, remuneration and social security 10 362 9 960 10 300 18 148 11 315
- Taxes 6 455 6 014 5 948 12 682 6 529
- Remunerations and social security costs 3 907 3 946 4 352 5 466 4 786
f. Other amounts payable 2 506 16 668 11 466 19 429 14 772
Xii. accrued charges and deferred income 13 839 14 345 17 660 17 439 16 586
total liabilities 769 805 801 632 593 028 592 098 670 279
13

Consolidated profit & lossin ,000 € 2005 2006 2007 2008 2009
i. Operating income 224 489 239 612 265 851 286 566 284 299
a. turnover 221 659 235 186 258 907 279 490 276 444
d. Other operating income 2 830 4 426 6 944 7 076 7 855
ii. Operating charges (162 618) (176 206) (196 135) (219 038) (218 925)
a. raw materials and consumables 629 640 742 1 045 1 245
b. services and other goods 87 812 94 351 106 062 119 012 117 455
c. remunerations, social security costs and pensions
40 949 45 073 49 536 56 088 56 968
d. Depreciation and other amounts written off formation expenses, intangible and tangible fixed assets
24 682 25 488 26 953 29 956 30 694
e. amounts written off stocks 151 2 63 67 125
f. provisions for liabilities and charges (2 733) (346) 207 342 (275)
g. Other operating charges 11 128 10 998 12 572 12 528 12 713
iii. Operating profit 61 871 63 406 69 716 67 528 65 374
iv. financial income 1 399 1 045 1 641 926 812
a. income from financial assets - 28 301 9 14
b. income from current assets 503 165 206 142 66
c. Other financial income 896 852 1 134 775 732
v. financial charges (30 906) (32 859) (28 701) (25 870) (24 511)
a. Debt charges 19 136 21 068 16 018 12 042 9 952
b. Depreciation on consolidation adjustments 10 168 10 973 11 862 12 866 12 531
c. amounts written off current assets other than those mentioned under ii e.
- - - - -
d. Other financial charges 1 602 818 821 962 2 028
vi. Current income before tax 32 364 31 592 42 656 42 584 41 675
14

in ,000 € 2005 2006 2007 2008 2009
vii. extraordinary income 109 89 238 36 121
a. write-back of amounts written off on intangible and tangible fixed assets
- - - - -
c. write-back of amounts written off on financial assets
- - - - 3
d. write-back of provisions for extraordinary liabilities and charges
- - - - -
e. Capital gains on disposal of fixed assets 73 87 46 36 29
f. Other extraordinary income 36 2 192 - 89
viii. extraordinary charges (141) (26) (414) (311) (358)
a. extraordinary depreciation and amounts written off on formation expenses, intangible fixed assets
2 - - 35 16
c. amounts written off financial fixed assets - - - - 10
d. provisions for extraordinary liabilities and charges
- 3 - - (4)
e. Capital losses on disposal of fixed assets 33 9 39 2 73
f. Other extraordinary charges 106 14 375 274 263
iX. profit or loss for the period before taxation
32 332 31 655 42 480 42 309 41 438
X. (1 361) (1 532) (1 741) 8 548 (3 086)
a. withdrawals from differed and latent taxation reserve
506 306 424 8 548 613
b. transfers to differed and latent taxation reserve
(1 867) (1 838) (2 165) - (3 699)
Xi. income taxes (14 028) (13 662) (14 774) (21 101) (13 962)
a. taxes (14 033) (13 669) (14 774) (21 104) (13 969)
b. adjustment of income taxes and write-back of tax provisions
5 7 - 3 7
Xii. profit or loss for the period 16 943 16 461 25 965 29 756 24 390
Xiii. proportion of the profit from compa-nies valued by the equity method
6 778 9 192 4 032 1 068 1 151
a. profits 6 778 9 192 4 032 1 068 1 151
b. losses - - - - -
consolidated profit 23 721 25 653 29 997 30 824 25 541
Third party share of the profit 673 815 909 720 790
Group share of the profit 23 048 24 838 29 088 30 104 24 751
15

appendices to the consolidated accounts
scope of consolidationi. list of fully consolidated companies in the Group rights of the Group
Servipark International s.a. Brussels 100 % BE 458 245 915
Serviparc s.a. Brussels 100 % BE 441 030 096
Uniparc Belgique s.a. Brussels 100 % BE 427 825 725
Beheercentrale n.v. Antwerpen 100 % BE 406 391 002
Parking Kouter n.v. Brussels 100 % BE 460 024 775
Parking Monnaie s.a. Brussels 100 % BE 403 459 721
Centre 58 s.a. Brussels 99,55 % BE 812 274 337
Parking Roosevelt n.v. Antwerpen 87,5 % BE 406 715 456
Parking Deux Portes s.a. Brussels 75 % BE 403 317 486
Interparking France s.a. Paris 100 %
Interparking Services S.A.S. Paris 100 %
Uniparc Cannes s.n.c. Cannes 100 %
Solopark S.A.S. Nîmes 100 %
Servipark France S.A.S. Paris 100 %
Interparking Nederland b.v. Rotterdam 100 %
Interparking Security b.v. Rotterdam 100 %
Uniparc Nederland b.v. Rotterdam 100 %
Interparking Italia s.r.l. Venezia 100 %
Interparking Servizi s.r.l. Venezia 100 %
SIS s.r.l. Corciano 100 %
Centre 85 Parkgaragen und Immobilien GmbH Berlin 100 %
Contipark Continentale Parkgaragen GmbH Berlin 94 %
Contipark International Parking GmbH Berlin 94 %
Contipark Parkgaragen GmbH Berlin 93,16 %
Parkhaus Sudwest GmbH Berlin 93,16 %
Parkhaus Waldthausenpark GmbH Berlin 90,37 %
Servipark Deutschland GmbH Berlin 96,65 %
Contipark International Austria GmbH Salzburg 96,92 %
Ö Park GmbH Wien 96,92 %
Optimus GmbH Wien 96,92 %
Optimus Parkhausverwaltungs GmbH & CoKG Wien 96,92 %
Villacher Parkgaragen GmbH & CoKG Salzburg 96,92 %
Interparking Hispania s.a. Barcelona 98,24 %
Interparking Lleidatana s.a. Lleida 91,81 %
iii. list of companies consolidated by the equity method
Immo TGV s.a. Brussels 33,20 % BE 434 655 515
DB Bahnpark GmbH Berlin 46,06 %
16

v. scope of consolidationThe consolidated accounts were produced according to
the principles outlined in the Royal Decree of 6 March 1990
on consolidated accounts.
As well as the accounts of the parent company, the
consolidated accounts are containing the accounts of
subsidiaries, for which various methods have been used :
a. full consolidationThe companies of which the Group controls at least 50% of
the share capital and which it manages on a day-to-day basis,
are consolidated according to the full integration method.
b. proportional consolidationThe companies which the Group controls jointly are
consolidated according to the proportional integration
method.
c. equity methodThe companies in which the Group directly or indirectly holds
between 10% and 49% of the capital and which it does not
manage on a day-to-day basis are consolidated using the
equity method.
d. unconsolidated companies Interests below 10% are not included within the scope
of consolidation. The same applies to the companies in
liquidation or in constitution.
vi. Criteria used for valuations in the consolidated accounts
A. The valuation rules used by INTERPARKING S.A. as
outlined in the appendices of the annual accounts, are
applicable to the consolidated accounts subject to the
following conditions :
• The rates of depreciation of intangible and tangible assets :
the accelerated depreciation mentioned in the company
accounts of the Belgian companies within the Group are
retreated as linear depreciations of the same duration in
the consolidated accounts in order to take account of the
economic lifetime of these assets.
• The consolidation adjustments : at the time of integration
of a new subsidiary into the consolidated balance sheet,
or when an additional shareholding is acquired, the book
value of shares and interests in these companies acquired
by companies already included in the consolidation is
compared to the share of capital and reserves that it
represents, taking into account a re-assessment of the
value of assets and liabilities where necessary.
A consolidation difference is therefore calculated. If it is
negative, it is recorded on the liabilities side of the balance
sheet in the section “ consolidation differences ”. If it is
positive, it is recorded on the assets side of the balance
sheet in the section “ consolidation differences ”.
• The valuation rules applied by non-Belgian companies are
not amended unless they represent a significant interest
except for the leasing contracts.
The closing rate is used as the method for translating balance
sheet accounts, except the profit for the financial year which is
converted at the average rate, and the average rate for the
translation of the profit and loss accounts. Since the introduction
of the Euro, the conversion is no longer necessary because all
Group societies are located in the Euroland.
Only profits can be subject to annual amortisation and these
are charged to a profit and loss account over a 20-year
period (5% per annum). This amortisation is justified by the
contribution, in a long-term perspective, of these sums to
the increase in profits of the Group. Equity shall correspond
with non-consolidated capital procurement prices, with
deductions of appropriate amounts. Dividends relating to
these are accrued in the year of their receipt. The value of
corporate securities necessitating a re-appreciation of value
shall correspond with the size of their contribution to the net
situation of the issuing company, including the results of the
financial year.
The employees of the Group collect pensions according to
the retirement systems provided by law and the practices of
the countries in which the Group companies carry out their
activity. In the event that formal retirement plans already exist
and payments relating to these plans are made by the Group,
the engagements concerned shall constitute an allowance.
With regard to any possible early retirement agreements
negotiated by some companies, the necessary allowances
shall be organised, and the residual payments shall be
re-evaluated, on a yearly basis.
The financial statements of consolidated companies are
closed on 31 december 2009.
B. The differed taxes are noticed on all the temporary
differences, coming from charges and income included
or excluded from the accounting result but deductible or
reinstalled in the tax basis of the exercise in which these
differences will reverse. Variable posting method is applied.
The differed taxes are calculated on the last known rate at
the date of the accounts.
17

vii. statement of formation expenses
Opening balance 85
Movements in the year: �-�
- New expenses incurred -
- Depreciation -41
- Changes in scope -
- Other movements -
Closing balance 44
viii. statement of intangible assets Concessions Goodwill
a. acquisition value
Opening balance 68 153 18 198
Movements in the year:
- Acquisitions 951 -
- Sales and disposals -68 -
- Changes in scope - -
- Transfers from one heading to another -28 722 -
- Other movements - 1
Closing balance 40 314 18 199
c. Depreciations and amounts written-down
Opening balance 22 353 14 477
Movements in the period:
- Recorded 2 094 619
- Sales and disposals -35 -
- Changes in scope - -
- Transfers from one heading to another -6 226 -
- Other movements - -
Closing balance 18 186 15 096
d. net book value 22 128 3 103
18
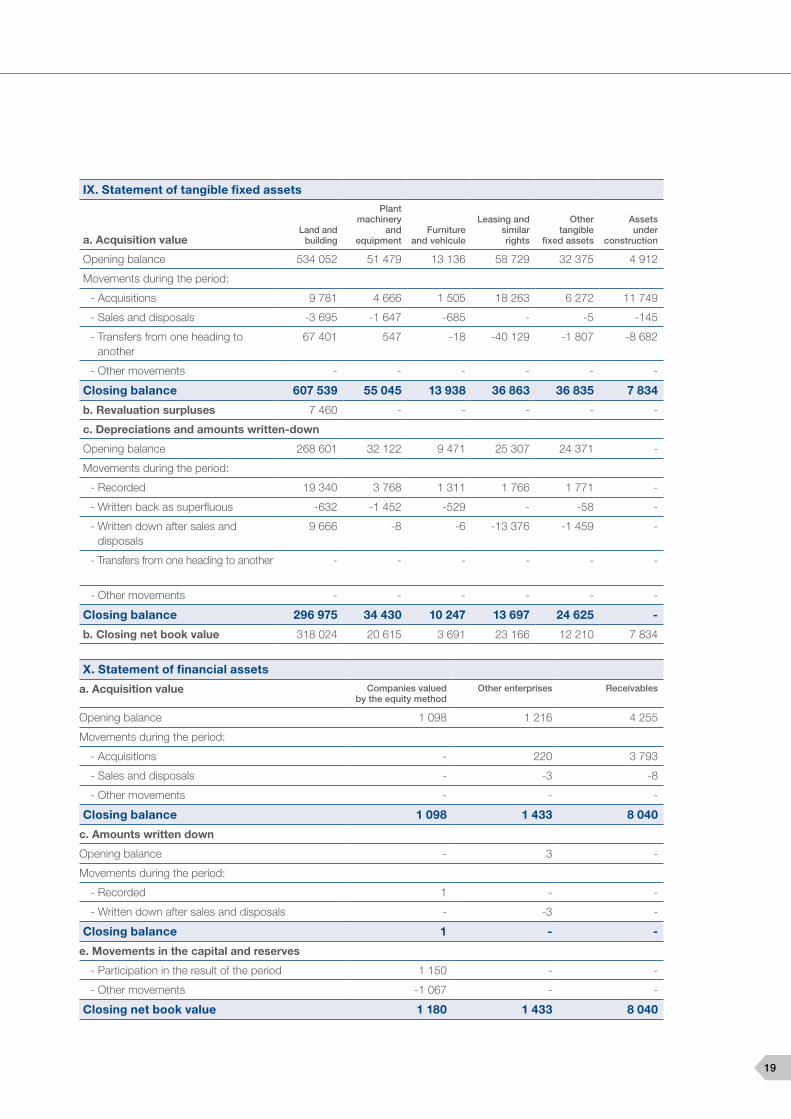
iX. statement of tangible fixed assets
a. acquisition valueLand�and�
building
Plant�machinery�
and�equipment
Furniture�and�vehicule
Leasing�and�similar�rights
Other�tangible�
fixed�assets
Assets�under�
construction
Opening balance 534 052 51 479 13 136 58 729 32 375 4 912
Movements during the period:
- Acquisitions 9 781 4 666 1 505 18 263 6 272 11 749
- Sales and disposals -3 695 -1 647 -685 - -5 -145
- Transfers from one heading to another
67 401 547 -18 -40 129 -1 807 -8 682
- Other movements - - - - - -
Closing balance 607 539 55 045 13 938 36 863 36 835 7 834
b. revaluation surpluses 7 460 - - - - -
c. Depreciations and amounts written-down
Opening balance 268 601 32 122 9 471 25 307 24 371 -
Movements during the period:
- Recorded 19 340 3 768 1 311 1 766 1 771 -
- Written back as superfluous -632 -1 452 -529 - -58 -
- Written down after sales and disposals
9 666 -8 -6 -13 376 -1 459 -
- Transfers from one heading to another - - - - - -
- Other movements - - - - - -
Closing balance 296 975 34 430 10 247 13 697 24 625 -
b. Closing net book value 318 024 20 615 3 691 23 166 12 210 7 834
X. statement of financial assets
a. acquisition value Companies�valued�by�the�equity�method
Other�enterprises Receivables
Opening balance 1 098 1 216 4 255
Movements during the period:
- Acquisitions - 220 3 793
- Sales and disposals - -3 -8
- Other movements - - -
Closing balance 1 098 1 433 8 040
c. amounts written down
Opening balance - 3 -
Movements during the period:
- Recorded 1 - -
- Written down after sales and disposals - -3 -
Closing balance 1 - -
e. Movements in the capital and reserves
- Participation in the result of the period 1 150 - -
- Other movements -1 067 - -
Closing net book value 1 180 1 433 8 040
19

Xi. statement of consolidated reserves
Opening balance 211 052
Movements during the period:
- Profit 24 751
- Dividend to shareholders -10 008
- Other movements -1
Closing balance 225 794
Xii. statement of consolidation differences Positive�consolidation�differences
Negative�consolidation�differences
Opening balance 142 475 3 577
Movements during the period:
- Changes in the scope due to an increase of percentage 97 -
- Changes in the scope due to a decrease of percentage -12 531 -
- Write downs - -
- Other movements -1 447 -
Closing balance 128 594 3 577
Xiii. statement of amounts payable Due�within�one�year Between�one�and�5�years
More�than�5�years
a. Breakdown
Financial debts 46 023 189 202 31 984
1. Subordinated loans / debentures - - -
2. Unsubordinated loans / debentures - - -
3. Leasing and similar obligations 1 557 2 034 15 657
4. Amounts due to credit institutions 8 580 27 420 12 624
5. Other loans 35 886 159 748 3 703
Other debts - 1 817 6 774
b. secured liabilities
Financial liabilities
4. Amounts due to credit institutions - - 23 367
20

Xiv. Operating profit
a. Operating income per countries
1. Geographic breakdown
• Belgium 33,00%
• Germany 29,20%
• Spain 11,60%
• France 9,40%
• Italy 8,50%
• Austria 5,20%
• Netherlands 3,10%
b. staff costs
1. Fully consolidated companies
Average number of staff 1 915
• Managers 142
• Salaried employees 1 578
• Hourly paid workers 195
staff costs (in thousand Euro) 56 968
Xv. rights and commitments not reflected in the balance sheet
A2. Amount of real guarantees granted or irrevocably promised by the companies included in the consolidation on their shareholders assets, to secure respectively the debts and commitments :
- in favour of the companies included in the consolidation 129 441
- in favour of third parties -
A4. a) Purchase commitments for fixed assets 114 558
b) Transfer commitments for fixed assets -
Operating income per countries in millions €
Belgium Germany Spain France
Italy Austria Netherlands
0
50
100
150
200
250
300
21

Balance sheet interparking s.a.assets
in ,000 € 2005 2006 2007 2008 2009
fixed assets 488 464 561 644 588 166 592 640 610 764
i. formation expenses - - - - -
ii. intangible assets 23 932 22 054 20 286 18 588 16 625
iii. tangible assets 55 179 67 476 64 143 68 378 58 256
a. land and buildings 43 850 62 482 58 866 59 107 45 157
b. plant, machinery and equipment 61 75 56 198 113
c. furniture and vehicles 668 675 675 1 075 1 154
d. leasing and similar rights 1 239 1 134 1 029 924 819
e. Other tangible assets 2 398 3 110 3 517 6 351 9 920
f. assets under construction and advance payments
6 963 - - 723 1 093
iv. financial assets 409 353 472 114 503 737 505 674 535 883
a. affiliated enterprises 199 849 471 135 502 706 503 100 532 774
- Participations interests 199 849 471 135 502 706 503 100 532 774
- Amounts receivable - - - - -
b. Other enterprises linked by participating interests
207 884 19 17 16 15
- Participations interests 207 884 19 17 16 15
- Amounts receivable - - - - -
c. Other financial assets 1 620 960 1 014 2 558 3 094
- Shares and units 596 597 602 610 611
- Amounts receivable and cash guarantees 1 024 363 412 1 948 2 483
current assets 11 685 9 305 7 550 9 800 62 410
v. amounts receivable after more than one year� - - - - -
b. Other amounts receivable - - - - -
vi. stocks and contracts in progress - - - - -
a. stocks - - - - -
vii. amounts receivable within the year 8 019 6 725 4 920 6 652 57 800
a. Own shares 6 393 4 562 4 034 5 713 4 729
b. Other investments and deposits 1 626 2 163 886 940 53 071
viii. treasury investments - - - - -
a. Own shares - - - - -
b. Other investments and deposits - - - - -
iX. Cash at bank and in hands 2 656 1 287 1 504 1 719 1 315
X. Deferred charges and accrued income 1 010 1 293 1 126 1 429 3 295
total assets 500 149 570 949 595 716 602 440 673 174
22

liabilities
in ,000 € 2005 2006 2007 2008 2009
share capital & reserves 184 217 188 683 201 702 212 181 220 927
i. share capital 15 885 15 885 15 885 15 885 15 885
ii. share premium account 38 729 38 729 38 729 38 729 38 729
iv. reserves 5 884 5 860 5 839 5 820 9 530
a. legal reserves 1 589 1 588 1 589 1 589 1 589
b. unavailable reserves 9 9 9 10 9
c. untaxed reserves 4 286 4 262 4 241 4 221 7 932
v. profit carried forward 123 719 128 209 141 249 151 747 156 783
vi. investment grants - - - - -
provisions 311 362 350 300 2 188
a. provisions for liabilities and charges 188 252 251 211 188
- Pensions and similar obligations 84 148 147 107 84
- Others 104 104 104 104 104
b. taxation, including differed taxation 123 110 99 89 2 000
liabilities 315 621 381 904 393 664 389 959 450 059
viii. amounts payable after more than one year
157 137 168 663 158 392 112 812 320 740
a. financial debts 155 015 166 545 156 295 110 687 314 171
- Subordinated loans - - - - -
- Unsubordinated debentures - - - - -
- Leasing and other similar obligations 1 604 1 590 1 577 1 555 1 531
- Banks and financial institutions 43 743 36 486 26 249 16 127 13 173
- Other loans 109 668 128 469 128 469 93 005 299 467
d. Other amounts payable 2 122 2 118 2 097 2 125 6 569
iX. amounts payable within one year 149 664 204 811 225 325 266 992 119 289
a. amounts > one year payable within the year 39 169 7 444 10 425 45 781 38 864
b. financial debts 102 250 179 570 208 276 204 056 62 929
- Banks and financial institutions 10 000 21 285 11 946 2 350 9 825
- Other loans 92 250 158 285 196 330 201 706 53 104
c. trade debts 5 427 2 740 3 813 4 364 4 420
e. taxation, remuneration and social security 2 759 3 042 2 789 2 751 3 060
- Taxes 1 454 1 732 1 498 1 295 1 592
- Remunerations and social security costs 1 305 1 310 1 291 1 456 1 468
f. Other amounts payable 59 12 015 22 10 040 10 016
X. accrued charges and deferred income 8 820 8 430 9 947 10 155 10 030
total liabilities 500 149 570 949 595 716 602 440 673 174
23

profit & loss account interparking s.a.in ,000 € 2005 2006 2007 2008 2009
i. Operating income 71 619 74 887 81 260 88 133 82 158
a. turnover 70 391 73 432 80 091 87 033 81 051
d. Other operating income 1 228 1 455 1 169 1 100 1 107
ii. Operating charges (54 452) (57 855) (62 589) (68 555) (66 985)
a. raw materials and consumables 38 - - - -
b. services and other goods 26 049 27 104 30 270 34 210 31 665
c. remuneration, social security costs 13 472 13 989 14 088 15 530 16 409
d. Depreciation and other amounts written off on formation expenses, intangible and tangible fixed asset
9 718 10 797 11 800 12 087 12 591
e. amounts written off stocks contracts in progress and trade debtors
(38) - - 62 118
f. provisions for liabilities and charges (19) 64 (1) (40) (23)
g. Other operating charges 5 232 5 901 6 432 6 707 6 225
iii. Operating profit 17 167 17 032 18 671 19 577 15 173
iv. financial income 11 614 15 755 14 267 21 933 21 214
a. income from financial fixed assets 10 941 15 079 13 633 21 438 20 790
b. income from current assets 22 39 182 107 88
c. Other financial income 651 637 452 388 336
v. financial charges (12 639) (13 349) (18 059) (19 503) (14 165)
a. Debt charges 11 707 12 955 17 640 19 027 13 684
b. amounts written off current assets other than those mentioned under ii e.
- - - - -
c. Other financial charges 932 394 419 476 481
vi. Current income before tax 16 142 19 438 14 879 22 007 22 222
valuation rules• Merger goodwill is depreciated over a 20 year period.• Tangible assets are recorded at their purchase
or cost price.• Annual depreciation is calculated according to a
depreciation plan based on the linear or degressive method.
• Financial assets are valued at purchase price, possibly less write-downs in the case of participations, and at their nominal value in the case of amounts receivable featuring in this section, as well as amounts receivable after more than one year.
• Amounts receivable within the year are valued at their nominal value.Treasury investments are valued at their purchase price.
• Provisions are made for amounts written off where necessary and under the conditions stipulated by law with regard to assets liable to depreciation.
• Amount falling due after more than one year and within one year are classified in terms of their nominal value according to the balances evidenced in the accounts.
• Provisions will be made if necessary.• Since the introduction of the Euro, the conversion is
no longer necessary because all Group societies are located in the Euroland.
24

in ,000 € 2005 2006 2007 2008 2009
vii. extraordinary income 29 48 112 32 320
a. adjustments to depreciation and to other amounts written off intangible and tangible fixed assets
- - - - -
b. adjustments to amounts written off financial fixed assets
- - - - -
c. adjustements to provisions for extraordinary liabilities and charges
- - - - -
d. Capital gains on disposal of fixed assets 29 48 12 32 320
e. Other extraordinary income - - 100 - -
viii. extraordinary charges (8) (410) (4) (3) (106)
b. amounts written off financial fixed assets - 409 2 1 2
c. provisions for extraordinary liabilitiesand charges
- - - - -
d. losses on disposal of fixed assets 8 1 2 2 -
e. Other extraordinary charges - - - - 104
Profit or loss for the financial year 16 163 19 076 14 987 22 036 22 436
iX. 8 13 11 10 (1 910)
a. withdrawals from taxation period, including differed taxation
8 13 11 10 10
b. transfers to taxation, including differed taxation
- - - - (1 920)
X. income taxes (2 881) (2 655) (1 980) (1 559) (1 771)
a. taxes (2 883) (2 660) (1 980) (1 559) (1 771)
b. adjustment of income taxes and write back of tax provisions
2 5 - - -
Xi. Current income before tax 13 290 16 434 13 018 20 487 18 755
Xii. 16 24 22 20 (3 710)
Transfer from untaxed reserves - - - - (3 729)
Withdrawals to untaxed reserves 16 24 22 20 18
Xiii. profit or loss of the period 13 306 16 458 13 040 20 507 15 044
25

1
6
9
2
7
10
3
8
11
4 5
26

Management
Board of directors
Claude De Clercq Honorary ChairmanYves De Clercq* ChairmanAlain Devos** Vice-Chairman Roland Cracco*** Managing DirectorAlain De Coster DirectorPhilippe Latour DirectorMichel Mathieu DirectorXavier Pierlet**** DirectorBaudouin Ruquois***** DirectorMarc Van Begin****** Director
executive commitee
1 Yves De Clercq 2 Alain Devos
3 Xavier Pierlet
4 Baudouin Ruquois
Corporate management
5 Roland Cracco
Ilse De Graeve Budget & Control
Edouard de Vaucleroy Chief Financial Officer
Olivier Maes IT Manager
Elisabeth Roberti Secretary General
Nik Subramanian International Audit Manager
* manager of SCA Yves De Clercq** manager of SPRL A. Devos*** manager of SPRL Kingsdale Consulting**** manager of SPRL Xavier Pierlet***** manager of SPRL Baudouin Ruquois management****** manager of SPRL Marc Van Begin
Operational management
6 Michael Kesseler Germany / Austria
Contipark Parkgaragen GmbH Rankestraße, 13 - 10789 Berlin (Deutschland)T: 49-30-25 00 970
Contipark International Austria GmbHReichenhaller Straße, 8 - 5020 Salzburg - ÖsterreichT: 43-662-84 97 58 31
7 Julien Verdin Belgium
S.A. Interparking N.V.Bisschopsstraat, 1, Rue de l’Eveque - 1000 Brussels, BelgiumT: 32-2-549 58 11
8 Ernesto Piera Spain
Interparking Hispania S.A.Calle Valencia, 93 3° 2a - 08029 Barcelona - EspañaT: 34-93-451 66 24
9 Giuseppe Prete France
Interparking France S.A.Rue de Gramont, 30 - 75002 Paris - FranceT: 33-1-55 04 66 00
10 Antonio Fraccari Italy
Interparking Italia S.R.L.Isola Nuova del Tronchetto - 30135 Venezia - ItaliaT: 39-041-520 75 55
11 Diederik van Woensel Netherlands
Interparking Nederland B.V.Weena point A - Weena, 710-7123014 DA Rotterdam (Nederland)(Postbus 501 – 3000 AM Rotterdam) T: 31-10-217 09 70
27

As required by law and the company’s articles of association,
we report to you in the context of our appointment
as statutory auditors. This report includes our opinion on
the consolidated accounts and the required additional
disclosures.
unqualified opinion on the consolidated accountsWe have audited the consolidated accounts of Interparking SA
and its subsidiaries (the “ Group ”) as of and for the year
ended 31 December 2009, prepared in accordance with
the financial-reporting framework applicable in Belgium,
and which show a consolidated balance-sheet total of
EUR 670.278.683 and a consolidated profit for the year
(group share) of EUR 24.750.873.
The company’s board of directors is responsible for the
preparation of the consolidated accounts. This responsibility
includes: designing, implementing and maintaining internal
control relevant to the preparation and fair presentation
of consolidated accounts that are free from material
misstatement, whether due to fraud or error; selecting
and applying appropriate accounting policies; and making
accounting estimates that are reasonable in the circumstances.
Our responsibility is to express an opinion on these consolidated
accounts based on our audit. We conducted our audit in
accordance with the legal requirements applicable in Belgium
and with Belgian auditing standards, as issued by the “ Institut
des Réviseurs d’Entreprises/Instituut der Bedrijfsrevisoren ”.
Those auditing standards require that we plan and perform
the audit to obtain reasonable assurance about whether the
consolidated accounts are free of material misstatement.
In accordance with the auditing standards referred to above,
we have carried out procedures to obtain audit evidence
about the amounts and disclosures in the consolidated
accounts. The selection of these procedures is a matter
for our judgment, as is the assessment of the risk that
the consolidated accounts contain material misstatements,
whether due to fraud or error.
In making those risk assessments, we have considered the
Group’s internal control relating to the preparation and fair
presentation of the consolidated accounts, in order to design
audit procedures that were appropriate in the circumstances,
but not for the purpose of expressing an opinion on the
effectiveness of the Group’s internal control. We have also
evaluated the appropriateness of the accounting policies
used and the reasonableness of accounting estimates
made by management, as well as the presentation of the
consolidated accounts taken as a whole. Finally, we have
obtained from the board of directors and Group officials
the explanations and information necessary for our audit.
We believe that the audit evidence we have obtained provides
a reasonable basis for our opinion.
In our opinion, the consolidated accounts of give a true and
fair view of the Group’s net worth and financial position as of
31 December 2009 and of its results and cash flows for the
year then ended in accordance with the financial-reporting
framework applicable in Belgium.
additional remarkThe company’s board of directors is responsible for the
preparation and content of the management report on the
consolidated accounts.
Our responsibility is to include in our report the following
additional remark, which does not have any effect on our
opinion on the consolidated accounts.
Joint statutory auditors’ report
Joint statutory auditors’ report to the general shareholders’ meeting on the consolidated accounts as of and for the year ended 31 December 2009.
28

The management report on the consolidated accounts deals
with the information required by the law and is consistent with
the consolidated accounts. However, we are not in a position
to express an opinion on the description of the principal risks
and uncertainties facing the companies included in the
consolidation, the state of their affairs, their forecast
development or the significant influence of certain events on
their future development. Nevertheless, we can confirm that
the information provided is not in obvious contradiction with
the information we have acquired in the context of our
appointment.
10 March 2010
The joint statutory auditors
Deschamps, Godefroid, Verset & C°
Reviseurs d’Entreprises SCPRL
Represented by
André Deschamps
Statutory auditor
PricewaterhouseCoopers
Reviseurs d’Entreprises SCCRL
Represented by
Yves Vandenplas Didier Matriche
Statutory auditor Statutory auditor

S.A. INTERPARKING N.V.
EUROPEAN HEADQUARTERS 1, rue de l’Eveque, 1000 Bruxelles, BelgiqueBisschopsstraat, 1, 1000 Brussel, BelgiëT. 32 2 549 58 11 – F. 32 2 511 02 09