Embed Size (px)
Citation preview

The Interpersonal Skills of Recent Entrants to
the Field of Healthcare Management:
Final Report
December 2011
Prepared for the American College of Healthcare Executives
by
Diane M. Howard, Ph.D., FACHE
Assistant Professor, Rush University
Douglas Silverstein, MHSA, FACHE
President, NorthShore University HealthSystem – Glenbrook Hospital

Interpersonal Skills of Recent Entrants
to the Field of Healthcare Management
Introduction ................................................................................................................................................. 1 Methods ........................................................................................................................................................ 1 Chapter 1: Background ............................................................................................................................. 3
Intergenerational communication and conflict ...................................................................................... 6 Graduate education and early career experiences .................................................................................. 7 Overall Findings ...................................................................................................................................... 8
Demographics of Responding Senior Executives ................................................................................................. 8 Demographics of recent entrant manager (REM) ............................................................................................... 11
Assessment of the REM ......................................................................................................................... 13 a. Paired Comparisons on Intrapersonal and Interpersonal Attributes ................................................................ 13 b. REMs’ Competencies compared with Evaluators’ Own Competencies at the Same Career Stage ............... 17 c. Rating of REMS’ Interpersonal Skills with Other Role Incumbents .............................................................. 18
Chapter 2: The Impact of Senior Executives’ Generation on How They Evaluated their REM ..... 20 Demographic and Positional Characteristics of Evaluators by Generation ........................................ 20 The Demographic Characteristics of REMs by Evaluator’s Cohort .................................................... 21
a. Paired Comparisons on Intra- and Interpersonal attributes ............................................................................. 21 b. REMs’ Competencies compared with Evaluators’ Own Competencies at the Same Career Stage ................ 21 c. Rating of REMS’ Interpersonal Skills with Other Role Incumbents .............................................................. 22
Chapter 3: The Impact of Senior Executives’ Gender on How They Evaluated the REM ............... 38 a. Paired Comparisons on Intra- and Interpersonal attributes ............................................................ 38 b. REMs’ Competencies Compared with Evaluators’ Own Competencies
at the Same Career Stage ................................................................................................................... 38 c. Rating of REMS’ Interpersonal Skills with Other Role Incumbents ............................................... 39
Chapter 4: The Impact of the REM’s Education on How They Were Evaluated ............................. 49 a. Paired Comparisons on Intra- and Interpersonal attributes ............................................................ 49 b. REMs’ Competencies Compared with Evaluators’ Own Competencies
at the Same Career Stage ................................................................................................................... 50 c. Rating of REMS’ Interpersonal Skills with Other Role Incumbents ............................................... 50
Chapter 5: The Impact of REMs’ Age on How They Were Evaluated ............................................... 61 a. Paired Comparisons on Intra-and Interpersonal attributes ............................................................. 61 b. REMs’ Competencies compared with Evaluators’ Own Competencies
at the Same Career Stage ................................................................................................................... 61 c. Rating of REMS’ Interpersonal Skills with Other Role Incumbents ............................................... 61
Chapter 6: The Impact of REMs’ Having Clinical Experience on How They Were Evaluated ...... 71 a. Paired Comparisons on Intra-and Interpersonal attributes ............................................................. 71 b. REMs’ Competencies compared with Evaluators’ Own Competencies
at the Same Career Stage ................................................................................................................... 71 c. Rating of REMS’ Interpersonal Skills with Other Role Incumbents ............................................... 71
Chapter 7: Identification of “Fast Trackers” and Strategies to
Enhance REM Interpersonal Skills ......................................................................................................... 81 Useful Strategies and Programs That Have Enhanced Interpersonal Skills
of Recent Entrant Managers ................................................................................................................. 81 Conclusion ................................................................................................................................................. 83 Appendix I: Survey Instrument The Interpersonal Skills of Recent Entrants
to the Field of Healthcare Management Survey ..................................................................................... 86 Appendix II: The Impact of the REM’s Education on How They Were Evaluated—
All Degree Categories (Chapter 4) .......................................................................................................... 91

1
Introduction
The generation divide in the workplace has consumed attention in the print and broadcast media.
Workplace professionals comment on the generational differences in how senior executives and
early careerists approach the nature of their jobs. What specifically are the perceptions that
senior executives have about the interpersonal skills of recent entrants to the field of healthcare
management (REM)? To help answer this question, a national survey was conducted to
determine the current state of senior executive perceptions of recent entrants within corporate
headquarters, hospital systems, and freestanding hospitals. The survey was constructed based on
leadership interpersonal competencies and competency-based career development programs. A
total of 676 respondents returned a survey, representing 31 percent of the mailing sample.
The goal of the research was to (1) determine the perceptions that senior executives have about
the interpersonal skills of recent entrants to the field of health care management and (2) identify
best practices for organizational training of recent entrants to the field of health care
management.
Methods
The survey instrument developed was based on the findings of an initial pilot study consisting of
four focus groups, a review of the pertinent literature and was revised based on a pretest of the
initial questionnaire.
The pilot study focus group protocol was based on the leadership framework provided by the
Healthcare Leadership Alliance (Stefl, 2008). The focus groups consisted of graduate students
spanning multiple generations of learners in a large metropolitan area. Five overall management
competencies were considered by the groups: communication and relationship management,
leadership, professionalism, knowledge of the healthcare environment and business skills and
knowledge. Based on surveys completed by the participants, communication and relationship
management competency was the most important for entry level managers to develop (54
percent).
Published research was also consulted. In particular, questions developed by Freshman and
Rubin (2002) Cherlin et al. (2006), Helfand, Cherlin and Bradley (2005), and White and Begun,
(2006) were considered while more conceptual studies required us to operationalize those ideas
for survey administration. (Guo, 2009, George, 2000, Ferris, 2001). Finally, several concepts
from the Bar-On model of emotional intelligence (Stein and Book, 2006) and Goleman’s
framework of emotional competencies were consulted (Goleman, 2001).
The survey was fielded using web-based solicitations for participation. The sample consisted of
2,200 senior executives from the American College of Healthcare Executives membership. The
electronic surveys were distributed along with a cover letter explaining the purpose of the
survey. The survey contained a screener question which inquired if the senior executive could
identify a recent entrant manager (REM) with whom they worked on a regular basis. The REM
was defined as an individual 30 years of age or less who had been a healthcare management

2
professional for five years or less. In three-weeks following the electronic solicitation, 1,301
faxes were directed to non-responders from the initial web-based solicitation. A total of 676
respondents returned a completed survey from the two solicitations which represented 31 percent
of the 2,200 affiliates originally sampled. Of the 676 surveys, 9% (61) did not complete the full
survey. This left 615 completed surveys, or 91% of surveys received.

3
Chapter 1: Background
Howe and Strauss (2000) divide the American workforce into four distinct ‘generations’ in 20-
year cohorts: Traditionalists (born between 1925 and 1945), Baby Boomers (1946 and 1964),
Gen Xers (1965 and 1979), and Gen Yers or Millennials (1980 and 2001). According to Alsop
(2008), each twenty-year cohort has characteristics distinct to the group which stem from events
and cultural factors taking place during key phases of their development, differences that are also
reflected in how each group approaches their work.
In addition to social and economic changes influencing development, healthcare leaders may be
influenced by the nature and climate within which their profession operated at key points during
their career. Table 1.1 (next page) summarizes these generational as well as healthcare-specific
differences, which are described in more depth as follows.
Traditionalists. The Traditionalists were born between 1925 and 1945 and are a population of
38.6 million (Alsop, 2008). The Great Depression, Pearl Harbor, World War II, and the Korean
War were key historical events to this group. Character traits often associated with this
generation include: patriotic, dependable, conformist, respect for authority, rigid, socially and
financially conservative, and individuals with a solid work ethic (Howe & Strauss, 2000). The
Traditionalist cohort has trust in the medical establishment and so prefers to be directed by
professionals with clinical expertise (Gleeson, 2003).
Baby Boomers. The Baby Boomer generation born between 1946 and 1964 followed the
Traditionalists generation and represent 78.3 million in the population (Alsop, 2008). The
Vietnam War, assassination of John and Robert Kennedy and Martin Luther King, Jr., the moon
landing, Kent State student deaths, and the Watergate break-in define this generation. Much has
been written about this cohort because of its size, the economic advantages of the group, and its
ability to define America through its protests around the Vietnam War. Group traits include
being workaholics, idealistic, competitive, loyal, materialistic, seeks personal fulfillment, and
values titles and the corner office (Alsop, 2008). The Boomers want a dialogue with their
healthcare providers and they want to be involved in the decision-making (Gleeson, 2003).
Generation X. Generation X followed the Boomers, a smaller cohort of 62 million born between
1965 and 1979. Key historical events in this cohort include the AIDS epidemic, space shuttle
Challenger, Berlin Wall, Oklahoma City bombing, and Presidential impeachment of Bill Clinton.
Traits associated with this group include being self-reliant, adaptable, cynical, distrustful of
authority, resourceful, entrepreneurial, and technology savvy (Alsop, 2008). The Generation X
wants to be educated and informed about their health, not directed or talked at (Gleeson, 2003).
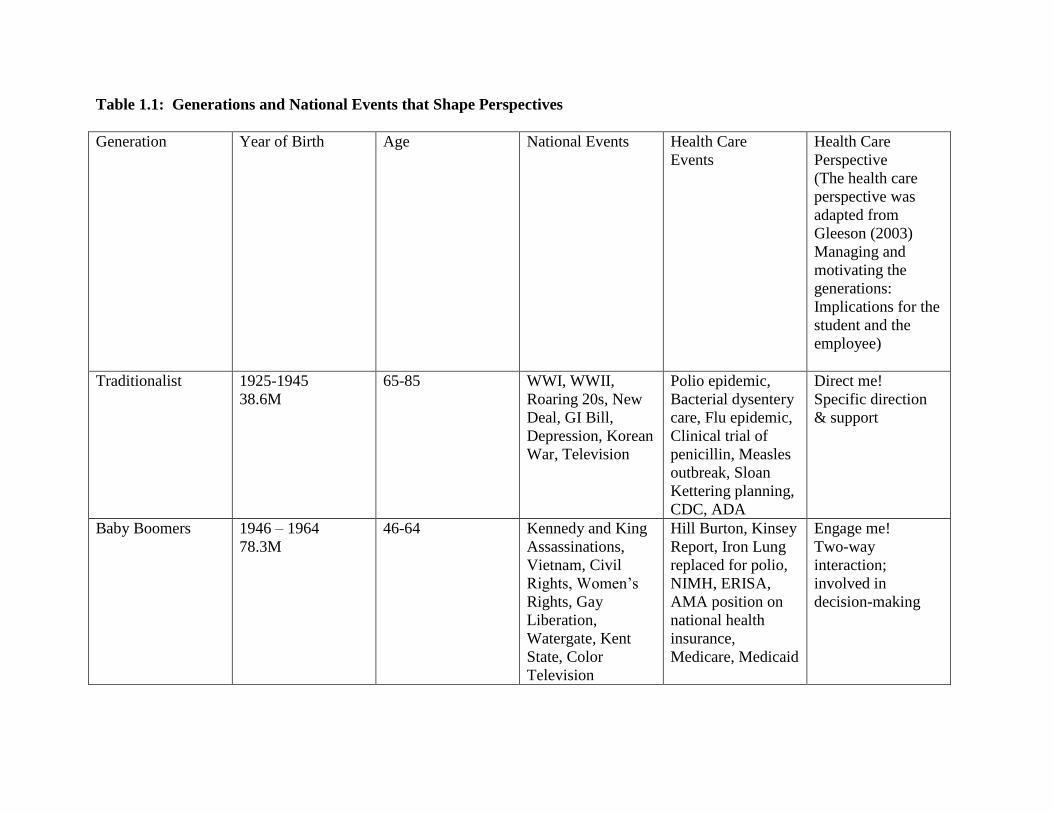
Table 1.1: Generations and National Events that Shape Perspectives
Generation Year of Birth Age National Events Health Care
Events
Health Care
Perspective
(The health care
perspective was
adapted from
Gleeson (2003)
Managing and
motivating the
generations:
Implications for the
student and the
employee)
Traditionalist 1925-1945
38.6M
65-85 WWI, WWII,
Roaring 20s, New
Deal, GI Bill,
Depression, Korean
War, Television
Polio epidemic,
Bacterial dysentery
care, Flu epidemic,
Clinical trial of
penicillin, Measles
outbreak, Sloan
Kettering planning,
CDC, ADA
Direct me!
Specific direction
& support
Baby Boomers 1946 – 1964
78.3M
46-64 Kennedy and King
Assassinations,
Vietnam, Civil
Rights, Women’s
Rights, Gay
Liberation,
Watergate, Kent
State, Color
Television
Hill Burton, Kinsey
Report, Iron Lung
replaced for polio,
NIMH, ERISA,
AMA position on
national health
insurance,
Medicare, Medicaid
Engage me!
Two-way
interaction;
involved in
decision-making
Generation X 1965 – 1979
62M
31-45 AIDS epidemic,
Challenger, Berlin
Wall, Oklahoma
City, Clinton
impeachment,
Cable TV,
Unemployment
affects health care
access
HMO Act
CON
Educate me!
Healthcare is a
personal
responsibility;
value
independence, not
direction
Millennials 1980 – 2001
92M
9 - 30 Columbine H.S.,
Gulf War, 9/11,
Afghanistan & Iraq,
Hurricane Katrina,
Internet
DRGs
RBRVS
COBRA
Connect me!
Continuous
connection through
Texting, Facebook,
Twitter;
E-mail responses to
questions

6
Millennials. The fourth and youngest group currently in the healthcare management workforce
is the Millennials. Born between 1980 and 2001 and with a total population of 92 million, they
will eventually become the largest of the four cohorts in the workplace. Key historical events
that shaped this age cohort are Columbine High School shootings, September 11 terrorist attacks,
Enron and other corporate scandals, wars in Afghanistan and Iraq, and Hurricane Katrina.
Characteristics associated with this group include: entitled, optimistic, civic minded, close
parental involvement, values work-life balance, impatient, multitasking, and team oriented
(Alsop, 2008). Millennials require instantaneous feedback and prefer the use of technology
when being educated (Gleeson, 2003).
Intergenerational communication and conflict Differences across these generations can present challenges to optimal working relationships and
organizational coherency (Pew Research Center, 2010). Leading healthcare organizations have
begun to recognize these challenges and address them through additional education. For
example, the Mayo Clinic’s website provides strategies to improve the working relationships
between the generational cohorts with the following formula: 1) Beware of the differences; 2)
Appreciate the strengths of each group; and 3) Manage the differences effectively. Strategies to
better communicate between groups are enhanced when the interaction builds upon each cohort’s
unique characteristics.
In terms of generation-to-generation communications, our experience has suggested that
healthcare managers can benefit from guidance about some of the differences in perspectives
described above. As the Mayo Clinic website recommends, Baby Boomer communication with
Generation X should get to the point and address specific points for which the Generation X
requires. On the other hand, Generation X should approach the Boomer with respect and give
the group complete attention. For the Generation Xer addressing the Traditionalist, respect
should also be shown as well as valuing the person’s knowledge and experience.
Table 1.2: Optimal Generation Communication Strategy
Boomers & Traditionalists Generations X & Y
Generations X & Y
Get to the point
Use e-mail
Give them space
Get over the notion of dues paying
Lighten up; work can be fun
Challenge them
Ask them their opinion
Find them a mentor
Provide timely feedback
Boomers
Show respect
Choose face-to-face conversation
Give them your full attention
Play the game
Learn the corporate history
Traditionalists
Honor the chain of command
Value their experience
Appreciate their dedication
According to Cahill and Sedrak (2009), tension between the generations is particularly acute
between the Boomers and Millennials (Generation Y). Recruiters find Millennials to be overly
demanding when it comes to needing guidance, ongoing feedback, career advancement, and

7
work-life balance, a term that was unheard of for Boomers who gave all to the organization to
secure advancement. Boomers will refer to Millennials as “slackers” because they are perceived
to be much less willing to make personal sacrifices for the good of their employers (Alsop, 2008;
Cahill and Sedrak, 2010). The generational shift to Millennials is exacerbated by the ethnically
and racially diverse nature of the Millennials. In a study of U.S. college freshman trends, UCLA
found that there were jumps in education enrollment for Asians from 0.6% in 1971 to 8.6% in
2006, and Latino students from 0.6% to 7.3%. In addition, the gender shift has become more
pronounced with college and graduate school enrollment at 55% for females (DeAngelo et al,
2009).
Graduate education and early career experiences In recognition of some of the challenges new healthcare managers faced acculturating to the
workplace, the Commission on the Accreditation of Healthcare Management Education
(CAHME, 2013) added Interpersonal Effectiveness and Professionalism to its list of content
areas that accredited programs are required to teach. As a result, professionalism courses are
now taught in many graduate programs of health management. These programs assist students in
developing resumes and cover letters, prepare them for the interview experience through audio
and video recordings, identifies mentors and advises them on salary negotiation, and even
provides dining etiquette instruction. Although all of these are important skills, effectiveness in
communicating across generations and interpersonal skills do not get the attention they should.
The challenges early careerists face in this arena are particularly acute for students who obtain
prestigious administrative fellowships. For a year to two years, these students are able to work
with the president and other senior executives, completing projects that advance their knowledge
in some vital direction that the organization is pursuing. However, at the conclusion of the
fellowship experience, early careerists are relegated to entry level positions. No longer working
directly with senior-level leadership, they can suffer from post-fellowship depression (Salazar,
2006). Like many of their peer Millennials, they can become frustrated and can begin seeking
positions that will allow them to regain some of what they lost at the end of their fellowship
(Alsop, 2008). The Pew Research Center (2010) reported that Millennials are job hoppers and
see their current position as either a steppingstone to a career or just a job to help them get by.
Six-in-ten (61%) expect to be working for someone else while 37% indicate they will never
leave their current employer.
What should organizations do to retain the talent of these Millennials, particularly when there
has been a tremendous organizational investment in them? Who in the organization is
responsible for identifying the problem and investing the resources to retain this young talent? If
the Mayo Clinic (2007) is correct, then listening, challenging their interests, providing mentors,
and giving feedback requires a cultural change in an organization. Senior leaders have to be
convinced that the status quo will not keep talented Millennials in an organization because the
Millennials need to be brought into leadership. Anecdotally, it is often reported that the
organizational hierarchy and norms that retained Baby Boomers on the job will not work with
Millennials. In health care, job satisfaction and being valued are key satisfiers for the
Millennials. Since we don’t know what the generational differences may be long-term, there is
an opportunity to investigate the interpersonal skills of recent entrants to the field of healthcare
management and the strategies to mainstream them into the organization and retain them.

8
Overall Findings
Demographics of Responding Senior Executives
Sixty-nine percent of the respondents are male and 31% percent are female. The race/ethnicity of
the respondent was: Caucasian/White – 86%; African American/Black – 3%; Hispanic – 2%;
and Asian/Pacific Islander – 1%. The degree completed was in the following area: Health
Management (50%); Business – 28%; Clinical/Allied Health – 15%; and Other – 7% (Figure 1)
The self-reported positions of the respondent senior executive population is: CEO – 42%; COO
– 14%; CFO – 3%; CIO – 1%; CMO 1%; CNO – 7%; Senior VP – 6%; and VP – 25%. The
work setting of the senior executive respondents was Freestanding Hospital – 55%; System
Hospital – 32%; and Corporate Headquarters – 13%. The mean age of the respondent was 53.
Forty-seven percent (292) of the respondents reported that they could identify a REM with whom
they worked on a regular basis (Figure 1).
The capacity in which the senior executive interacted with the REM was primarily as an
immediate supervisor (41%); formal mentor (14%); informal mentor (21%); work group
participant (17%); and has an office near the recent entrant manager (7%) (Figure 1).
Figure 1. Demographic and Professional Characteristics of Responding Senior Executives
(Evaluators)

9

10
1. Can you identify a recent entrant
manager, as defined above, with whom
you work on a regular basis?
2. In what capacity do you interact with the recent
entrant manager? (Check all that apply.)

11
Demographics of recent entrant manager (REM)
The mean age of the REM is 29 years of age (Figure 2). Fifty-four percent of the REMs are
female and 46% are male. Of the 297 REMs where the senior executive knew their marital
status, 66% of the REMs are married and 29% are single. Of the 297 REMs, 52% have no
children and 48% have children.
The race/ethnicity of the REM is Caucasian/White – 79%; African-American/Black – 9%;
Hispanic – 5%; and Asian – 5%. The academic major of the REM is Health Management (50%);
Business (23%); Clinical and Allied Health (includes medicine, nursing, and science-related
degree programs) (10%); and Other (includes community health, legal, and public
administration) (1%) (Figure 2). Sixteen percent did not have a graduate degree.
Figure 2. Demographic and Professional Characteristics of Recent Entrant Managers
(REMs)
3. REM’s approximate age: 29
4. REM’s gender: 5. REM’s marital status:
12
6. Does the REM have any children? 7. Which of the following best describes the REM’s
race/ethnicity? (Check all that apply.)

13
8. In which of the following degree programs
did the REM complete graduate work (check
all that apply)?
9. Does the REM have prior clinical
experience?
10. If yes, how many years (estimate)? Less than 5 years 60%
Assessment of the REM
a. Paired Comparisons on Intrapersonal and Interpersonal Attributes
To assess the intrapersonal and interpersonal characteristics of the REM, evaluators were
presented with 26 items derived from suggestions from focus group respondents, a preliminary
survey and the pertinent literature. To assist in interpreting the findings, the 26 questions have
been divided into four categories: (1) intrinsic qualities, (2) self development, (3) outlook, (4)
management skills (Table 1.3).
Respondents were asked to rate their REM on a five point scale where “1” indicates superior
performance or possession of a positive attribute, “2” indicates excellent, or above average
competence, “3” indicates average performance or possession of the attribute, “4” represents fair
or somewhat below average and “5” indicates poor performance or possession of an attribute.
Intrinsic qualities. Four attributes comprised this category: (1) the REM’s personal values being
consistent with the management team values, (2) the REM being honest about mistakes the REM
made, (3) ease for evaluator to trust the REM, and (4) ease for others to trust the REM.
We can evaluate the intrinsic qualities of the four statements by summing the proportion of
REMs that were assessed above average,” (i.e., scores of 1 or 2) and contrast this with the
proportion that rated their REM “below average” (i.e., scores of 4 or 5). Overall, in regard to
these four attributes, evaluators scored their REM positively. Seventy-five percent or more of the
evaluators gave their REMs above average ratings.

14
Only between 7 and 9 percent of REMs were evaluated negatively on their intrinsic qualities.
The average negative score on this dimension was 8. The largest proportion of negative scores (9
percent) was that “others find it easy to trust this manager.” Eight percent stated that their REM’s
personal values were not always consistent with the management team. As many, 8 percent,
stated the manager was below average in being honest about his mistakes. Only seven percent
said they found it difficult to trust their REM.
Self-development. The second dimension, self-development, was comprised of five attributes:
(1) the REM seeks feedback from knowledgeable others; (2) the REM is receptive to
constructive criticism, (3) the REM takes direction well, (4) the REM is open to new ideas and
(5) the REM deals with facts when deciding on issues. Again, as was true for the intrinsic
qualities, evaluators gave their REM high marks on self development. Seventy six percent or
more of the REMs were given scores above average.
Negative evaluations on this dimension ranged from a low of four to a high of 10; the average
negative percentage was 6.2. Of the five questions, ten percent rated their REM negatively
relative to not seeking feedback from others who are more knowledgeable. On the other hand,
only four percent rated their REM negatively on not being open to new ideas.
Outlook. The third dimension evaluated REMs on six qualities that reflect on the perceived
mental state that the REM exhibits. Attributes included in this dimension were: (1) being self
assured, (2) showing respect to superiors, (3) having a positive mental attitude, (4) being in
control of emotions, (5) enjoying the work, and (6) having a good sense of humor.
As was the case for intrinsic and self development dimensions, evaluators gave high marks to
their REMs’ outlook. Seventy-six or more percent rated their REMs as excellent or superior on
the six attributes.
Negative scores on this dimension ranged from a low of two percent to a high of 9 percent. The
average negative percentage was 5.5. Nine percent of evaluators stated their REM was not in
control of his emotions. Only two percent said that their REM does not have a positive mental
attitude.
Management skills. The fourth dimension evaluated REMs on 11 qualities that reflect on the
management skills of the REM. Included here were: (1) handling difficult people or situations
with diplomacy, (2) understanding organizational politics, (3) confronting others about their
mistakes, (4) setting challenging goals for staff, (5) exercising authority easily, (6) reading other
people’s emotions well, (7) working easily with others, (8) being sensitive when communicating
with diverse cultures, (9) using various techniques to influence others, (10) building rapport with
peers and others on the management team, and (11) communicating directly about controversial
issues.
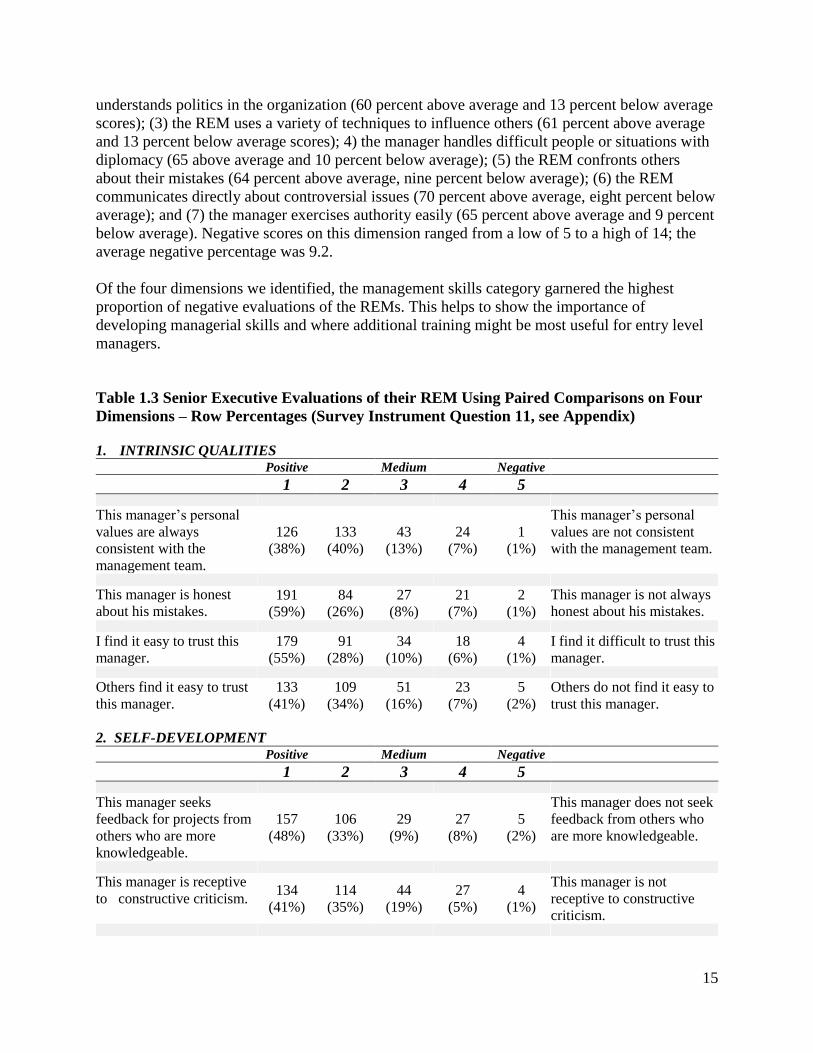
Whereas none of the previous attributes received less than 75 percent above average scores, 7 out
of the 11 attributes on management skills did not reach the 75 percent threshold.
More negative evaluations were given to the following: (1) the REM can read other people’s
emotions well (54 percent above average;14 percent below average scores); (2) the REM
15
understands politics in the organization (60 percent above average and 13 percent below average
scores); (3) the REM uses a variety of techniques to influence others (61 percent above average
and 13 percent below average scores); 4) the manager handles difficult people or situations with
diplomacy (65 above average and 10 percent below average); (5) the REM confronts others
about their mistakes (64 percent above average, nine percent below average); (6) the REM
communicates directly about controversial issues (70 percent above average, eight percent below
average); and (7) the manager exercises authority easily (65 percent above average and 9 percent
below average). Negative scores on this dimension ranged from a low of 5 to a high of 14; the
average negative percentage was 9.2.
Of the four dimensions we identified, the management skills category garnered the highest
proportion of negative evaluations of the REMs. This helps to show the importance of
developing managerial skills and where additional training might be most useful for entry level
managers.
Table 1.3 Senior Executive Evaluations of their REM Using Paired Comparisons on Four
Dimensions – Row Percentages (Survey Instrument Question 11, see Appendix)
1. INTRINSIC QUALITIES Positive Medium Negative
1 2 3 4 5
This manager’s personal
values are always
consistent with the
management team.
126
(38%)
133
(40%)
43
(13%)
24
(7%)
1
(1%)
This manager’s personal
values are not consistent
with the management team.
This manager is honest
about his mistakes. 191
(59%)
84
(26%)
27
(8%)
21
(7%)
2
(1%)
This manager is not always
honest about his mistakes.
I find it easy to trust this
manager.
179
(55%)
91
(28%)
34
(10%)
18
(6%)
4
(1%)
I find it difficult to trust this
manager.
Others find it easy to trust
this manager.
133
(41%)
109
(34%)
51
(16%)
23
(7%)
5
(2%)
Others do not find it easy to
trust this manager.
2. SELF-DEVELOPMENT Positive Medium Negative
1 2 3 4 5
This manager seeks
feedback for projects from
others who are more
knowledgeable.
157
(48%)
106
(33%)
29
(9%)
27
(8%)
5
(2%)
This manager does not seek
feedback from others who
are more knowledgeable.
This manager is receptive
to constructive criticism. 134
(41%)
114
(35%)
44
(19%)
27
(5%)
4
(1%)
This manager is not
receptive to constructive
criticism.

16
Positive Medium Negative
1 2 3 4 5 This manager takes
direction well. 169
(52%)
92
(28%)
43
(13%)
19
(6%)
0
(0%)
This manager does not take
direction well.
This manager is open to
new ideas.
184
(57%)
93
(29%)
32
(10%)
12
(4%)
1
(0%)
This manager is not open to
new ideas.
This manager deals with
facts when deciding on
issues.
126
(39%)
131
(41%)
47
(15%)
13
(4%)
3
(1%)
This manager does not deal
with fact when deciding on
issues.
3. OUTLOOK Positive Medium Negative
1 2 3 4 5
This manager is
sufficiently self-assured.
116
(36%)
130
(40%)
56
(17%)
20
(6%)
2
(1%)
This manager is not
sufficiently self-assured.
This manager shows
appropriate
respect to his superiors.
194
(60%)
90
(28%)
25
(8%)
9
(3%)
4
(1%)
This manager does not show
appropriate respect to his
superiors.
This manager has a
positive mental attitude.
201
(62%)
90
(28%)
25
(8%)
7
(2%)
1
(0%)
This manager does not have
a positive mental attitude.
This manager is in control
of his emotions. 140
(43%)
110
(34%)
43
(13%)
27
(8%)
2
(1%)
This manager is not in
control of his emotions.
This manager enjoys his
work.
186
(58%)
105
(32%)
23
(7%)
6
(2%)
0
(0%)
This manager does not enjoy
his work.
This manager has a good
sense of humor.
173
(54%)
109
(34%)
26
(8%)
10
(3%)
2
(1%)
This manager does not have
a good sense of humor
4. MANAGEMENT SKILLS Positive Medium Negative
1 2 3 4 5
This manager sets
challenging goals for his
staff.
134
(42%)
107
(33%)
44
(19%)
27
(5%)
4
(1%)
This manager does not set
challenging goals for his
staff.
This manager exercises
authority easily.
82
(25%)
128
(40%)
84
(26%)
26
(8%)
3
(1%)
This manager does not
exercise authority easily.
This manager can read
other people’s emotions
well.
57
(18%)
116
(36%)
106
(33%)
35
(11%)
11
(3%)
This manager cannot read
other people’s emotions
well.
It is easy for this manager
to work with others. 155
(48%)
100
(31%)
46
(14%)
22
(7%)
1
(0%)
It is not easy for this
manager to work with
others.

17
Positive Medium Negative
1 2 3 4 5 This manager is sensitive
to culturally correct
behavior when
communicating with
diverse cultures.
138
(43%)
119
(37%)
51
(16%)
12
(4%)
2
(1%)
This manager is not
sensitive to culturally
correct behavior when
communicating with diverse
cultures.
This manager confronts
others about their mistakes. 72
(22%)
134
(42%)
86
(27%)
26
(8%)
3
(1%)
This manager does not
confront others about their
mistakes.
This manager handles
difficult people or
situations with diplomacy.
91
(28%)
120
(37%)
77
(24%)
29
(9%)
3
(1%)
This manager does not
handle difficult people or
situations with diplomacy.
This manager understands
politics in the organization. 69
(22%)
121
(38%)
86
(27%)
34
(10%)
10
(3%)
This manager does not
understand politics in the
organization.
This manager
communicates directly
about controversial issues.
87
(27%)
138
(43%)
69
(21%)
25
(7%)
3
(1%)
This manager fails to
communicate directly about
controversial issues.
This manager uses a
variety of techniques to
influence others.
62
(20%)
130
(41%)
86
(27%)
32
(10%)
8
(3%)
This manager does not use a
variety of techniques to
influence others.
This manager builds
rapport with peers and
others on the management
team.
127
(39%)
125
(38%)
47
(15%)
20
(6%)
3
(1%)
This manager does not build
rapport with peers and
others on the management
team.
b. REMs’ Competencies compared with Evaluators’ Own Competencies at the Same Career Stage
One way to determine if today’s young managers are up to par is to ask senior executives to
compare their REM’s competence with their own abilities when they entered the profession. As
shown in Table 1.4, six areas of competence were presented. It appears that a sizeable minority
of respondents evaluated their REM negatively compared to themselves at the same career stage.
The table shows that fully 39 percent of REMs were deemed less competent than their evaluators
in developing others. Thirty-seven percent of REMs were deemed less competent in
marketing/strategic planning. Senior executives evaluated their REMs as less competent
compared to themselves in communications (34 percent), problem solving (30 percent) and
interpersonal skills (30 percent). However, far fewer, 15 percent, evaluated REMs as less
competent than themselves with respect to managerial ethics and values. That fully 30 percent of
senior executives evaluate their REMs as less competent in interpersonal skills provides a second
piece of evidence suggesting the importance of our research.

18
Table 1.4 Senior Executives’ Appraisal of their REM’s Competencies in Relation to their
own at the Same Stage of their Career – Row Percentages (Survey Instrument Question 12,
see Appendix)
Competencies Much
worse
Worse
About
the
same
Better
Much
better
a. Managerial ethics & values 2
(1%)
45
(14%)
222
(72%)
36
(12%)
6
(2%)
b. Communication 8
(3%)
97
(31%)
136
(43%)
65
(21%)
9
(3%)
c. Problem solving 6
(2%)
87
(28%)
167
(54%)
44
(14%)
6
(2%)
d. Interpersonal skills 10
(3%)
82
(27%)
153
(50%)
56
(18%)
6
(2%)
e. Developing others 15
(5%)
106
(34%)
156
(50%)
35
(11%)
2
(1%)
f. Marketing/Strategic Planning. 13
(4%)
101
(33%)
117
(38%)
60
(19%)
18
(6%)
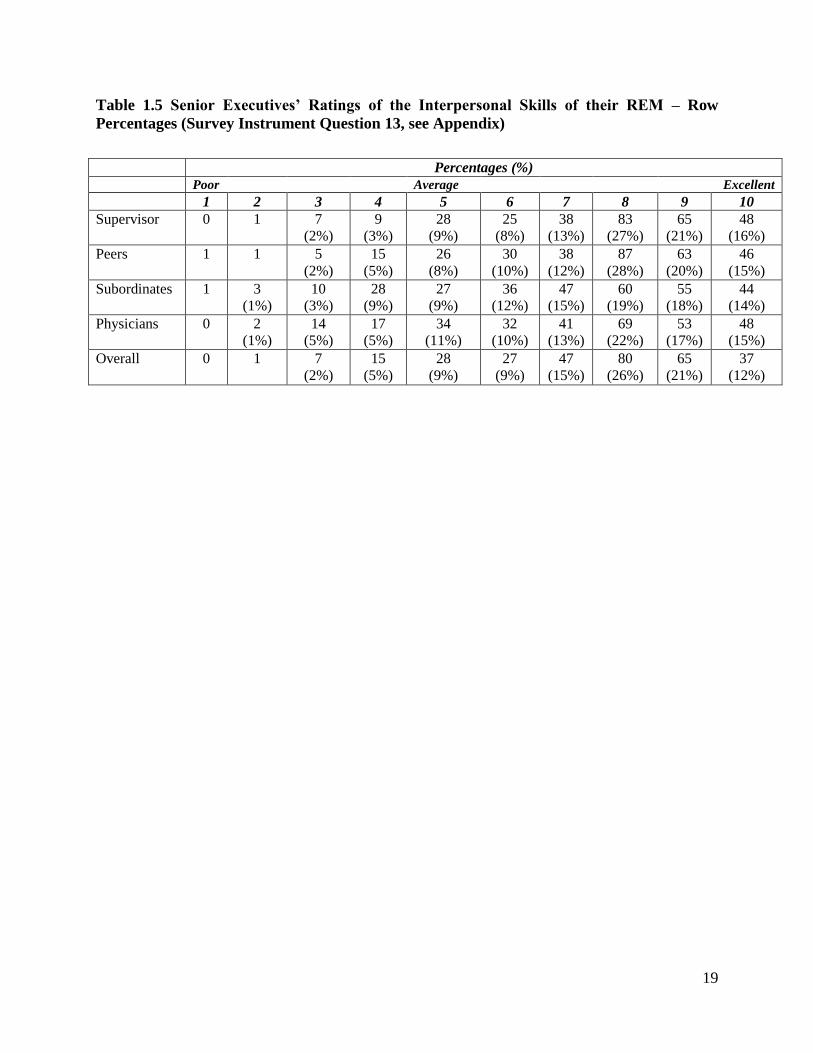
c. Rating of REMS’ Interpersonal Skills with Other Role Incumbents
Table 1.5 shows the overall evaluation given by senior executives of the REMs relative to
supervisors, peers, subordinates and physicians. To provide the evaluation, senior executives
gave their REM a score on a scale ranging from 1 (poor) to 10 (excellent). For the purposes of
this research, scores were collapsed into three general categories: below average (scores 1-4),
average (5-7) and above average (8-10).
It can be seen that REMs were evaluated differently depending on who was being discussed. For
example over 60 percent rated the REMs above average in relating to their supervisor or to peers
and fewer than 10 percent rated their REMs below average in dealing with these groups. On the
other hand, about half of evaluators rated their REM above average when dealing with
subordinates or physicians and the proportion rating their REM below average was 13 percent
for subordinates and 11 percent for physicians.
The overall, summary measure of the REMS’ interpersonal skills showed that one third of the
evaluators rated their REMs as average, 59 percent rated their REM above average and 7 percent
rated them below average.
19
Table 1.5 Senior Executives’ Ratings of the Interpersonal Skills of their REM – Row
Percentages (Survey Instrument Question 13, see Appendix)
Percentages (%)
Poor Average Excellent
1 2 3 4 5 6 7 8 9 10
Supervisor
0 1 7
(2%)
9
(3%)
28
(9%)
25
(8%)
38
(13%)
83
(27%)
65
(21%)
48
(16%)
Peers
1 1 5
(2%)
15
(5%)
26
(8%)
30
(10%)
38
(12%)
87
(28%)
63
(20%)
46
(15%)
Subordinates
1 3
(1%)
10
(3%)
28
(9%)
27
(9%)
36
(12%)
47
(15%)
60
(19%)
55
(18%)
44
(14%)
Physicians
0 2
(1%)
14
(5%)
17
(5%)
34
(11%)
32
(10%)
41
(13%)
69
(22%)
53
(17%)
48
(15%)
Overall
0 1 7
(2%)
15
(5%)
28
(9%)
27
(9%)
47
(15%)
80
(26%)
65
(21%)
37
(12%)

20
Chapter 2: The Impact of Senior Executives’ Generation on How They
Evaluated their REM
As noted in the background section, a central objective of this research was to characterize the
different generations of the evaluators to their REM. When the data were analyzed, we
discovered there were only two generations that were sufficiently well represented to
characterize each: Gen X and Baby Boomers. Of the 615 completed surveys, 292 respondents
were able to identify a REM with whom they worked on a regular basis. We received 23
responses from Traditionalist cohort, 238 in the Boomer cohort, and 58 in the Generation X, and
none in Generation Y. Therefore, it became impossible to complete a true cohort analysis with
the data in hand. To capture some of the differences, we decided to divide the Boomer
generation in half and label them Older Boomers (Age 57-66), and Younger Boomers (Age 47-
56). There were sufficient individuals of whom we could apply percentages using this
modification.
The main hypothesis that we will explore in this chapter is whether or not evaluators from
different generations perceive their REM differently. While the formal definition of the
generations has been altered, patterns may nevertheless be detected. We will first describe the
respondents’ demographic characteristics as well as their professional positions (Tables 2.1–2.3).
We will then turn our attention to describing their REMs (Tables 2.4–2.5). We conclude with a
description of the REMs’ interpersonal skills evaluated by the three generations of senior
executives i.e., Gen Xers, Younger Boomer, and Older Boomers (Tables 2.6–2.8).
Demographic and Positional Characteristics of Evaluators by Generation
When we look at the gender distribution of respondents (evaluators) by generation, we see that
about two thirds of Gen X and Older Boomers are male. In contrast, only about 60 percent of
Younger Boomers are male (Table 2.1a).
Examining the education of senior executives by generation shows that for all three groups, a
high proportion majored in Healthcare Management and Policy. The second most common major
for all three groups was Business. There was a significant difference among the generations
relative to their major (Table 2.1b).
Senior executives held positions that varied by generation. Over a third of Gen Xers are in vice
president positions compared to only 17 percent of Older Boomers. Conversely, while 52 percent
of Older Boomers are CEOs, only 30 percent of Gen Xers are CEOs. In fact, there is a
monotonic relationship in the proportion of positions held at the highest and lowest levels in the
organizations’ hierarchy. One interesting finding is that a higher proportion of Younger Boomers
are CNOs when compared to the other two generations. This feature probably accounts for the
higher proportion of women of that generation in this study.
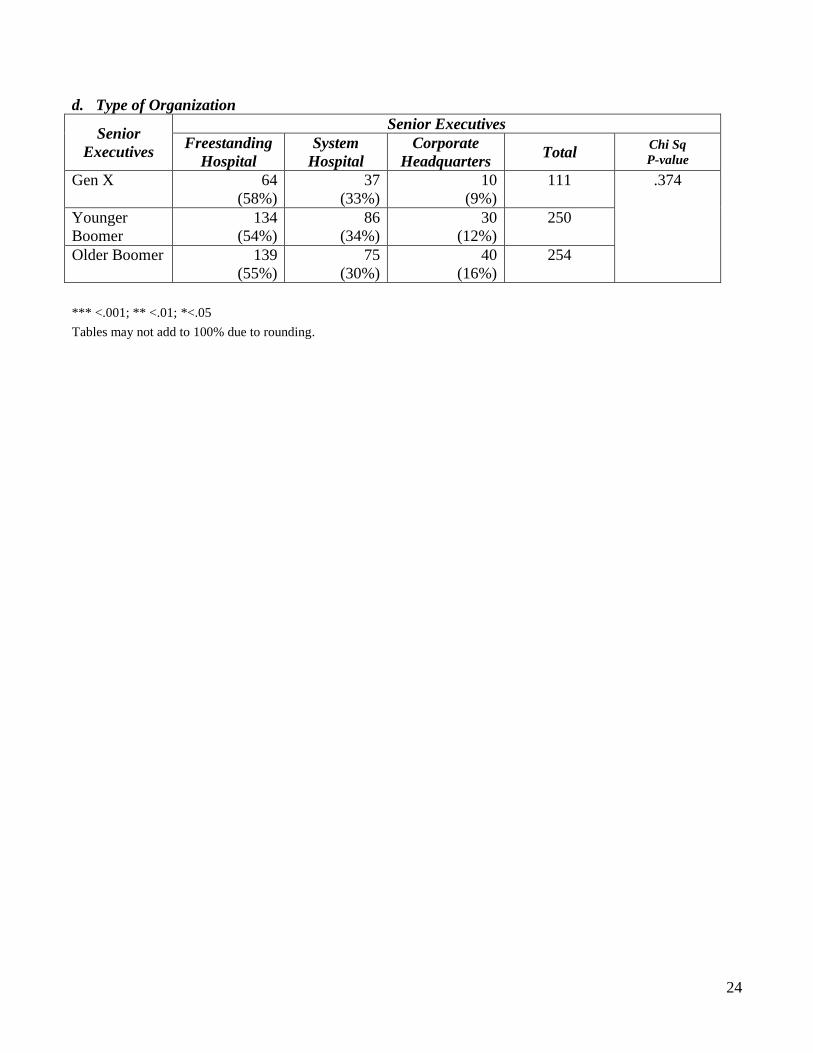
Viewing the type of organization that the senior executives lead, (i.e., corporate headquarters of
systems, system hospitals, or freestanding hospitals) showed no significant differences by
generation (Table 2.1d).

21
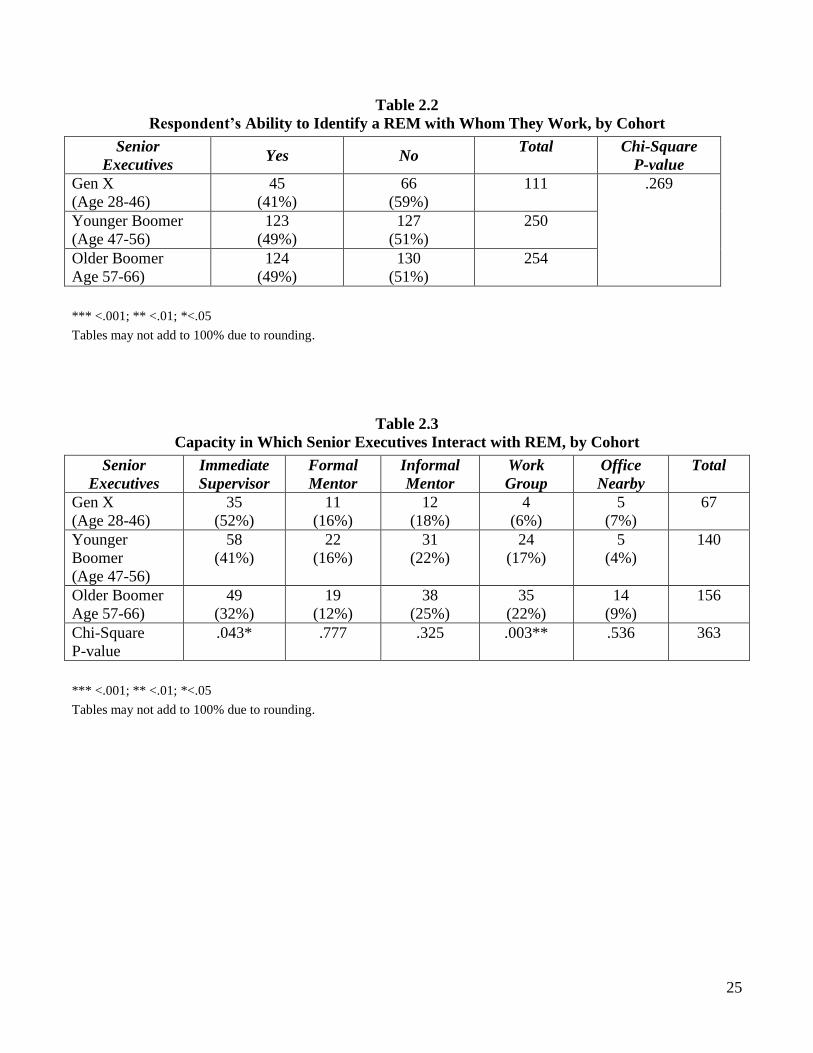
Table 2.2 presents a key finding concerning the representativeness of the respondents. It can be
seen that between 40 and 50 percent of each generation could identify a REM with whom they
worked on a regular basis. Thus, as far as generation is concerned, there were no major
differences between those that could complete the survey on their REM and the other
respondents who were unable to do so.
Table 2.3 shows the capacity in which the senior executive evaluator interacted with their REM
by generation. Overall the largest proportion of each generation related to their REM as an
immediate supervisor. However, there were variations in the proportion acting in this capacity by
generation. For example 52 percent of Gen Xers worked with their REM as an immediate
supervisor while only 32 percent of Older Boomers did so. Conversely, a higher proportion of
Older Boomers worked with their REM as part of a work group (22 percent) compared to 6
percent of Gen X respondents.
The Demographic Characteristics of REMs by Evaluator’s Cohort The question explored in this section is whether or not the three generations of evaluators
worked with REMs that were similar or different using demographic and educational background
measures. In brief, the answer is, no. REMs were similar across the generations of evaluators.
The REMS of the three generations were similar in age, gender, marital status, number of
children and race/ethnicity (Table 2.4). Finally, with regard to the REMs’ education, there were
no significant differences among those who were evaluated by Gen Xers, Younger Boomers or
Older Boomers (Table 2.5).
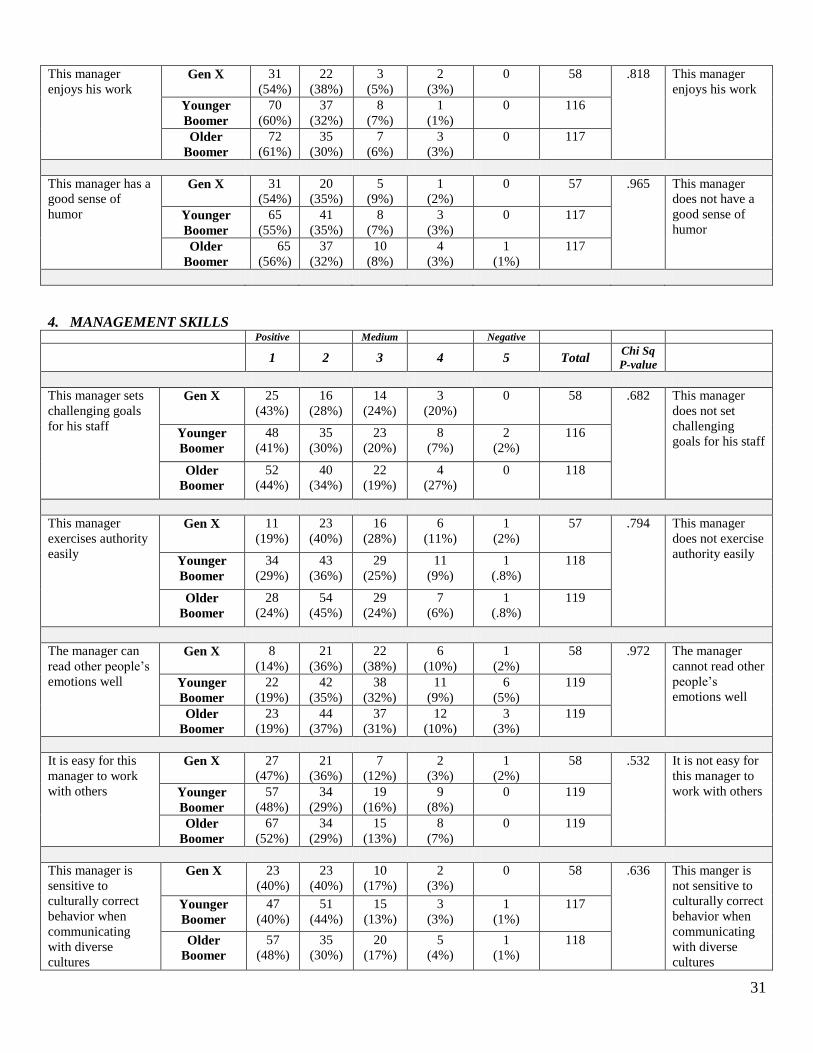
a. Paired Comparisons on Intra- and Interpersonal attributes
The senior executives were asked to assess the REM on 26 interpersonal competencies based on
generational age band which includes Gen X (28 – 46 years); Younger Boomer (47 – 56 years);
and Older Boomer (57 – 66 years). The senior executive respondent age had no impact on their
assessment of the REM with the exception of “this manager confronts others about their
mistakes” In this regard, a higher proportion of evaluators who were members of Gen X (20%)
stated that their REM did not confront others about their mistakes (Table 2.6).
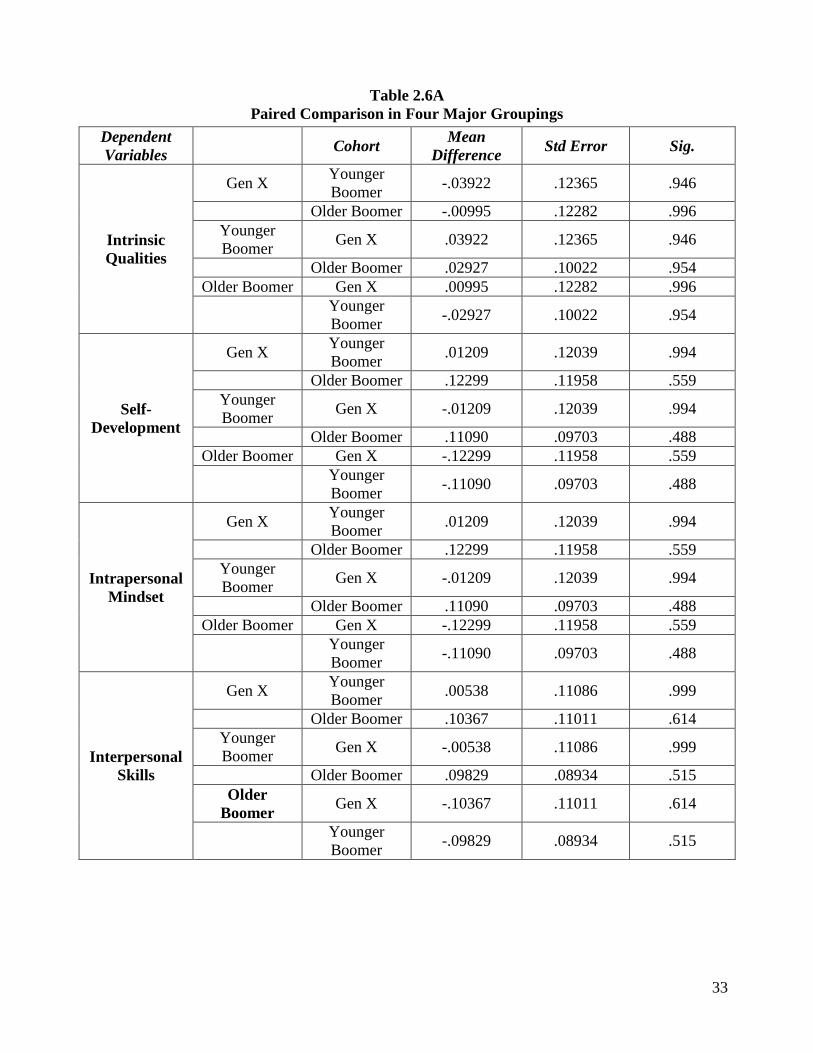
Aside from the row percentages and tests of generational effects using the Chi-square statistic,
we also computed the mean scores on each measure and tested their differences to determine if
there were significant differences. As shown in Table 2.6A, there were no significant
generational effects observed.
b. REMs’ Competencies compared with Evaluators’ Own Competencies at the Same Career Stage
When the senior executives assessed the REMs competencies relative to their own competency
at the same career stage, there were no significant generational effects relative to managerial
ethics and values, communication, problem solving interpersonal skills or marketing/strategic
planning. However, more Gen X evaluators (45 percent) than older evaluators said their REM
performed more poorly in developing others than they did at their career stage (Table 2.7).

22
c. Rating of REMS’ Interpersonal Skills with Other Role Incumbents
The interpersonal skills of the REMs as evaluated by the senior executive respondents by age
cohort did not show significant differences. Thus, Gen X, Younger Boomer, and Older Boomers
evaluated their REMs interpersonal skills with supervisors, peers, subordinates, and physicians
quite similarly. Moreover, taking all of the REMs’ interpersonal skills in a summary measure
showed no significant differences by the evaluators’ age cohort (Table 2.8).

23
Table 2.1
Demographic and Position Characteristics of Respondents, by Cohort
a. Gender of Respondents***
Senior
Executives
Senior Executives
Female % Male % Total Chi Sq
P-value
Gen X 28
(25%)
83
(75%)
111 .001***
Younger
Boomer
102
(41%)
148
(59%)
250
Older Boomer 59
(23%)
195
(77%)
254
b. Education*
Senior
Executives Health
Management Business
Clinical/
Allied
Health Other Total
Chi Sq
P-value
Gen X 66
(57%)
35
(30%)
11
(9%)
4
(3%)
116 .019*
Younger
Boomer
114
(45%)
76
(30%)
47
(19%)
15
(6%)
252
Older
Boomer
147
(51%)
71
(25%)
39
(14%)
29
(10%)
286
Does not add to 100% because multiple responses were given
c. Position Held***
Senior
Executives
Senior Executives
CEO COO CFO CIO CMO CNO SVP VP Total Chi Sq
P-value
Gen X 33
(30%)
23
(21%)
6
(5%)
1
(1%)
0 4
(4%)
4
(4%)
40
(36%)
111
.001***
Younger
Boomer
94
(38%)
31
(12%)
6
(2%)
4
(2%)
4
(2%)
26
(10%)
13
(5%)
72
(29%)
250
Older
Boomer
131
(52%)
31
(12%)
9
(4%)
1
5
(2%)
15
(6%)
18
(7%)
44
(17%)
254
24
d. Type of Organization
Senior
Executives
Senior Executives
Freestanding
Hospital
System
Hospital
Corporate
Headquarters Total
Chi Sq
P-value
Gen X 64
(58%)
37
(33%)
10
(9%)
111 .374
Younger
Boomer
134
(54%)
86
(34%)
30
(12%)
250
Older Boomer 139
(55%)
75
(30%)
40
(16%)
254
*** <.001; ** <.01; *<.05
Tables may not add to 100% due to rounding.
25
Table 2.2
Respondent’s Ability to Identify a REM with Whom They Work, by Cohort
Senior
Executives Yes No
Total Chi-Square
P-value
Gen X
(Age 28-46)
45
(41%)
66
(59%)
111 .269
Younger Boomer
(Age 47-56)
123
(49%)
127
(51%)
250
Older Boomer
Age 57-66)
124
(49%)
130
(51%)
254
*** <.001; ** <.01; *<.05
Tables may not add to 100% due to rounding.
Table 2.3
Capacity in Which Senior Executives Interact with REM, by Cohort
Senior
Executives
Immediate
Supervisor
Formal
Mentor
Informal
Mentor
Work
Group
Office
Nearby
Total
Gen X
(Age 28-46)
35
(52%)
11
(16%)
12
(18%)
4
(6%)
5
(7%)
67
Younger
Boomer
(Age 47-56)
58
(41%)
22
(16%)
31
(22%)
24
(17%)
5
(4%)
140
Older Boomer
Age 57-66)
49
(32%)
19
(12%)
38
(25%)
35
(22%)
14
(9%)
156
Chi-Square
P-value
.043* .777 .325 .003** .536 363
*** <.001; ** <.01; *<.05
Tables may not add to 100% due to rounding.

26
Table 2.4
Demographic Characteristics of REM, by Senior Executive Cohort
a. Age of REM
Senior Executives Mean Age Chi Square/P-
value
Gen X
(Age 28 – 46)
28.47 .159
Younger Boomer
(Age 47 – 56)
29.64
Older Boomer
(Age 57 – 66)
29.39
b. Gender of REM
Senior Executives Male Female Total Chi Square/P-
value
Gen X
(Age 28 – 46)
33
(55%)
27
(45%)
60 .221
Younger Boomer
(Age 47 – 56)
50
(41%)
71
(59%)
121
Older Boomer
(Age 57 – 66)
59
(46%)
70
(54%)
128
c. Marital Status of REM
Senior Executives MARRIED SINGLE DON’T
KNOW
Total Chi Square/P-
value
Gen X
(Age 28 – 46)
40
(67%)
19
(32%)
1
(8%)
60 .051
Younger Boomer
(Age 47 – 56)
82
(68%)
38
(31%)
1
(8%)
121
Older Boomer
(Age 57 – 66)
84
(66%)
34
(27%)
10
(8%)
128
d. REM Parental Status
Senior Executives WITH
CHILDREN
WITHOUT
CHILDREN
Chi Square/P-
value
Gen X
(Age 28 – 46)
28
(47%)
32
(53%)
.062
Younger Boomer
(Age 47 – 56)
54
(46%)
64
(54%)
Older Boomer
(Age 57 – 66)
62
(52%)
57
(48%)

27
e. REM Ethnicity/Race
Senior Executives American
Indian Asian
Black/
African
American
White/
Caucasian Hispanic Other
Gen X
(Age 28 – 46)
0 3
(19%)
6
(22%)
48
(19%)
2
(13%)
0
Younger Boomer
(Age 47 – 56)
0 8
(50%)
12
(44%)
101
(40%)
3
(20%)
3
(50%)
Older Boomer
(Age 57 – 66)
1
(100%)
5
(31%)
9
(33%)
103
(41%)
10
(67%)
3
(50%)
TOTAL 1 16
27 252 15 6
Chi-Square/
P-value
.479
.661
.729
.962
.103
.471
*** <.001; ** <.01; *<.05
Tables may not add to 100% due to rounding.

28
Table 2.5
Education and Clinical Experience of REM, by Senior Executive Cohort
Senior
Executives
REM Education and Clinical Experience
Health
Manage-
ment &
policy
Business Public
admini-
stration
Commu-
nity
Health
Nursing Medicine Did not
complete
graduate
study
Other Don’t
know
Gen X (Age
28-46)
31 11 2 4 3 0 10 1 1
(45%) (17%) (3%) (6%) (5%) (16%) (2%) (2%)
Younger
Boomer
(Age 47-56)
51 29 3 7 11 2 16 0 3
(42%) (24%) (2%) (6%) (9%) (2%) (13%) (2%)
Older
Boomer
(Age 57-66)
63 32 3 3 10 1 16 4 3
(43%) (45%) (38%) (21%) (41%) (33%) (38%) (80%) (43%)
Chi Sq
P-value
0.349 0.562 0.935 0.300 0.634 0.554 0.726 0.149 0.938
*** <.001; ** <.01; *<.05
Tables may not add to 100% due to rounding.

29
Table 2.6
Paired Comparisons on Dimensions of Interpersonal Competency, by Cohort
1. INTRINSIC QUALITIES
Positive Medium Negative
1 2 3 4 5 Total Chi Sq
P-value
This manager’s
personal values are
always consistent
with the
management team
Gen X 24
(41%)
25
(42%)
7
(12%)
3
(5%) 0 59 .413 This manager’s
personal values
are not
consistent with
the management
team
Younger
Boomer
47
(40%)
41
(35%)
21
(17%)
10
(8%)
0 119
Older
Boomer
48
(40%)
54
(45%)
10
(26%)
7
(35%)
1
(8%)
120
This manager is
honest about his
mistakes
Gen X
33
(57%)
17
(29%)
5
(9%)
2
(3%)
1
(2%)
58 .536 This manager is
not always
honest about his
mistakes Younger
Boomer
73
(62%)
25
(21%)
12
(10%)
7
(6%)
1
(.8%)
118
Older
Boomer
71
(59%)
33
(28%)
6
(5%)
10
(8%)
0 120
I find it easy to
trust this manager Gen X 32
(55%)
17
(29%)
6
(10%)
3
(5%)
0 58 .269 I find it difficult
to trust this
manager Younger
Boomer
74
(62%)
27
(23%)
11
(9%)
4
(3%)
3
(3%)
119
Older
Boomer
47
(40%)
44
(38%)
15
(13%)
8
(7%)
2
(2%)
116
Others find it easy
to trust this
manager
Gen X 25
(43%)
19
(33%)
10
(17%)
3
(5%)
1
(1%)
58 .984 Others do not
find it easy to
trust this
manager Younger
Boomer
45
(39%)
47
(40%)
19
(16%)
3
(3%)
2
(2%)
118
Older
Boomer
53
(45%)
47
(40%)
13
(11%)
4
(3%)
1
(1%)
116
2. SELF-DEVELOPMENT Positive Medium Negative
1 2 3 4 5 Total Chi Sq
P-value
This manager
seeks feedback for
projects from
others who are
more
knowledgeable
Gen X 27
(46%)
19
(33%)
7
(12%)
5
(9%)
0 58 .833 This manager
does not seek
feedback from
others who are
more
knowledgeable
Younger
Boomer
56
(47%)
42
(35%)
9
(8%)
9
(8%)
3
(2%)
119
Older
Boomer
62
(52%)
36
(30%)
9
(8%)
10
(9%)
1
(.8%)
118
This manager is
receptive to
constructive
criticism
Gen X
22
(39%)
20
(35%)
8
(14%)
6
(10%)
1
(2%)
57 .879 This manager is
not receptive to
constructive
criticism Younger
Boomer
48
(41%)
45
(38%)
15
(13%)
9
(8%)
1
(.8%)
118
Older
Boomer
57
(48%)
35
(29%)
18
(15%)
8
(7%)
1
(.8%)
119

30
This manager takes
direction well
Gen X
33
(57%)
12
(21%)
7
(12%)
5
(9%)
0 57 .317 This manager
takes direction
well Younger
Boomer
61
(52%)
30
(26%)
18
(15%)
8
(7%)
0 117
Older
Boomer
64
(53%)
41
(34%)
10
(8%)
5
(4%)
0 120
This manager is
open to new ideas Gen X
32
(55%)
18
(31%)
7
(12%)
1
(2%)
0 58 .398 This manager is
not open to new
ideas Younger
Boomer
67
(58%)
31
(27%)
10
(9%)
8
(7%)
0 116
Older
Boomer
72
(61%)
36
(30%)
8
(7%)
2
(1%)
1
(1%)
119
This manager deals
with facts when
deciding on issues
Gen X 20
(35%)
24
(42%)
7
(12%)
6
(11%)
0 57 .301 This manager
does not deal
with fact when
deciding on
issues
Younger
Boomer
45
(39%)
47
(40%)
19
(16%)
3
(3%)
2
(2%)
116
Older
Boomer
53
(45%)
47
(40%)
13
(11%)
4
(3%)
1
(1%)
118
3. OUTLOOK Positive Medium Negative
1 2 3 4 5 Total Chi Sq
P-value
This manager is
sufficiently self-
assured
Gen X
17
(30%)
24
(42%)
10
(18%)
6
(10%)
0
57 .229 This manager is
not sufficiently
self-assured Younger
Boomer
38
(32%)
46
(39%)
23
(20%)
10
(8%)
1
(.8%)
118
Older
Boomer
51
(43%)
48
(40%)
18
(15%)
2
(2%)
1
(.8%)
120
This manager
shows appropriate
respect to his
superiors
Gen X 35
(61%)
17
(30%)
5
(10%)
0 0 57 .840 This manager
does not show
appropriate
respect to his
superiors
Younger
Boomer
70
(59%)
33
(28%)
9
(8%)
4
(3%)
2
(2%)
118
Older
Boomer
75
(64%)
33
(28%)
6
(5%)
3
(3%)
1
(.8%)
118
This manager has a
positive mental
attitude
Gen X
32
(57%)
18
(32%)
4
(7%)
2
(4%)
0 56 .927 This manager
does not have a
positive mental
attitude Younger
Boomer
75
(63%)
33
(28%)
8
(7%)
2
(2%)
1
(.8%)
119
Older
Boomer
62
(65%)
34
(28%)
15
(6%)
8
(2%)
0 119
This manager is in
control of his
emotions
Gen X
26
(45%)
19
(33%)
6
(10%)
6
(10%)
1
(2%)
58 .924 This manager is
not in control of
his emotions Younger
Boomer
50
(42%)
42
(36%)
13
(11%)
12
(10%)
1
(1%)
118
Older
Boomer
55
(46%)
40
(35%)
14
(12%)
8
(7%)
0
117
31
This manager
enjoys his work Gen X
31
(54%)
22
(38%)
3
(5%)
2
(3%)
0 58 .818 This manager
enjoys his work
Younger
Boomer
70
(60%)
37
(32%)
8
(7%)
1
(1%)
0 116
Older
Boomer
72
(61%)
35
(30%)
7
(6%)
3
(3%)
0 117
This manager has a
good sense of
humor
Gen X
31
(54%)
20
(35%)
5
(9%)
1
(2%)
0 57 .965 This manager
does not have a
good sense of
humor Younger
Boomer
65
(55%)
41
(35%)
8
(7%)
3
(3%)
0 117
Older
Boomer
65
(56%)
37
(32%)
10
(8%)
4
(3%)
1
(1%)
117
4. MANAGEMENT SKILLS
Positive Medium Negative
1 2 3 4 5 Total Chi Sq
P-value
This manager sets
challenging goals
for his staff
Gen X
25
(43%)
16
(28%)
14
(24%)
3
(20%)
0 58 .682 This manager
does not set
challenging
goals for his staff Younger
Boomer
48
(41%)
35
(30%)
23
(20%)
8
(7%)
2
(2%)
116
Older
Boomer
52
(44%)
40
(34%)
22
(19%)
4
(27%)
0
118
This manager
exercises authority
easily
Gen X
11
(19%)
23
(40%)
16
(28%)
6
(11%)
1
(2%)
57 .794 This manager
does not exercise
authority easily Younger
Boomer
34
(29%)
43
(36%)
29
(25%)
11
(9%)
1
(.8%)
118
Older
Boomer
28
(24%)
54
(45%)
29
(24%)
7
(6%)
1
(.8%)
119
The manager can
read other people’s
emotions well
Gen X
8
(14%)
21
(36%)
22
(38%)
6
(10%)
1
(2%)
58 .972 The manager
cannot read other
people’s
emotions well Younger
Boomer
22
(19%)
42
(35%)
38
(32%)
11
(9%)
6
(5%)
119
Older
Boomer
23
(19%)
44
(37%)
37
(31%)
12
(10%)
3
(3%)
119
It is easy for this
manager to work
with others
Gen X 27
(47%)
21
(36%)
7
(12%)
2
(3%)
1
(2%)
58 .532 It is not easy for
this manager to
work with others Younger
Boomer
57
(48%)
34
(29%)
19
(16%)
9
(8%)
0 119
Older
Boomer
67
(52%)
34
(29%)
15
(13%)
8
(7%)
0 119
This manager is
sensitive to
culturally correct
behavior when
communicating
with diverse
cultures
Gen X 23
(40%)
23
(40%)
10
(17%)
2
(3%)
0 58 .636 This manger is
not sensitive to
culturally correct
behavior when
communicating
with diverse
cultures
Younger
Boomer
47
(40%)
51
(44%)
15
(13%)
3
(3%)
1
(1%)
117
Older
Boomer
57
(48%)
35
(30%)
20
(17%)
5
(4%)
1
(1%)
118

32
This manager
confronts others
about their
mistakes*
Gen X
12
(21%)
25
(45%)
8
(14%)
11
(20%)
0 56 .043* This manager
does not
confront others
about their
mistakes
Younger
Boomer
26
(22%)
46
(39%)
36
(30%)
8
(7%)
2
(2%)
118
Older
Boomer
25
(21%)
50
(42%)
36
(31%)
6
(5%)
1
(1%)
118
This manager
handles difficult
people or situations
with diplomacy
Gen X
15
(26%)
20
(18%)
16
(28%)
6
(11%)
0 57 .959 This manager
does not handle
difficult people
or situations with
diplomacy
Younger
Boomer
36
(30%)
43
(36%)
27
(23%)
11
(9%)
1
(1%)
118
Older
Boomer
33
(28%)
46
(39%)
28
(24%)
10
(9%)
0 117
This manager
understands
politics in the
organization
Gen X
14
(24%)
23
(40%)
16
(28%)
4
(7%)
1
(2%)
58 .327 This manager
understands
politics in the
organization Younger
Boomer
24
(20%)
46
(40%)
24
(21%)
18
(15%)
5
(4%)
117
Older
Boomer
26
(22%)
42
(36%)
37
(32%)
8
(7%)
3
(3%)
116
This manager
communicates
directly about
controversial issues
Gen X
12
(21%)
27
(47%)
13
(22%)
6
(10%)
0 58 .648 This manager
fails to
communicate
directly about
controversial
issues
Younger
Boomer
35
(30%)
44
(38%)
24
(21%)
12
(10%)
2
(1%)
117
Older
Boomer
33
(28%)
54
(46%)
24
(20%)
6
(5%)
1
(1%)
118
This manager uses
a variety of
techniques to
influence others
Gen X 11
(19%)
21
(38%)
17
(30%)
5
(9%)
2
(4%)
56 .922 This manager
does not use a
variety of
techniques to
influence others
Younger
Boomers
21
(18%)
47
(40%)
31
(27%)
14
(12%)
3
(3%)
116
Older
Boomers
26
(22%)
51
(44%)
29
(25%)
8
(7%)
3
(3%)
117
This manager
builds rapport with
peers and others on
the management
team
Gen X 24
(41%)
23
(40%)
8
(14%)
3
(5%)
0 58 .955 This manager
does not build
rapport with
peers and others
on the
management
team
Younger
Boomers
46
(39%)
44
(38%)
19
(16%)
6
(5%)
2
(2%)
117
Older
Boomers
49
(41%)
48
(41%)
13
(11%)
7
(6%)
1
(1%)
118
33
Table 2.6A
Paired Comparison in Four Major Groupings
Dependent
Variables Cohort
Mean
Difference Std Error Sig.
Intrinsic
Qualities
Gen X Younger
Boomer -.03922 .12365 .946
Older Boomer -.00995 .12282 .996
Younger
Boomer Gen X .03922 .12365 .946
Older Boomer .02927 .10022 .954
Older Boomer Gen X .00995 .12282 .996
Younger
Boomer -.02927 .10022 .954
Self-
Development
Gen X Younger
Boomer .01209 .12039 .994
Older Boomer .12299 .11958 .559
Younger
Boomer Gen X -.01209 .12039 .994
Older Boomer .11090 .09703 .488
Older Boomer Gen X -.12299 .11958 .559
Younger
Boomer -.11090 .09703 .488
Intrapersonal
Mindset
Gen X Younger
Boomer .01209 .12039 .994
Older Boomer .12299 .11958 .559
Younger
Boomer Gen X -.01209 .12039 .994
Older Boomer .11090 .09703 .488
Older Boomer Gen X -.12299 .11958 .559
Younger
Boomer -.11090 .09703 .488
Interpersonal
Skills
Gen X Younger
Boomer .00538 .11086 .999
Older Boomer .10367 .11011 .614
Younger
Boomer Gen X -.00538 .11086 .999
Older Boomer .09829 .08934 .515
Older
Boomer Gen X -.10367 .11011 .614
Younger
Boomer -.09829 .08934 .515

34
Table 2.7
Recent REMs Competencies Compared with Senior Executives Views of Their Own
Competency at the Same Career Stage, by Cohort
a. REM Managerial ethics and values
Senior
Executives
Much
worse
1
Worse
2
About the
same
3
Better
4
Much
better
5
Total Chi Sq
P-value
Gen X 0 8
(14%)
41
(72%)
6
(11%)
2
(3%)
57
.859
Younger
Boomers
1
(1%)
17
(15%)
85
(74%)
10
(9%)
2
(2%)
115
Older
Boomers
1
(1%)
16
(14%)
78
(68%)
18
(16%)
2
(2%)
115
b. REM Communication
Senior
Executives
Much
worse
1
Worse
2
About the
same
3
Better
4
Much
better
5
Total Chi Sq
P-value
Gen X 0
20
(36%)
25
(45%)
11
(20%)
0 56
.107
Younger
Boomers
5
(4%)
32
(28%)
51
(44%)
26
(23%)
1
(1%)
115
Older
Boomers
2
(1%)
35
(30%)
52
(43%)
23
(19%)
8
(7%)
120
c. REM Problem solving
Senior
Executives
Much
worse
1
Worse
2
About the
same
3
Better
4
Much
better
5
Total Chi Sq
P-value
Gen X 1
(1%)
19
(34%)
25
(45%)
11
(20%)
0 56
.523
Younger
Boomers
3
(3%)
31
(28%)
62
(56%)
13
(12%)
2
(2%)
111
Older
Boomers
1
(1%)
28
(24%)
70
(59%)
17
(14%)
3
(3%)
119
d. REM Interpersonal skills
Senior
Executives
Much
worse
1
Worse
2
About the
same
3
Better
4
Much
better
5
Total Chi Sq
P-value
Gen X 0 15
(28%)
33
(61%)
6
(11%)
0 54
.116
Younger
Boomers
4
(4%)
30
(27%)
60
(54%)
16
(14%)
2
(2%)
112
Older
Boomers
5
(4%)
29
(24%)
51
(43%)
30
(25%)
4
(3%)
119

35
e. REM Developing others*
Senior
Executives
Much
worse
1
Worse
2
About the
same
3
Better
4
Much
better
5
Total Chi Sq
P-value
Gen X 0
26
(45%)
30
(52%)
2
(3%)
0 58
.036*
Younger
Boomers
9
(8%)
36
(32%)
53
(46%)
14
(12%)
2
(2%)
114
Older
Boomers
5
(4%)
35
(30%)
59
(50%)
19
(16%)
0 118
f. REM Marketing/Strategic planning
Senior
Executives
Much
worse
1
Worse
2
About the
same
3
Better
4
Much
better
5
Total Chi Sq
P-value
Gen X 2
(3%)
22
(39%)
23
(41%)
7
(13%)
2
(3%)
56
.472
Younger
Boomers
5
(4%)
37
(33%)
40
(35%)
26
(23%)
5
(4%)
113
Older
Boomers
2
(2%)
34
(29%)
48
(40%)
25
(21%)
10
(8%)
119
*** <.001; ** <.01; *<.05
Tables may not add to 100% due to rounding.

36
Table 2.8
The Interpersonal Skills of REMs as Evaluated by Senior Executive Respondents,
by Cohort as They Relate to:
a. Supervisors
Senior
Executives
REM Interpersonal Skills
Fair to Poor
(1-4)
Average
(5-7)
Good to Excellent
(8-10) Total
Chi Sq
P-value
Gen X 5
(9%)
14
(25%)
38
(67%)
57
.428
Younger
Boomers
4
(4%)
39
(35%)
69
(62%)
112
Older Boomers 6
(5%)
31
(28%)
75
(67%)
112
b. Peers
Senior
Executives
REM Interpersonal Skills
Fair to Poor
(1-4)
Average
(5-7)
Good to Excellent
(8-10) Total
Chi Sq
P-value
Gen X 3
(5%)
22
(39%)
32
(56%)
57
.438
Younger
Boomers
8
(7%)
33
(29%)
73
(64%)
114
Older Boomers 6
(5%)
30
(25%)
82
(69%)
118
c. Subordinates
Senior
Executives
REM Interpersonal Skills
Fair to Poor
(1-4)
Average
(5-7)
Good to Excellent
(8-10) Total
Chi Sq
P-value
Gen X 6
(11%)
26
(46%)
25
(44%)
57
.377
Younger
Boomers
16
(14%)
38
(33%)
61
(53%)
115
Older Boomers 12
(10%)
37
(32%)
66
(57%)
115
d. Physicians
Senior
Executives
REM Interpersonal Skills
Fair to Poor
(1-4)
Average
(5-7)
Good to Excellent
(8-10) Total
Chi Sq
P-value
Gen X 5
(9%)
22
(39%)
29
(52%)
56
.563
Younger
Boomers
11
(10%)
42
(37%)
60
(53%)
113
Older Boomers 13
(11%)
33
(28%)
71
(61%)
117

37
e. Overall
Senior
Executives
REM Interpersonal Skills
Fair to Poor
(1-4)
Average
(5-7)
Good to Excellent
(8-10) Total
Chi Sq
P-value
Gen X 4
(7%)
20
(34%)
34
(59%)
58
.970
Younger
Boomers
7
(6%)
38
(35%)
65
(59%)
110
Older Boomers 8
(7%)
35
(30%)
72
(63%)
115
*** <.001; ** <.01; *<.05
Tables may not add to 100% due to rounding.

38
Chapter 3: The Impact of Senior Executives’ Gender on How They Evaluated
their REM
When the study was initiated, the main interest was in showing the relationship of REM evaluation
outcomes and the generational effects of their evaluators. But after the generational effects of the
study were analyzed, we took the opportunity to study the impact of the REM’s gender on how they
were evaluated. That is the objective in this chapter.
Previous research on the impact of the gender of “raters,” is comprised of two types of studies,
those conducted in a laboratory and those conducted in the field. Bartol (1999) conducted a
literature review of both types of studies and concluded that “there was little or no impact of rater
gender on performance evaluations.” Citing one of few field studies reported in the literature, she
indicated that when the official ratings of more than 8,000 first term Army enlisted personnel were
examined, females gave higher ratings than males. On the other hand, two other field studies
showed no rater gender effects. She concluded that prior field studies had focused mostly on ratings
of non-managers and this paucity of research argued for more studies that address the ratings of
incumbents in managerial positions.
On the other hand, when assessing the performance of females and males, Eagly and Karau’s (1991)
meta-analysis on the emergence of leaders finds that men emerge more frequently on measures of
leadership as well as task oriented leadership. Women, on the other hand, emerge more frequently
than men on measures of social leadership (Eagly and Karau, 1991).
a. Paired Comparisons on Intra- and Interpersonal attributes When the 26 interpersonal competencies were assessed by the senior executives between REM
males and females, there was a difference between the genders in four areas (Table 3.1):
Dealing with facts when deciding on issues
Being sensitive to culturally correct behavior when communicating with diverse cultures
Understanding politics in the organization
Using a variety of techniques to influence others
In each instance, men evaluated the REM more favorably than did women.
b. REMs’ Competencies Compared with Evaluators’ Own Competencies at the Same Career Stage Senior executives were asked to assess the REM compared to their own competency at that career
stage. Again, the six areas that REMs were evaluated on included: managerial ethics and values,
communication, problem solving, interpersonal skills, developing others and marketing/strategic
planning. Differences in men’s and women’s evaluations were not significant on any of these
dimensions (Table 3.2).

39
c. Rating of REMS’ Interpersonal Skills with Other Role Incumbents The interpersonal skills of REMs as they relate to supervisors, peers, subordinates, and physicians
showed no difference between the responding evaluators. Moreover, there was no important
difference in the evaluators’ assessment of the REMs interpersonal skills overall (Table 3.3).

40
Table 3.1
Paired Comparisons of Interpersonal Skills, by Gender
1. INTRINSIC QUALITIES
This manager’s personal values are always consistent with the management team
Gender Positive Medium Negative
Total Chi Sq
P-value 1 2 3 4 5
Female 43
(37%)
45
(39%)
18
(16%)
8
(7%)
1
(1%)
115 .597
Male 82
(39%)
86
(41%)
25
(12%)
16
(8%)
0 209
This manager is honest about his mistakes
Gender Positive Medium Negative
Total Chi Sq
P-value 1 2 3 4 5
Female 73
(63%)
26
(23%)
7
(6%)
8
(7%)
1
(1%)
115 .621
Male 116
(56%)
58
28%)
19
(9%)
13
(6%)
1
207
I find it easy to trust this manager
Gender Positive Medium Negative
Total Chi Sq
P-value 1 2 3 4 5
Female 56
(49%)
36
(31%)
14
(12%)
7
(6%)
2
(2%)
115 .566
Male 121
(58%)
55
(26%)
19
(9%)
11
(5%)
2
(1%)
208
Others find it easy to trust this manager
Gender Positive Medium Negative
Total Chi Sq
P-value 1 2 3 4 5
Female 41
(36%)
39
(35%)
20
(18%)
11
(10%)
2
(2%)
113 .474
Male 91
(44%)
69
(34%)
31
(15%)
11
(5%)
3
(1%)
205
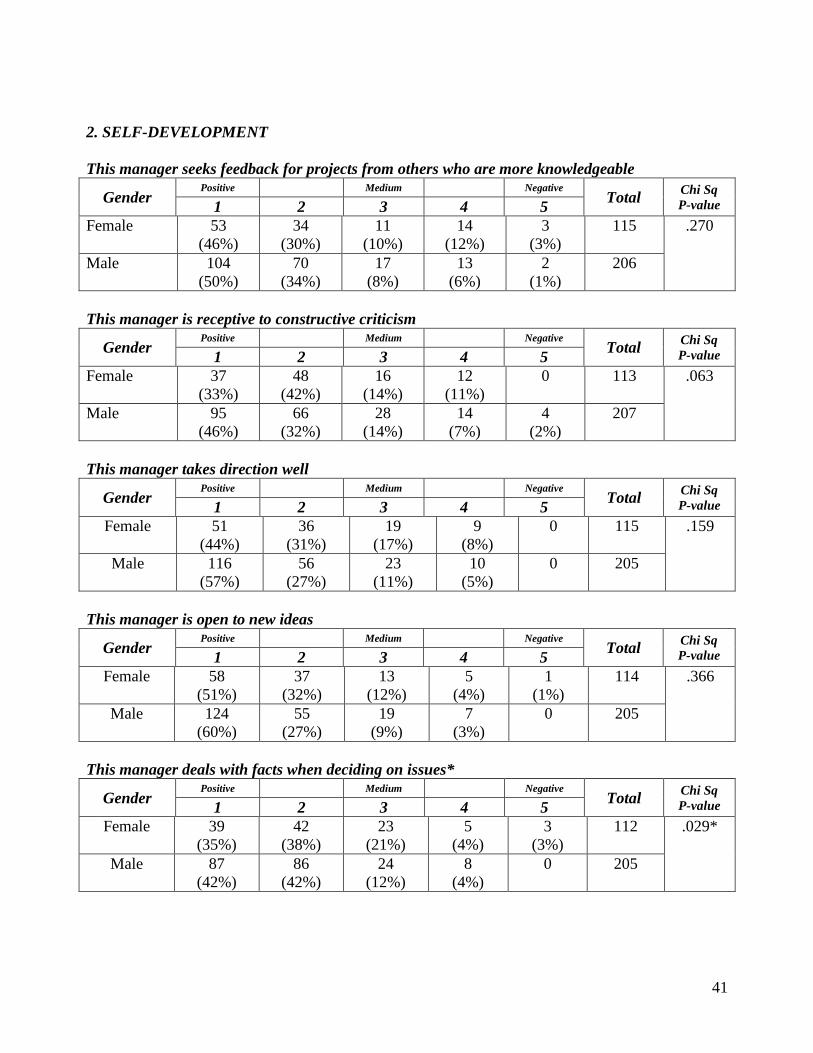
41
2. SELF-DEVELOPMENT
This manager seeks feedback for projects from others who are more knowledgeable
Gender Positive Medium Negative
Total Chi Sq
P-value 1 2 3 4 5
Female 53
(46%)
34
(30%)
11
(10%)
14
(12%)
3
(3%)
115 .270
Male 104
(50%)
70
(34%)
17
(8%)
13
(6%)
2
(1%)
206
This manager is receptive to constructive criticism
Gender Positive Medium Negative
Total Chi Sq
P-value 1 2 3 4 5
Female 37
(33%)
48
(42%)
16
(14%)
12
(11%)
0 113 .063
Male 95
(46%)
66
(32%)
28
(14%)
14
(7%)
4
(2%)
207
This manager takes direction well
Gender Positive Medium Negative
Total Chi Sq
P-value 1 2 3 4 5
Female 51
(44%)
36
(31%)
19
(17%)
9
(8%)
0 115 .159
Male 116
(57%)
56
(27%)
23
(11%)
10
(5%)
0 205
This manager is open to new ideas
Gender Positive Medium Negative
Total Chi Sq
P-value 1 2 3 4 5
Female 58
(51%)
37
(32%)
13
(12%)
5
(4%)
1
(1%)
114 .366
Male 124
(60%)
55
(27%)
19
(9%)
7
(3%)
0 205
This manager deals with facts when deciding on issues*
Gender Positive Medium Negative
Total Chi Sq
P-value 1 2 3 4 5
Female 39
(35%)
42
(38%)
23
(21%)
5
(4%)
3
(3%)
112 .029*
Male 87
(42%)
86
(42%)
24
(12%)
8
(4%)
0 205

42
3. OUTLOOK
This manager is sufficiently self-assured
Gender Positive Medium Negative
Total Chi Sq
P-value 1 2 3 4 5
Female 38
(33%)
42
(37%)
23
(20%)
10
(9%)
1
(1%)
114 .394
Male 77
(37%)
88
(43%)
31
(15%)
10
(5%)
1
207
This manager shows appropriate respect to his superiors
Gender Positive Medium Negative
Total Chi Sq
P-value 1 2 3 4 5
Female 57
(51%)
41
(37%)
7
(6%)
5
(4%)
2
(2%)
112 .056
Male 135
(65%)
49
(24%)
17
(8%)
4
(2%)
2
(1%)
207
This manager has a positive mental attitude
Gender Positive Medium Negative
Total Chi Sq
P-value 1 2 3 4 5
Female 69
(60%)
33
(29%)
8
(7%)
4
(3%)
1
(1%)
115 .496
Male 130
(63%)
57
(28%)
16
(8%)
3
(1%)
0 206
This manager is in control of his emotions
Gender Positive Medium Negative
Total Chi Sq
P-value 1 2 3 4 5
Female 41
(36%)
42
(37%)
17
(15%)
13
(11%)
1
(1%)
114 .275
Male 98
(48%)
67
(33%)
25
(12%)
14
(7%)
1
205
This manager enjoys his work
Gender Positive Medium Negative
Total Chi Sq
P-value 1 2 3 4 5
Female 61
(54%)
42
(37%)
8
(7%)
3
(3%)
0 114 .596
Male 123
(61%)
63
(31%)
14
(7%)
3
(1%)
0 203
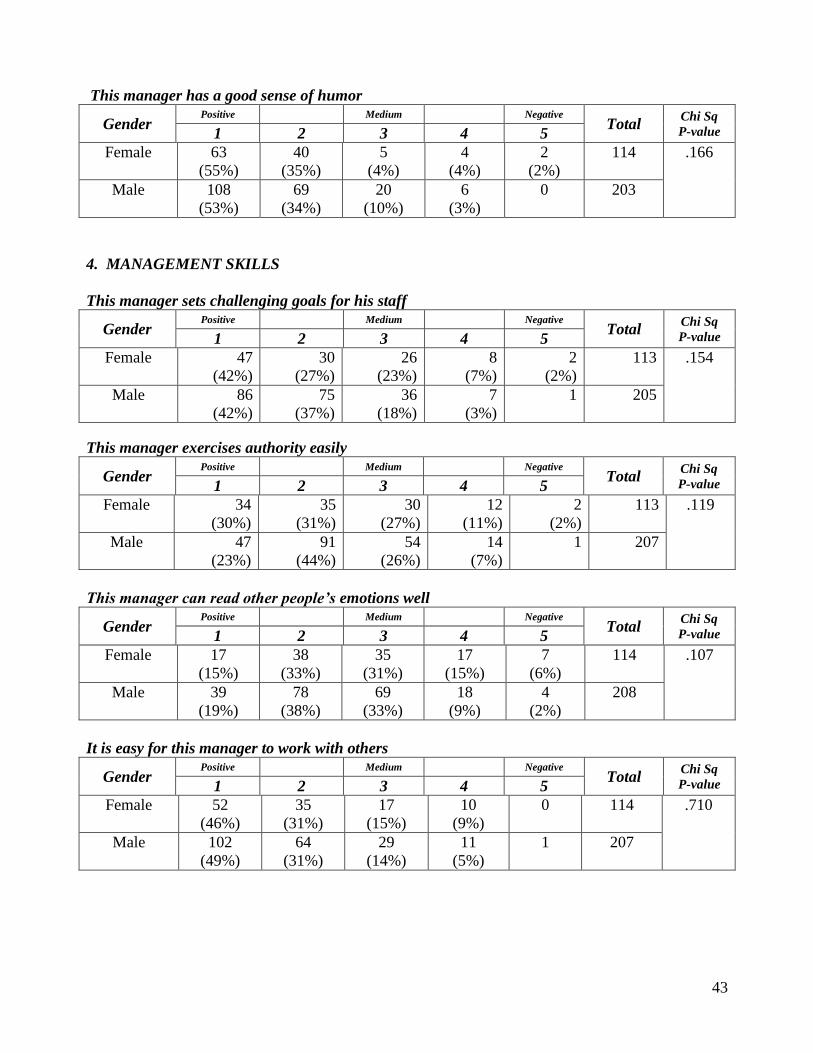
43
This manager has a good sense of humor
Gender Positive Medium Negative
Total Chi Sq
P-value 1 2 3 4 5
Female 63
(55%)
40
(35%)
5
(4%)
4
(4%)
2
(2%)
114 .166
Male 108
(53%)
69
(34%)
20
(10%)
6
(3%)
0 203
4. MANAGEMENT SKILLS
This manager sets challenging goals for his staff
Gender Positive Medium Negative
Total Chi Sq
P-value 1 2 3 4 5
Female 47
(42%)
30
(27%)
26
(23%)
8
(7%)
2
(2%)
113 .154
Male 86
(42%)
75
(37%)
36
(18%)
7
(3%)
1
205
This manager exercises authority easily
Gender Positive Medium Negative
Total Chi Sq
P-value 1 2 3 4 5
Female 34
(30%)
35
(31%)
30
(27%)
12
(11%)
2
(2%)
113 .119
Male 47
(23%)
91
(44%)
54
(26%)
14
(7%)
1
207
This manager can read other people’s emotions well
Gender Positive Medium Negative
Total Chi Sq
P-value 1 2 3 4 5
Female 17
(15%)
38
(33%)
35
(31%)
17
(15%)
7
(6%)
114 .107
Male 39
(19%)
78
(38%)
69
(33%)
18
(9%)
4
(2%)
208
It is easy for this manager to work with others
Gender Positive Medium Negative
Total Chi Sq
P-value 1 2 3 4 5
Female 52
(46%)
35
(31%)
17
(15%)
10
(9%)
0
114 .710
Male 102
(49%)
64
(31%)
29
(14%)
11
(5%)
1
207

44
This manager is sensitive to culturally correct behavior when communicating with diverse
cultures*
Gender Positive Medium Negative
Total Chi Sq
P-value 1 2 3 4 5
Female 40
(35%)
42
(37%)
25
(22%)
4
(4%)
2
(2%)
113 .038*
Male 97
(47%)
75
(36%)
26
(13%)
8
(4%)
0 206
This manager confronts others about their mistakes
Gender Positive Medium Negative
Total Chi Sq
P-value 1 2 3 4 5
Female 24
(21%)
49
(43%)
33
(29%)
5
(4%)
2
(2%)
113 .306
Male 47
(23%)
83
(40%)
53
(26%)
21
(10%)
1
205
This manager handles difficult people or situations with diplomacy
Gender Positive Medium Negative
Total Chi Sq
P-value 1 2 3 4 5
Female 34
(30%)
36
(31%)
28
(25%)
12
(11%)
3
(3%)
113 .101
Male 56
(27%)
83
(41%)
49
(24%)
16
(8%)
0 204
This manager understands politics in the organization*
Gender Positive Medium Negative
Total Chi Sq
P-value 1 2 3 4 5
Female 20
(18%)
39
(35%)
35
(31%)
10
(9%)
8
(7%)
112 .017*
Male 48
(23%)
81
(40%)
50
(24%)
24
(12%)
2
(1%)
205
This manager communicates directly about controversial issues
Gender Positive Medium Negative
Total Chi Sq
P-value 1 2 3 4 5
Female 33
(29%)
44
(39%)
23
(20%)
12
(11%)
2
(1%)
114 .401
Male 53
(26%)
93
(45%)
45
(22%)
13
(6%)
1 205

45
This manager uses a variety of techniques to influence others*
Gender Positive Medium Negative
Total Chi Sq
P-value 1 2 3 4 5
Female 22
(20%)
36
(32%)
31
(28%)
17
(15%)
5
(5%)
111 .033*
Male 39
(19%)
94
(46%)
53
(26%)
15
(7%)
3
(1%)
204
This manager builds rapport with peers and others on the management team
Gender Positive Medium Negative
Total Chi Sq
P-value 1 2 3 4 5
Female 45
(39%)
38
(33%)
19
(17%)
11
(10%)
1
(1%)
114 .205
Male 81
(40%)
86
(42%)
28
(14%)
8
(4%)
2
(1%)
205
*** <.001; ** <.01; *<.05
Tables may not add to 100% due to rounding.

46
Table 3.2
Recent REMs Competencies Compared with Senior Executives Views of Their Own
Competency at the Same Career Stage, by Cohort
a. Managerial ethics & values
Gender
Much
worse
1
Worse
2
About the
same
3
Better
4
Much
better
5
Total Chi Sq
P-value
Female 1
(1%)
16
(14%)
76
(68%)
17
(15%)
1
(1%)
111 .513
Male 1
(1%)
29
(15%)
143
(73%)
19
(10%)
5
(3%)
197
b. Communication
Gender
Much
worse
1
Worse
2
About the
same
3
Better
4
Much
better
5
Total Chi Sq
P-value
Female 4
(4%)
32
(29%)
54
(48%)
18
(16%)
4
(4%)
112 .435
Male 4
(2%)
65
(33%)
81
(41%)
45
(23%)
5
(3%)
200
c. Problem solving
Gender
Much
worse
1
Worse
2
About the
same
3
Better
4
Much
better
5
Total Chi Sq
P-value
Female 5
(5%)
27
(25%)
59
(54%)
18
(16%)
1
(1%)
110 .082
Male 1
(1%)
59
(30%)
107
(54%)
25
(13%)
5
(3%)
197
d. Interpersonal skills
Gender
Much
worse
1
Worse
2
About the
same
3
Better
4
Much
better
5
Total Chi Sq
P-value
Female 5
(5%)
28
(26%)
57
(52%)
19
(17%)
0 109 .342
Male 5
(3%)
53
(27%)
95
(49%)
36
(18%)
6
(3%)
195
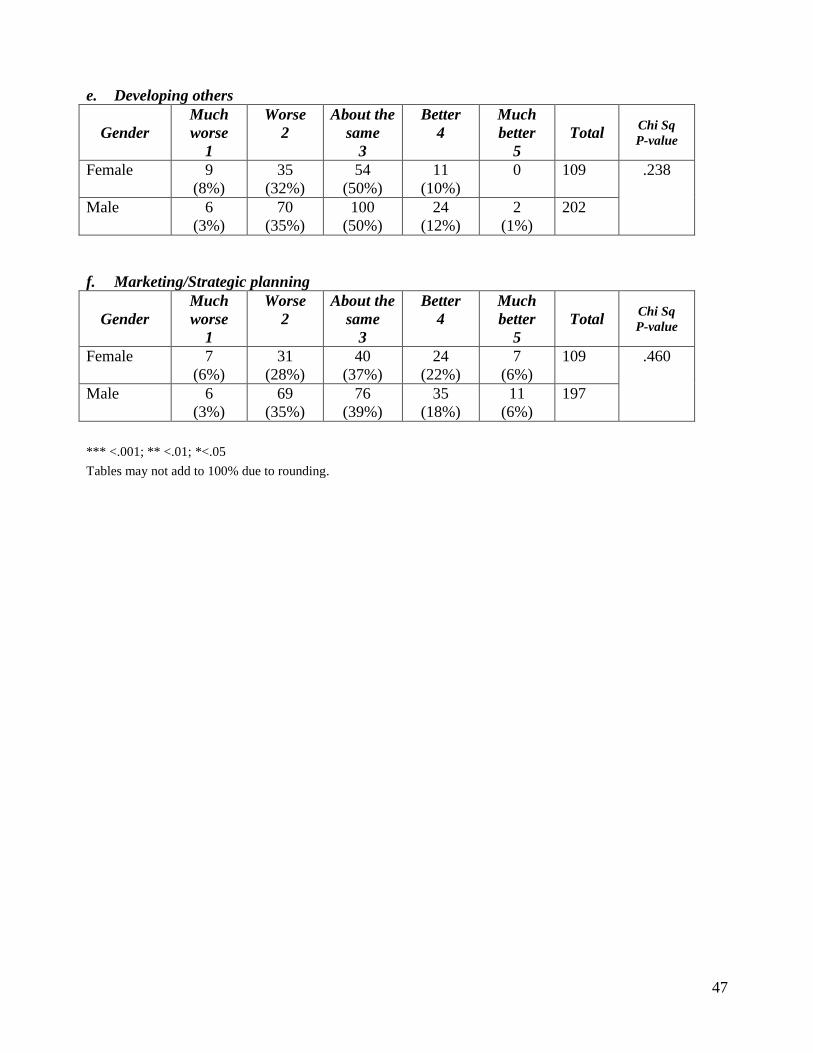
47
e. Developing others
Gender
Much
worse
1
Worse
2
About the
same
3
Better
4
Much
better
5
Total Chi Sq
P-value
Female 9
(8%)
35
(32%)
54
(50%)
11
(10%)
0 109 .238
Male 6
(3%)
70
(35%)
100
(50%)
24
(12%)
2
(1%)
202
f. Marketing/Strategic planning
Gender
Much
worse
1
Worse
2
About the
same
3
Better
4
Much
better
5
Total Chi Sq
P-value
Female 7
(6%)
31
(28%)
40
(37%)
24
(22%)
7
(6%)
109 .460
Male 6
(3%)
69
(35%)
76
(39%)
35
(18%)
11
(6%)
197
*** <.001; ** <.01; *<.05
Tables may not add to 100% due to rounding.

48
Table 3.3
The Interpersonal Skills of REMs as Evaluated by Senior Executive Respondents,
by Cohort as They Relate to:
a. Supervisors
Gender
Fair to
Poor
(1-4)
Average
(5-7)
Good to
Excellent
(8-10)
Total Chi Sq
P-value
Female 5
(5%)
33
(31%)
68
(64%)
106
.925
Male 11
(6%)
58
(30%)
126
(65%)
195
b. Peers
Gender
Fair to
Poor
(1-4)
Average
(5-7)
Good to
Excellent
(8-10)
Total Chi Sq
P-value
Female 6
(6%)
35
(32%)
68
(62%)
109 .750
Male 15
(8%)
59
(30%)
126
(63%)
200
c. Subordinates
Gender
Fair to
Poor
(1-4)
Average
(5-7)
Good to
Excellent
(8-10)
Total Chi Sq
P-value
Female 20
(18%)
33
(30%)
57
(52%)
110 .134
Male 22
(11%)
76
(38%)
100
(51%)
198
d. Physicians
Gender
Fair to
Poor
(1-4)
Average
(5-7)
Good to
Excellent
(8-10)
Total Chi Sq
P-value
Female 15
(14%)
32
(29%)
62
(57%)
109 .237
Male 18
(9%)
74
(37%)
106
(54%)
198
e. Overall
Gender
Fair to
Poor
(1-4)
Average
(5-7)
Good to
Excellent
(8-10)
Total Chi Sq
P-value
Female 8
(7%)
37
(34%)
65
(59%)
110 .986
Male 15
(8%)
64
(33%)
115
(59%)
194
*** <.001; ** <.01; *<.05
Tables may not add to 100% due to rounding.

49
Chapter 4: The Impact of the REM’s Education on How They Were Evaluated
In Chapter 4, we examine whether or not the graduate educational preparation of REMs was related
to their evaluation. We compare REMs with degrees in health care management and those with
degrees in general business which are the two most prevalent categories among our respondents
(Tables 4.1 to 4.3). In Appendix II, we present the graduate degrees obtained by all respondents
including health care management, general business, clinical and allied health (includes medicine,
nursing, and science related degree programs), other degrees (includes community and health
science, legal, and public administration), as well as those with no graduate degree.
There is ongoing debate about which degree program best prepares students to be successful in the
field of health care management. The American College of Healthcare Executives describes the
advantages of various master’s degree programs (ACHE, 2011). Hogan and Blake (1996) report
that a person’s major and overall interests have an effect on how that person relates to other people.
Interests may also have a predictive expectation on how one chooses their own major, activity, and
occupation (Hogan and Blake, 1990). Niles and Bowlsbey (2009) report that there is congruence
between career and overall interests and behavior type in employment situations. Holland,
Gottfredson, and Baker (1990) state that there are person-environment assumptions related to work
skills and that people search for environments that will let them exercise their skills and abilities
and that a person’s behavior is determined by an interaction between their personality and
characteristics of their environment.
Griffith (2007) found that master’s education is the most common entry portal to senior
management in healthcare. Regardless of academic degree completed, he recommended a model
whereby continuous improvement of education practices was implemented. Dorgan, Layton,
Bloom, Homkes, Sadun and Van Reenen (2011) reported that graduate education is linked to better
management. Better-managed companies employ more educated managers and workers (Bloom,
Homkes, Sadun, and Van Reenen, 2011). While MBA and MHA graduate programs subscribe to
this educational logic, the program curricula emphasize different management competencies.
Bennis (2005) accused business schools of failing to impart useful skills, failing to prepare leaders,
failing to instill norms of ethical behavior, and failing to lead graduates to good corporate jobs.
However, there was an absolute increase in salaries for those that obtained an MBA (Inderrieden,
Holtom, and Bies, 2006). The same commentary is directed at the MHA with the caveat that the
graduate is restricted to the healthcare environment and may not have the opportunity to cross into
other industries comparable to the generalist MBA (Student-Doctor Network, 2007).
a. Paired Comparisons on Intra- and Interpersonal attributes When the 26 interpersonal competencies were assessed by the senior executives based on the
education program of the REM, there was no statistical difference among the REMs holding
degrees in healthcare management and those holding degrees in general Business (Table 4.1).

50
b. REMs’ Competencies Compared with Evaluators’ Own Competencies at the Same Career Stage When senior executives were asked to assess the REM compared with senior executive views of
their own competency at the same career stage, there was no statistical difference in the assessment
of the REM as it relates to managerial ethics and values, communication, problem solving,
interpersonal skills, and developing others (Table 4.2).
c. Rating of REMS’ Interpersonal Skills with Other Role Incumbents The interpersonal skills of REMs as they relate to supervisors, peers, subordinates, and physicians
showed no statistical difference based on the REM’s education (Table 4.3).

51
Table 4.1
Paired Comparisons on Dimensions of Interpersonal Competency,
by Health Management and Business Degrees
1. INTRINSIC QUALITIES
This manager’s personal values are always consistent with the management team
REM Education Positive Medium Negative Chi Sq
P-value 1 2 3 4 5 Total
Health Policy &
Management
65
(44%)
58
(39%)
20
(13%)
6
(4%)
0 149 .060
Business 26
(45%)
16
(28%)
8
(14%)
8
(14%)
0 58
This manager is honest about his mistakes
REM Education Positive Medium Negative Chi Sq
P-value 1 2 3 4 5 Total
Health Policy &
Management
88
(59%)
40
(27%)
12
(8%)
9
(6%)
0 148 .564
Business 36
(62%)
13
(22%)
5
(9%)
3
(5%)
1
(2%)
58
I find it easy to trust this manager
REM Education Positive Medium Negative Chi Sq
P-value 1 2 3 4 5 Total
Health Policy &
Management
86
(58%)
39
(26%)
15
(10%)
7
(5%)
1
(1%)
148 .608
Business 30
(52%)
20
(34%)
6
(10%)
1
(2%)
1
(2%)
58
Others find it easy to trust this manager
REM Education Positive Medium Negative Chi Sq
P-value 1 2 3 4 5 Total
Health Policy &
Management
62
(42%)
52
(36%)
23
(16%)
8
(5%)
1
(1%)
146 .869
Business 21
(36%)
22
(38%)
11
(19%)
4
(7%)
0
58

52
2. SELF-DEVELOPMENT
This manager seeks feedback for projects from others who are more knowledgeable
REM Education Positive Medium Negative Chi Sq
P-value 1 2 3 4 5 Total
Health Policy &
Management
80
(54%)
41
(28%)
13
(9%)
13
(9%)
1
(1%)
148 .718
Business 25
(45%)
18
(32%)
7
(13%)
5
(9%)
1
(2%)
56
The manger is receptive to constructive criticism
REM Education Positive Medium Negative Chi Sq
P-value 1 2 3 4 5 Total
Health Policy &
Management
63
(43%)
54
(37%)
18
(12%)
11
(8%)
0 146 .231
Business 20
(34%)
22
(38%)
12
(21%)
3
(5%)
1
(2%)
58
This manager takes direction well
REM Education Positive Medium Negative Chi Sq
P-value 1 2 3 4 5 Total
Health Policy &
Management
86
(59%)
40
(27%)
10
(7%)
11
(7%)
0 147 .177
Business 25
(44%)
20
(35%)
8
(14%)
4
(7%)
0 57
This manager is open to new ideas
REM Education Positive Medium Negative Chi Sq
P-value 1 2 3 4 5 Total
Health Policy &
Management
96
(65%)
32
(22%)
16
(11%)
3
(2%)
0 147 .079
Business 29
(50%)
23
(40%)
5
(9%)
1
(2%)
0 58
This manager deals with facts when deciding on issues
REM Education Positive Medium Negative Chi Sq
P-value 1 2 3 4 5 Total
Health Policy &
Management
62
(42%)
62
(42%)
17
(12%)
4
(3%)
1
(1%)
146 .827
Business 22
(38%)
26
(45%)
6
(10%)
3
(5%)
1
(2%)
58

53
3. OUTLOOK
This manager is sufficiently self-assured
REM Education Positive Medium Negative Chi Sq
P-value 1 2 3 4 5 Total
Health Policy &
Management
57
(39%)
58
(39%)
21
(14%)
11
(7%)
1
(1%)
148 .918
Business 25
(43%)
22
(38%)
8
(14%)
3
(5%)
0 58
This manager shows appropriate respect to his superiors
REM Education Positive Medium Negative Chi Sq
P-value 1 2 3 4 5 Total
Health Policy &
Management
91
(63%)
37
(26%)
11
(8%)
3
(2%)
3
(2%)
145 .599
Business 32
(55%)
19
(33%)
5
(9%)
2
(3%)
0 58
This manager has a positive mental attitude
REM Education Positive Medium Negative Chi Sq
P-value 1 2 3 4 5 Total
Health Policy &
Management
99
(68%)
38
(26%)
8
(5%)
1
(1%)
0 146 .203
Business 32
(55%)
22
(38%)
3
(5%)
0 1
(2%)
58
This manager is in control of his emotions
REM Education Positive Medium Negative Chi Sq
P-value 1 2 3 4 5 Total
Health Policy &
Management
71
(49%)
54
(37%)
12
(8%)
9
(6%)
0 146 .173
Business 25
(43%)
18
(31%)
10
(17%)
4
(7%)
1
(2%)
58
This manager enjoys his work
REM Education Positive Medium Negative Chi Sq
P-value 1 2 3 4 5 Total
Health Policy &
Management
86
(59%)
50
(34%)
7
(5%)
2
(1%)
0 145 .838
Business 34
(59%)
21
(36%)
3
(5%)
0 0 58

54
This manager has a good sense of humor
REM Education Positive Medium Negative Chi Sq
P-value 1 2 3 4 5 Total
Health Policy &
Management
78
(54%)
51
(35%)
12
(8%)
3
(2%)
1
(1%)
145 .962
Business 31
(53%)
22
(38%)
4
(7%)
1
(2%)
0 58
4. MANAGEMENT SKILLS
This manager sets challenging goals for his staff
REM Education Positive Medium Negative Chi Sq
P-value 1 2 3 4 5 Total
Health Policy &
Management
63
(43%)
48
(33%)
29
(20%)
6
(4%)
0 146 .458
Business 28
(48%)
17
(29%)
11
(19%)
1
(2%)
1
(2%)
58
This manager exercises authority easily
REM Education Positive Medium Negative Chi Sq
P-value 1 2 3 4 5 Total
Health Policy &
Management
36
(24%)
51
(35%)
47
(32%)
10
(7%)
3
(2%)
147 .406
Business 19
(33%)
23
(40%)
13
(22%)
3
(5%)
0 58
This manager can read other people’s emotions well
REM Education Positive Medium Negative Chi Sq
P-value 1 2 3 4 5 Total
Health Policy &
Management
26
(18%)
60
(41%)
41
(28%)
18
(12%)
3
(2%)
148 .063
Business 10
(17%)
18
(31%)
22
(38%)
3
(5%)
5
(9%)
58
It is easy for this manager to work with others
REM Education Positive Medium Negative Chi Sq
P-value 1 2 3 4 5 Total
Health Policy &
Management
79
(54%)
41
(28%)
19
(13%)
8
(5%)
0 147 .511
Business 25
(43%)
19
(33%)
11
(19%)
3
(5%)
0 58

55
This manager is sensitive to culturally correct behavior when communicating with diverse
cultures
REM Education Positive Medium Negative Chi Sq
P-value 1 2 3 4 5 Total
Health Policy &
Management
67
(46%)
53
(36%)
21
(14%)
5
(3%)
0 146 .997
Business 26
(45%)
21
(36%)
9
(16%)
2
(3%)
0 58
This manager confronts others about their mistakes
REM Education 1 2 3 4 5 Total Chi Sq
P-value
Health Policy &
Management
29
(20%)
59
(41%)
43
(30%)
12
(8%)
2
(1%)
145 .254
Business 19
(33%)
22
(38%)
15
(26%)
2
(3%)
0 58
This manager handles difficult people or situations with diplomacy
REM Education Positive Medium Negative Chi Sq
P-value 1 2 3 4 5 Total
Health Policy &
Management
42
(29%)
60
(41%)
31
(21%)
12
(8%)
0 145 .497
Business 17
(29%)
18
(31%)
17
(29%)
4
(7%)
2
(3%)
58
This manager understands politics in the organization
REM Education Positive Medium Negative Chi Sq
P-value 1 2 3 4 5 Total
Health Policy &
Management
30
(21%)
58
(40%)
41
(28%)
16
(11%)
1
(1%)
146 .182
Business 19
(33%)
20
(34%)
13
(22%)
4
(7%)
2
(3%)
58
This manager communicates directly about controversial issues
REM Education Positive Medium Negative Chi Sq
P-value 1 2 3 4 5 Total
Health Policy &
Management
39
(27%)
62
(42%)
33
(23%)
10
(7%)
2
(1%)
146 .564
Business 20
(34%)
21
(36%)
11
(19%)
6
(10%)
0 58

56
This manager uses a variety of techniques to influence others
REM Education Positive Medium Negative Chi Sq
P-value 1 2 3 4 5 Total
Health Policy &
Management
25
(17%)
64
(45%)
36
(25%)
15
(10%)
3
(2%)
143 .803
Business 10
(17%)
27
(47%)
17
(29%)
3
(5%)
1
(2%)
58
This manager builds rapport with peers and others on the management team
REM Education Positive Medium Negative Chi Sq
P-value 1 2 3 4 5 Total
Health Policy &
Management
61
(42%)
58
(40%)
15
(10%)
10
(7%)
2
(1%)
146 .396
Business 24
(41%)
20
(34%)
13
(22%)
1
(2%)
0 58
*** <.001; ** <.01; *<.05
Tables may not add to 100% due to rounding.

57
Table 4.2
Recent REMs Competencies Compared with Senior Executives Views of Their Own
Competency at the Same Career Stage, by Cohort
a. Managerial ethics & values
REM
Education
Much
worse
1
Worse
2
About the
same
3
Better
4
Much
better
5
Total Chi Sq
P-value
Health
Management
0 14
(10%)
99
(72%)
19
(14%)
5
(4%)
137 .060
Business 0 9
(16%)
45
(80%)
2
(4%)
0 56
b. Communication
REM
Education
Much
worse
1
Worse
2
About the
same
3
Better
4
Much
better
5
Total Chi Sq
P-value
Health
Management
2
(1%)
43
(31%)
61
(44%)
27
(19%)
7
(5%)
140 .658
Business 2
(4%)
20
(35%)
25
(44%)
9
(16%)
1
(2%)
57
c. Problem solving
REM
Education
Much
worse
1
Worse
2
About the
same
3
Better
4
Much
better
5
Total Chi Sq
P-value e
Health
Management
1
(1%)
37
(26%)
72
(51%)
28
(20%)
3
(2%)
141 .687
Business 1
(2%)
15
(26%)
32
(56%)
7
(12%)
2
(4%)
57
d. Interpersonal skills
REM
Education
Much
worse
1
Worse
2
About the
same
3
Better
4
Much
better
5
Total Chi Sq
P-value
Health
Management
2
(1%)
41
(29%)
71
(51%)
23
(16%)
3
(2%)
140 .563
Business 3
(6%)
17
(31%)
24
(44%)
9
(17%)
1
(2%)
54
e. Developing others
REM
Education
Much
worse
1
Worse
2
About the
same
3
Better
4
Much
better
5
Total Chi Sq
P-value
Health
Management
7
(5%)
49
(35%)
66
(47%)
16
(11%)
2
(1%)
140 .688
Business 3
(5%)
19
(33%)
32
(55%)
4
(7%)
0 58

58
f. Marketing/Strategic planning
REM
Education
Much
worse
1
Worse
2
About the
same
3
Better
4
Much
better
5
Total Chi Sq
P-value
Health
Management
2
(1%)
37
(27%)
54
(40%)
30
(22%)
13
(10%)
136 .698
Business 1
(2%)
18
(32%)
22
(39%)
13
(23%)
2
(4%)
56
*** <.001; ** <.01; *<.05
Tables may not add to 100% due to rounding.

59
Table 4.3
The Interpersonal Skills of REMs as Evaluated by Senior Executive Respondents,
by Cohort as They Relate to:
a. Supervisors
REM
Education
REM Interpersonal Skills
Chi Sq
P-value
Fair to
Poor
(1-4)
Average
(5-7)
Good to
Excellent
(8-10)
Total
Health
Management
9
(7%)
34
(25%)
93
(68%)
136 .436
Business 1
(2%)
21
(38%)
33
(60%)
55
b. Peers
REM
Education
REM Interpersonal Skills
Chi Sq
P-value
Fair to
Poor
(1-4)
Average
(5-7)
Good to
Excellent
(8-10)
Total
Health
Management
9
(6%)
35
(25%)
96
(69%)
140 .136
Business 4
(7%)
24
(43%)
28
(50%)
56
c. Subordinates
REM
Education
REM Interpersonal Skills
Chi Sq
P-value
Fair to
Poor
(1-4)
Average
(5-7)
Good to
Excellent
(8-10)
Total
Health
Management
20
(14%)
45
(32%)
74
(53%)
139 .409
Business 6
(11%)
25
(45%)
24
(44%)
55
d. Physicians
REM
Education
REM Interpersonal Skills
Chi Sq
P-value
Fair to
Poor
(1-4)
Average
(5-7)
Good to
Excellent
(8-10)
Total
Health
Management
16
(12%)
47
(34%)
74
(54%)
137 .618
Business 3
(5%)
20
(36%)
33
(59%)
56

60
e. Overall
REM
Education
REM Interpersonal Skills
Chi Sq
P-value
Fair to
Poor
(1-4)
Average
(5-7)
Good to
Excellent
(8-10)
Total
Health
Management
11
(8%)
40
(29%)
88
(63%)
139 .468
Business 4
(7%)
23
(42%)
28
(51%)
55
*** <.001; ** <.01; *<.05
Tables may not add to 100% due to rounding.

61
Chapter 5: The Impact of REMs’ Age on How They Were Evaluated
It should be noted that although respondents were asked to identify a REM that was 30 years of age
or younger, full 53 of 320 individuals that were able to identify a REM with whom they worked
stated that their REM was over age 30. Because there were interesting differences observed between
younger and older REMs’ evaluations, we elected to include these 53 responses and display them in
this section of the report.
Age heterogeneity can negatively affect productivity in the work environment (Backes-Gellner and
Veen, 2009). Different age cohorts, each with varying socialization processes behind them, regard
their environment against the backdrop of very different cultural and normative attitudes, which
heightens the likelihood of value conflicts (Backes-Gellner and Veen, 2009). This lessens the
degree of social integration and ultimately diminishes productivity (Jackson and Joshi, 2004). It has
been shown that productivity-diminishing conflicts are frequent in the presence of “generation
gaps” and demographic fault lines (Lau and Murnighan, 2005)
a. Paired Comparisons on Intra-and Interpersonal attributes When the 26 interpersonal competencies were assessed by the senior executives based on the REM
being 30 years old or less versus being 31 or older, there were nine differences in how the senior
executive assessed their REM (Table 5.1).
A higher proportion of evaluators with younger REMs rated the following competencies more
highly than those evaluating older REMs:
Setting challenging goals for staff
Taking direction well
Having a positive mental attitude
Working easily with others
Finding it easy to trust this manager
Others finding it easy to trust this manager
Dealing with facts when deciding on issues
Being open to new ideas
Enjoying his work
b. REMs’ Competencies compared with Evaluators’ Own Competencies at the Same Career Stage When senior executives were asked to assess the REM compared with senior executive views of
their own competency at the same career stage, there was no difference in the assessment of the
REM based on the REMs’ age (Table 5.2).
c. Rating of REMS’ Interpersonal Skills with Other Role Incumbents The interpersonal skills of REMs as evaluated by senior executive respondents by age as they relate
to supervisors, peers, subordinates, and physicians showed no difference based on the REMs’ age
(Table 5.3).

62
Table 5.1
Paired Comparisons on Dimensions of Interpersonal Competency,
by Over and Under 30 Years of Age
1. INTRINSIC QUALITIES
This manager’s personal values are always consistent with the management team
REM Age Positive Medium Negative Chi Sq
P-value 1 2 3 4 5 Total
30 and under 106
(39%)
113
(42%)
33
(12%)
17
(6%)
1
270 .399
31 and over 19
(36%)
18
(34%)
10
(19%)
6
(11%)
0 53
This manager is honest about his mistakes
REM Age Positive Medium Negative Chi Sq
P-value 1 2 3 4 5 Total
30 and under 162
(60%)
72
(27%)
17
(6%)
15
(6%)
2
(1%)
268 .094
31 and over 27
(51%)
12
(23%)
8
(15%)
6
(11%)
0 53
I find it easy to trust this manager***
REM Age Positive Medium Negative Chi Sq
P-value 1 2 3 4 5 Total
30 and under 156
(58%)
70
(26%)
30
(11%)
10
(4%)
3
(1%)
269 .001***
31 and over 21
(40%)
21
(40%)
3
(6%)
8
(15%)
0 53
Others find it easy to trust this manager**
REM Age Positive Medium Negative Chi Sq
P-value 1 2 3 4 5 Total
30 and under 118
(45%)
82
(31%)
47
(18%)
15
(6%)
3
(1%)
265 .005**
31 and over 14
(27%)
26
(50%)
4
(8%)
6
(12%)
2
(4%)
52
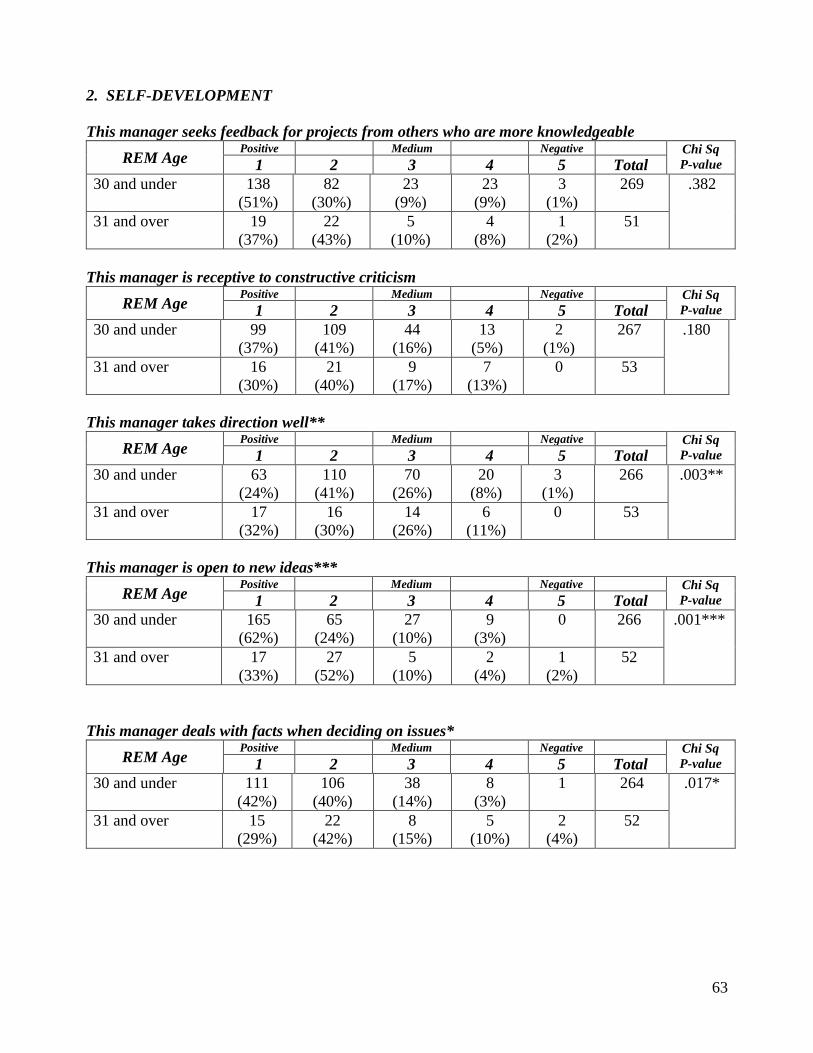
63
2. SELF-DEVELOPMENT
This manager seeks feedback for projects from others who are more knowledgeable
REM Age Positive Medium Negative Chi Sq
P-value 1 2 3 4 5 Total
30 and under 138
(51%)
82
(30%)
23
(9%)
23
(9%)
3
(1%)
269 .382
31 and over 19
(37%)
22
(43%)
5
(10%)
4
(8%)
1
(2%)
51
This manager is receptive to constructive criticism
REM Age Positive Medium Negative Chi Sq
P-value 1 2 3 4 5 Total
30 and under 99
(37%)
109
(41%)
44
(16%)
13
(5%)
2
(1%)
267 .180
31 and over 16
(30%)
21
(40%)
9
(17%)
7
(13%)
0 53
This manager takes direction well**
REM Age Positive Medium Negative Chi Sq
P-value 1 2 3 4 5 Total
30 and under 63
(24%)
110
(41%)
70
(26%)
20
(8%)
3
(1%)
266 .003**
31 and over 17
(32%)
16
(30%)
14
(26%)
6
(11%)
0 53
This manager is open to new ideas***
REM Age Positive Medium Negative Chi Sq
P-value 1 2 3 4 5 Total
30 and under 165
(62%)
65
(24%)
27
(10%)
9
(3%)
0 266 .001***
31 and over 17
(33%)
27
(52%)
5
(10%)
2
(4%)
1
(2%)
52
This manager deals with facts when deciding on issues*
REM Age Positive Medium Negative Chi Sq
P-value 1 2 3 4 5 Total
30 and under 111
(42%)
106
(40%)
38
(14%)
8
(3%)
1
264
.017*
31 and over 15
(29%)
22
(42%)
8
(15%)
5
(10%)
2
(4%)
52

64
3. OUTLOOK
This manager is sufficiently self-assured
REM Age Positive Medium Negative Chi Sq
P-value 1 2 3 4 5 Total
30 and under 99
(37%)
109
(41%)
44
(16%)
13
(5%)
2
(1%)
267 .205
31 and over 16
(30%)
21
(40%)
9
(17%)
7
(13%)
0 53
This manager shows appropriate respect to his superiors
REM Age Positive Medium Negative Chi Sq
P-value 1 2 3 4 5 Total
30 and under 163
(61%)
75
(28%)
19
(7%)
7
(3%)
2
(1%)
266 .838
31 and over 29
(56%)
15
(29%)
5
(10%)
2
(4%)
1
(2%)
52
This manager has a positive mental attitude**
REM Age Positive Medium Negative Chi Sq
P-value 1 2 3 4 5 Total
30 and under 175
(66%)
71
(27%)
16
(6%)
5
(2%)
0 267 .010**
31 and over 24
(45%)
19
(36%)
7
(13%)
2
(4%)
1
(2%)
53
This manager is in control of his emotions
REM Age Positive Medium Negative Chi Sq
P-value 1 2 3 4 5 Total
30 and under 122
(46%)
90
(34%)
29
(11%)
22
(8%)
2
(1%)
265 .127
31 and over 17
(32%)
19
(36%)
12
(23%)
5
(9%)
0 53
This manager enjoys his work*
REM Age Positive Medium Negative Chi Sq
P-value 1 2 3 4 5 Total
30 and under 161
(61%)
83
(32%)
15
(6%)
4
(2%)
0 263 .046*
31 and over 23
(43%)
21
(40%)
7
(13%)
2
(4%)
0 53

65
This manager has a good sense of humor
REM Age Positive Medium Negative Chi Sq
P-value 1 2 3 4 5 Total
30 and under 145
(55%)
91
(35%)
19
(7%)
6
(2%)
2
(1%)
263 .491
31 and over 26
(49%)
18
(34%)
6
(11%)
3
(6%)
0 53
4. MANAGEMENT SKILLS
This manager sets challenging goals for his staff*
REM Age Positive Medium Negative Chi Sq
P-value 1 2 3 4 5 Total
30 and under 118
(44%)
90
(34%)
35
(13%)
21
(8%)
2
(1%)
266 .018*
31 and over 14
(26%)
24
(45%)
9
(17%)
5
(9%)
1
(2%)
53
This manager exercises authority easily
REM Age Positive Medium Negative Chi Sq
P-value 1 2 3 4 5 Total
30 and under 111
(42%)
85
(32%)
57
(22%)
10
(4%)
1
264 .404
31 and over 22
(42%)
19
(36%)
5
(9%)
5
(9%)
2
(4%)
53
This manager can read other people’s emotions well
REM Age Positive Medium Negative Chi Sq
P-value 1 2 3 4 5 Total
30 and under 149
(56%)
72
(27%)
29
(11%)
17
(6%)
0 267 .734
31 and over 18
(35%)
20
(38%)
13
(25%)
1
(2%)
0 52
It is easy for this manager to work with others*
REM Age Positive Medium Negative Chi Sq
P-value 1 2 3 4 5 Total
30 and under 138
(52%)
77
(29%)
35
(13%)
17
(6%)
0 267 .013*
31 and over 16
(30%)
22
(42%)
10
(19%)
4
(8%)
1
(2%)
53
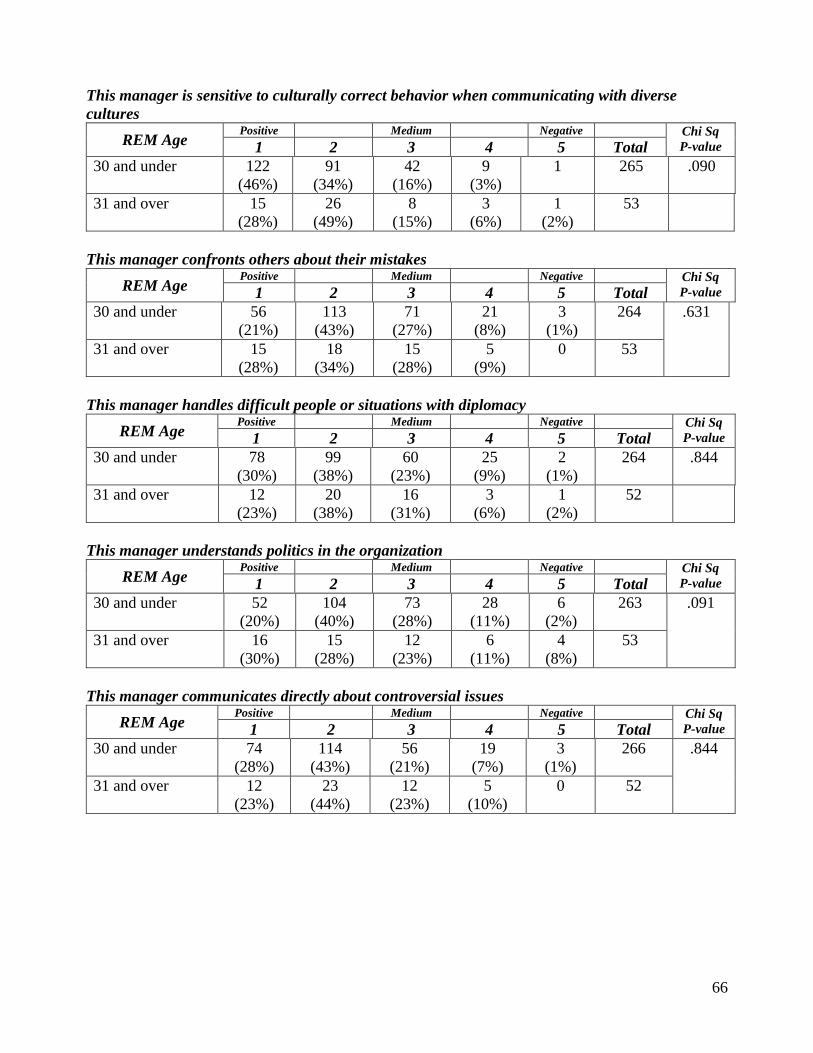
66
This manager is sensitive to culturally correct behavior when communicating with diverse
cultures
REM Age Positive Medium Negative Chi Sq
P-value 1 2 3 4 5 Total
30 and under 122
(46%)
91
(34%)
42
(16%)
9
(3%)
1
265
.090
31 and over 15
(28%)
26
(49%)
8
(15%)
3
(6%)
1
(2%)
53
This manager confronts others about their mistakes
REM Age Positive Medium Negative Chi Sq
P-value 1 2 3 4 5 Total
30 and under 56
(21%)
113
(43%)
71
(27%)
21
(8%)
3
(1%)
264 .631
31 and over 15
(28%)
18
(34%)
15
(28%)
5
(9%)
0 53
This manager handles difficult people or situations with diplomacy
REM Age Positive Medium Negative Chi Sq
P-value 1 2 3 4 5 Total
30 and under 78
(30%)
99
(38%)
60
(23%)
25
(9%)
2
(1%)
264 .844
31 and over 12
(23%)
20
(38%)
16
(31%)
3
(6%)
1
(2%)
52
This manager understands politics in the organization
REM Age Positive Medium Negative Chi Sq
P-value 1 2 3 4 5 Total
30 and under 52
(20%)
104
(40%)
73
(28%)
28
(11%)
6
(2%)
263 .091
31 and over 16
(30%)
15
(28%)
12
(23%)
6
(11%)
4
(8%)
53
This manager communicates directly about controversial issues
REM Age Positive Medium Negative Chi Sq
P-value 1 2 3 4 5 Total
30 and under 74
(28%)
114
(43%)
56
(21%)
19
(7%)
3
(1%)
266 .844
31 and over 12
(23%)
23
(44%)
12
(23%)
5
(10%)
0 52

67
This manager uses a variety of techniques to influence others
REM Age Positive Medium Negative Chi Sq
P-value 1 2 3 4 5 Total
30 and under 51
(20%)
107
(41%)
73
(28%)
26
(10%)
4
(2%)
261 .100
31 and over 10
(19%)
23
(43%)
10
(19%)
6
(11%)
4
(8%)
53
This manager builds rapport with peers and others on the management team
REM Age Positive Medium Negative Chi Sq
P-value 1 2 3 4 5 Total
30 and under 111
(42%)
99
(37%)
39
(15%)
14
(5%)
2
(1%)
265 .278
31 and over 15
(28%)
25
(47%)
7
(13%)
5
(9%)
1
(2%)
53
*** <.001; ** <.01; *<.05
Tables may not add to 100% due to rounding.

68
Table 5.2
Recent REMs Competencies Compared with Senior Executives Views of Their Own
Competency at the Same Career Stage, by Cohort
a. Managerial ethics & values
REM
Age
Much
worse
1
Worse
2
About the
same
3
Better
4
Much
better
5
Total Chi Sq
P-value
Under 30
1
37
(15%)
183
(72%)
30
(12%)
4
(2%)
255 .596
Over 31
1
(2%)
7
(13%)
36
(69%)
6
(12%)
2
(4%)
52
b. Communication
REM
Age
Much
worse
1
Worse
2
About the
same
3
Better
4
Much
better
5
Total Chi Sq
P-value
Under 30
7
(3%)
76
(29%)
116
(45%)
53
(21%)
6
(2%)
258 .336
Over 31
1
(2%)
21
(40%)
18
(34%)
10
(19%)
3
(6%)
53
c. Problem solving
REM
Age
Much
worse
1
Worse
2
About the
same
3
Better
4
Much
better
5
Total Chi Sq
P-value
Under 30
4
(2%)
73
(29%)
135
(53%)
39
(15%)
5
(2%)
256 .434
Over 31
2
(4%)
12
(24%)
31
(62%)
4
(8%)
1
(2%)
50
d. Interpersonal skills
REM
Age
Much
worse
1
Worse
2
About the
same
3
Better
4
Much
better
5
Total Chi Sq
P-value
Under 30
7
(3%)
71
(28%)
123
(49%)
45
(18%)
4
(2%)
250 .441
Over 31
3
(6%)
10
(19%)
28
(53%)
10
(19%)
2
(4%)
53
e. Developing others
REM
Age
Much
worse
1
Worse
2
About the
same
3
Better
4
Much
better
5
Total Chi Sq
P-value
Under 30
14
(5%)
89
(35%)
129
(50%)
24
(9%)
1
257 .084
Over 31
1
(2%)
16
(30%)
24
(45%)
11
(21%)
1
(2%)
53

69
f. Marketing/Strategic planning
REM
Age
Much
worse
1
Worse
2
About the
same
3
Better
4
Much
better
5
Total Chi Sq
P-value
Under 30
10
(4%)
84
(33%)
97
(38%)
49
(19%)
15
(6%)
255 .969
Over 31
3
(6%)
15
(30%)
19
(38%)
10
(20%)
3
(6%)
50
*** <.001; ** <.01; *<.05
Tables may not add to 100% due to rounding.

70
Table 5.3
The Interpersonal Skills of REMs as Evaluated by Senior Executive Respondents,
by Cohort as They Relate to:
a. Supervisors
REM
Age
Fair to
Poor
(1-4)
Average
(5-7)
Good to
Excellent
(8-10)
Total Chi Sq
P-value
Under 30 12
(5%)
72
(29%)
166
(66%)
250 .372
Over 31 3
(6%)
19
(38%)
28
(56%)
50
b. Peers
REM
Age
Fair to
Poor
(1-4)
Average
(5-7)
Good to
Excellent
(8-10)
Total Chi Sq
P-value
Under 30 14
(5%)
77
(30%)
166
(65%)
257 .085
Over 31 7
(14%)
16
(31%)
28
(55%)
51
c. Subordinates
REM
Age
Fair to
Poor
(1-4)
Average
(5-7)
Good to
Excellent
(8-10)
Total Chi Sq
P-value
Under 30 35
(14%)
87
(34%)
133
(52%)
255 .674
Over 31 7
(13%)
21
(40%)
24
(46%)
52
d. Physicians
REM
Age
Fair to
Poor
(1-4)
Average
(5-7)
Good to
Excellent
(8-10)
Total Chi Sq
P-value
Under 30 26
(10%)
89
(35%)
139
(55%)
254 .721
Over 31 7
(13%)
16
(31%)
29
(56%)
52
e. Overall
REM
Age
Fair to
Poor
(1-4)
Average
(5-7)
Good to
Excellent
(8-10)
Total Chi Sq
P-value
Under 30 17
(7%)
87
(35%)
148
(59%)
252 .276
Over 31 6
(12%)
13
(25%)
32
(63%)
51
*** <.001; ** <.01; *<.05
Tables may not add to 100% due to rounding.

71
Chapter 6: The Impact of REMs’ Having Clinical Experience on
How They Were Evaluated
In Chapter 6, we are interested in determining if REMs with clinical experience had a
competitive advantage in how they were perceived by senior executives. We wanted to know if
they had more advanced interpersonal skills relating to non-clinicians and other clinicians.
Yarbrough and Baumgardner (2007) report that having a clinical degree or a particular type of
degree (i.e.,MHA) did not impact a manager’s career progression.
However, other studies suggest that positive career outcomes are related to networking ability,
demonstration of sincerity, an ability to influence others interpersonally, and being socially
astute (Ferris, Perrewe, and Douglas, 2002). In addressing the clinical professions, clinical
supervision influences nurse development of a professional identity, it enhances their decision-
making ability, and personal growth which highlights the need for on-going professional
development (Severinsson, 2010). Davis and Nicholaou (1992) illustrated the positive effects of
formal curricular change that has focused on interpersonal aspects of communication for medical
students. The emphasis on competency training in clinical and non-clinical academic programs
has a positive connection to career outcomes (Todd, Harris, Harris, and Wheeler, 2009).
a. Paired Comparisons on Intra-and Interpersonal attributes When the 26 interpersonal competencies were assessed by the senior executives, there was no
difference in how the senior executive assessed the REM based on their REMs having or not
having clinical experience (Table 6.1):
b. REMs’ Competencies compared with Evaluators’ Own Competencies at the Same Career Stage When senior executives were asked to assess the REM compared with senior executive views of
their own competency at the same career stage, there was a difference in the assessment of the
REM based on marketing/strategic planning skills (Table 6.2). Specifically, no differences in
having had clinical experience were evident in regard to managerial ethics and values,
communication, problem solving, interpersonal skills or developing others. However, REMs that
did not have clinical experience were rated more highly than those with such experience in the
area of marketing/strategic planning.
c. Rating of REMS’ Interpersonal Skills with Other Role Incumbents The interpersonal skills of REMs in working with others including supervisors appears to be
unrelated to the REM’s having had prior clinical experience. None of the measures that asked
evaluators to assess interpersonal skills showed significant differences in the REMs’ evaluations.
It appears that REMS with and without clinical experience relate to supervisors, peers,
subordinates, and physicians equally well (Table 6.3).

72
Table 6.1
Paired Comparisons on Dimensions of Interpersonal Competency,
by Clinical and Nonclinical Cohort
1. INTRINSIC QUALITIES
This manager’s personal values are always consistent with the management team
Clinical
Experience
Positive Medium Negative Chi Sq
P-value 1 2 3 4 5 Total
With clinical
experience
38
(36%)
45
(42%)
11
(10%)
11
(10%)
1
(1%)
106
.282
No clinical
experience
85
(40%)
86
(40%)
31
(14%)
13
(6%)
0
(0%)
215
This manager is honest about his mistakes
Clinical
Experience
Positive Medium Negative Chi Sq
P-value 1 2 3 4 5 Total
With clinical
experience
64
(60%)
28
(26%)
7
(7%)
6
(6%)
1
(1%)
106
.928
No clinical
experience
124
(58%)
55
(26%)
19
(9%)
14
(7%)
1
(0%)
213
I find it easy to trust this manager
Clinical
Experience
Positive Medium Negative Chi Sq
P-value 1 2 3 4 5 Total
With clinical
experience
52
(49%)
33
(31%)
12
(11%)
8
(8%)
1
(1%)
106 .564
No clinical
experience
124
(58%)
57
(27%)
20
(9%)
10
(5%)
3
(1%)
214
Others find it easy to trust this manager
Clinical
Experience
Positive Medium Negative Chi Sq
P-value 1 2 3 4 5 Total
With clinical
experience
42
(40%)
35
(33%)
14
(13%)
13
(12%)
2
(2%)
106 .116
No clinical
experience
90
(43%)
71
(34%)
36
(17%)
9
(4%)
3
(1%)
209

73
2. SELF-DEVELOPMENT
This manager seeks feedback for projects from others who are more knowledgeable
Clinical
Experience
Positive Medium Negative Chi Sq
P-value 1 2 3 4 5 Total
With clinical
experience
49
(46%)
39
(37%)
12
(11%)
5
(5%)
1
(1%)
106
.329
No clinical
experience
107
(50%)
65
(31%)
16
(8%)
20
(9%)
4
(2%)
212
This manager is receptive to constructive criticism
Clinical
Experience
Positive Medium Negative Chi Sq
P-value 1 2 3 4 5 Total
With clinical
experience
44
(42%)
38
(37%)
12
(12%)
9
(9%)
1
(1%)
104
.946
No clinical
experience
88
(41%)
75
(35%)
31
(15%)
16
(8%)
3
(1%)
213
This manager takes direction well
Clinical
Experience
Positive Medium Negative Chi Sq
P-value 1 2 3 4 5 Total
With clinical
experience
52
(49%)
29
(27%)
20
(19%)
5
(5%)
0 106
.158
No clinical
experience
114
(54%)
62
(29%)
21
(10%)
14
(7%)
0 211
This manager is open to new ideas
Clinical
Experience
Positive Medium Negative Chi Sq
P-value 1 2 3 4 5 Total
With clinical
experience
56
(53%)
34
(32%)
12
(11%)
4
(4%)
0 106 .786
No clinical
experience
124
(59%)
58
(28%)
20
(10%)
7
(3%)
1
(0%)
210
This manager deals with facts when deciding on issues
Clinical
Experience
Positive Medium Negative Chi Sq
P-value 1 2 3 4 5 Total
With clinical
experience
40
(38%)
37
(36%)
22
(21%)
4
(4%)
1
(1%)
104 .307
No clinical
experience
86
(41%)
88
(42%)
25
(12%)
9
(4%)
2
(1%)
210

74
3. OUTLOOK
This manager is sufficiently self-assured
Clinical
Experience
Positive Medium Negative Chi Sq
P-value 1 2 3 4 5 Total
With clinical
experience
39
(37%)
43
(41%)
16
(15%)
7
(7%)
0
(0%)
105
.845
No clinical
experience
75
(35%)
85
(40%)
38
(18%)
13
(6%)
2
(1%)
213
This manager shows appropriate respect to his superiors
Clinical
Experience
Positive Medium Negative Chi Sq
P-value 1 2 3 4 5 Total
With clinical
experience
61
(58%)
32
(30%)
6
(6%)
6
(6%)
0 105 .105
No clinical
experience
129
(61%)
57
(27%)
18
(9%)
3
(1%)
4 211
This manager has a positive mental attitude
Clinical
Experience
Positive Medium Negative Chi Sq
P-value 1 2 3 4 5 Total
With clinical
experience
63
(60%)
25
(24%)
13
(12%)
3
(3%)
1
(1%)
105 .089
No clinical
experience
136
(64%)
62
(29%)
11
(5%)
4
(2%)
0 213
This manager is in control of his emotions
Clinical
Experience
Positive Medium Negative Chi Sq
P-value 1 2 3 4 5 Total
With clinical
experience
38
(36%)
38
(36%)
17
(16%)
11
(10%)
1
(1%)
105 .326
No clinical
experience
101
(48%)
69
(33%)
25
(12%)
15
(7%)
1
211
This manager enjoys his work
Clinical
Experience
Positive Medium Negative Chi Sq
P-value 1 2 3 4 5 Total
With clinical
experience
58
(55%)
34
(32%)
11
(10%)
3
(3%)
0 106 .298
No clinical
experience
125
(60%)
69
(33%)
11
(5%)
3
(1%)
0 208

75
This manager has a good sense of humor
Clinical
Experience
Positive Medium Negative Chi Sq
P-value 1 2 3 4 5 Total
With clinical
experience
59
(57%)
33
(32%)
7
(7%)
4
(4%)
0 103 .779
No clinical
experience
112
(53%)
74
(35%)
17
(8%)
6
(3%)
2
(1%)
211
4. MANAGEMENT SKILLS
This manager sets challenging goals for his staff
Clinical
Experience
Positive Medium Negative Chi Sq
P-value 1 2 3 4 5 Total
With clinical
experience
43
(41%)
35
(34%)
18
(17%)
7
(7%)
1
(1%)
104
.803
No clinical
experience
89
(42%)
69
(33%)
43
(20%)
8
(4%)
2
(1%)
211
This manager exercises authority easily
Clinical
Experience
Positive Medium Negative Chi Sq
P-value 1 2 3 4 5 Total
With clinical
experience
27
(26%)
44
(42%)
25
(24%)
8
(8%)
0
(0%)
104
.680
No clinical
experience
53
(25%)
80
(38%)
59
(28%)
18
(8%)
3
(1%)
213
This manager can read other people’s emotions well
Clinical
Experience
Positive Medium Negative Chi Sq
P-value 1 2 3 4 5 Total
With clinical
experience
19
(18%)
39
(37%)
30
(29%)
15
(14%)
2
(2%)
105 .510
No clinical
experience
37
(17%)
76
(36%)
72
(34%)
20
(9%)
20
(9%)
214
It is easy for this manager to work with others
Clinical
Experience
Positive Medium Negative Chi Sq
P-value 1 2 3 4 5 Total
With clinical
experience
46
(43%)
38
(36%)
13
(12%)
8
(8%)
1
(1%)
106 .290
No clinical
experience
107
(50%)
60
(28%)
33
(16%)
12
(6%)
0 212
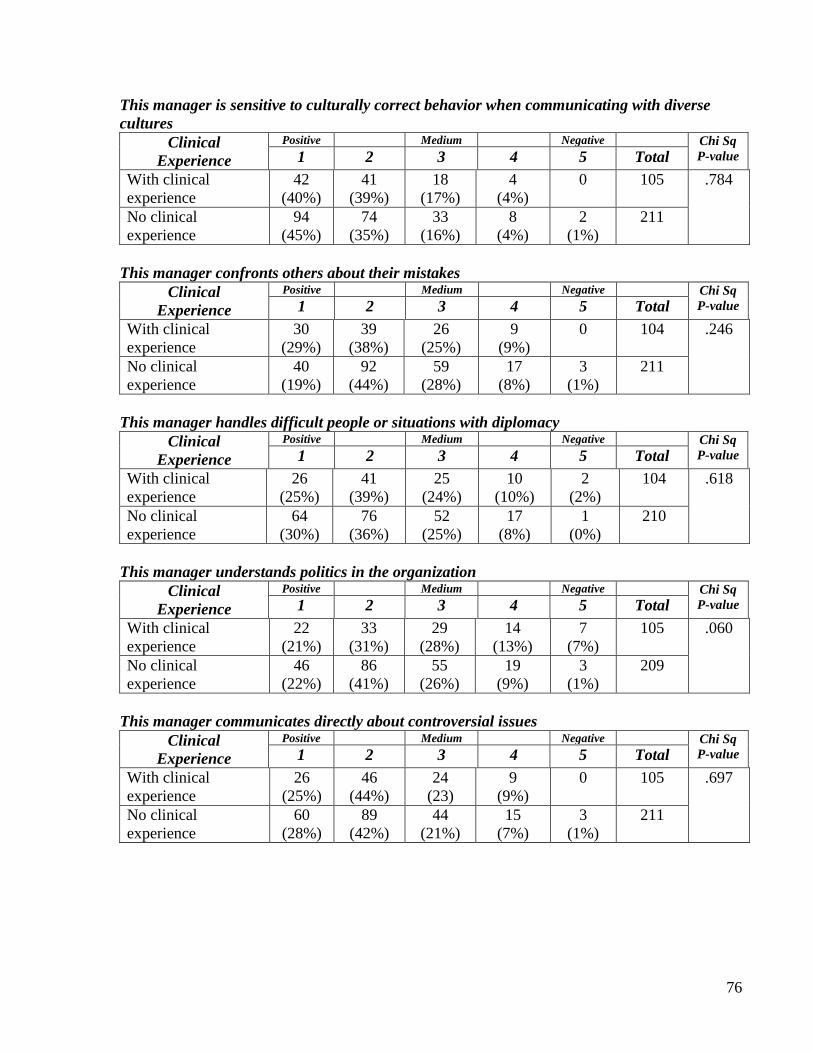
76
This manager is sensitive to culturally correct behavior when communicating with diverse
cultures
Clinical
Experience
Positive Medium Negative Chi Sq
P-value 1 2 3 4 5 Total
With clinical
experience
42
(40%)
41
(39%)
18
(17%)
4
(4%)
0 105 .784
No clinical
experience
94
(45%)
74
(35%)
33
(16%)
8
(4%)
2
(1%)
211
This manager confronts others about their mistakes
Clinical
Experience
Positive Medium Negative Chi Sq
P-value 1 2 3 4 5 Total
With clinical
experience
30
(29%)
39
(38%)
26
(25%)
9
(9%)
0 104 .246
No clinical
experience
40
(19%)
92
(44%)
59
(28%)
17
(8%)
3
(1%)
211
This manager handles difficult people or situations with diplomacy
Clinical
Experience
Positive Medium Negative Chi Sq
P-value 1 2 3 4 5 Total
With clinical
experience
26
(25%)
41
(39%)
25
(24%)
10
(10%)
2
(2%)
104 .618
No clinical
experience
64
(30%)
76
(36%)
52
(25%)
17
(8%)
1
(0%)
210
This manager understands politics in the organization
Clinical
Experience
Positive Medium Negative Chi Sq
P-value 1 2 3 4 5 Total
With clinical
experience
22
(21%)
33
(31%)
29
(28%)
14
(13%)
7
(7%)
105 .060
No clinical
experience
46
(22%)
86
(41%)
55
(26%)
19
(9%)
3
(1%)
209
This manager communicates directly about controversial issues
Clinical
Experience
Positive Medium Negative Chi Sq
P-value 1 2 3 4 5 Total
With clinical
experience
26
(25%)
46
(44%)
24
(23)
9
(9%)
0 105 .697
No clinical
experience
60
(28%)
89
(42%)
44
(21%)
15
(7%)
3
(1%)
211

77
This manager uses a variety of techniques to influence others
Clinical
Experience
Positive Medium Negative Chi Sq
P-value 1 2 3 4 5 Total
With clinical
experience
22
(22%)
38
(37%)
25
(25%)
14
(14%)
3
(3%)
102 .481
No clinical
experience
39
(19%)
92
(44%)
57
(27%)
17
(8%)
5
(2%)
210
This manager builds rapport with peers and others on the management team
Clinical
Experience
Positive Medium Negative Chi Sq
P-value 1 2 3 4 5 Total
With clinical
experience
36
(35%)
47
(45%)
14
(13%)
6
(6%)
1
(1%)
104 .615
No clinical
experience
89
(42%)
76
(36%)
32
(15%)
13
(6%)
2
(1%)
212
*** <.001; ** <.01; *<.05
Tables may not add to 100% due to rounding.

78
Table 6.2
Recent REMs Competencies Compared with Senior Executives Views of Their Own
Competency at the Same Career Stage, by Clinical and Nonclinical Cohort
a. Managerial ethics & values
Clinical
Experience
Much
worse
1
Worse
2
About the
same
3
Better
4
Much
better
5
Total Chi Sq
P-value
Clinical
experience
2
(2%)
17
(17%)
73
(72%)
10
(10%)
0 102 .095
No clinical
experience
0
27
(13%)
145
(71%)
25
(12%)
6
(3%)
203
b. Communication
Clinical
Experience
Much
worse
1
Worse
2
About the
same
3
Better
4
Much
better
5
Total Chi Sq
P-value
Clinical
experience
4
(4%)
30
(30%)
43
(43%)
22
(22%)
2
(2%)
101 .754
No clinical
experience
4
(2%)
67
(32%)
90
(43%)
40
(19%)
7
(3%)
208
c. Problem solving
Clinical
Experience
Much
worse
1
Worse
2
About the
same
3
Better
4
Much
better
5
Total Chi Sq
P-value
Clinical
experience
3
(3%)
31
(31%)
54
(54%)
12
(12%)
0 100 .358
No clinical
experience
3
(1%)
55
(27%)
111
(54%)
29
(14%)
6
(3%)
204
d. Interpersonal skills
Clinical
Experience
Much
worse
1
Worse
2
About the
same
3
Better
4
Much
better
5
Total Chi Sq
P-value
Clinical
experience
5
(5%)
25
(25%)
53
(52%)
18
(18%)
0 101 .344
No clinical
experience
5
(3%)
54
(27%)
99
(50%)
36
(18%)
6
(3%)
200

79
e. Developing others
Clinical
Experience
Much
worse
1
Worse
2
About the
same
3
Better
4
Much
better
5
Total Chi Sq
P-value
Clinical
experience
5
(5%)
36
(36%)
44
(44%)
16
(16%)
0 101 .308
No clinical
experience
9
(4%)
69
(33%)
108
(52%)
19
(9%)
2
(1%)
207
f. Marketing/Strategic planning*
Clinical
Experience
Much
worse
1
Worse
2
About the
same
3
Better
4
Much
better
5
Total Chi Sq
P-value
Clinical
experience
9
(9%)
35
(35%)
37
(37%)
14
(14%)
4
(4%)
99 .026*
No clinical
experience
4
(2%)
64
(32%)
78
(38%)
44
(22%)
14
(7%)
204
*** <.001; ** <.01; *<.05
Tables may not add to 100% due to rounding.
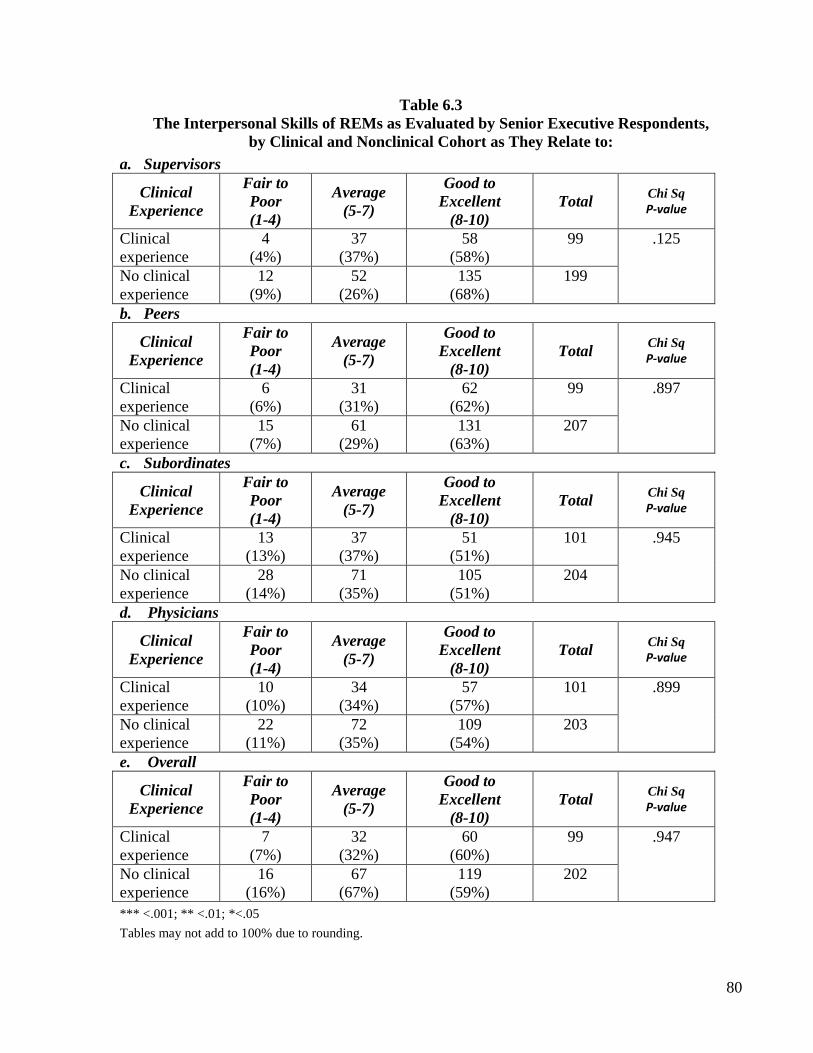
80
Table 6.3
The Interpersonal Skills of REMs as Evaluated by Senior Executive Respondents,
by Clinical and Nonclinical Cohort as They Relate to:
a. Supervisors
Clinical
Experience
Fair to
Poor
(1-4)
Average
(5-7)
Good to
Excellent
(8-10)
Total Chi Sq
P-value
Clinical
experience
4
(4%)
37
(37%)
58
(58%)
99 .125
No clinical
experience
12
(9%)
52
(26%)
135
(68%)
199
b. Peers
Clinical
Experience
Fair to
Poor
(1-4)
Average
(5-7)
Good to
Excellent
(8-10)
Total Chi Sq
P-value
Clinical
experience
6
(6%)
31
(31%)
62
(62%)
99 .897
No clinical
experience
15
(7%)
61
(29%)
131
(63%)
207
c. Subordinates
Clinical
Experience
Fair to
Poor
(1-4)
Average
(5-7)
Good to
Excellent
(8-10)
Total Chi Sq
P-value
Clinical
experience
13
(13%)
37
(37%)
51
(51%)
101 .945
No clinical
experience
28
(14%)
71
(35%)
105
(51%)
204
d. Physicians
Clinical
Experience
Fair to
Poor
(1-4)
Average
(5-7)
Good to
Excellent
(8-10)
Total Chi Sq
P-value
Clinical
experience
10
(10%)
34
(34%)
57
(57%)
101 .899
No clinical
experience
22
(11%)
72
(35%)
109
(54%)
203
e. Overall
Clinical
Experience
Fair to
Poor
(1-4)
Average
(5-7)
Good to
Excellent
(8-10)
Total Chi Sq
P-value
Clinical
experience
7
(7%)
32
(32%)
60
(60%)
99 .947
No clinical
experience
16
(16%)
67
(67%)
119
(59%)
202
*** <.001; ** <.01; *<.05
Tables may not add to 100% due to rounding.
81
Chapter 7: Identification of “Fast Trackers” and Strategies
to Enhance REM Interpersonal Skills
A second objective of the study was to determine whether or not healthcare organizations
identify fast-trackers and how organizations respond, if at all, to enhance the REMs’
interpersonal skills and integrate them into the organization.
For example, in previous research, fast-trackers were identified as ambitious, creative,
independent, and intelligent employees who exhibit leadership potential (Gritzmacher,1989).
They were considered to be “officer material” and were given high exposure positions and
assigned projects with senior management. In our study, eighty-two percent of senior executive
respondents indicated that interpersonal relationship skills were used to identify “fast trackers”
and potential successors to current leaders in their organization.
Useful Strategies and Programs That Have Enhanced Interpersonal Skills of Recent Entrant Managers This was an open-ended question that then asked the 181 senior executive respondents to identify
what they perceived to be useful strategies and programs that enhanced the interpersonal skills of
recent entrant managers. Their comments were classified into seven major categories that
included on-the-job training; formal in-house training; coaching/mentoring; external training;
leadership assessment; recruitment interviews; and no formal training (Table 7.1).
Coaching/mentoring (28%); formal in-house training (26%); and on-the-job training (25%) were
the most common methods used to bring the REM into the organization and orient him/her to the
work setting.
Where external training (10%) was provided, the senior executive respondent recommended
ACHE seminars, Vital Smarts training, and enrollment in graduate education programs. Six-
percent identified personality and leadership assessment tools that were administered in their
organization to identify management leaders. Five-percent of the respondents viewed the
recruitment process as being critical to the success of a recent entrant manager and thought
recruitment for organizational fit was important in bringing the right candidates who would
ultimately be successful into the organization.

82
Table 7.1
What Have Been Useful Strategies and Programs That Have Enhanced Interpersonal Skills
of Recent Entrant Managers? (Open End Response)
Strategies/Programs Examples Frequency Percentage
(%)
On the job training 73 25
Meeting participation
Group projects
Listening rounds
Employee forums
Project work
Role modeling
Formal In-house training 74 26
Manager orientation training
Talent management course
Leadership training
Coaching/Mentoring 81 28
Mentor and role playing
1-on-1 interaction
Peer coaching
Mentoring with senior
management
External training 25 10
ACHE seminars
Crucial conversations
Leadership Institute
Press-Ganey
Studer Group
University MBA
Leadership assessment 18 6
AONE assessment
Myers-Briggs
360-feedback
Recruitment interviews 13 5
Hire for attitude
Hire for organizational fit
Behavioral interviews
No formal or informal
programs
4 1
83
Conclusion
In Chapter 1, the background on intergenerational communication and conflict in the workforce
was discussed. The role of professionalism that includes interpersonal abilities and the emphasis
being placed on it by graduate programs were presented. The chapter concludes with challenges
that exist in healthcare organizations to recruit and retain recent entrants to the field of healthcare
management.
We then presented the overall evaluation of the 292 respondents who reported on a recent entrant
manager (REM) with whom they worked. They evaluated their REM on 26 different attributes
that we developed to measure interpersonal abilities. We learned that of the 26 interpersonal
attributes, there were only six where fewer than 70 percent scored above average. Ordered from
most to least deficient, these five included (1) the REM can read other people’s emotions well;
(2) the REM understands politics in the organization; (3) the REM uses a variety of techniques to
influence others; (4) the REM handles difficult people or situations with diplomacy, (5) the REM
confronts others about their mistakes, (6) the REM exercises authority easily.
In addition, when compared to their competencies at the REMs career stage, 30 percent or more
of the evaluators in this study said that current REMs are worse than they were in five areas:
developing others, marketing/strategic planning, communication, problem solving and
interpersonal skills. Finally, when asked to rate their REM interpersonally, 33 percent rated
them overall as average, 59 percent were rated above average and seven percent rated their REM
below average. (Somewhat lower ratings were given in relating to subordinates and physicians.)
Taken together, this overview shows that despite assertions to the contrary, there appears to be
special areas where less experienced healthcare managers can benefit from coaching. It may be
that such training can be offered in graduate programs, by the hiring organization or by
professional societies. Regardless, it will be necessary to confront these managerial deficiencies
in an era when we expect more output and higher quality from the healthcare work force.
The second part of this research focused on the respondents to the survey to determine if their
demographic characteristics, notably age (or generation) and gender showed differences in how
they evaluated their REM (Chapters 2 and 3). We learned that the evaluators’ generation showed
only two major effects. In both cases, the younger evaluators, Gen Xers, rated their REMs as
worse than older evaluators in confronting others about their mistakes. Also, Gen Xers felt that
their REMs did not work to develop others as well as they did when they themselves were
REMs.
That younger evaluators are more stringent than older evaluators has often been noted
anecdotally. For example, young assistant professors are sometimes taken to task by more senior
colleagues for being too exacting on students and on their peers. It may be that in any
hierarchical system, the immediate supervisor’s sense that it is part of their role to ensure the best
behaviors are nurtured to uphold quality standards in the organization or profession.
When we considered the gender of the evaluators, we learned that men to a greater extent than
women evaluate their REMs as more competent in a number of areas: dealing with facts to make

84
decisions, culturally correct behavior, knowing the politics in the organization and using a
variety of techniques to influence others. We know that healthcare management, as in so many
other fields, women have not achieved as high a rank as men have. It may be that women who
are charged with evaluating REMs are holding them to a higher standard than men do to help
ensure that those under their tutelage achieve high level positions based on areas of competence
that they want to impart.
The third part of the research sought to explore differences among REMs themselves as possible
correlates for interpersonal skill differences (Chapters 4-6). We focused on graduates of Health
Policy and Management and Business programs since these were the largest degree cohorts. The
REMs’ graduate educational background showed little difference.
The REMs age showed that on nine different measures, younger REMs obtain higher ratings
than their older counterparts. This may be a part of a universal phenomenon in which novices
who are younger are “cut more slack” than older individuals even though each group may have
equal experience in their role. The findings argue for treating older REMs with the same
consideration as that afforded their younger counterparts.
The only substantive area that showed significant differences between REMs with and without
clinical experience was in the area of marketing/strategic planning and, in this case, those
without clinical experience were rated as better or much better than senior executives felt they
were at that stage in their career. It may be that those without clinical experience have a more
rigorous academic background in this area.
However, with regard to the interpersonal skills area and developing others, we thought initially
that those REMs who had prior clinical experience would fare better in their interpersonal
evaluations than those without clinical experience. But this was not the case. It is difficult to
come up with an explanation for this lack of association. Anecdotal reports suggest that it is
those clinicians who show an aptitude for positive interpersonal relationships who are
encouraged to move into managerial ranks. The only way to obtain more definitive findings
would be to conduct longitudinal research in which interpersonal skills are measured when a
career is initiated.
The final part of the research sought to determine if senior executives identified “fast-trackers” in
their organization with an emphasis on advancing them to leadership positions (Chapter 7). We
found that eighty-two percent of senior executive respondents identified fast-trackers for
advancement. The respondents indicated that coaching/mentoring; formal in-house training; and
on-the-job training were the most common methods used to bring the REM into the organization
and enhance their interpersonal skills.
The research conducted offers the opportunity to delve more deeply into the correlates of
successful interpersonal relationships. One immediate next step would be to conduct multivariate
analyses to help identify the strongest correlates of interpersonal skills among the REMs. Also,
special analyses might be conducted to determine if those organizations that have codified
methods to nurture interpersonal proficiency benefit from such programs. Do their REMs remain
longer with the organization? Are they promoted more rapidly? Are there human resource

85
outcomes that are impacted by such programs such as less absenteeism, higher morale and even
higher quality of care? These and other questions can be studied using the line of inquiry
initiated here.
Study Limitations The study survey was directed to 2,200 members of the American College of Healthcare
Executives with a response rate of 31 percent. The majority of the respondents (55%) were
employed at freestanding hospitals and the REM experiences at these locations may be different
from the experiences of REMs at system hospitals (32%) and corporate headquarters (13%). In
addition, we asked a senior executive to assess the interpersonal skills of REMs without getting
the perspectives of other senior executives or for that matter, the REMs themselves. Both of
these groups may disagree with the assessment offered by the respondent to this survey.
Furthermore, the respondents could choose the candidate to evaluate. Because of this, they may
have selected persons who they believe shows promise in healthcare management and
particularly in regard to interpersonal skills. Thus the findings, which are generally positive, may
be the result of selection bias. Similarly, the responses of senior executive managers may not be
entirely objective when they compared their own interpersonal skills with their REMs. It may be
that over time individuals forget their weaknesses and emphasize their strengths.

86
Appendix I: Survey Instrument
The Interpersonal Skills of Recent Entrants
to the Field of Healthcare Management Survey
The Interpersonal Skills of Recent Entrants to the Field of Healthcare Management
To help us understand the training needs of entrants to the field of healthcare management, we are asking selected affiliates of ACHE to share their impressions of novice managers with whom they work on a regular basis. Novice managers are denoted as individuals who are new to management. They may also have had extensive clinical experience but have been healthcare management practitioners for five years or less. For this survey, we need you to identify one individual whom we will refer to as “the novice manager” in this survey.
1. Can you identify a recent entrant to the field of healthcare management (e.g., a manager with
five or fewer years of healthcare management experience) with whom you work on a regular
basis?
o Yes o No (end survey)
2. In what capacity do you interact with the novice manager? (Check all that apply.)
o I am their immediate supervisor o I am a formally identified mentor to the novice o I am an informal mentor to the novice o I am in a work group with the novice o My office is located near the novice’s workspace o Other (please specify how you interact with the novice
___________________________________________________________________________________
___________________________________________________________________________________
___________________________________________________________________________________
3. Novice manager’s approximate age: ______________
4. Novice manager’s gender:
o Female o Male

87
5. Novice manager’s marital status:
o Married o Living in a marriage-like relationship o Separated or divorced o Widowed o Single (never married) o Don’t know
6. Does the novice manager have any children?
o Yes o No o Don’t know
7. Which of the following best describes the novice manager’s race/ethnicity? (Check all that
apply.)
o American Indian, Eskimo or Aleut o Asian or Pacific Islander o Black/African American o White/Caucasian o Hispanic or Latino o Other (please specify)____________________________________ o Don’t know
8. Did the novice manager complete graduate work in the following degree program?
o Health policy and management/health administration o Business administration o Public administration o Community and health science o Nursing o Medicine o Did not complete graduate study o Other: please specify ____________________________________ o Don’t know
9. Does the novice manager have prior clinical experience?
o Yes 1 (Answer Q. 10) o No ...................................................................... 2 (Skip to Q. 11) o Don’t know .......................................................... 3 (Skip to Q. 11)
10. If yes, how many years (estimate)? ______________

88
This part of the survey asks you to assess the characteristics of the novice manager.
11. Following is a series of paired comparisons that represent polar opposites. Please circle the number that best
represents your view of the targeted manager you are evaluating.
Positive Medium Negative
1 2 3 4 5
This manager’s personal values are
always consistent with the
management team. 1 2 3 4 5
This manager’s personal values are
not consistent with the management
team.
This manager is honest about his
mistakes. 1 2 3 4 5
This manager is not always honest
about his mistakes.
This manager seeks feedback for
projects from others who are more
knowledgeable. 1 2 3 4 5
This manager does not seek feedback
from others who are more
knowledgeable.
This manager is sufficiently self-
assured. 1 2 3 4 5
This manager is not sufficiently self-
assured.
This manager is receptive to
constructive criticism. 1 2 3 4 5
This manager is not receptive to
constructive criticism.
This manager sets challenging
goals for his staff. 1 2 3 4 5
This manager does not set
challenging goals for his staff.
This manager exercises authority
easily. 1 2 3 4 5
This manager does not exercise
authority easily.
This manager takes direction well. 1 2 3 4 5
This manager does not take direction
well.
This manager can read other
people’s emotions well. 1 2 3 4 5
This manager cannot read other
people’s emotions well.
This manager shows appropriate
respect to his superiors. 1 2 3 4 5
This manager does not show
appropriate respect to his superiors.
This manager has a positive mental
attitude. 1 2 3 4 5
This manager does not have a
positive mental attitude.
It is easy for this manager to work
with others. 1 2 3 4 5
It is not easy for this manager to work
with others.
I find it easy to trust this manager. 1 2 3 4 5
I find it difficult to trust this manager.
Others find it easy to trust this
manager. 1 2 3 4 5
Others do not find it easy to trust this
manager.

89
Positive Medium Negative
1 2 3 4 5
This manager deals with facts
when deciding on issues. 1 2 3 4 5
This manager does not deal with fact
when deciding on issues.
This manager is sensitive to
culturally correct behavior when
communicating with diverse
cultures.
1 2 3 4 5
This manager is not sensitive to
culturally correct behavior when
communicating with diverse cultures.
This manager is open to new ideas. 1 2 3 4 5
This manager is not open to new
ideas.
This manager confronts others
about their mistakes. 1 2 3 4 5
This manager does not confront
others about their mistakes.
This manager handles difficult
people or situations with
diplomacy.
1 2 3 4 5
This manager does not handle
difficult people or situations with
diplomacy.
This manager communicates
directly about controversial issues. 1 2 3 4 5
This manager fails to communicate
directly about controversial issues.
This manager is in control of his
emotions. 1 2 3 4 5
This manager is not in control of his
emotions.
This manager enjoys his work. 1 2 3 4 5
This manager does not enjoy his
work.
This manager has a good sense of
humor. 1 2 3 4 5
This manager does not have a good
sense of humor
This manager understands politics
in the organization. 1 2 3 4 5
This manager does not understand
politics in the organization.
This manager uses a variety of
techniques to influence others. 1 2 3 4 5
This manager does not use a variety
of techniques to influence others.
This manager builds rapport with
peers and others on the
management team.
1 2 3 4 5
This manager does not build rapport
with peers and others on the
management team.

90
12. Please rate the novice manager on the following five competencies when compared with your own
competence at his/her career stage. (Circle one number on each line.)
Much worse
Worse
About the
same
Better
Much better
Managerial ethics & values ................... 1 2 3 4 5
Communication ..................................... 1 2 3 4 5 Problem solving .......................................... 1 2 3 4 5 Interpersonal skills ..................................... 1 2 3 4 5 Developing others ...................................... 1 2 3 4 5
13. Please rate the interpersonal skills of the novice manager on a scale of 1 (poor) to 10 (excellent) as they
relate to:
Poor Average Excellent
a. Supervisors……. 1 2 3 4 5 6 7 8 9 10
b. Peers…………… 1 2 3 4 5 6 7 8 9 10
c. Subordinates……. 1 2 3 4 5 6 7 8 9 10
d. Physicians………. 1 2 3 4 5 6 7 8 9 10
e. Overall………….. 1 2 3 4 5 6 7 8 9 10
14. Are interpersonal relationship skills used to identify “fast trackers” and potential successors to current
leaders?
o Yes o No o Don’t know
15. What have been useful strategies and programs that have enhanced interpersonal skills of novice managers?
(Open end response) _________________________________________________________________________________________________
_________________________________________________________________________________________________
_________________________________________________________________________________________________
_________________________________________________________________________________________________ Thank you for completing this survey. By so doing, you have helped your professional society develop action plans to better prepare future healthcare leaders.

91
Appendix II: The Impact of the REM’s Education on How They Were Evaluated—
All Degree Categories (Chapter 4)
Appendix Table 4.1
Paired Comparisons on Dimensions of Interpersonal Competency, by All Degree Categories
1. INTRINSIC QUALITIES
This manager’s personal values are always consistent with the management team*
REM Education Positive Medium Negative Chi Sq
P-value 1 2 3 4 5 Total
Health Policy &
Management
65
(44%)
58
(39%)
20
(41%)
6
(4%)
0 149 .041*
Business 26
(45%)
16
(28%)
8
(14%)
8
(14%)
0 58
Clinical and Allied
Health
7
(27%)
14
(54%)
2
(8%)
2
(8%)
1
(4%)
26
Other 8
(29%)
12
(43%)
6
(21%)
2
(7%)
0 28
No Graduate Degree 13
(27%)
22
(46%)
7
(15%)
6
(13%)
0 48
This manager is honest about his mistakes
REM Education Positive Medium Negative Chi Sq
P-value 1 2 3 4 5 Total
Health Policy &
Management
88
(59%)
40
(27%)
12
(8%)
8
(5%)
0 148 .316
Business 36
(62%)
13
(22%)
5
(9%)
3
(5%)
1
(2%)
58
Clinical and Allied
Health
15
(58%)
8
(31%)
1
(4%)
1
(4%)
0 26
Other 15
(54%)
7
(25%)
0
6
(21%)
0 28
No Graduate Degree 7
(64%)
2
(18%)
1
(9%)
1
(9%)
0 11
I find it easy to trust this manager
REM Education Positive Medium Negative Chi Sq
P-value 1 2 3 4 5 Total
Health Policy &
Management
86
(58%)
39
(26%)
15
(10%)
7
(5%)
1
(1%)
148 .747
Business 30
(52%)
20
(34%)
6
(10%)
1
(2%)
1
(2%)
58
Clinical and Allied
Health
11
(42%)
9
(35%)
3
(12%)
3
(12%)
0 26
Other 16
(57%)
7
(25%)
2
(7%)
3
(11%)
0 28
No Graduate Degree 26
(54%)
10
(21%)
7
(15%)
3
(6%)
2
(4%)
48

92
Others find it easy to trust this manager
REM Education Positive Medium Negative Chi Sq
P-value 1 2 3 4 5 Total
Health Policy &
Management
62
(42%)
52
(36%)
23
(16%)
8
(5%)
1
(1%)
146 .691
Business 21
(36%)
22
(38%)
11
(19%)
4
(7%)
0 58
Clinical and Allied
Health
9
(35%)
9
(35%)
3
(12%)
4
(15%)
1
(4%)
26
Other 12
(43%)
9
(32%)
3
(11%)
3
(11%)
1
(4%)
28
No Graduate Degree 21
(46%)
10
(22%)
10
(22%)
3
(7%)
2
(4%)
46
2. SELF-DEVELOPMENT
This manager seeks feedback for projects from others who are more knowledgeable
REM Education Positive Medium Negative Chi Sq
P-value 1 2 3 4 5 Total
Health Policy &
Management
80
(54%)
41
(28%)
13
(9%)
13
(9%)
1
(1%)
148 .667
Business 25
(45%)
18
(32%)
7
(13%)
5
(9%)
1
(2%)
56
Clinical and Allied
Health
12
(46%)
10
(38%)
2
(8%)
2
(8%)
0 26
Other 15
(54%)
9
(32%)
3
(11%)
1
(4%)
0 28
No Graduate Degree 20
(42%)
18
(38%)
2
(4%)
6
(13%)
2
(4%)
48
The manger is receptive to constructive criticism
REM Education Positive Medium Negative Chi Sq
P-value 1 2 3 4 5 Total
Health Policy &
Management
63
(43%)
54
(37%)
18
(12%)
11
(8%)
5
(3%)
146 .162
Business 20
(34%)
22
(38%)
12
(21%)
3
(5%)
1
(2%)
58
Clinical and Allied
Health
9
(36%)
8
(32%)
4
(16%)
4
(16%)
0 25
Other 13
(46%)
9
(32%)
3
(11%)
3
(11%)
0 28
No Graduate Degree 23
(48%)
11
(23%)
7
(15%)
4
(8%)
3
(6%)
48

93
This manager takes direction well
REM Education Positive Medium Negative Chi Sq
P-value 1 2 3 4 5 Total
Health Policy &
Management
86
(59%)
40
(27%)
10
(7%)
11
(7%)
0 147 .262
Business 25
(44%)
20
(35%)
8
(14%)
4
(7%)
0 57
Clinical and Allied
Health
13
(50%)
6
(23%)
7
(27%)
0 0 26
Other 12
(43%)
9
(32%)
5
(18%)
2
(7%)
0 28
No Graduate Degree 25
(53%)
11
(23%)
9
(19%)
2
(4%)
0 47
This manager is open to new ideas***
REM Education Positive Medium Negative Chi Sq
P-value 1 2 3 4 5 Total
Health Policy &
Management
96
(65%)
32
(22%)
16
(11%)
3
(2%)
0 147 .001***
Business 29
(50%)
23
(40%)
5
(9%)
1
(2%)
0 58
Clinical and Allied
Health
12
(46%)
7
(27%)
3
(12%)
4
(15%)
0 26
Other 17
(63%)
5
(19%)
4
(15%)
1
(4%)
0 27
No Graduate Degree 22
(47%)
19
(40%)
3
(6%)
3
(6%)
0 47
This manager deals with facts when deciding on issues
REM Education Positive Medium Negative Chi Sq
P-value 1 2 3 4 5 Total
Health Policy &
Management
62
(42%)
62
(42%)
17
(12%)
4
(3%)
1
(1%)
146 .925
Business 22
(38%)
26
(45%)
6
(10%)
3
(5%)
1
(2%)
58
Clinical and Allied
Health
8
(33%)
10
(42%)
5
(21%)
1
(4%)
0 24
Other 10
(37%)
9
(33%)
6
(22%)
2
(7%)
0 27
No Graduate Degree 18
(38%)
15
(32%)
10
(21%)
3
(6%)
1
(2%)
47

94
3. OUTLOOK
This manager is sufficiently self-assured
REM Education Positive Medium Negative Chi Sq
P-value 1 2 3 4 5 Total
Health Policy &
Management
57
(39%)
58
(39%)
21
(14%)
11
(7%)
1
(1%)
148 .553
Business 25
(43%)
22
(38%)
8
(14%)
3
(5%)
0 58
Clinical and Allied
Health
6
(24%)
14
(56%)
4
(16%)
1
(4%)
0 25
Other 9
(32%)
12
(43%)
6
(21%)
1
(4%)
0 28
No Graduate Degree 12
(25%)
17
(35%)
14
(29%)
4
(8%)
1
(2%)
48
This manager shows appropriate respect to his superiors
REM Education Positive Medium Negative Chi Sq
P-value 1 2 3 4 5 Total
Health Policy &
Management
91
(63%)
37
(26%)
11
(8%)
3
(2%)
3
(2%)
145 .904
Business 32
(55%)
19
(33%)
5
(9%)
2
(3%)
0 58
Clinical and Allied
Health
15
(58%)
9
(35%)
0 2
(8%)
0 26
Other 18
(64%)
7
(25%)
2
(7%)
1
(4%)
0 28
No Graduate Degree 26
(55%)
14
(30%)
5
(11%)
1
(2%)
1
(2%)
47
This manager has a positive mental attitude*
REM Education Positive Medium Negative Chi Sq
P-value 1 2 3 4 5 Total
Health Policy &
Management
99
(68%)
38
(26%)
8
(5%)
1
(1%)
0 146 .036*
Business 32
(55%)
22
(38%)
3
(5%)
0 1
(2%)
58
Clinical and Allied
Health
14
(54%)
7
(27%)
5
(19%)
0 0 26
Other 17
(61%)
6
(21%)
3
(11%)
2
(7%)
0 28
No Graduate Degree 28
(58%)
11
(23%)
5
(10%)
4
(8%)
0 48

95
This manager is in control of his emotions
REM Education Positive Medium Negative Chi Sq
P-value 1 2 3 4 5 Total
Health Policy &
Management
71
(49%)
54
(37%)
12
(8%)
9
(6%)
0 146 .270
Business 25
(43%)
18
(31%)
10
(17%)
4
(7%)
1
(2%)
58
Clinical and Allied
Health
7
(28%)
7
(28%)
5
(20%)
6
(24%)
0 25
Other 10
(36%)
10
(36%)
6
(21%)
2
(7%)
0 28
No Graduate Degree 10
(21%)
10
(21%)
6
(13%)
2
(4%)
1
(2%)
47
This manager enjoys his work
REM Education Positive Medium Negative Chi Sq
P-value 1 2 3 4 5 Total
Health Policy &
Management
86
(59%)
50
(34%)
7
(5%)
2
(1%)
0 145 .745
Business 34
(59%)
21
(36%)
3
(5%)
0 0 58
Clinical and Allied
Health
14
(54%)
9
(35%)
2
(8%)
1
(4%)
0 26
Other 15
(56%)
7
(26%)
4
(15%)
1
(4%)
0 27
No Graduate Degree 27
(57%)
13
(28%)
5
(11%)
2
(4%)
0 47
This manager has a good sense of humor
REM Education Positive Medium Negative Chi Sq
P-value 1 2 3 4 5 Total
Health Policy &
Management
78
(54%)
51
(35%)
12
(8%)
3
(2%)
1
(1%)
145 .739
Business 31
(53%)
22
(38%)
4
(7%)
1
(2%)
0 58
Clinical and Allied
Health
11
(44%)
11
(44%)
1
(4%)
2
(8%)
0 25
Other 16
(57%)
6
(21%)
4
(14%)
2
(7%)
0 28
No Graduate Degree 23
(50%)
17
(37%)
3
(7%)
2
(4%)
0 46
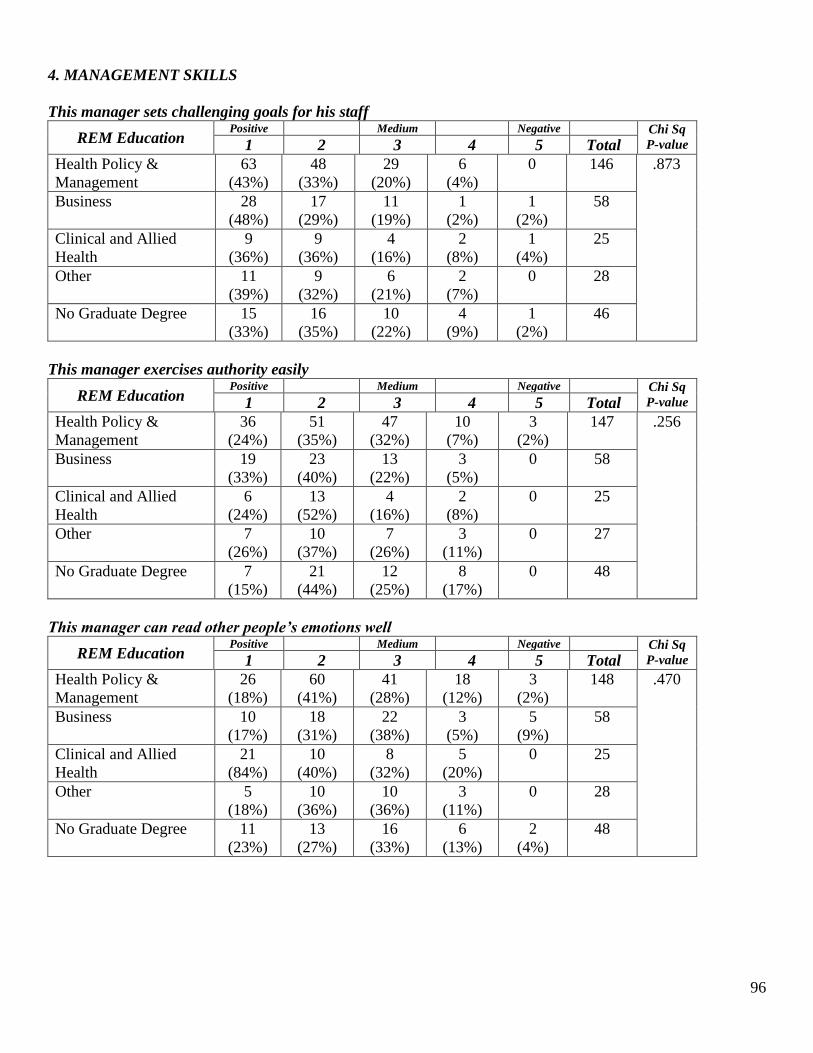
96
4. MANAGEMENT SKILLS
This manager sets challenging goals for his staff
REM Education Positive Medium Negative Chi Sq
P-value 1 2 3 4 5 Total
Health Policy &
Management
63
(43%)
48
(33%)
29
(20%)
6
(4%)
0 146 .873
Business 28
(48%)
17
(29%)
11
(19%)
1
(2%)
1
(2%)
58
Clinical and Allied
Health
9
(36%)
9
(36%)
4
(16%)
2
(8%)
1
(4%)
25
Other 11
(39%)
9
(32%)
6
(21%)
2
(7%)
0 28
No Graduate Degree 15
(33%)
16
(35%)
10
(22%)
4
(9%)
1
(2%)
46
This manager exercises authority easily
REM Education Positive Medium Negative Chi Sq
P-value 1 2 3 4 5 Total
Health Policy &
Management
36
(24%)
51
(35%)
47
(32%)
10
(7%)
3
(2%)
147 .256
Business 19
(33%)
23
(40%)
13
(22%)
3
(5%)
0 58
Clinical and Allied
Health
6
(24%)
13
(52%)
4
(16%)
2
(8%)
0 25
Other 7
(26%)
10
(37%)
7
(26%)
3
(11%)
0 27
No Graduate Degree 7
(15%)
21
(44%)
12
(25%)
8
(17%)
0 48
This manager can read other people’s emotions well
REM Education Positive Medium Negative Chi Sq
P-value 1 2 3 4 5 Total
Health Policy &
Management
26
(18%)
60
(41%)
41
(28%)
18
(12%)
3
(2%)
148 .470
Business 10
(17%)
18
(31%)
22
(38%)
3
(5%)
5
(9%)
58
Clinical and Allied
Health
21
(84%)
10
(40%)
8
(32%)
5
(20%)
0 25
Other 5
(18%)
10
(36%)
10
(36%)
3
(11%)
0 28
No Graduate Degree 11
(23%)
13
(27%)
16
(33%)
6
(13%)
2
(4%)
48

97
It is easy for this manager to work with others
REM Education Positive Medium Negative Chi Sq
P-value 1 2 3 4 5 Total
Health Policy &
Management
79
(54%)
41
(28%)
19
(13%)
8
(5%)
0 147 .383
Business 25
(43%)
19
(33%)
11
(19%)
3
(5%)
0 58
Clinical and Allied
Health
9
(35%)
9
(35%)
5
(19%)
3
(12%)
0 26
Other 12
(43%)
8
(29%)
3
(11%)
4
(14%)
1
(4%)
28
No Graduate Degree 21
(45%)
17
(36%)
6
(13%)
3
(6%)
0 47
This manager is sensitive to culturally correct behavior when communicating with diverse cultures
REM Education Positive Medium Negative Chi Sq
P-value 1 2 3 4 5 Total
Health Policy &
Management
67
(46%)
53
(36%)
21
(14%)
5
(3%)
0 146 .283
Business 26
(45%)
21
(36%)
9
(16%)
2
(3%)
0 58
Clinical and Allied
Health
10
(40%)
8
(32%)
6
(24%)
1
(4%)
0 25
Other 12
(43%)
9
(32%)
5
(18%)
2
(7%)
0 28
No Graduate Degree 16
(34%)
20
(43%)
0 1
(2%)
1
(2%)
47
This manager confronts others about their mistakes
REM Education 1 2 3 4 5 Total Chi Sq
P-value
Health Policy &
Management
29
(20%)
59
(41%)
43
(30%)
12
(8%)
2
(1%)
145 .453
Business 19
(33%)
22
(38%)
15
(26%)
2
(3%)
0 58
Clinical and Allied
Health
5
(20%)
11
(44%)
7
(28%)
2
(8%)
0 25
Other 9
(32%)
10
(36%)
8
(29%)
1
(4%)
0 28
No Graduate Degree 7
(15%)
22
(47%)
9
(19%)
8
(17%)
1
(2%)
47

98
This manager handles difficult people or situations with diplomacy
REM Education Positive Medium Negative Chi Sq
P-value 1 2 3 4 5 Total
Health Policy &
Management
42
(29%)
60
(41%)
31
(21%)
12
(8%)
0 145 .207
Business 17
(29%)
18
(31%)
17
(29%)
4
(7%)
2
(3%)
58
Clinical and Allied
Health
2
(8%)
11
(44%)
8
(32%)
3
(12%)
1
(4%)
25
Other 11
(39%)
9
(32%)
4
(14%)
4
(14%)
0 28
No Graduate Degree 12
(26%)
18
(38%)
12
(26%)
5
(11%)
0 47
This manager understands politics in the organization
REM Education Positive Medium Negative Chi Sq
P-value 1 2 3 4 5 Total
Health Policy &
Management
30
(21%)
58
(40%)
41
(28%)
16
(11%)
1
(1%)
146 .097
Business 19
(33%)
20
(34%)
13
(22%)
4
(7%)
2
(3%)
58
Clinical and Allied
Health
3
(12%)
6
(24%)
8
(32%)
5
(20%)
3
(12%)
25
Other 8
(29%)
9
(32%)
5
(18%)
4
(14%)
2
(7%)
28
No Graduate Degree 5
(11%)
22
(49%)
14
(31%)
3
(7%)
1
(2%)
45
This manager communicates directly about controversial issues
REM Education Positive Medium Negative Chi Sq
P-value 1 2 3 4 5 Total
Health Policy &
Management
39
(27%)
62
(42%)
33
(23%)
10
(7%)
2
(1%)
146 .744
Business 20
(34%)
21
(36%)
11
(19%)
6
(10%)
0 58
Clinical and Allied
Health
3
(12%)
13
(52%)
5
(20%)
4
(16%)
0 25
Other 7
(25%)
11
(39%)
9
(32%)
1
(4%)
0 28
No Graduate Degree 12
(26%)
23
(49%)
7
(15%)
4
(9%)
1
(2%)
47

99
This manager uses a variety of techniques to influence others
REM Education Positive Medium Negative Chi Sq
P-value 1 2 3 4 5 Total
Health Policy &
Management
25
(17%)
64
(45%)
36
(25%)
15
(10%)
3
(2%)
143 .338
Business 10
(17%)
27
(47%)
17
(29%)
3
(5%)
1
(2%)
58
Clinical and Allied
Health
2
(8%)
9
(36%)
8
(32%)
6
(24%)
0 25
Other 10
(37%)
7
(26%)
7
(26%)
2
(7%)
1
(4%)
27
No Graduate Degree 10
(21%)
19
(40%)
11
(23%)
5
(11%)
2
(4%)
47
This manager builds rapport with peers and others on the management team
REM Education Positive Medium Negative Chi Sq
P-value 1 2 3 4 5 Total
Health Policy &
Management
61
(42%)
58
(40%)
15
(10%)
10
(7%)
2
(1%)
146 .396
Business 24
(41%)
20
(34%)
13
(22%)
1
(2%)
0 58
Clinical and Allied
Health
6
(24%)
12
(48%)
7
(28%)
0 0 25
Other 13
(46%)
8
(29%)
4
(14%)
2
(7%)
1
(4%)
28
No Graduate Degree 16
(34%)
20
(43%)
6
(13%)
5
(11%)
1
(2%)
47
Note: “Clinical and Allied Health” includes medicine and nursing. “Other” includes public administration, legal, and community
health science.
*** <.001; ** <.01; *<.05
Tables may not add to 100% due to rounding.

100
Appendix Table 4.2
Recent REMs Competencies Compared with Senior Executives Views of Their Own Competency
at the Same Career Stage, by All Degrees
a. Managerial ethics & values**
REM
Education
Much
worse
1
Worse
2
About the
same
3
Better
4
Much
better
5
Total Chi Sq
P-value
Health
Management
0
14
(10%)
99
(72%)
19
(14%)
5
(4%)
137 .003**
Business 0 9
(16%)
45
(80%)
2
(4%)
0 56
Clinical and
Allied Health 1
(4%)
5
(20%)
14
(56%)
5
(20%)
0 25
Other 1
(4%)
7
(25%)
12
(43%)
8
(29%)
0 28
No Graduate
Degree
0 10
(21%)
35
(73%)
2
(4%)
1
(2%)
48
b. Communication
REM
Education
Much
worse
1
Worse
2
About the
same
3
Better
4
Much
better
5
Total Chi Sq
P-value
Health
Management
2
(1%)
43
(31%)
61
(44%)
27
(19%)
7
(5%)
140 .209
Business 2
(4%)
20
(35%)
25
(44%)
9
(16%)
1
(2%)
57
Clinical and
Allied Health 3
(12%)
3
(12%)
14
(56%)
5
(20%)
0 25
Other 0 9
(32%)
14
(50%)
5
(18%)
0 28
No Graduate
Degree
1
(2%)
15
(31%)
18
(38%)
13
(27%)
1
(2%)
48
c. Problem solving
REM
Education
Much
worse
1
Worse
2
About the
same
3
Better
4
Much
better
5
Total Chi Sq
P-value e
Health
Management
1
(1%)
37
(26%)
72
(51%)
28
(20%)
5
(4%)
141 .338
Business 1
(2%)
15
(26%)
32
(56%)
7
(12%)
2
(4%)
57
Clinical and
Allied Health 2
(8%)
5
(20%)
18
(72%)
1
(4%)
0 25
Other 0 9
(35%)
14
(54%)
3
(12%)
0 26
No Graduate
Degree
1
(2%)
16
(36%)
24
(53%)
3
(7%)
1
(2%)
45
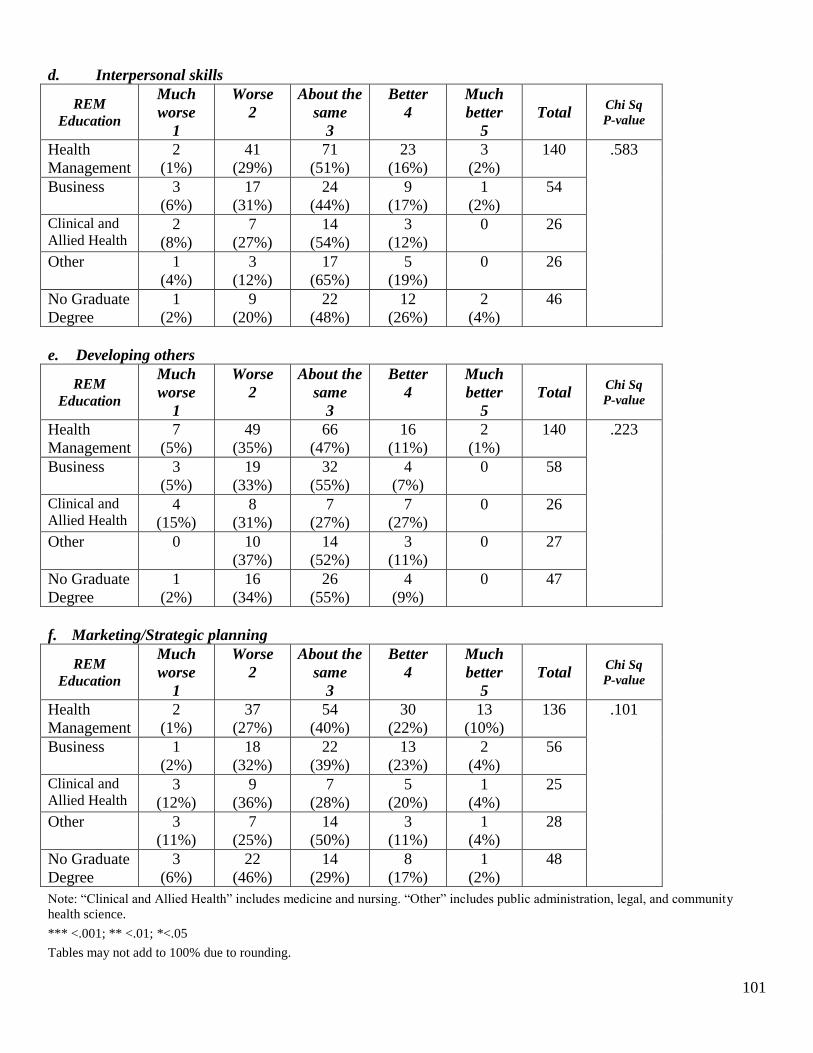
101
d. Interpersonal skills
REM
Education
Much
worse
1
Worse
2
About the
same
3
Better
4
Much
better
5
Total Chi Sq
P-value
Health
Management
2
(1%)
41
(29%)
71
(51%)
23
(16%)
3
(2%)
140 .583
Business 3
(6%)
17
(31%)
24
(44%)
9
(17%)
1
(2%)
54
Clinical and
Allied Health 2
(8%)
7
(27%)
14
(54%)
3
(12%)
0 26
Other 1
(4%)
3
(12%)
17
(65%)
5
(19%)
0 26
No Graduate
Degree
1
(2%)
9
(20%)
22
(48%)
12
(26%)
2
(4%)
46
e. Developing others
REM
Education
Much
worse
1
Worse
2
About the
same
3
Better
4
Much
better
5
Total Chi Sq
P-value
Health
Management
7
(5%)
49
(35%)
66
(47%)
16
(11%)
2
(1%)
140 .223
Business 3
(5%)
19
(33%)
32
(55%)
4
(7%)
0 58
Clinical and
Allied Health 4
(15%)
8
(31%)
7
(27%)
7
(27%)
0 26
Other 0 10
(37%)
14
(52%)
3
(11%)
0 27
No Graduate
Degree
1
(2%)
16
(34%)
26
(55%)
4
(9%)
0 47
f. Marketing/Strategic planning
REM
Education
Much
worse
1
Worse
2
About the
same
3
Better
4
Much
better
5
Total Chi Sq
P-value
Health
Management
2
(1%)
37
(27%)
54
(40%)
30
(22%)
13
(10%)
136 .101
Business 1
(2%)
18
(32%)
22
(39%)
13
(23%)
2
(4%)
56
Clinical and
Allied Health 3
(12%)
9
(36%)
7
(28%)
5
(20%)
1
(4%)
25
Other 3
(11%)
7
(25%)
14
(50%)
3
(11%)
1
(4%)
28
No Graduate
Degree
3
(6%)
22
(46%)
14
(29%)
8
(17%)
1
(2%)
48
Note: “Clinical and Allied Health” includes medicine and nursing. “Other” includes public administration, legal, and community
health science.
*** <.001; ** <.01; *<.05
Tables may not add to 100% due to rounding.

102
Table 4.3
The Interpersonal Skills of REMs as Evaluated by Senior Executive Respondents,
by All Degrees as They Relate to:
a. Supervisors
REM
Education
REM Interpersonal Skills
Chi Sq
P-value
Fair to
Poor
(1-4)
Average
(5-7)
Good to
Excellent
(8-10)
Total
Health
Management
6
(4%)
34
(25%)
93
(68%)
136 .726
Business 1
(2%)
21
(38%)
33
(60%)
55
Clinical and
Allied Health 1
(4%)
9
(38%)
14
(58%)
24
Other 2
(8%)
8
(31%)
16
(62%)
26
No Graduate
Degree
3
(7%)
15
(33%)
28
(61%)
46
b. Peers
REM
Education
REM Interpersonal Skills
Chi Sq
P-value
Fair to
Poor
(1-4)
Average
(5-7)
Good to
Excellent
(8-10)
Total
Health
Management
9
(6%)
35
(25%)
96
(69%)
140 .260
Business 4
(7%)
24
(43%)
28
(50%)
56
Clinical and
Allied Health 1
(4%)
8
(33%)
15
(63%)
24
Other 3
(11%)
6
(22%)
18
(67%)
27
No Graduate
Degree
1
(2%)
18
(38%)
29
(60%)
48

103
c. Subordinates
REM
Education
REM Interpersonal Skills
Chi Sq
P-value
Fair to
Poor
(1-4)
Average
(5-7)
Good to
Excellent
(8-10)
Total
Health
Management
20
(14%)
45
(32%)
74
(53%)
139 .637
Business 6
(11%)
25
(45%)
24
(44%)
55
Clinical and
Allied Health 7
(17%)
23
(56%)
11
(27%)
41
Other 3
(11%)
7
(25%)
18
(64%)
28
No Graduate
Degree
3
(6%)
23
(48%)
22
(46%)
48
d. Physicians
REM
Education
REM Interpersonal Skills
Chi Sq
P-value
Fair to
Poor
(1-4)
Average
(5-7)
Good to
Excellent
(8-10)
Total
Health
Management
16
(12%)
47
(34%)
74
(54%)
137 .909
Business 3
(5%)
20
(36%)
33
(59%)
56
Clinical and
Allied Health 4
(16%)
5
(20%)
16
(64%)
25
Other 4
(14%)
7
(25%)
17
(61%)
28
No Graduate
Degree
5
(11%)
21
(45%)
21
(45%)
47
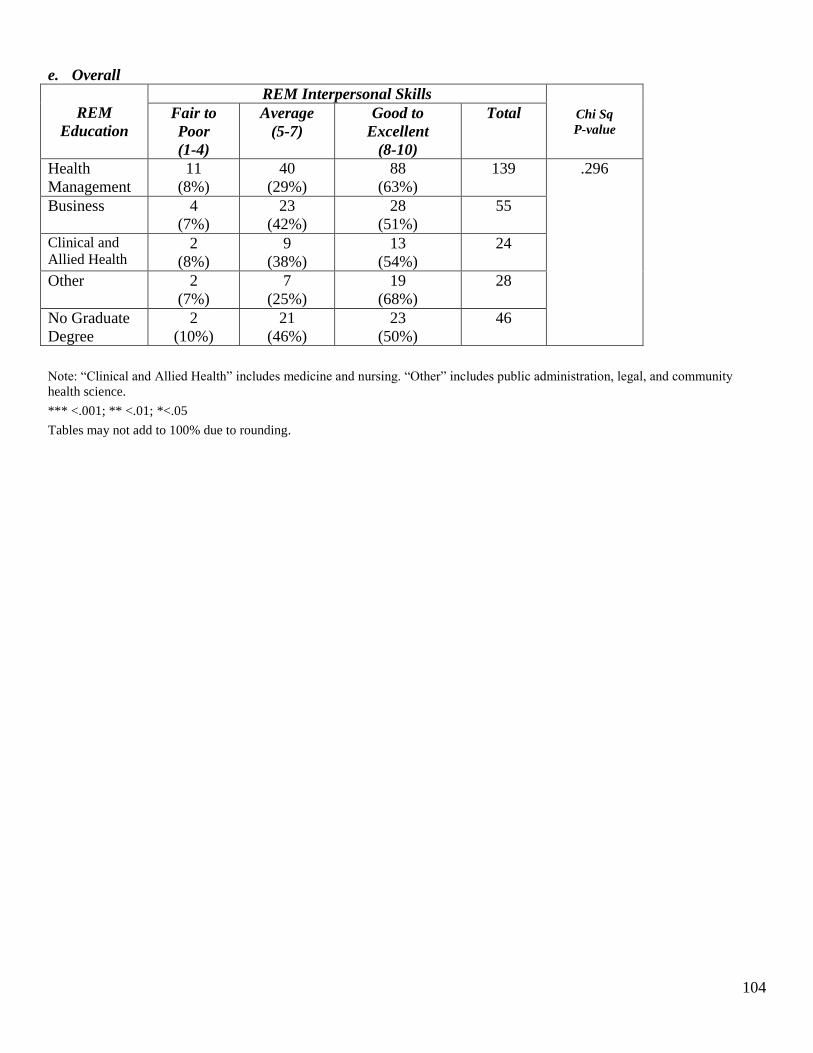
104
e. Overall
REM
Education
REM Interpersonal Skills
Chi Sq
P-value
Fair to
Poor
(1-4)
Average
(5-7)
Good to
Excellent
(8-10)
Total
Health
Management
11
(8%)
40
(29%)
88
(63%)
139 .296
Business 4
(7%)
23
(42%)
28
(51%)
55
Clinical and
Allied Health 2
(8%)
9
(38%)
13
(54%)
24
Other 2
(7%)
7
(25%)
19
(68%)
28
No Graduate
Degree
2
(10%)
21
(46%)
23
(50%)
46
Note: “Clinical and Allied Health” includes medicine and nursing. “Other” includes public administration, legal, and community
health science.
*** <.001; ** <.01; *<.05
Tables may not add to 100% due to rounding.

105
References
Aarons, G.A. and A. C. Sawitzky. (2006). Organizational climate partially mediates the effect of
culture on work attitudes and staff turnover in mental health services. Administration and
Policy in Mental Health 33(3):289-301.
Alsop, R. (2008). The trophy kids grow up: How the Millennial generation is shaking up the
workplace. San Francisco: Jossey-Bass Publishers.
American College of Healthcare Executives. (2011). Which degree should I pursue? Retrieved
December 25, 2011 http://www.ache.org/CARSVCS/whichdegree.cfm.
Avery, D. R. (2011). Support for diversity in organizations. A theoretical exploration of its
origins and offshoots. Organizational Psychology Review 1(3) 239 – 256.
Backes-Gellner, U. and S. Veen (2009). The impact of aging and age diversity on company
performance. German Academy of Sciences Leopoldina and the German Academy of
Sciences and Engineering Working Paper Series. www.ssm.com/abstract=1346895.
Bartol, K. (1999). Gender influences on performance evaluations. In Handbook of Gender &
Work. Ed. G. N. Powell. Thousand Oaks CA. Sage. 165-78.
Bennis, W. G. and J. O’Toole. (2005). How business schools lost their way. Harvard Business
Review 83:5 96-105.
Bloom, N., R. Homkes, R. Sadun, and J. Van Reenen (2011, June 13). Why American
management rules the world. Harvard Business Review Blog. Retrieved December 25,
2011 http://blogs.hbr.org/cs/2011/06/why_american_management_rules.html
Cahill, T. F. and M. Sedrak. (2010). The Millenials are here: Addressing generational tensions.
Chicago: 2010 Congress on Healthcare Leadership.
Cahill, T. F. and M. Sedrak. (November/December 2009). Generational jeopardy. HFMA Focus
14-16.
Cherlin, E., B. Helfand, B.A. Elbel, et al. (2006). Cultivating next generation leadership:
Preceptors’ rating of competencies in post-graduate administrative residents and fellows.
Journal of Health Administration Education 23:4 pp. 351-65.
Commission on Accreditation of Healthcare Management Education. (2013). CAHME Criteria
for Accreditation. www.cahme.org/resources/fall2013.
Davis, H. and T. Nicholaou.(1992). A comparison of the interviewing skills of first- and final-
year medical students. Medical Education 26 441-447.
DeAngelo, L., S. Hurtado, J.H. Pryor, K.R. Kelly, J.L. Santos, and W.S. Korn. (2009). The
American College Teacher: National Norms for the 2007–08 HERI Faculty Survey. Los
Angeles: Higher Education Research Institute, UCLA.

106
Dorgan, S., D. Layton, N. Bloom, R. Homkes, R. Sadun, and J. Van Reenen (2011).
Management in healthcare: Why good practice really matters. Retrieved December 25,
2011 http://cep.lse.ac.uk/pubs/download/cp330.pdf
Ferris, G. R., P. L. Perrewe, and C. Douglas (2002). Social effectiveness in organizations:
Construct validity and research directions. Journal of Leadership & Organizational
Studies. 9:1 49-63.
Friedman, E. (2007). A generational thing. Hospitals & Health Networks. Chicago: American
Hospital Publishing, Inc. www.hhnmag.com Retrieved August 3, 2011.
Ferris, G.R., R.W. Kolodinsky, W.A. Hochwarter, and D.D. Frank. (2001). Conceptualization,
measurement and validation of the political skill construct. Paper presented at the
Academy of Management 61st Annual National Meeting, Washington, D.C. cited in
Ferris, G. et al. 2002. Social effectiveness in organizations: Construct validity and
research directions. Journal of Leadership and Organizational Studies, 9:1 49-63.
Freshman, R. and L. Rubino. (2002). Emotional intelligence: A core competency for health care
administration. Health Care Manager 20:4 pp. 1-9.
George, J.M. (2000). Emotions and leadership: the role of emotional intelligence. Human
Relations 53:1027-56.
Gleeson, P.B. (2003). Managing and motivating the generations: Implications for the student and
the employee. Combined Sections Meeting 2003 at University of Wisconsin-Stevens
Point. Retrieved February 20, 2010. http://www.uwsp.edu/education/facets/links_
resources/4413.pdf.
Golman, D. (1995). Emotional intelligence: Why it can matter more than IQ. New York: Bantam
Books.
Griffith, J. (2007). Improving preparation for senior management in healthcare. The Journal of
Health Administration Education. 24:11-32.
Gritzmacher, K.J. (1989). Staying competitive through strategic management of fast-track
employees. National Productivity Review 8:421-432.
Guo, K.L. (2009). Core competencies of the entrepreneurial leader in health care organizations.
The Health Care Manager 28:1 pp. 19-29.
Helfand, B., E. Cherlin, and E. Bradley. (2005). Next generation leadership: A profile of self-
rated competencies among administrative residents and fellows. Journal of Health
Administration Education 22:1 pp. 85-105.
Hogan, R. and R. Blake. (1996). Vocational interests: Matching self-concept and the work
environment. In K. Murphy (Ed.) Individual Differences and Behavior in Organizations
(pp. 88-144). Misenheimer: Pfeiffer.

107
Holland, J., G. Gottfredson, and H. Baker (1990). Validity of vocational aspirations and interest
inventories: Extended, replicated, and reinterpreted. Journal of Counseling Psychology
37(3), 337-342.
Howe, N.. and W. Strauss. (2000). Millennials rising: The next great generation. New York:
Vintage Books.
Inderrieden, E. J., B. C. Holtom, and R. J. Bies. (2006). Do MBA programs deliver? In C.
Wankel and B. DeFillipi (Ed.), New Visions of Graduate Management Education. (pp. 3-
22). Greenwich, CT: Information Age Publishing.
Jackson, S. E. and A. Joshi. (2004). Diversity in social context: a multi-attribute, multilevel
analysis of team diversity and sales performance. Journal of Organizational Behavior
25:6 675-702.
Lau, D. C. and J. K. Murnighan. (2005). Interactions with groups and subgroups: The effects of
demographic fault lines. Academy of Management Journal 48:4 645-659.
Mayo Clinic. (2007). Workplace generation gap: Understand differences among colleagues.
www.mayoclinic.com/health/working-life. March 29, 2007. Retrieved September 9,
2007.
Mecklenburg, G. (2001). Career performance: How are we doing? Journal of Healthcare
Management 46:1 pp. 8-13.
Niles, S. and J. Bowlsbey (2004). Career development interventions in the 21st century. Upper
Saddle River: Merril Prentice Hall, 49-58.
Pew Research Center (2010). Milleninials: A portrait of generation next. www.pewresearch.org/
millennials. Retrieved April 21, 2010.
Priestland, A. and R. Hanig. (2005). Developing first-level leaders. Harvard Business Review
83:6, pp. 113-120.
Salazar, M.R. (2006). The turbulent twenties survival guide: Figuring out who you are, what you
want, & where you’re going after college. Oakland, CA: New Harbinger Publications,
Inc..
Severinsson, E. (2010). Evaluation of the clinical supervision and professional development of
student nurses. Journal of Nursing Management 18 669-677.
Shader, K. and M.D. Broome, C.D. Broome, M.E. West, and M. Nash. (2001). Factors
influencing satisfaction and anticipated turnover for nurses in an academic medical
center. Journal of Nursing Administration 31:4, pp. 210-216.
Stein, S., and H. Book. (2006). The EQ edge: Emotional intelligence and your success. Canada:
Jossey-Bass.

108
Stefl, M. (2008). Common competencies for all healthcare managers: The healthcare leadership
alliance model. Journal of Healthcare Management 53:6.
Student-Doctor Network Forum (2007, February 18). MBA vs. MHA-the showdown [Online forum
comment] Retrieved from http://forums.studentdoctor.net/showthread.php?t=369455
Todd, S. Y., K. J. Harris, R. B. Harris, and A. R. Wheeler (2009). Career success implications of
political skill. The Journal of Social Psychology. 149:3 179-204.
White, K. Begun, J. (2007). Preceptor and employer evaluation of health administration student
competencies. Journal of Health Administrative Education 23:1, pp. 53-68.
Williams, R. B. (2009).Why are you not like me? The generational gap in the workplace
generational conflict in workplace. Psychology Today. http://www.psychologytoday.
com/blog/wired-success/200909/why-are-you-not-me-the-generational-gap-in-the-
workplace.
Yarbrough, A. and B. Baumgardner (2007). The acculturation of non-traditionally educated
healthcare managers into hospitals. Chicago: American College of Healthcare
Executives.