Embed Size (px)
Citation preview
1The Journal of Cotton Science 16:1–16 (2012) http://journal.cotton.org, © The Cotton Foundation 2012
BREEDING AND GENETICSInterpretation of AFIS and HVI Fiber Property Measurements in Breeding
for Cotton Fiber Quality ImprovementCarol M. Kelly*, Eric F. Hequet, and Jane K. Dever
C.M. Kelly* and J.K. Dever, Texas AgriLife Research, 1102 E. FM 1294, Lubbock, TX 79403; and E.F. Hequet, Texas Tech Fiber and Biopolymer Research Institute, Box 45019, Lubbock,TX 79403
*Corresponding author: [email protected]
ABSTRACT
For the last two decades, cotton breeders have used High Volume Instrument (HVI) as their primary and often sole source of fiber quality data when making plant selections. Fiber data generated by Advanced Fiber Infor-mation System (AFIS) technology is also now available to plant breeders, and provides addi-tional information on length characteristics and fiber maturity. Two methods of evaluating fiber quality of upland cotton (Gossypium hirsutum L.) in a breeding program were compared. One method used only HVI data for plant selections, whereas the other method used only AFIS data. One critical difference between the selection methods was use of fiber length distributions as the only selection criteria in the AFIS method. Line development began with 15 intraspecific F2 populations in 2005. Selections were made in the F2 and F3 generations based upon data generated from either HVI or AFIS. In the F5 generation, 10 lines from each selection method and four commercial cultivars were planted at three locations. Improvement of fiber quality in selected lines was apparent in the F3 generation. Both selection methods resulted in F5 lines with better fiber quality than commercial cultivars. Fiber maturity had a significant impact on length characteristics. Data indicated it is pos-sible to improve fiber length distribution using either selection method. Principle component analysis revealed differences between length distribution of HVI selection lines and AFIS selection lines, even though average fiber prop-erties from each selection method were similar.
For the past two decades, cotton breeders have used High Volume Instrument (HVI) fiber
measurements as their primary and often sole source of data making plant selections for fiber quality improvement. Now that additional methods of fiber property evaluation are available, this method of screening needs further evaluation. Demands on breeders regarding fiber quality are intensifying. Merchants demand fiber quality that is competitive in a global market, and textile mills need fibers that produce quality products and minimize waste. Breeding programs must continue to evolve with new technology to stay efficient and up to date if they are going to continue to contribute as an integral part of a competitive cotton industry. Cotton industry dynamics suggest breeders must begin to think globally to understand markets challenges and strive to be proactive rather than reactive. Data exist to support the theory that Advanced Fiber Information System (AFIS) might be an effective tool in predicting spinning performance and yarn quality (Hequet et al., 2007). The purpose of this research is to provide information that will evaluate the impact of using data generated from AFIS measurements in cotton breeding programs.
Improvements in fiber quality have long been a primary objective of cotton breeders. One major obstacle for early breeders was the lack of reliable methods to measure fiber characteristics. Those methods have become available with the advent of HVI in the late 1960s and AFIS in the 1980s. There is little information focusing on AFIS data and the benefits of using it in breeding programs. Previous research recognized the need for additional informa-tion about AFIS properties and the potential role of AFIS in breeding programs (Meredith et al., 1996). Other researchers have questioned how selecting for individual HVI properties, specifically strength, affects other fibers properties such as short fiber content, length, and fineness (May and Jividen, 1999). There have been few studies comparing HVI data versus AFIS data for making selections in a breeding program.
2KELLY ET AL.: AFIS AND HVI SELECTION USE IN COTTON BREEDING
HVI was developed for the U.S. Department of Agriculture (USDA) in 1969 (Hsieh, 1999; Ramey, 1999). It was designed to be used as a marketing tool with which to evaluate the quality of the fiber within a bale of cotton. HVI evaluates multiple fiber char-acteristics in a high volume of samples at a relatively high rate of speed in comparison to hand classing. HVI uses automated sampling techniques and mea-sures fiber properties from a bundle of fibers. This system remains popular today for both marketing and breeding, because it is efficient in terms of time and cost. Even with such wide acceptance, there is still debate among breeders about its effectiveness for use as a breeding tool. The development of AFIS was the result of cooperative efforts between the USDA Agricultural Research Service at Clemson, SC and Schaffner Technologies, with research beginning in 1982 (Bragg and Shofner, 1993). One of the primary objectives in the early design of this instrument was the ability to measure trash and neps. This was fol-lowed by efforts to measure fiber dimension, number of short fibers, and eventually a complete fiber length distribution (Bragg and Shofner, 1993; Shofner et al., 1988, 1990). These properties were chosen because of their value in the fiber-to-yarn engineering process. This basic information about the fiber is useful for quality control and production efficiency in mills, as well as for providing information needed to improve product quality (Shofner et al., 1988, 1990).
HVI uses a fibrosampler to grab a portion of cotton from the whole sample. This subsample is used to create a beard of approximately parallel fibers that is optically scanned for relevant measure-ments such as upper-half mean length (UHML) and uniformity index. AFIS uses an aeromechanical separator to separate microdust, trash, and fibers within a sample. These three components follow different paths and measured separately using two electro-optical sensors, one for fibers and one for dust and trash. Unlike HVI, fibers are individualized before any measurements are taken. This technique is more aggressive than HVI, but might be consid-ered an advantage because it is more representative of the opening and carding process but can result in some fiber breakage. Properties such as length and maturity are measured on each fiber using an infrared beam and electro-optical technology. In ad-dition to reporting means, data for individual fibers are combined to create distributions. Providing such information to the textile industry was a major ac-complishment of AFIS (Shofner et al., 1988, 1990).
The intent of the AFIS design was not to correlate other fiber measurements with AFIS. Rather, AFIS was designed to provide unique fiber data (Shofner et al., 1988). Prior to AFIS, individual fiber analysis was neither timely nor practical for industry or other applications besides research conditions (Bragg and Shofner, 1993). It should be noted that AFIS does not measure tensile properties (tenacity and elonga-tion) of fibers.
AFIS is still considered new technology and limited information is available about its effective-ness for use as a breeding tool. The current AFIS instruments measure 20 fiber properties, including maturity ratio and length distribution. Most of these properties were considered at some level of interest in this selection study.
F2 progenies were followed through a series of plant-to-row selections to the F5 line stage. These lines were derived from original selections consid-ered superior according to both types of fiber quality evaluation. This information was used to evaluate advantages and limitations of the two methods. The data presented in this paper tested the following hy-pothesis: fiber length distributions can be modified through breeding using UHML and uniformity index for the HVI selection method and complete length distribution for the AFIS selection method. This study was designed to provide breeders with insight as to how to select genotypes with fiber profiles that are preferred by textile mills.
MATERIALS & METHODS
Population Development. The study began with 15 intraspecific F2 populations from crosses made in 2004 for fiber quality. Fiber properties (HVI and AFIS) of parent lines were considered for both quality and diversity (Tables 1 and 2). Length distri-butions for the parent lines were considered diverse. Populations that were chosen appeared to have high quality fiber while still representing a range of values for various fiber properties and length distribution.
Fiber Analysis. A 60-g fiber sample was taken from each plot after ginning and submitted for fiber analysis. Starting with the F3 generation, HVI analy-sis and AFIS analysis were conducted on all popu-lations for both selection methods so comparisons could be made later. These data were for comparison only, HVI data were never evaluated during the AFIS selection method, and AFIS data were never evalu-ated during the HVI selection method.
3JOURNAL OF COTTON SCIENCE, Volume 16, Issue 1, 2012
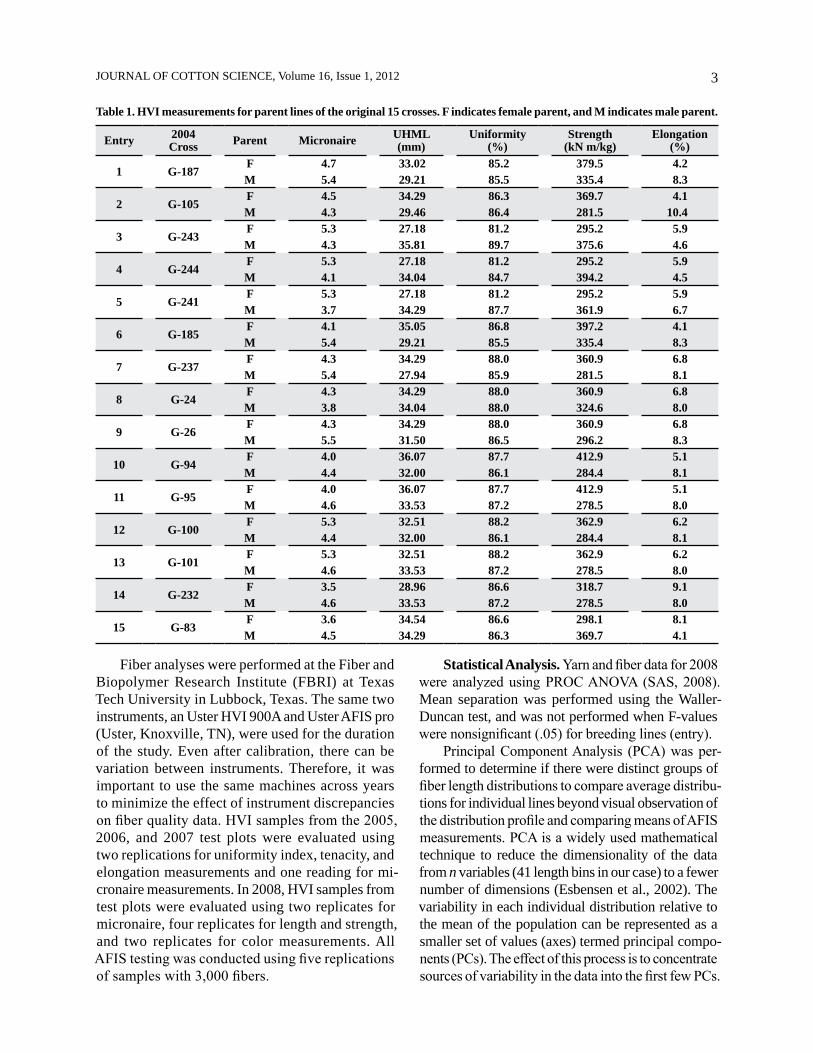
Fiber analyses were performed at the Fiber and Biopolymer Research Institute (FBRI) at Texas Tech University in Lubbock, Texas. The same two instruments, an Uster HVI 900A and Uster AFIS pro (Uster, Knoxville, TN), were used for the duration of the study. Even after calibration, there can be variation between instruments. Therefore, it was important to use the same machines across years to minimize the effect of instrument discrepancies on fiber quality data. HVI samples from the 2005, 2006, and 2007 test plots were evaluated using two replications for uniformity index, tenacity, and elongation measurements and one reading for mi-cronaire measurements. In 2008, HVI samples from test plots were evaluated using two replicates for micronaire, four replicates for length and strength, and two replicates for color measurements. All AFIS testing was conducted using five replications of samples with 3,000 fibers.
Statistical Analysis. Yarn and fiber data for 2008 were analyzed using PROC ANOVA (SAS, 2008). Mean separation was performed using the Waller-Duncan test, and was not performed when F-values were nonsignificant (.05) for breeding lines (entry).
Principal Component Analysis (PCA) was per-formed to determine if there were distinct groups of fiber length distributions to compare average distribu-tions for individual lines beyond visual observation of the distribution profile and comparing means of AFIS measurements. PCA is a widely used mathematical technique to reduce the dimensionality of the data from n variables (41 length bins in our case) to a fewer number of dimensions (Esbensen et al., 2002). The variability in each individual distribution relative to the mean of the population can be represented as a smaller set of values (axes) termed principal compo-nents (PCs). The effect of this process is to concentrate sources of variability in the data into the first few PCs.
Table 1. HVI measurements for parent lines of the original 15 crosses. F indicates female parent, and M indicates male parent.
Entry 2004Cross Parent Micronaire UHML
(mm) Uniformity
(%) Strength
(kN m/kg) Elongation
(%)
1 G-187F 4.7 33.02 85.2 379.5 4.2M 5.4 29.21 85.5 335.4 8.3
2 G-105F 4.5 34.29 86.3 369.7 4.1M 4.3 29.46 86.4 281.5 10.4
3 G-243F 5.3 27.18 81.2 295.2 5.9M 4.3 35.81 89.7 375.6 4.6
4 G-244F 5.3 27.18 81.2 295.2 5.9M 4.1 34.04 84.7 394.2 4.5
5 G-241F 5.3 27.18 81.2 295.2 5.9M 3.7 34.29 87.7 361.9 6.7
6 G-185F 4.1 35.05 86.8 397.2 4.1M 5.4 29.21 85.5 335.4 8.3
7 G-237F 4.3 34.29 88.0 360.9 6.8M 5.4 27.94 85.9 281.5 8.1
8 G-24F 4.3 34.29 88.0 360.9 6.8M 3.8 34.04 88.0 324.6 8.0
9 G-26F 4.3 34.29 88.0 360.9 6.8M 5.5 31.50 86.5 296.2 8.3
10 G-94F 4.0 36.07 87.7 412.9 5.1M 4.4 32.00 86.1 284.4 8.1
11 G-95F 4.0 36.07 87.7 412.9 5.1M 4.6 33.53 87.2 278.5 8.0
12 G-100F 5.3 32.51 88.2 362.9 6.2M 4.4 32.00 86.1 284.4 8.1
13 G-101F 5.3 32.51 88.2 362.9 6.2M 4.6 33.53 87.2 278.5 8.0
14 G-232F 3.5 28.96 86.6 318.7 9.1M 4.6 33.53 87.2 278.5 8.0
15 G-83F 3.6 34.54 86.6 298.1 8.1M 4.5 34.29 86.3 369.7 4.1
4KELLY ET AL.: AFIS AND HVI SELECTION USE IN COTTON BREEDING
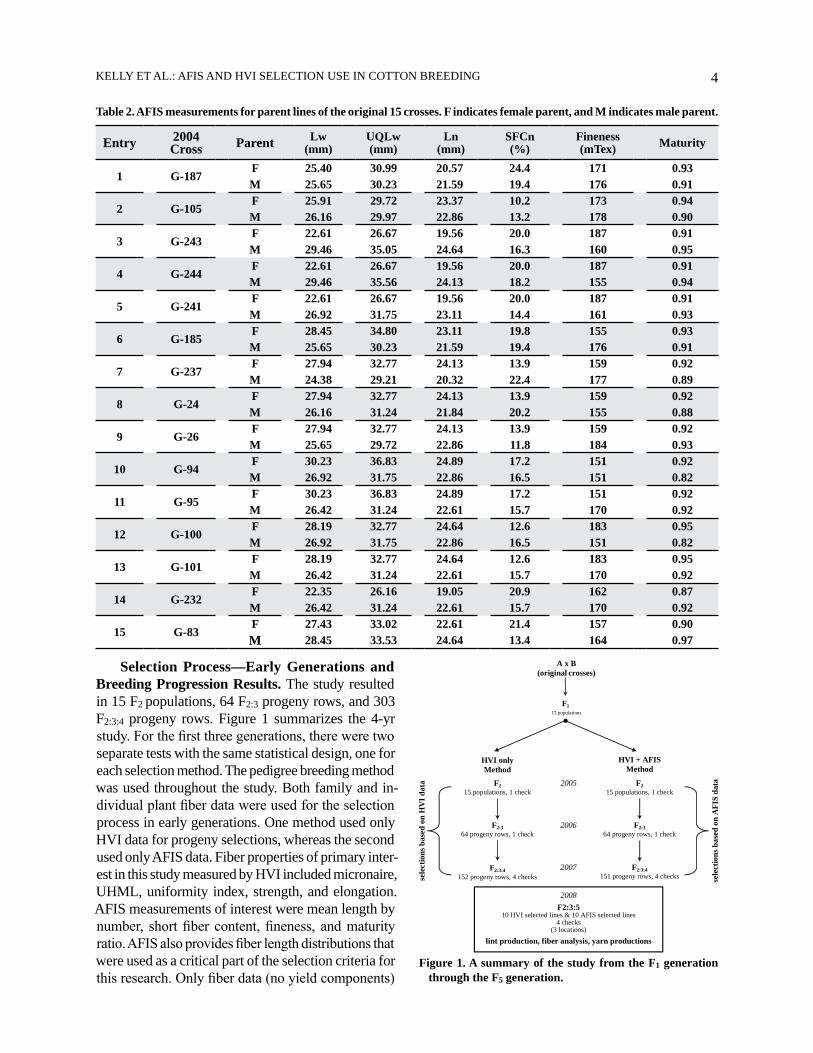
Selection Process—Early Generations and Breeding Progression Results. The study resulted in 15 F2 populations, 64 F2:3 progeny rows, and 303 F2:3:4 progeny rows. Figure 1 summarizes the 4-yr study. For the first three generations, there were two separate tests with the same statistical design, one for each selection method. The pedigree breeding method was used throughout the study. Both family and in-dividual plant fiber data were used for the selection process in early generations. One method used only HVI data for progeny selections, whereas the second used only AFIS data. Fiber properties of primary inter-est in this study measured by HVI included micronaire, UHML, uniformity index, strength, and elongation. AFIS measurements of interest were mean length by number, short fiber content, fineness, and maturity ratio. AFIS also provides fiber length distributions that were used as a critical part of the selection criteria for this research. Only fiber data (no yield components)
Table 2. AFIS measurements for parent lines of the original 15 crosses. F indicates female parent, and M indicates male parent.
Entry 2004Cross Parent Lw
(mm) UQLw
(mm) Ln
(mm) SFCn
(%) Fineness
(mTex)
Maturity
1 G-187F 25.40 30.99 20.57 24.4 171 0.93M 25.65 30.23 21.59 19.4 176 0.91
2 G-105F 25.91 29.72 23.37 10.2 173 0.94M 26.16 29.97 22.86 13.2 178 0.90
3 G-243F 22.61 26.67 19.56 20.0 187 0.91M 29.46 35.05 24.64 16.3 160 0.95
4 G-244F 22.61 26.67 19.56 20.0 187 0.91M 29.46 35.56 24.13 18.2 155 0.94
5 G-241F 22.61 26.67 19.56 20.0 187 0.91M 26.92 31.75 23.11 14.4 161 0.93
6 G-185F 28.45 34.80 23.11 19.8 155 0.93M 25.65 30.23 21.59 19.4 176 0.91
7 G-237F 27.94 32.77 24.13 13.9 159 0.92M 24.38 29.21 20.32 22.4 177 0.89
8 G-24F 27.94 32.77 24.13 13.9 159 0.92M 26.16 31.24 21.84 20.2 155 0.88
9 G-26F 27.94 32.77 24.13 13.9 159 0.92M 25.65 29.72 22.86 11.8 184 0.93
10 G-94F 30.23 36.83 24.89 17.2 151 0.92M 26.92 31.75 22.86 16.5 151 0.82
11 G-95F 30.23 36.83 24.89 17.2 151 0.92M 26.42 31.24 22.61 15.7 170 0.92
12 G-100F 28.19 32.77 24.64 12.6 183 0.95M 26.92 31.75 22.86 16.5 151 0.82
13 G-101F 28.19 32.77 24.64 12.6 183 0.95M 26.42 31.24 22.61 15.7 170 0.92
14 G-232F 22.35 26.16 19.05 20.9 162 0.87M 26.42 31.24 22.61 15.7 170 0.92
15 G-83F 27.43 33.02 22.61 21.4 157 0.90
M 28.45 33.53 24.64 13.4 164 0.97
Figure 1. A summary of the study from the F1 generation through the F5 generation.
A x B(original crosses)
F115 populations
2005
2007
2006
2008
F215 populations, 1 check
F2:3:4152 progeny rows, 4 checks
HVI onlyMethod
F2:364 progeny rows, 1 check
F2:364 progeny rows, 1 check
HVI + AFISMethod
F215 populations, 1 check
F2:3:4151 progeny rows, 4 checks
F2:3:510 HVI selected lines & 10 AFIS selected lines
4 checks(3 locations)
lint production, fiber analysis, yarn productions
sele
ctio
ns b
ased
on
HV
I dat
a
sele
ctio
ns b
ased
on
AFI
S da
ta
5JOURNAL OF COTTON SCIENCE, Volume 16, Issue 1, 2012
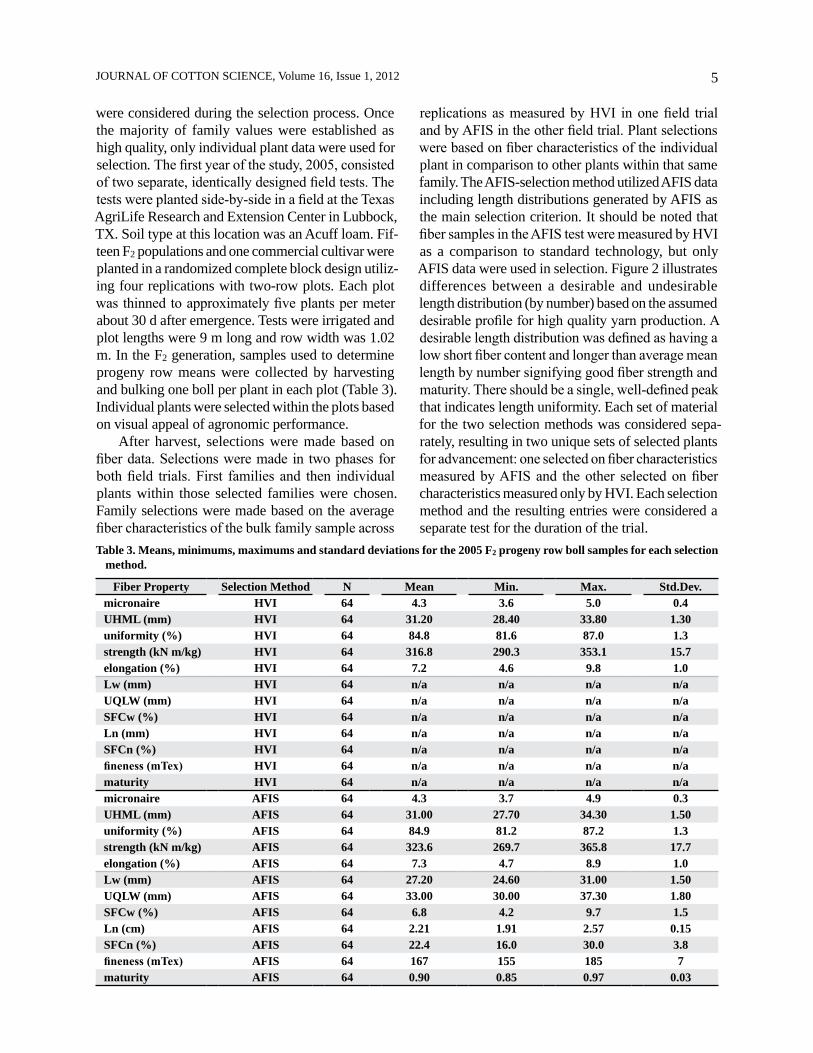
were considered during the selection process. Once the majority of family values were established as high quality, only individual plant data were used for selection. The first year of the study, 2005, consisted of two separate, identically designed field tests. The tests were planted side-by-side in a field at the Texas AgriLife Research and Extension Center in Lubbock, TX. Soil type at this location was an Acuff loam. Fif-teen F2 populations and one commercial cultivar were planted in a randomized complete block design utiliz-ing four replications with two-row plots. Each plot was thinned to approximately five plants per meter about 30 d after emergence. Tests were irrigated and plot lengths were 9 m long and row width was 1.02 m. In the F2 generation, samples used to determine progeny row means were collected by harvesting and bulking one boll per plant in each plot (Table 3). Individual plants were selected within the plots based on visual appeal of agronomic performance.
After harvest, selections were made based on fiber data. Selections were made in two phases for both field trials. First families and then individual plants within those selected families were chosen. Family selections were made based on the average fiber characteristics of the bulk family sample across
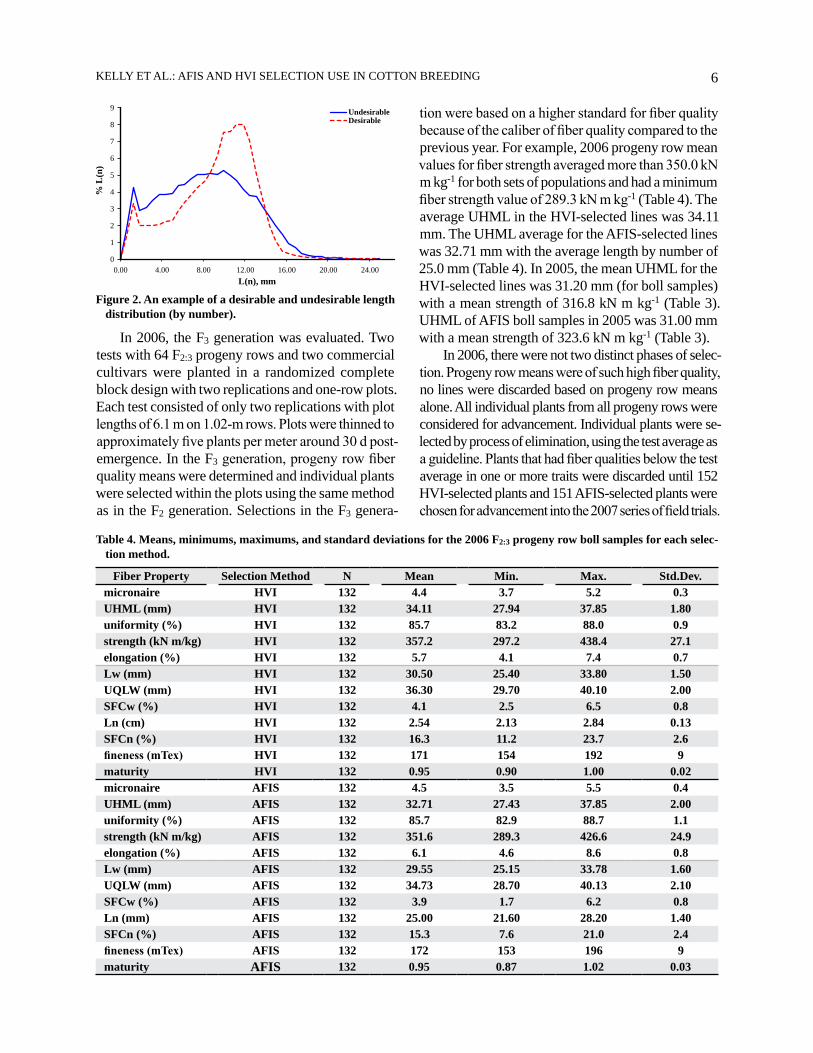
replications as measured by HVI in one field trial and by AFIS in the other field trial. Plant selections were based on fiber characteristics of the individual plant in comparison to other plants within that same family. The AFIS-selection method utilized AFIS data including length distributions generated by AFIS as the main selection criterion. It should be noted that fiber samples in the AFIS test were measured by HVI as a comparison to standard technology, but only AFIS data were used in selection. Figure 2 illustrates differences between a desirable and undesirable length distribution (by number) based on the assumed desirable profile for high quality yarn production. A desirable length distribution was defined as having a low short fiber content and longer than average mean length by number signifying good fiber strength and maturity. There should be a single, well-defined peak that indicates length uniformity. Each set of material for the two selection methods was considered sepa-rately, resulting in two unique sets of selected plants for advancement: one selected on fiber characteristics measured by AFIS and the other selected on fiber characteristics measured only by HVI. Each selection method and the resulting entries were considered a separate test for the duration of the trial.
Table 3. Means, minimums, maximums and standard deviations for the 2005 F2 progeny row boll samples for each selection method.
Fiber Property Selection Method N Mean Min. Max. Std.Dev.micronaire HVI 64 4.3 3.6 5.0 0.4UHML (mm) HVI 64 31.20 28.40 33.80 1.30uniformity (%) HVI 64 84.8 81.6 87.0 1.3strength (kN m/kg) HVI 64 316.8 290.3 353.1 15.7elongation (%) HVI 64 7.2 4.6 9.8 1.0Lw (mm) HVI 64 n/a n/a n/a n/aUQLW (mm) HVI 64 n/a n/a n/a n/aSFCw (%) HVI 64 n/a n/a n/a n/aLn (mm) HVI 64 n/a n/a n/a n/aSFCn (%) HVI 64 n/a n/a n/a n/afineness (mTex) HVI 64 n/a n/a n/a n/amaturity HVI 64 n/a n/a n/a n/amicronaire AFIS 64 4.3 3.7 4.9 0.3UHML (mm) AFIS 64 31.00 27.70 34.30 1.50uniformity (%) AFIS 64 84.9 81.2 87.2 1.3strength (kN m/kg) AFIS 64 323.6 269.7 365.8 17.7elongation (%) AFIS 64 7.3 4.7 8.9 1.0Lw (mm) AFIS 64 27.20 24.60 31.00 1.50UQLW (mm) AFIS 64 33.00 30.00 37.30 1.80SFCw (%) AFIS 64 6.8 4.2 9.7 1.5Ln (cm) AFIS 64 2.21 1.91 2.57 0.15SFCn (%) AFIS 64 22.4 16.0 30.0 3.8fineness (mTex) AFIS 64 167 155 185 7maturity AFIS 64 0.90 0.85 0.97 0.03
6KELLY ET AL.: AFIS AND HVI SELECTION USE IN COTTON BREEDING
In 2006, the F3 generation was evaluated. Two tests with 64 F2:3 progeny rows and two commercial cultivars were planted in a randomized complete block design with two replications and one-row plots. Each test consisted of only two replications with plot lengths of 6.1 m on 1.02-m rows. Plots were thinned to approximately five plants per meter around 30 d post-emergence. In the F3 generation, progeny row fiber quality means were determined and individual plants were selected within the plots using the same method as in the F2 generation. Selections in the F3 genera-
tion were based on a higher standard for fiber quality because of the caliber of fiber quality compared to the previous year. For example, 2006 progeny row mean values for fiber strength averaged more than 350.0 kN m kg-1 for both sets of populations and had a minimum fiber strength value of 289.3 kN m kg-1 (Table 4). The average UHML in the HVI-selected lines was 34.11 mm. The UHML average for the AFIS-selected lines was 32.71 mm with the average length by number of 25.0 mm (Table 4). In 2005, the mean UHML for the HVI-selected lines was 31.20 mm (for boll samples) with a mean strength of 316.8 kN m kg-1 (Table 3). UHML of AFIS boll samples in 2005 was 31.00 mm with a mean strength of 323.6 kN m kg-1 (Table 3).
In 2006, there were not two distinct phases of selec-tion. Progeny row means were of such high fiber quality, no lines were discarded based on progeny row means alone. All individual plants from all progeny rows were considered for advancement. Individual plants were se-lected by process of elimination, using the test average as a guideline. Plants that had fiber qualities below the test average in one or more traits were discarded until 152 HVI-selected plants and 151 AFIS-selected plants were chosen for advancement into the 2007 series of field trials.
0
1
2
3
4
5
6
7
8
9
0.00 4.00 8.00 12.00 16.00 20.00 24.00
% L
(n)
L(n), mm
UndesirableDesirable
Figure 2. An example of a desirable and undesirable length distribution (by number).
Table 4. Means, minimums, maximums, and standard deviations for the 2006 F2:3 progeny row boll samples for each selec-tion method.
Fiber Property Selection Method N Mean Min. Max. Std.Dev.micronaire HVI 132 4.4 3.7 5.2 0.3UHML (mm) HVI 132 34.11 27.94 37.85 1.80uniformity (%) HVI 132 85.7 83.2 88.0 0.9strength (kN m/kg) HVI 132 357.2 297.2 438.4 27.1elongation (%) HVI 132 5.7 4.1 7.4 0.7Lw (mm) HVI 132 30.50 25.40 33.80 1.50UQLW (mm) HVI 132 36.30 29.70 40.10 2.00SFCw (%) HVI 132 4.1 2.5 6.5 0.8Ln (cm) HVI 132 2.54 2.13 2.84 0.13SFCn (%) HVI 132 16.3 11.2 23.7 2.6fineness (mTex) HVI 132 171 154 192 9maturity HVI 132 0.95 0.90 1.00 0.02micronaire AFIS 132 4.5 3.5 5.5 0.4UHML (mm) AFIS 132 32.71 27.43 37.85 2.00uniformity (%) AFIS 132 85.7 82.9 88.7 1.1strength (kN m/kg) AFIS 132 351.6 289.3 426.6 24.9elongation (%) AFIS 132 6.1 4.6 8.6 0.8Lw (mm) AFIS 132 29.55 25.15 33.78 1.60UQLW (mm) AFIS 132 34.73 28.70 40.13 2.10SFCw (%) AFIS 132 3.9 1.7 6.2 0.8Ln (mm) AFIS 132 25.00 21.60 28.20 1.40SFCn (%) AFIS 132 15.3 7.6 21.0 2.4fineness (mTex) AFIS 132 172 153 196 9maturity AFIS 132 0.95 0.87 1.02 0.03
7JOURNAL OF COTTON SCIENCE, Volume 16, Issue 1, 2012
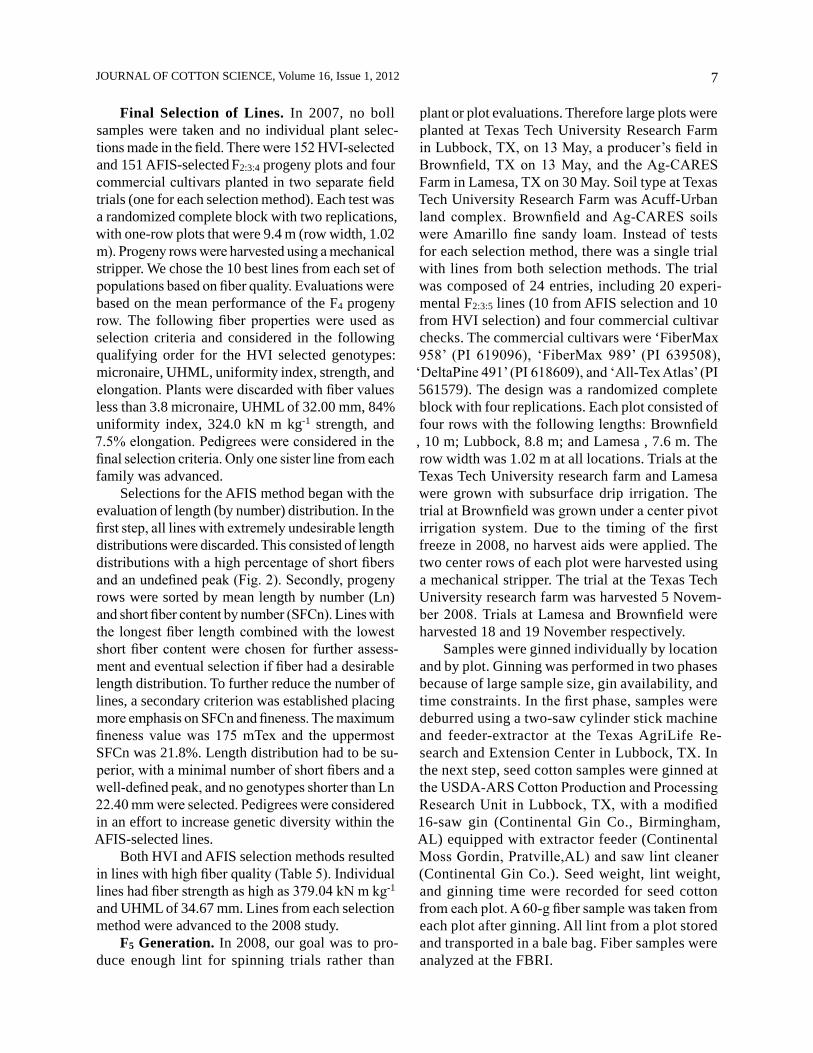
Final Selection of Lines. In 2007, no boll samples were taken and no individual plant selec-tions made in the field. There were 152 HVI-selected and 151 AFIS-selected F2:3:4 progeny plots and four commercial cultivars planted in two separate field trials (one for each selection method). Each test was a randomized complete block with two replications, with one-row plots that were 9.4 m (row width, 1.02 m). Progeny rows were harvested using a mechanical stripper. We chose the 10 best lines from each set of populations based on fiber quality. Evaluations were based on the mean performance of the F4 progeny row. The following fiber properties were used as selection criteria and considered in the following qualifying order for the HVI selected genotypes: micronaire, UHML, uniformity index, strength, and elongation. Plants were discarded with fiber values less than 3.8 micronaire, UHML of 32.00 mm, 84% uniformity index, 324.0 kN m kg-1 strength, and 7.5% elongation. Pedigrees were considered in the final selection criteria. Only one sister line from each family was advanced.
Selections for the AFIS method began with the evaluation of length (by number) distribution. In the first step, all lines with extremely undesirable length distributions were discarded. This consisted of length distributions with a high percentage of short fibers and an undefined peak (Fig. 2). Secondly, progeny rows were sorted by mean length by number (Ln) and short fiber content by number (SFCn). Lines with the longest fiber length combined with the lowest short fiber content were chosen for further assess-ment and eventual selection if fiber had a desirable length distribution. To further reduce the number of lines, a secondary criterion was established placing more emphasis on SFCn and fineness. The maximum fineness value was 175 mTex and the uppermost SFCn was 21.8%. Length distribution had to be su-perior, with a minimal number of short fibers and a well-defined peak, and no genotypes shorter than Ln 22.40 mm were selected. Pedigrees were considered in an effort to increase genetic diversity within the AFIS-selected lines.
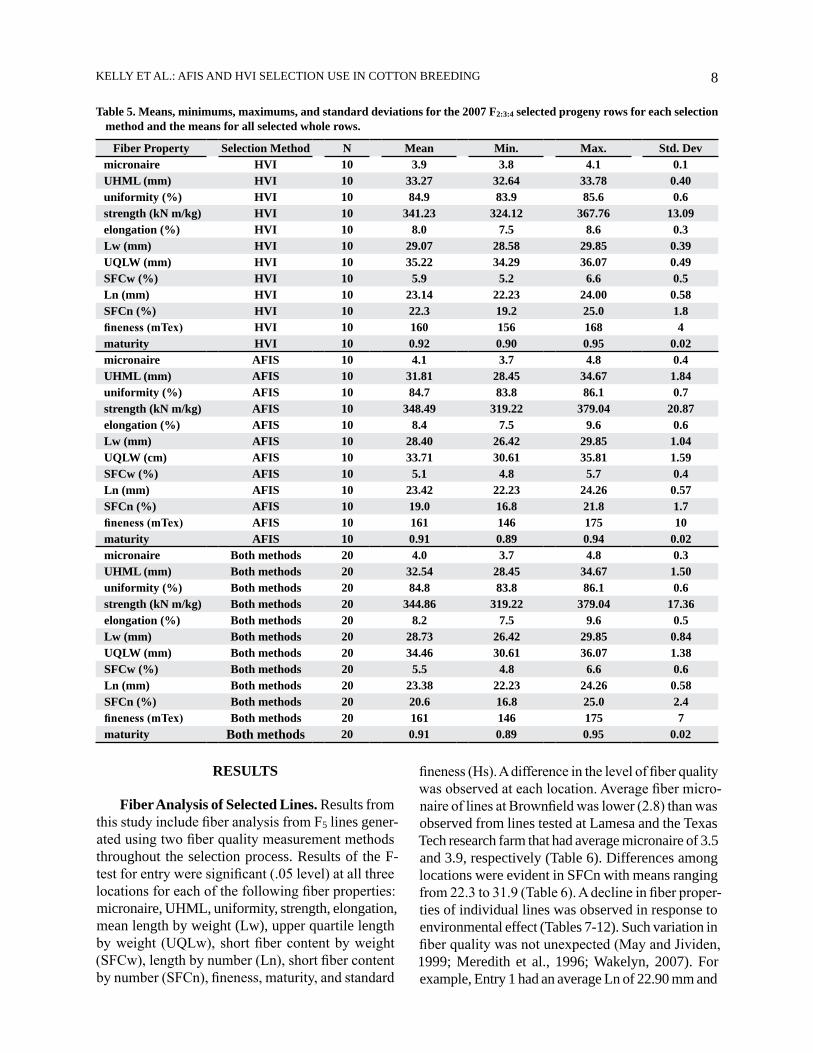
Both HVI and AFIS selection methods resulted in lines with high fiber quality (Table 5). Individual lines had fiber strength as high as 379.04 kN m kg-1 and UHML of 34.67 mm. Lines from each selection method were advanced to the 2008 study.
F5 Generation. In 2008, our goal was to pro-duce enough lint for spinning trials rather than
plant or plot evaluations. Therefore large plots were planted at Texas Tech University Research Farm in Lubbock, TX, on 13 May, a producer’s field in Brownfield, TX on 13 May, and the Ag-CARES Farm in Lamesa, TX on 30 May. Soil type at Texas Tech University Research Farm was Acuff-Urban land complex. Brownfield and Ag-CARES soils were Amarillo fine sandy loam. Instead of tests for each selection method, there was a single trial with lines from both selection methods. The trial was composed of 24 entries, including 20 experi-mental F2:3:5 lines (10 from AFIS selection and 10 from HVI selection) and four commercial cultivar checks. The commercial cultivars were ‘FiberMax 958’ (PI 619096), ‘FiberMax 989’ (PI 639508), ‘DeltaPine 491’ (PI 618609), and ‘All-Tex Atlas’ (PI 561579). The design was a randomized complete block with four replications. Each plot consisted of four rows with the following lengths: Brownfield , 10 m; Lubbock, 8.8 m; and Lamesa , 7.6 m. The row width was 1.02 m at all locations. Trials at the Texas Tech University research farm and Lamesa were grown with subsurface drip irrigation. The trial at Brownfield was grown under a center pivot irrigation system. Due to the timing of the first freeze in 2008, no harvest aids were applied. The two center rows of each plot were harvested using a mechanical stripper. The trial at the Texas Tech University research farm was harvested 5 Novem-ber 2008. Trials at Lamesa and Brownfield were harvested 18 and 19 November respectively.
Samples were ginned individually by location and by plot. Ginning was performed in two phases because of large sample size, gin availability, and time constraints. In the first phase, samples were deburred using a two-saw cylinder stick machine and feeder-extractor at the Texas AgriLife Re-search and Extension Center in Lubbock, TX. In the next step, seed cotton samples were ginned at the USDA-ARS Cotton Production and Processing Research Unit in Lubbock, TX, with a modified 16-saw gin (Continental Gin Co., Birmingham, AL) equipped with extractor feeder (Continental Moss Gordin, Pratville,AL) and saw lint cleaner (Continental Gin Co.). Seed weight, lint weight, and ginning time were recorded for seed cotton from each plot. A 60-g fiber sample was taken from each plot after ginning. All lint from a plot stored and transported in a bale bag. Fiber samples were analyzed at the FBRI.
8KELLY ET AL.: AFIS AND HVI SELECTION USE IN COTTON BREEDING
RESULTS
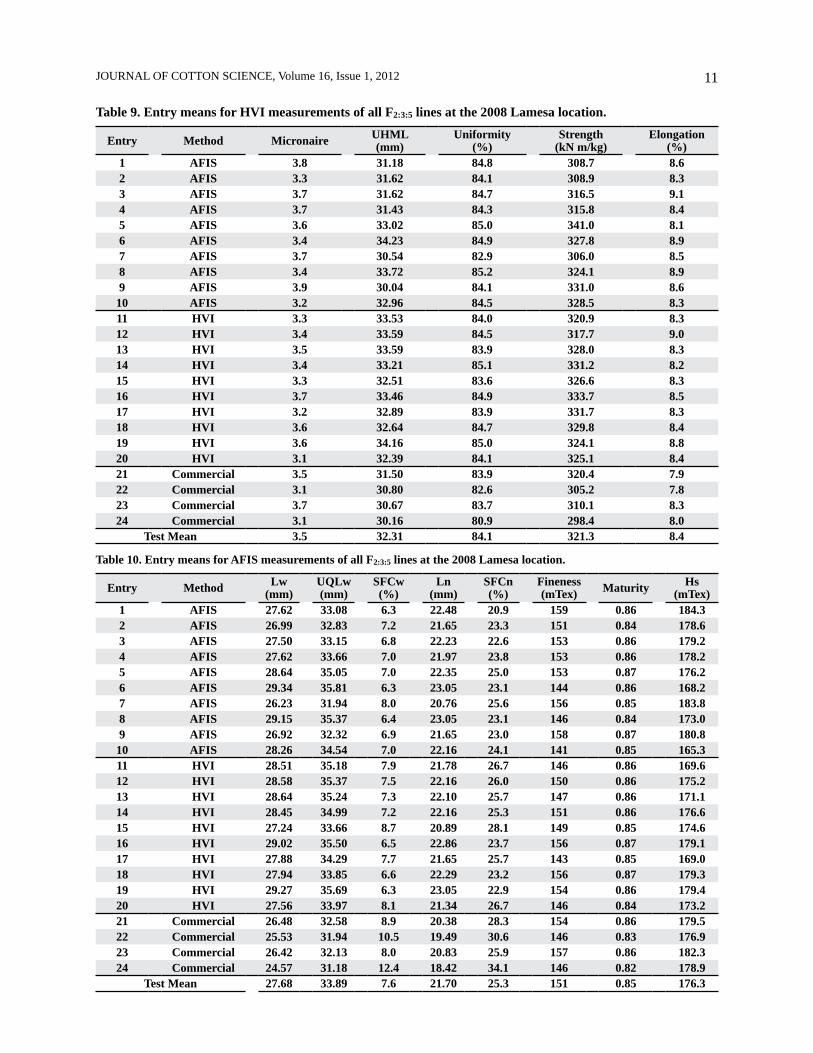
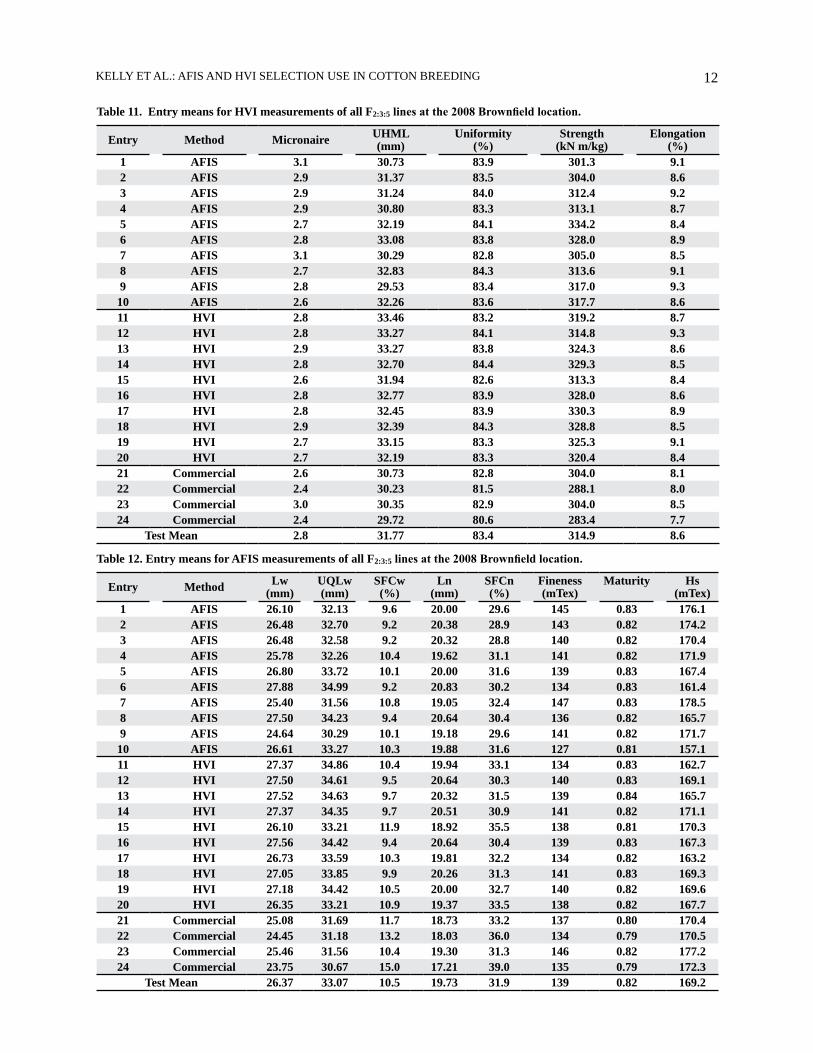
Fiber Analysis of Selected Lines. Results from this study include fiber analysis from F5 lines gener-ated using two fiber quality measurement methods throughout the selection process. Results of the F-test for entry were significant (.05 level) at all three locations for each of the following fiber properties: micronaire, UHML, uniformity, strength, elongation, mean length by weight (Lw), upper quartile length by weight (UQLw), short fiber content by weight (SFCw), length by number (Ln), short fiber content by number (SFCn), fineness, maturity, and standard
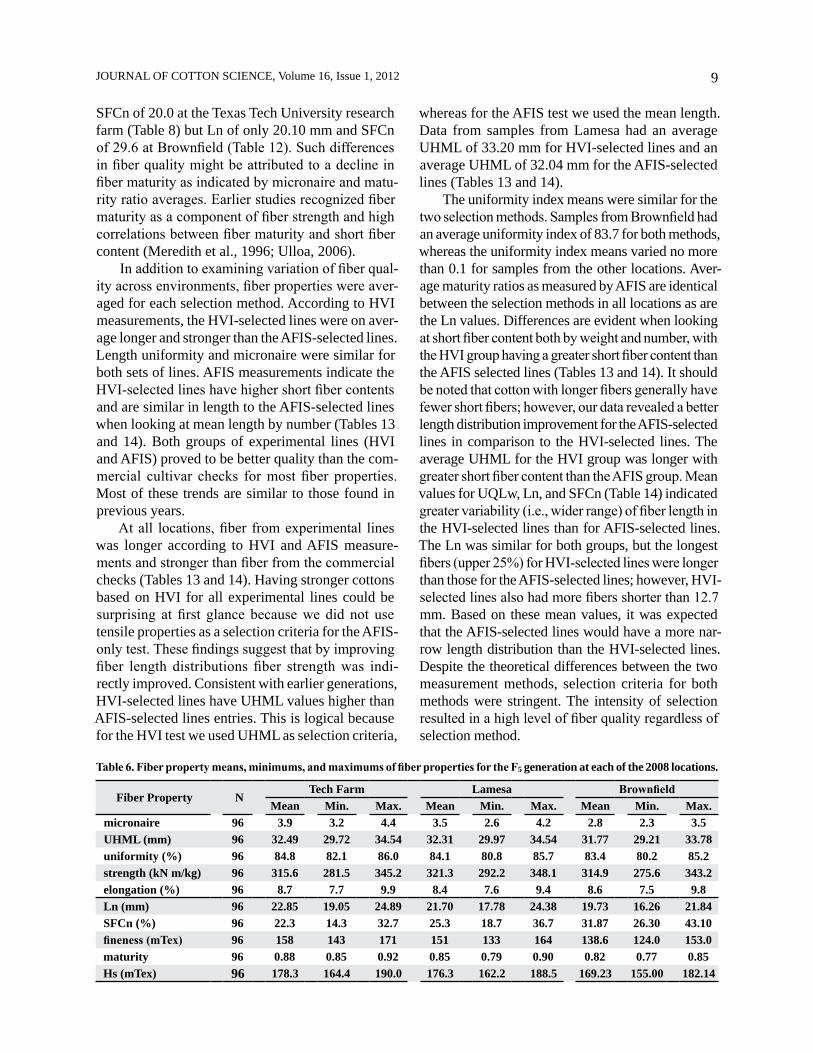
fineness (Hs). A difference in the level of fiber quality was observed at each location. Average fiber micro-naire of lines at Brownfield was lower (2.8) than was observed from lines tested at Lamesa and the Texas Tech research farm that had average micronaire of 3.5 and 3.9, respectively (Table 6). Differences among locations were evident in SFCn with means ranging from 22.3 to 31.9 (Table 6). A decline in fiber proper-ties of individual lines was observed in response to environmental effect (Tables 7-12). Such variation in fiber quality was not unexpected (May and Jividen, 1999; Meredith et al., 1996; Wakelyn, 2007). For example, Entry 1 had an average Ln of 22.90 mm and
Table 5. Means, minimums, maximums, and standard deviations for the 2007 F2:3:4 selected progeny rows for each selection method and the means for all selected whole rows.
Fiber Property Selection Method N Mean Min. Max. Std. Devmicronaire HVI 10 3.9 3.8 4.1 0.1UHML (mm) HVI 10 33.27 32.64 33.78 0.40uniformity (%) HVI 10 84.9 83.9 85.6 0.6strength (kN m/kg) HVI 10 341.23 324.12 367.76 13.09elongation (%) HVI 10 8.0 7.5 8.6 0.3Lw (mm) HVI 10 29.07 28.58 29.85 0.39UQLW (mm) HVI 10 35.22 34.29 36.07 0.49SFCw (%) HVI 10 5.9 5.2 6.6 0.5Ln (mm) HVI 10 23.14 22.23 24.00 0.58SFCn (%) HVI 10 22.3 19.2 25.0 1.8fineness (mTex) HVI 10 160 156 168 4maturity HVI 10 0.92 0.90 0.95 0.02micronaire AFIS 10 4.1 3.7 4.8 0.4UHML (mm) AFIS 10 31.81 28.45 34.67 1.84uniformity (%) AFIS 10 84.7 83.8 86.1 0.7strength (kN m/kg) AFIS 10 348.49 319.22 379.04 20.87elongation (%) AFIS 10 8.4 7.5 9.6 0.6Lw (mm) AFIS 10 28.40 26.42 29.85 1.04UQLW (cm) AFIS 10 33.71 30.61 35.81 1.59SFCw (%) AFIS 10 5.1 4.8 5.7 0.4Ln (mm) AFIS 10 23.42 22.23 24.26 0.57SFCn (%) AFIS 10 19.0 16.8 21.8 1.7fineness (mTex) AFIS 10 161 146 175 10maturity AFIS 10 0.91 0.89 0.94 0.02micronaire Both methods 20 4.0 3.7 4.8 0.3UHML (mm) Both methods 20 32.54 28.45 34.67 1.50uniformity (%) Both methods 20 84.8 83.8 86.1 0.6strength (kN m/kg) Both methods 20 344.86 319.22 379.04 17.36elongation (%) Both methods 20 8.2 7.5 9.6 0.5Lw (mm) Both methods 20 28.73 26.42 29.85 0.84UQLW (mm) Both methods 20 34.46 30.61 36.07 1.38SFCw (%) Both methods 20 5.5 4.8 6.6 0.6Ln (mm) Both methods 20 23.38 22.23 24.26 0.58SFCn (%) Both methods 20 20.6 16.8 25.0 2.4fineness (mTex) Both methods 20 161 146 175 7maturity Both methods 20 0.91 0.89 0.95 0.02
9JOURNAL OF COTTON SCIENCE, Volume 16, Issue 1, 2012
Table 6. Fiber property means, minimums, and maximums of fiber properties for the F5 generation at each of the 2008 locations.
Fiber Property N Tech Farm Lamesa Brownfield
Mean Min. Max. Mean Min. Max. Mean Min. Max.micronaire 96 3.9 3.2 4.4 3.5 2.6 4.2 2.8 2.3 3.5UHML (mm) 96 32.49 29.72 34.54 32.31 29.97 34.54 31.77 29.21 33.78uniformity (%) 96 84.8 82.1 86.0 84.1 80.8 85.7 83.4 80.2 85.2strength (kN m/kg) 96 315.6 281.5 345.2 321.3 292.2 348.1 314.9 275.6 343.2elongation (%) 96 8.7 7.7 9.9 8.4 7.6 9.4 8.6 7.5 9.8Ln (mm) 96 22.85 19.05 24.89 21.70 17.78 24.38 19.73 16.26 21.84SFCn (%) 96 22.3 14.3 32.7 25.3 18.7 36.7 31.87 26.30 43.10fineness (mTex) 96 158 143 171 151 133 164 138.6 124.0 153.0maturity 96 0.88 0.85 0.92 0.85 0.79 0.90 0.82 0.77 0.85Hs (mTex) 96 178.3 164.4 190.0 176.3 162.2 188.5 169.23 155.00 182.14
SFCn of 20.0 at the Texas Tech University research farm (Table 8) but Ln of only 20.10 mm and SFCn of 29.6 at Brownfield (Table 12). Such differences in fiber quality might be attributed to a decline in fiber maturity as indicated by micronaire and matu-rity ratio averages. Earlier studies recognized fiber maturity as a component of fiber strength and high correlations between fiber maturity and short fiber content (Meredith et al., 1996; Ulloa, 2006).
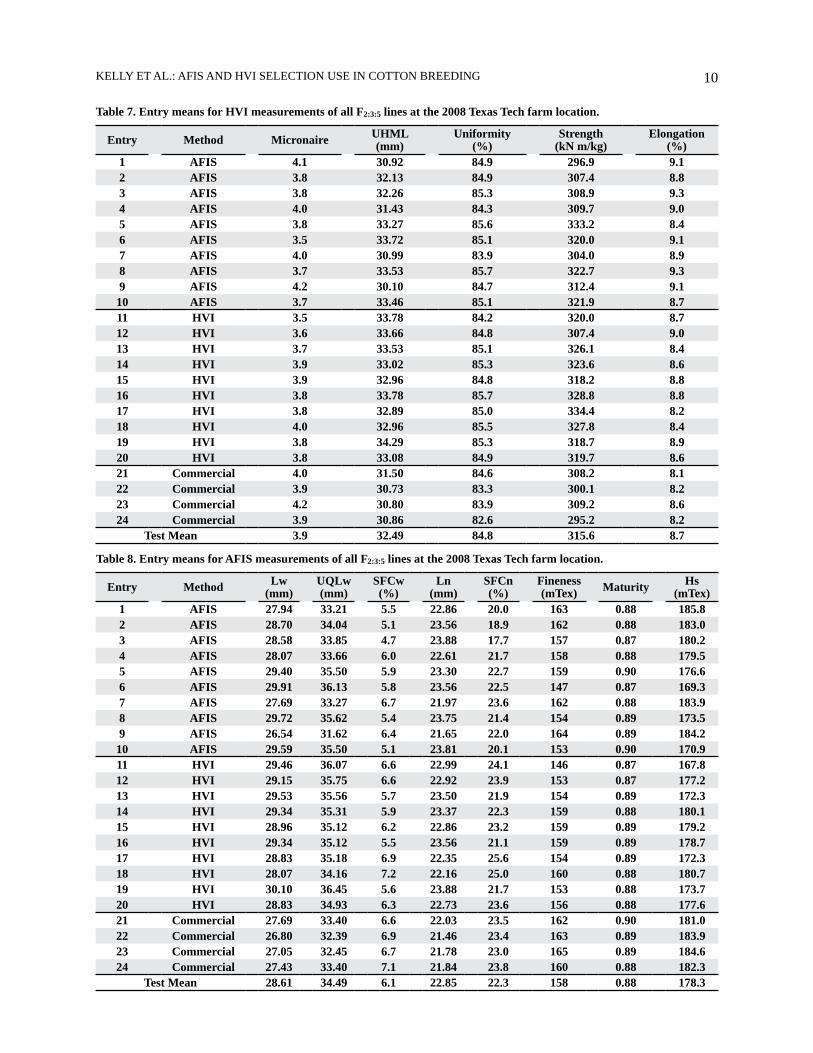
In addition to examining variation of fiber qual-ity across environments, fiber properties were aver-aged for each selection method. According to HVI measurements, the HVI-selected lines were on aver-age longer and stronger than the AFIS-selected lines. Length uniformity and micronaire were similar for both sets of lines. AFIS measurements indicate the HVI-selected lines have higher short fiber contents and are similar in length to the AFIS-selected lines when looking at mean length by number (Tables 13 and 14). Both groups of experimental lines (HVI and AFIS) proved to be better quality than the com-mercial cultivar checks for most fiber properties. Most of these trends are similar to those found in previous years.
At all locations, fiber from experimental lines was longer according to HVI and AFIS measure-ments and stronger than fiber from the commercial checks (Tables 13 and 14). Having stronger cottons based on HVI for all experimental lines could be surprising at first glance because we did not use tensile properties as a selection criteria for the AFIS-only test. These findings suggest that by improving fiber length distributions fiber strength was indi-rectly improved. Consistent with earlier generations, HVI-selected lines have UHML values higher than AFIS-selected lines entries. This is logical because for the HVI test we used UHML as selection criteria,
whereas for the AFIS test we used the mean length. Data from samples from Lamesa had an average UHML of 33.20 mm for HVI-selected lines and an average UHML of 32.04 mm for the AFIS-selected lines (Tables 13 and 14).
The uniformity index means were similar for the two selection methods. Samples from Brownfield had an average uniformity index of 83.7 for both methods, whereas the uniformity index means varied no more than 0.1 for samples from the other locations. Aver-age maturity ratios as measured by AFIS are identical between the selection methods in all locations as are the Ln values. Differences are evident when looking at short fiber content both by weight and number, with the HVI group having a greater short fiber content than the AFIS selected lines (Tables 13 and 14). It should be noted that cotton with longer fibers generally have fewer short fibers; however, our data revealed a better length distribution improvement for the AFIS-selected lines in comparison to the HVI-selected lines. The average UHML for the HVI group was longer with greater short fiber content than the AFIS group. Mean values for UQLw, Ln, and SFCn (Table 14) indicated greater variability (i.e., wider range) of fiber length in the HVI-selected lines than for AFIS-selected lines. The Ln was similar for both groups, but the longest fibers (upper 25%) for HVI-selected lines were longer than those for the AFIS-selected lines; however, HVI-selected lines also had more fibers shorter than 12.7 mm. Based on these mean values, it was expected that the AFIS-selected lines would have a more nar-row length distribution than the HVI-selected lines. Despite the theoretical differences between the two measurement methods, selection criteria for both methods were stringent. The intensity of selection resulted in a high level of fiber quality regardless of selection method.
10KELLY ET AL.: AFIS AND HVI SELECTION USE IN COTTON BREEDING
Table 7. Entry means for HVI measurements of all F2:3:5 lines at the 2008 Texas Tech farm location.
Entry Method Micronaire UHML(mm)
Uniformity(%)
Strength(kN m/kg)
Elongation(%)
1 AFIS 4.1 30.92 84.9 296.9 9.12 AFIS 3.8 32.13 84.9 307.4 8.83 AFIS 3.8 32.26 85.3 308.9 9.34 AFIS 4.0 31.43 84.3 309.7 9.05 AFIS 3.8 33.27 85.6 333.2 8.46 AFIS 3.5 33.72 85.1 320.0 9.17 AFIS 4.0 30.99 83.9 304.0 8.98 AFIS 3.7 33.53 85.7 322.7 9.39 AFIS 4.2 30.10 84.7 312.4 9.110 AFIS 3.7 33.46 85.1 321.9 8.711 HVI 3.5 33.78 84.2 320.0 8.712 HVI 3.6 33.66 84.8 307.4 9.013 HVI 3.7 33.53 85.1 326.1 8.414 HVI 3.9 33.02 85.3 323.6 8.615 HVI 3.9 32.96 84.8 318.2 8.816 HVI 3.8 33.78 85.7 328.8 8.817 HVI 3.8 32.89 85.0 334.4 8.218 HVI 4.0 32.96 85.5 327.8 8.419 HVI 3.8 34.29 85.3 318.7 8.920 HVI 3.8 33.08 84.9 319.7 8.621 Commercial 4.0 31.50 84.6 308.2 8.122 Commercial 3.9 30.73 83.3 300.1 8.223 Commercial 4.2 30.80 83.9 309.2 8.624 Commercial 3.9 30.86 82.6 295.2 8.2
Test Mean 3.9 32.49 84.8 315.6 8.7
Table 8. Entry means for AFIS measurements of all F2:3:5 lines at the 2008 Texas Tech farm location.
Entry Method Lw(mm) UQLw
(mm) SFCw(%) Ln
(mm) SFCn(%) Fineness
(mTex) Maturity Hs(mTex)
1 AFIS 27.94 33.21 5.5 22.86 20.0 163 0.88 185.82 AFIS 28.70 34.04 5.1 23.56 18.9 162 0.88 183.03 AFIS 28.58 33.85 4.7 23.88 17.7 157 0.87 180.24 AFIS 28.07 33.66 6.0 22.61 21.7 158 0.88 179.55 AFIS 29.40 35.50 5.9 23.30 22.7 159 0.90 176.66 AFIS 29.91 36.13 5.8 23.56 22.5 147 0.87 169.37 AFIS 27.69 33.27 6.7 21.97 23.6 162 0.88 183.98 AFIS 29.72 35.62 5.4 23.75 21.4 154 0.89 173.59 AFIS 26.54 31.62 6.4 21.65 22.0 164 0.89 184.210 AFIS 29.59 35.50 5.1 23.81 20.1 153 0.90 170.911 HVI 29.46 36.07 6.6 22.99 24.1 146 0.87 167.812 HVI 29.15 35.75 6.6 22.92 23.9 153 0.87 177.213 HVI 29.53 35.56 5.7 23.50 21.9 154 0.89 172.314 HVI 29.34 35.31 5.9 23.37 22.3 159 0.88 180.115 HVI 28.96 35.12 6.2 22.86 23.2 159 0.89 179.216 HVI 29.34 35.12 5.5 23.56 21.1 159 0.89 178.717 HVI 28.83 35.18 6.9 22.35 25.6 154 0.89 172.318 HVI 28.07 34.16 7.2 22.16 25.0 160 0.88 180.719 HVI 30.10 36.45 5.6 23.88 21.7 153 0.88 173.720 HVI 28.83 34.93 6.3 22.73 23.6 156 0.88 177.621 Commercial 27.69 33.40 6.6 22.03 23.5 162 0.90 181.022 Commercial 26.80 32.39 6.9 21.46 23.4 163 0.89 183.923 Commercial 27.05 32.45 6.7 21.78 23.0 165 0.89 184.624 Commercial 27.43 33.40 7.1 21.84 23.8 160 0.88 182.3
Test Mean 28.61 34.49 6.1 22.85 22.3 158 0.88 178.3
11JOURNAL OF COTTON SCIENCE, Volume 16, Issue 1, 2012
Table 9. Entry means for HVI measurements of all F2:3:5 lines at the 2008 Lamesa location.
Entry Method Micronaire UHML(mm)
Uniformity(%)
Strength(kN m/kg)
Elongation(%)
1 AFIS 3.8 31.18 84.8 308.7 8.62 AFIS 3.3 31.62 84.1 308.9 8.33 AFIS 3.7 31.62 84.7 316.5 9.14 AFIS 3.7 31.43 84.3 315.8 8.45 AFIS 3.6 33.02 85.0 341.0 8.16 AFIS 3.4 34.23 84.9 327.8 8.97 AFIS 3.7 30.54 82.9 306.0 8.58 AFIS 3.4 33.72 85.2 324.1 8.99 AFIS 3.9 30.04 84.1 331.0 8.6
10 AFIS 3.2 32.96 84.5 328.5 8.311 HVI 3.3 33.53 84.0 320.9 8.312 HVI 3.4 33.59 84.5 317.7 9.013 HVI 3.5 33.59 83.9 328.0 8.314 HVI 3.4 33.21 85.1 331.2 8.215 HVI 3.3 32.51 83.6 326.6 8.316 HVI 3.7 33.46 84.9 333.7 8.517 HVI 3.2 32.89 83.9 331.7 8.318 HVI 3.6 32.64 84.7 329.8 8.419 HVI 3.6 34.16 85.0 324.1 8.820 HVI 3.1 32.39 84.1 325.1 8.421 Commercial 3.5 31.50 83.9 320.4 7.922 Commercial 3.1 30.80 82.6 305.2 7.823 Commercial 3.7 30.67 83.7 310.1 8.324 Commercial 3.1 30.16 80.9 298.4 8.0
Test Mean 3.5 32.31 84.1 321.3 8.4
Table 10. Entry means for AFIS measurements of all F2:3:5 lines at the 2008 Lamesa location.
Entry Method Lw(mm) UQLw
(mm) SFCw(%) Ln
(mm) SFCn(%) Fineness
(mTex) Maturity Hs(mTex)
1 AFIS 27.62 33.08 6.3 22.48 20.9 159 0.86 184.32 AFIS 26.99 32.83 7.2 21.65 23.3 151 0.84 178.63 AFIS 27.50 33.15 6.8 22.23 22.6 153 0.86 179.24 AFIS 27.62 33.66 7.0 21.97 23.8 153 0.86 178.25 AFIS 28.64 35.05 7.0 22.35 25.0 153 0.87 176.26 AFIS 29.34 35.81 6.3 23.05 23.1 144 0.86 168.27 AFIS 26.23 31.94 8.0 20.76 25.6 156 0.85 183.88 AFIS 29.15 35.37 6.4 23.05 23.1 146 0.84 173.09 AFIS 26.92 32.32 6.9 21.65 23.0 158 0.87 180.810 AFIS 28.26 34.54 7.0 22.16 24.1 141 0.85 165.311 HVI 28.51 35.18 7.9 21.78 26.7 146 0.86 169.612 HVI 28.58 35.37 7.5 22.16 26.0 150 0.86 175.213 HVI 28.64 35.24 7.3 22.10 25.7 147 0.86 171.114 HVI 28.45 34.99 7.2 22.16 25.3 151 0.86 176.615 HVI 27.24 33.66 8.7 20.89 28.1 149 0.85 174.616 HVI 29.02 35.50 6.5 22.86 23.7 156 0.87 179.117 HVI 27.88 34.29 7.7 21.65 25.7 143 0.85 169.018 HVI 27.94 33.85 6.6 22.29 23.2 156 0.87 179.319 HVI 29.27 35.69 6.3 23.05 22.9 154 0.86 179.420 HVI 27.56 33.97 8.1 21.34 26.7 146 0.84 173.221 Commercial 26.48 32.58 8.9 20.38 28.3 154 0.86 179.522 Commercial 25.53 31.94 10.5 19.49 30.6 146 0.83 176.923 Commercial 26.42 32.13 8.0 20.83 25.9 157 0.86 182.324 Commercial 24.57 31.18 12.4 18.42 34.1 146 0.82 178.9
Test Mean 27.68 33.89 7.6 21.70 25.3 151 0.85 176.3
12KELLY ET AL.: AFIS AND HVI SELECTION USE IN COTTON BREEDING
Table 11. Entry means for HVI measurements of all F2:3:5 lines at the 2008 Brownfield location.
Entry Method Micronaire UHML(mm)
Uniformity(%)
Strength(kN m/kg)
Elongation(%)
1 AFIS 3.1 30.73 83.9 301.3 9.12 AFIS 2.9 31.37 83.5 304.0 8.63 AFIS 2.9 31.24 84.0 312.4 9.24 AFIS 2.9 30.80 83.3 313.1 8.75 AFIS 2.7 32.19 84.1 334.2 8.46 AFIS 2.8 33.08 83.8 328.0 8.97 AFIS 3.1 30.29 82.8 305.0 8.58 AFIS 2.7 32.83 84.3 313.6 9.19 AFIS 2.8 29.53 83.4 317.0 9.3
10 AFIS 2.6 32.26 83.6 317.7 8.611 HVI 2.8 33.46 83.2 319.2 8.712 HVI 2.8 33.27 84.1 314.8 9.313 HVI 2.9 33.27 83.8 324.3 8.614 HVI 2.8 32.70 84.4 329.3 8.515 HVI 2.6 31.94 82.6 313.3 8.416 HVI 2.8 32.77 83.9 328.0 8.617 HVI 2.8 32.45 83.9 330.3 8.918 HVI 2.9 32.39 84.3 328.8 8.519 HVI 2.7 33.15 83.3 325.3 9.120 HVI 2.7 32.19 83.3 320.4 8.421 Commercial 2.6 30.73 82.8 304.0 8.122 Commercial 2.4 30.23 81.5 288.1 8.023 Commercial 3.0 30.35 82.9 304.0 8.524 Commercial 2.4 29.72 80.6 283.4 7.7
Test Mean 2.8 31.77 83.4 314.9 8.6
Table 12. Entry means for AFIS measurements of all F2:3:5 lines at the 2008 Brownfield location.
Entry Method Lw(mm) UQLw
(mm) SFCw(%) Ln
(mm) SFCn(%) Fineness
(mTex) Maturity Hs(mTex)
1 AFIS 26.10 32.13 9.6 20.00 29.6 145 0.83 176.12 AFIS 26.48 32.70 9.2 20.38 28.9 143 0.82 174.23 AFIS 26.48 32.58 9.2 20.32 28.8 140 0.82 170.44 AFIS 25.78 32.26 10.4 19.62 31.1 141 0.82 171.95 AFIS 26.80 33.72 10.1 20.00 31.6 139 0.83 167.46 AFIS 27.88 34.99 9.2 20.83 30.2 134 0.83 161.47 AFIS 25.40 31.56 10.8 19.05 32.4 147 0.83 178.58 AFIS 27.50 34.23 9.4 20.64 30.4 136 0.82 165.79 AFIS 24.64 30.29 10.1 19.18 29.6 141 0.82 171.710 AFIS 26.61 33.27 10.3 19.88 31.6 127 0.81 157.111 HVI 27.37 34.86 10.4 19.94 33.1 134 0.83 162.712 HVI 27.50 34.61 9.5 20.64 30.3 140 0.83 169.113 HVI 27.52 34.63 9.7 20.32 31.5 139 0.84 165.714 HVI 27.37 34.35 9.7 20.51 30.9 141 0.82 171.115 HVI 26.10 33.21 11.9 18.92 35.5 138 0.81 170.316 HVI 27.56 34.42 9.4 20.64 30.4 139 0.83 167.317 HVI 26.73 33.59 10.3 19.81 32.2 134 0.82 163.218 HVI 27.05 33.85 9.9 20.26 31.3 141 0.83 169.319 HVI 27.18 34.42 10.5 20.00 32.7 140 0.82 169.620 HVI 26.35 33.21 10.9 19.37 33.5 138 0.82 167.721 Commercial 25.08 31.69 11.7 18.73 33.2 137 0.80 170.422 Commercial 24.45 31.18 13.2 18.03 36.0 134 0.79 170.523 Commercial 25.46 31.56 10.4 19.30 31.3 146 0.82 177.224 Commercial 23.75 30.67 15.0 17.21 39.0 135 0.79 172.3
Test Mean 26.37 33.07 10.5 19.73 31.9 139 0.82 169.2
13JOURNAL OF COTTON SCIENCE, Volume 16, Issue 1, 2012
Table 13. Mean values of HVI measurements for each selection method in the F5 generation and commercial varieties at each of the 2008 locations.
Location Method Micronaire UHML(mm) Uniformity
(%) Strength(kN m/kg) Elongation
(%)Brownfield AFIS 2.8 31.43 83.7 314.6 8.8Brownfield HVI 2.8 32.75 83.7 323.4 8.7
Brownfield Commercial 2.6 30.26 81.9 294.9 8.1
Brownfield All 2.8 31.77 83.4 314.9 8.6
Lamesa AFIS 3.6 32.04 84.4 320.8 8.6
Lamesa HVI 3.4 33.20 84.3 326.9 8.4
Lamesa Commercial 3.4 30.78 82.8 308.6 8.0
Lamesa All 3.5 32.31 84.1 321.3 8.4
Texas Tech farm AFIS 3.9 32.18 84.9 313.7 9.0
Texas Tech farm HVI 3.8 33.39 85.0 322.5 8.6
Texas Tech farm Commercial 4.0 30.97 83.6 303.2 8.3
Texas Tech farm All 3.9 32.49 84.8 315.6 8.7
Table 14. Mean values of AFIS measurements for each selection method in the F5 generation and commercial varieties at each of the 2008 locations.
Location Method Lw(mm) UQLw
(mm) SFCw(%) Ln
(mm) SFCn(%) Fineness
(mTex) Maturity Hs(mTex)
Brownfield AFIS 26.37 32.77 9.8 19.99 30.4 139 0.82 169.4Brownfield HVI 27.06 34.10 10.2 20.03 32.1 138 0.82 167.7Brownfield Commercial 24.69 31.27 12.6 18.32 34.9 138 0.80 172.6Brownfield All 26.37 33.07 10.5 19.73 31.9 139 0.82 169.2Lamesa AFIS 27.83 33.78 6.9 22.14 23.4 151 0.86 176.8Lamesa HVI 28.31 34.77 7.4 22.03 25.4 150 0.86 174.8Lamesa Commercial 25.75 31.96 10.0 19.78 29.7 151 0.84 179.5Lamesa All 27.68 33.89 7.6 21.70 25.3 151 0.85 176.4Texas Tech farm AFIS 28.61 34.24 5.7 23.09 21.1 158 0.88 178.7Texas Tech farm HVI 29.16 35.36 6.2 23.03 23.2 155 0.88 175.9Texas Tech farm Commercial 27.24 32.91 6.8 21.78 23.4 162 0.89 183.0Texas Tech farm All 28.61 34.49 6.1 22.85 22.3 158 0.88 178.3
DISCUSSION
A total of 24 lines were selected for spinning tests in 2008. The lines included 20 F5 lines, 10 from each selection method, plus four commercial check cultivars. Based on fiber data from 2005 through 2007, fiber length distributions were modified through breeding. Both selection methods resulted in a reduction of short fiber content and an increase in fiber maturity compared to the checks and lines from earlier generations. Modi-fication in these and other fiber properties was evident in 2008 fiber data including length distribution.
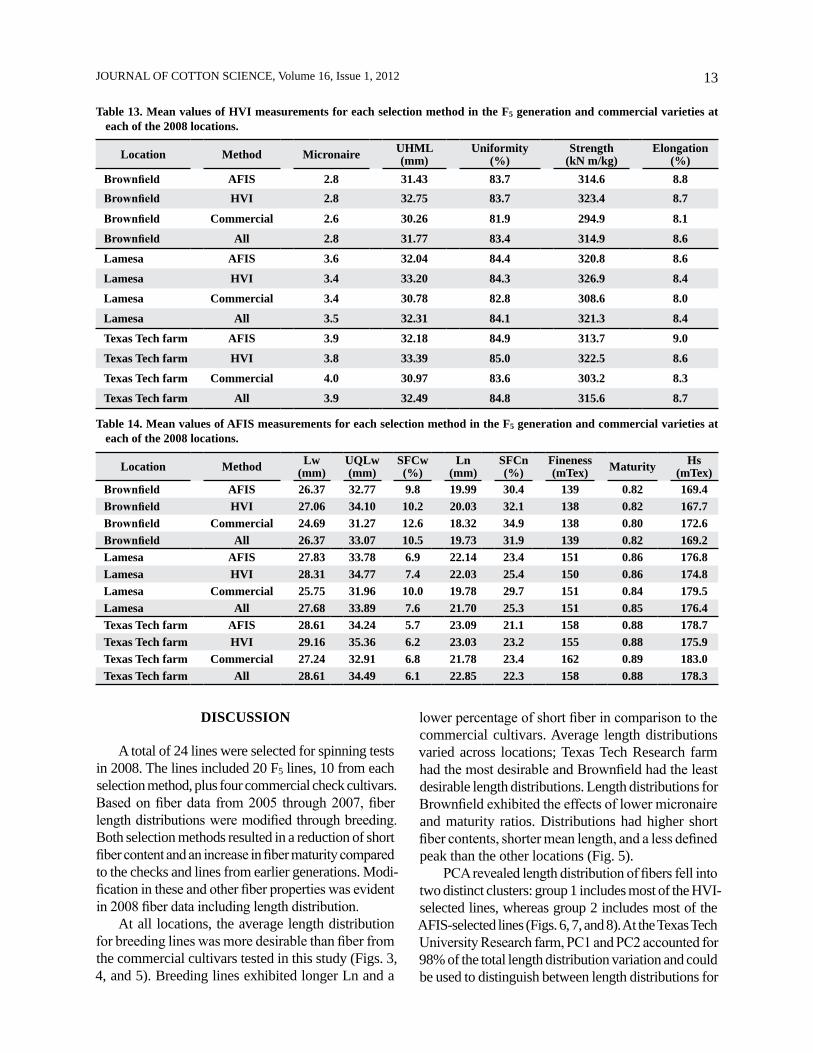
At all locations, the average length distribution for breeding lines was more desirable than fiber from the commercial cultivars tested in this study (Figs. 3, 4, and 5). Breeding lines exhibited longer Ln and a
lower percentage of short fiber in comparison to the commercial cultivars. Average length distributions varied across locations; Texas Tech Research farm had the most desirable and Brownfield had the least desirable length distributions. Length distributions for Brownfield exhibited the effects of lower micronaire and maturity ratios. Distributions had higher short fiber contents, shorter mean length, and a less defined peak than the other locations (Fig. 5).
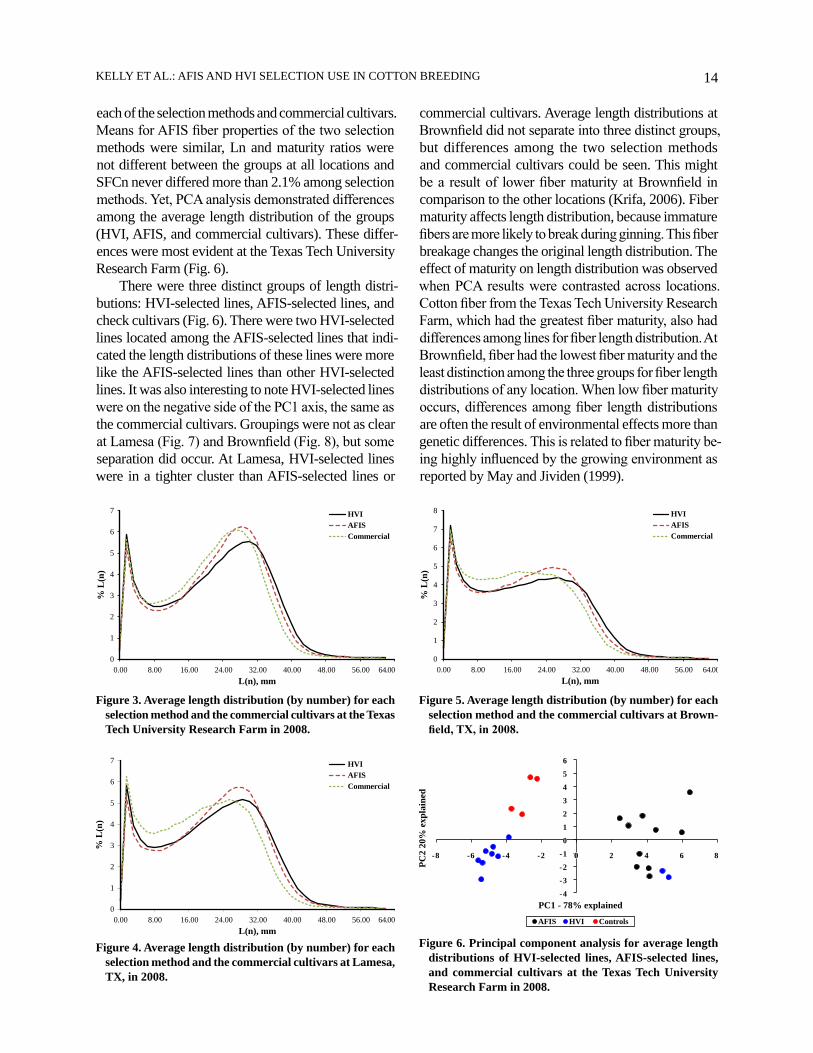
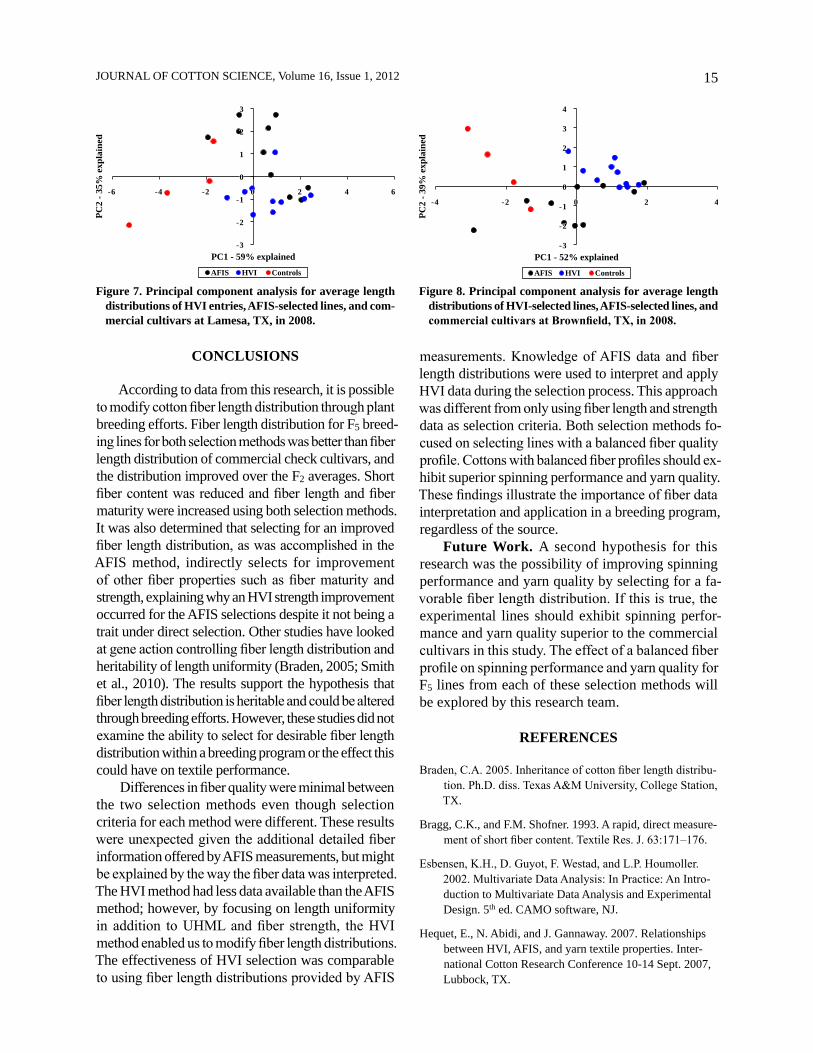
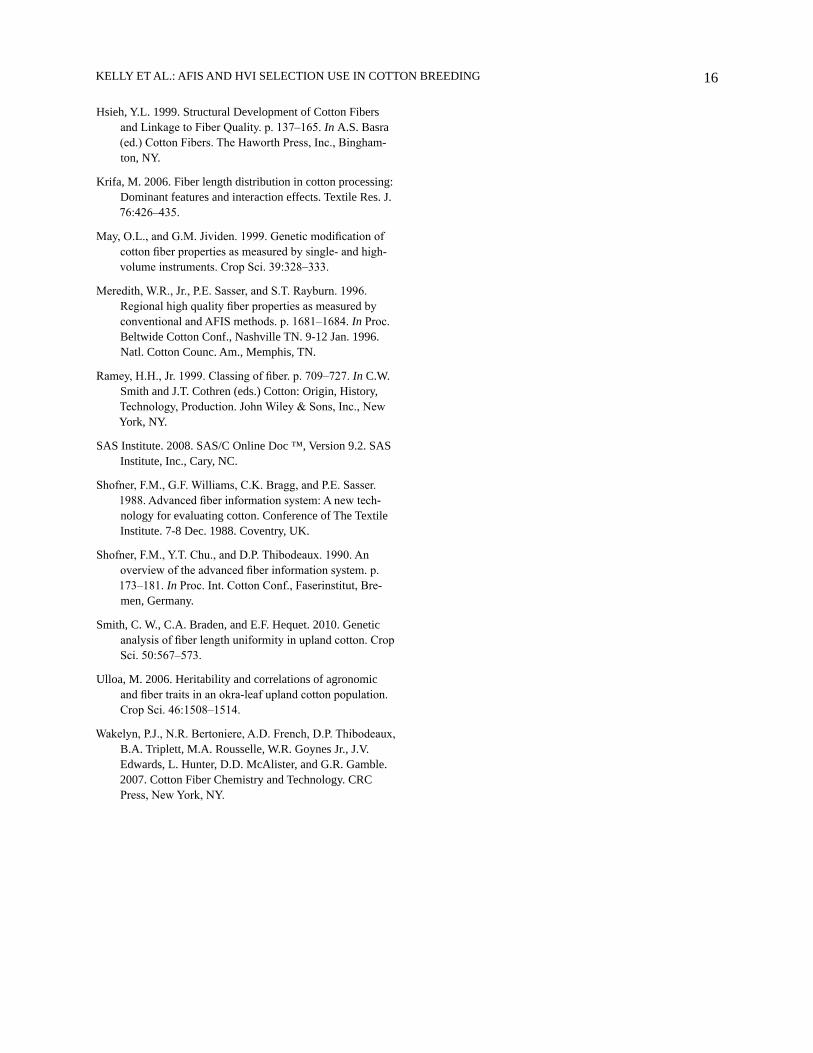
PCA revealed length distribution of fibers fell into two distinct clusters: group 1 includes most of the HVI-selected lines, whereas group 2 includes most of the AFIS-selected lines (Figs. 6, 7, and 8). At the Texas Tech University Research farm, PC1 and PC2 accounted for 98% of the total length distribution variation and could be used to distinguish between length distributions for
14KELLY ET AL.: AFIS AND HVI SELECTION USE IN COTTON BREEDING
each of the selection methods and commercial cultivars. Means for AFIS fiber properties of the two selection methods were similar, Ln and maturity ratios were not different between the groups at all locations and SFCn never differed more than 2.1% among selection methods. Yet, PCA analysis demonstrated differences among the average length distribution of the groups (HVI, AFIS, and commercial cultivars). These differ-ences were most evident at the Texas Tech University Research Farm (Fig. 6).
There were three distinct groups of length distri-butions: HVI-selected lines, AFIS-selected lines, and check cultivars (Fig. 6). There were two HVI-selected lines located among the AFIS-selected lines that indi-cated the length distributions of these lines were more like the AFIS-selected lines than other HVI-selected lines. It was also interesting to note HVI-selected lines were on the negative side of the PC1 axis, the same as the commercial cultivars. Groupings were not as clear at Lamesa (Fig. 7) and Brownfield (Fig. 8), but some separation did occur. At Lamesa, HVI-selected lines were in a tighter cluster than AFIS-selected lines or
Figure 3. Average length distribution (by number) for each selection method and the commercial cultivars at the Texas Tech University Research Farm in 2008.
0
1
2
3
4
5
6
7
0.00 8.00 16.00 24.00 32.00 40.00 48.00 56.00 64.00
% L
(n)
HVIAFISCommercial
L(n), mm
64.00L(n), mm
0
1
2
3
4
5
6
7
0.00 8.00 16.00 24.00 32.00 40.00 48.00 56.00
% L
(n)
HVIAFISCommercial
Figure 4. Average length distribution (by number) for each selection method and the commercial cultivars at Lamesa, TX, in 2008.
64.00L(n), mm
0
1
2
3
4
5
6
7
8
0.00 8.00 16.00 24.00 32.00 40.00 48.00 56.00
% L
(n)
HVIAFISCommercial
Figure 5. Average length distribution (by number) for each selection method and the commercial cultivars at Brown-field, TX, in 2008.
-4
-3
-2
-1
0
1
2
3
4
5
6
-8 -6 -4 -2 00 2 4 6 8
AFIS HVI Controls
PC1 - 78% explained
PC2
20%
exp
lain
ed
Figure 6. Principal component analysis for average length distributions of HVI-selected lines, AFIS-selected lines, and commercial cultivars at the Texas Tech University Research Farm in 2008.
commercial cultivars. Average length distributions at Brownfield did not separate into three distinct groups, but differences among the two selection methods and commercial cultivars could be seen. This might be a result of lower fiber maturity at Brownfield in comparison to the other locations (Krifa, 2006). Fiber maturity affects length distribution, because immature fibers are more likely to break during ginning. This fiber breakage changes the original length distribution. The effect of maturity on length distribution was observed when PCA results were contrasted across locations. Cotton fiber from the Texas Tech University Research Farm, which had the greatest fiber maturity, also had differences among lines for fiber length distribution. At Brownfield, fiber had the lowest fiber maturity and the least distinction among the three groups for fiber length distributions of any location. When low fiber maturity occurs, differences among fiber length distributions are often the result of environmental effects more than genetic differences. This is related to fiber maturity be-ing highly influenced by the growing environment as reported by May and Jividen (1999).
15JOURNAL OF COTTON SCIENCE, Volume 16, Issue 1, 2012
CONCLUSIONS
According to data from this research, it is possible to modify cotton fiber length distribution through plant breeding efforts. Fiber length distribution for F5 breed-ing lines for both selection methods was better than fiber length distribution of commercial check cultivars, and the distribution improved over the F2 averages. Short fiber content was reduced and fiber length and fiber maturity were increased using both selection methods. It was also determined that selecting for an improved fiber length distribution, as was accomplished in the AFIS method, indirectly selects for improvement of other fiber properties such as fiber maturity and strength, explaining why an HVI strength improvement occurred for the AFIS selections despite it not being a trait under direct selection. Other studies have looked at gene action controlling fiber length distribution and heritability of length uniformity (Braden, 2005; Smith et al., 2010). The results support the hypothesis that fiber length distribution is heritable and could be altered through breeding efforts. However, these studies did not examine the ability to select for desirable fiber length distribution within a breeding program or the effect this could have on textile performance.
Differences in fiber quality were minimal between the two selection methods even though selection criteria for each method were different. These results were unexpected given the additional detailed fiber information offered by AFIS measurements, but might be explained by the way the fiber data was interpreted. The HVI method had less data available than the AFIS method; however, by focusing on length uniformity in addition to UHML and fiber strength, the HVI method enabled us to modify fiber length distributions. The effectiveness of HVI selection was comparable to using fiber length distributions provided by AFIS
measurements. Knowledge of AFIS data and fiber length distributions were used to interpret and apply HVI data during the selection process. This approach was different from only using fiber length and strength data as selection criteria. Both selection methods fo-cused on selecting lines with a balanced fiber quality profile. Cottons with balanced fiber profiles should ex-hibit superior spinning performance and yarn quality. These findings illustrate the importance of fiber data interpretation and application in a breeding program, regardless of the source.
Future Work. A second hypothesis for this research was the possibility of improving spinning performance and yarn quality by selecting for a fa-vorable fiber length distribution. If this is true, the experimental lines should exhibit spinning perfor-mance and yarn quality superior to the commercial cultivars in this study. The effect of a balanced fiber profile on spinning performance and yarn quality for F5 lines from each of these selection methods will be explored by this research team.
REFERENCES
Braden, C.A. 2005. Inheritance of cotton fiber length distribu-tion. Ph.D. diss. Texas A&M University, College Station, TX.
Bragg, C.K., and F.M. Shofner. 1993. A rapid, direct measure-ment of short fiber content. Textile Res. J. 63:171–176.
Esbensen, K.H., D. Guyot, F. Westad, and L.P. Houmoller. 2002. Multivariate Data Analysis: In Practice: An Intro-duction to Multivariate Data Analysis and Experimental Design. 5th ed. CAMO software, NJ.
Hequet, E., N. Abidi, and J. Gannaway. 2007. Relationships between HVI, AFIS, and yarn textile properties. Inter-national Cotton Research Conference 10-14 Sept. 2007, Lubbock, TX.
Figure 7. Principal component analysis for average length distributions of HVI entries, AFIS-selected lines, and com-mercial cultivars at Lamesa, TX, in 2008.
AFIS HVI Controls
-3
-2
-1
0
1
2
3
-6 -4 -2 0 2 4 6
PC2
- 35%
exp
lain
ed
PC1 - 59% explained
AFIS HVI Controls
-3
-2
-1
0
1
2
3
4
-4 -2 0 2 4
PC2
- 39%
exp
lain
ed
PC1 - 52% explained
Figure 8. Principal component analysis for average length distributions of HVI-selected lines, AFIS-selected lines, and commercial cultivars at Brownfield, TX, in 2008.
16KELLY ET AL.: AFIS AND HVI SELECTION USE IN COTTON BREEDING
Hsieh, Y.L. 1999. Structural Development of Cotton Fibers and Linkage to Fiber Quality. p. 137–165. In A.S. Basra (ed.) Cotton Fibers. The Haworth Press, Inc., Bingham-ton, NY.
Krifa, M. 2006. Fiber length distribution in cotton processing: Dominant features and interaction effects. Textile Res. J. 76:426–435.
May, O.L., and G.M. Jividen. 1999. Genetic modification of cotton fiber properties as measured by single- and high-volume instruments. Crop Sci. 39:328–333.
Meredith, W.R., Jr., P.E. Sasser, and S.T. Rayburn. 1996. Regional high quality fiber properties as measured by conventional and AFIS methods. p. 1681–1684. In Proc. Beltwide Cotton Conf., Nashville TN. 9-12 Jan. 1996. Natl. Cotton Counc. Am., Memphis, TN.
Ramey, H.H., Jr. 1999. Classing of fiber. p. 709–727. In C.W. Smith and J.T. Cothren (eds.) Cotton: Origin, History, Technology, Production. John Wiley & Sons, Inc., New York, NY.
SAS Institute. 2008. SAS/C Online Doc ™, Version 9.2. SAS Institute, Inc., Cary, NC.
Shofner, F.M., G.F. Williams, C.K. Bragg, and P.E. Sasser. 1988. Advanced fiber information system: A new tech-nology for evaluating cotton. Conference of The Textile Institute. 7-8 Dec. 1988. Coventry, UK.
Shofner, F.M., Y.T. Chu., and D.P. Thibodeaux. 1990. An overview of the advanced fiber information system. p. 173–181. In Proc. Int. Cotton Conf., Faserinstitut, Bre-men, Germany.
Smith, C. W., C.A. Braden, and E.F. Hequet. 2010. Genetic analysis of fiber length uniformity in upland cotton. Crop Sci. 50:567–573.
Ulloa, M. 2006. Heritability and correlations of agronomic and fiber traits in an okra-leaf upland cotton population. Crop Sci. 46:1508–1514.
Wakelyn, P.J., N.R. Bertoniere, A.D. French, D.P. Thibodeaux, B.A. Triplett, M.A. Rousselle, W.R. Goynes Jr., J.V. Edwards, L. Hunter, D.D. McAlister, and G.R. Gamble. 2007. Cotton Fiber Chemistry and Technology. CRC Press, New York, NY.