Embed Size (px)
Citation preview
Jardine, R. J. et al. (2013). Geotechnique 63, No. 8, 613–627 [http://dx.doi.org/10.1680/geot.9.P.138]
613
Interpretation of stress measurements made around closed-endeddisplacement piles in sand
R. J. JARDINE�, B. T. ZHU†, P. FORAY‡ and Z. X. YANG§
An interpretation is given of instrumented calibration chamber experiments involving comprehensivemeasurements of the stresses developed on and around closed-ended model displacement pilesinstalled in pressurised silica sand. Conclusions are drawn regarding the mechanisms and stressregimes that apply during and after penetration, and how these compare with cavity expansiontreatments and other analyses. The experimental arrangements and measurement details are describedfully in a companion paper.
KEYWORDS: model test; piles; sands; stress analysis; stress path
INTRODUCTIONConsiderable uncertainty exists over the stress conditionsdeveloped around displacement piles, particularly when con-sidering sands in which vertical tip stresses may exceedthose acting on the shaft by orders of magnitude. Experi-ments are required to give key insights and test potentialconjectures, assumptions and hypotheses regarding the stressregimes applying during and after installation. Establishingthese stress conditions is critical to improving the under-standing and modelling of features such as non-linear load–displacement behaviour, group installation effects, or baseand shaft capacity variations with time.
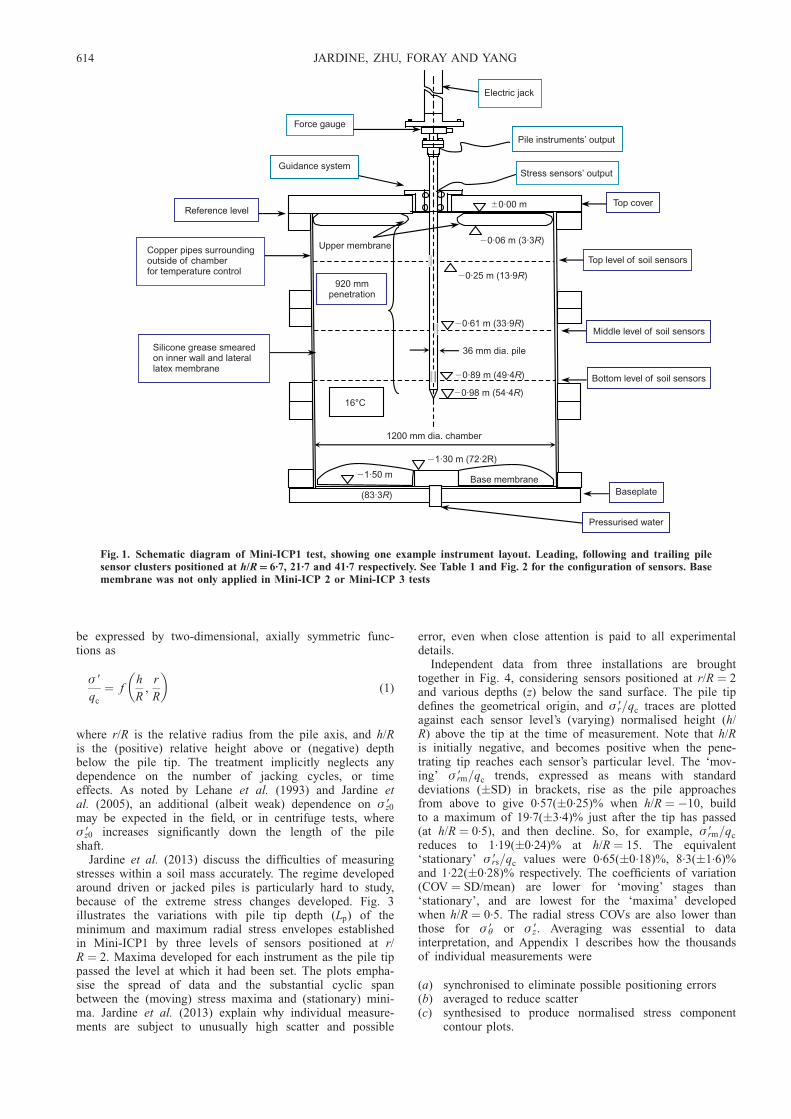
Jardine et al. (2013) report measurements made as 36 mmdiameter steel instrumented piles and cone penetration test(CPT) probes were jacked into pressurised, air-pluviatedFontainebleau NE34 sand in the heavily instrumented INPGcalibration chamber illustrated in Fig. 1. The fine sand(D50 ¼ 0.21mm) was placed at an average initial void ratioe0 ¼ 0.62 and relative density Dr ¼ 72%; its mechanicalproperties are described by Yang et al. (2010), Jardine et al.(2013) and Altuhafi & Jardine (2011), who consider particlebreakage, one-dimensional compression, triaxial and inter-face shear behaviour under a wide range of pressures.
The pile experiments described included two ‘pilot’ testsmade with a CPT probe, and three installations with astainless steel Mini-Imperial College pile (ICP). A verticalsurcharge of ,200 kPa was applied in the first test, CPT1,which was reduced to ,150 kPa for the following installa-tions. As outlined in Fig. 2 and Tables 1–3, continuousmeasurements were made in the sand mass of local � 9r, � 9Łand � 9z trends by up to 40 sensors per installation. Shaftinterface stresses �rz and � 9r were recorded at three points onthe Mini-ICP, and axial loads were measured at four to fivelevels. Boundary conditions and jacking styles varied slightlybetween the installations. Jardine et al. (2013) describe how
end bearing and qc profiles were established for each test.They showed that the soil stresses developed during installa-tion correlated directly with the local qc values; normal-isation by qc reduced the influence of variations in testarrangements. Shaft failure was shown to be governed in allcases by the Coulomb law, with operational �9 values thatmatched parallel laboratory interface ring-shear tests.
One test involved installation by steady jacking. The pileheads were unloaded fully in the brief ‘stationary periods’imposed between jack strokes in all other tests, leading totwo-way shaft failure during each cycle that involved bothcontractant and dilative phases. The number of extreme cyclesper installation ranged from N ¼ 1 (for the steadily jackedpile) to N ¼ 200 in Mini-ICP2 when a 5 mm stroke lengthwas imposed. Stroke lengths of 10 mm were imposed in thethree other installations, giving N ¼ 100. The installationstresses varied greatly between stationary (s) and moving (m)stages of penetration, and were critically dependent on theinstruments’ locations relative to the pile tips. The sand-massstresses were insensitive to N and the periods of the installa-tion cycles; however, the pile/soil interface stresses may bemore affected by these variables (Jardine et al., 2013).
Field tests suggest that the stresses developed on theshafts of piles driven in sands vary considerably over theweeks and months that follow installation: see for exampleChow (1997), Chow et al. (1998), Axelsson (2000) orJardine et al. (2006). The model piles did not show anystrong evidence of time dependence over their installationperiods. However, they were jacked relatively slowly, andRimoy (2012) is investigating whether stronger rate and timeeffects apply during the installation of dynamically drivenpiles.
SYNTHESIS OF SOIL STRESS MEASUREMENTSThis paper presents further synthesis of the large volume
of stress measurements made with the sensor arrays illus-trated in Figs 1 and 2. It also refers the results to cavityexpansion analyses, which have been considered relevant todisplacement pile behaviour in sand by, for example, Vesic(1972), Yu & Houlsby (1991), Salgado et al. (1997) andWhite et al. (2005).
Following from Jardine et al. (2013), the interpretationassumes that the � 9z, � 9r and � 9Ł stresses (within the regionthat is unaffected by the chamber’s boundary conditions)developed in the sand mass, during and shortly after installa-tion, under any fixed initial free field vertical stress � 9z0, can
Manuscript received 22 September 2011; revised manuscript accepted12 October 2012. Published online ahead of print 1 February 2013.Discussion on this paper closes on 1 November 2013, for furtherdetails see p. ii.� Department of Civil and Environmental Engineering, ImperialCollege London, UK.† NOMA Consulting Pty Ltd, Australia; formerly Imperial College.‡ Laboratoire Sols, Solides, Structures-Risques, Institut Polytechniquede Grenoble, France.§ Research Center of Coastal and Urban Geotechnical Engineering,Department of Civil Engineering, Zhejiang University, China;formerly Imperial College.
be expressed by two-dimensional, axially symmetric func-tions as
� 9
qc
¼ fh
R,
r
R
� �(1)
where r/R is the relative radius from the pile axis, and h/Ris the (positive) relative height above or (negative) depthbelow the pile tip. The treatment implicitly neglects anydependence on the number of jacking cycles, or timeeffects. As noted by Lehane et al. (1993) and Jardine etal. (2005), an additional (albeit weak) dependence on � 9z0
may be expected in the field, or in centrifuge tests, where� 9z0 increases significantly down the length of the pileshaft.
Jardine et al. (2013) discuss the difficulties of measuringstresses within a soil mass accurately. The regime developedaround driven or jacked piles is particularly hard to study,because of the extreme stress changes developed. Fig. 3illustrates the variations with pile tip depth (Lp) of theminimum and maximum radial stress envelopes establishedin Mini-ICP1 by three levels of sensors positioned at r/R ¼ 2. Maxima developed for each instrument as the pile tippassed the level at which it had been set. The plots empha-sise the spread of data and the substantial cyclic spanbetween the (moving) stress maxima and (stationary) mini-ma. Jardine et al. (2013) explain why individual measure-ments are subject to unusually high scatter and possible
error, even when close attention is paid to all experimentaldetails.
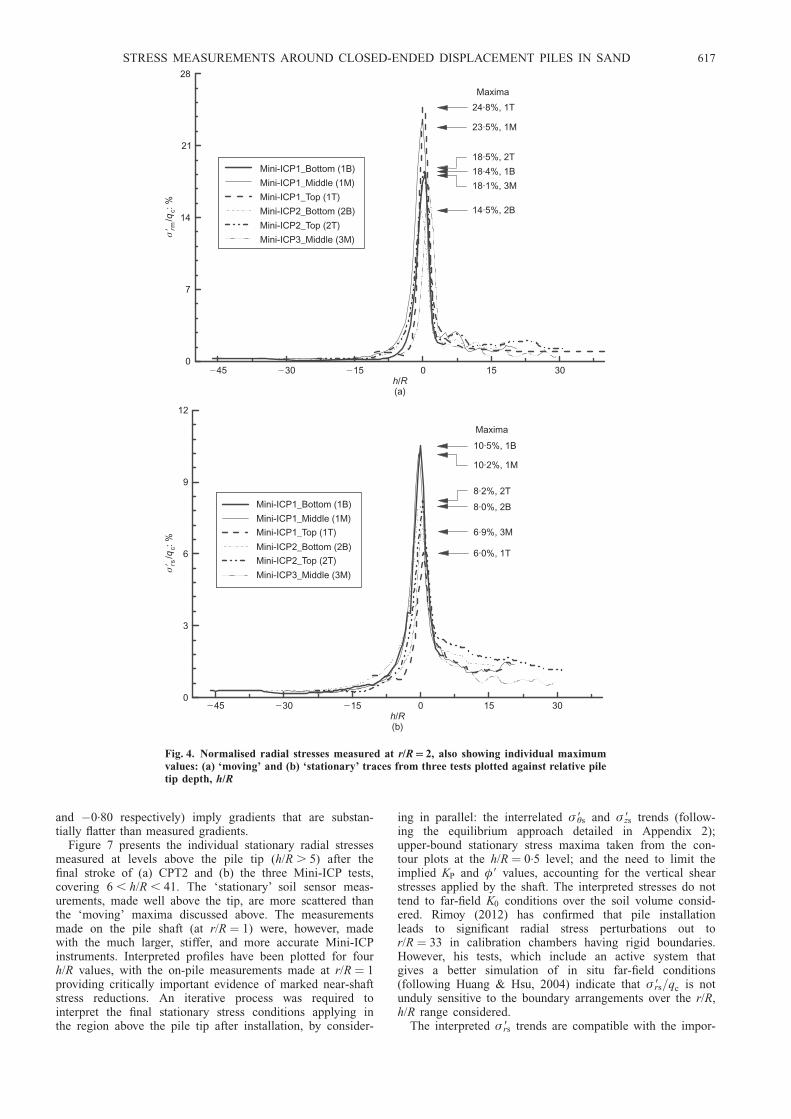
Independent data from three installations are broughttogether in Fig. 4, considering sensors positioned at r/R ¼ 2and various depths (z) below the sand surface. The pile tipdefines the geometrical origin, and � 9r=qc traces are plottedagainst each sensor level’s (varying) normalised height (h/R) above the tip at the time of measurement. Note that h/Ris initially negative, and becomes positive when the pene-trating tip reaches each sensor’s particular level. The ‘mov-ing’ � 9rm=qc trends, expressed as means with standarddeviations (�SD) in brackets, rise as the pile approachesfrom above to give 0.57(�0.25)% when h/R ¼ �10, buildto a maximum of 19.7(�3.4)% just after the tip has passed(at h/R ¼ 0.5), and then decline. So, for example, � 9rm=qc
reduces to 1.19(�0.24)% at h/R ¼ 15. The equivalent‘stationary’ � 9rs=qc values were 0.65(�0.18)%, 8.3(�1.6)%and 1.22(�0.28)% respectively. The coefficients of variation(COV ¼ SD/mean) are lower for ‘moving’ stages than‘stationary’, and are lowest for the ‘maxima’ developedwhen h/R ¼ 0.5. The radial stress COVs are also lower thanthose for � 9Ł or � 9z: Averaging was essential to datainterpretation, and Appendix 1 describes how the thousandsof individual measurements were
(a) synchronised to eliminate possible positioning errors(b) averaged to reduce scatter(c) synthesised to produce normalised stress component
contour plots.
Electric jack
920 mmpenetration
16°C
Upper membrane
Reference level
Base membrane
Stress sensors’ output
Pile instruments’ output
Force gauge
�0·00 m
�0·25 m (13·9 )R
�0·61 m (33·9 )R
�0·89 m (49·4 )R
�1·50 m
(83·3 )R
Top level of soil sensors
Middle level of soil sensors
Bottom level of soil sensors
Silicone grease smearedon inner wall and laterallatex membrane
Guidance system
Copper pipes surroundingoutside of chamberfor temperature control
�0·98 m (54·4 )R
�1·30 m (72·2R)
Pressurised water
Baseplate
Top cover
�0·06 m (3·3 )R
36 mm dia. pile
1200 mm dia. chamber
Fig. 1. Schematic diagram of Mini-ICP1 test, showing one example instrument layout. Leading, following and trailing pilesensor clusters positioned at h/R 6.7, 21.7 and 41.7 respectively. See Table 1 and Fig. 2 for the configuration of sensors. Basemembrane was not only applied in Mini-ICP 2 or Mini-ICP 3 tests
614 JARDINE, ZHU, FORAY AND YANG
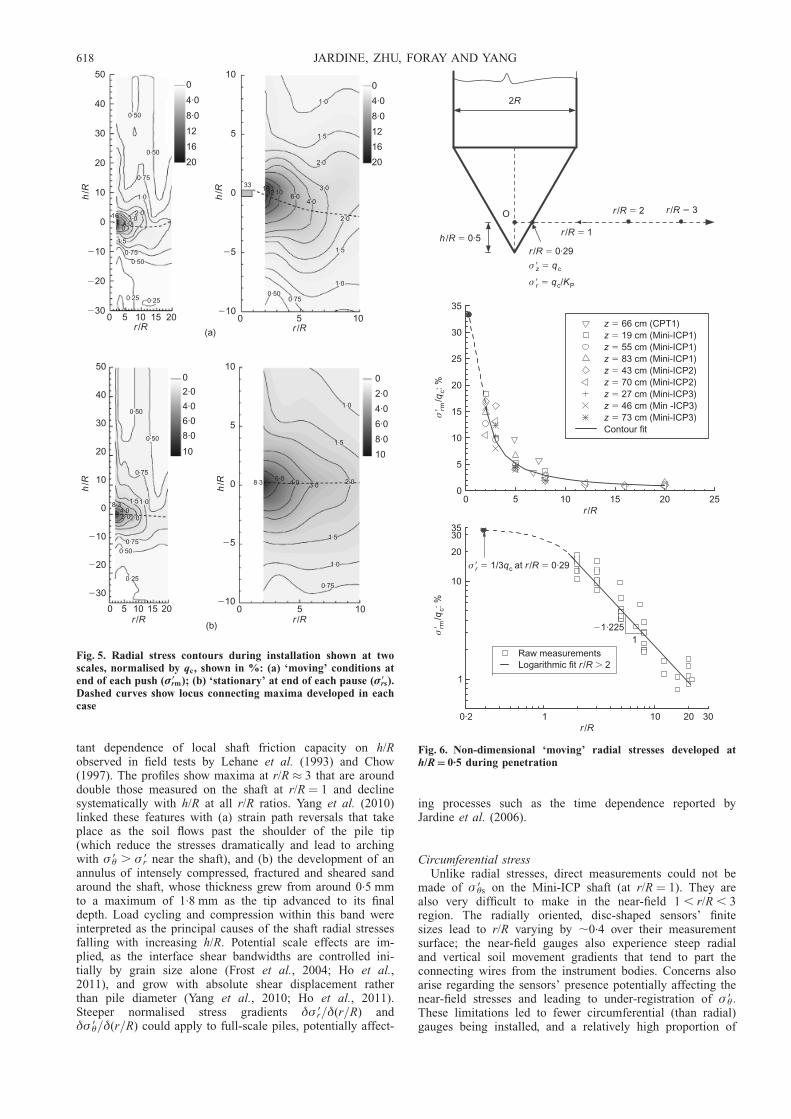
Radial stressFigure 5 presents two normalised radial stress contour
maps, one corresponding to ‘moving’ � 9rm=qc trends, theother to ‘stationary’ � 9rs=qc conditions. They show generally
comparable patterns, with intense stress concentrations fo-cused near the tip, at r/R ¼ 0, h/R � 0.5. If the stressamplitude of each jacking cycle is defined as being half thedifference between the moving and stationary values, then
0 2 5 8 12 16r R/
z R/
3 20
10·6
15·0
23·9
25·6
30·6
36·738·940·640·8
46·1
CPT1CPT2Mini-ICP1Mini-ICP2
Mini-ICP3
Legend for tests
0 2 5 8 12 16r R/
3 20
z R/
10·6
15·0
23·9
25·6
30·6
36·738·940·640·8
46·1
0 2 5 8 12 16r R/
3 20
z R/
10·6
15·0
23·9
25·6
30·6
36·738·940·640·8
46·1
(a) (b) (c)
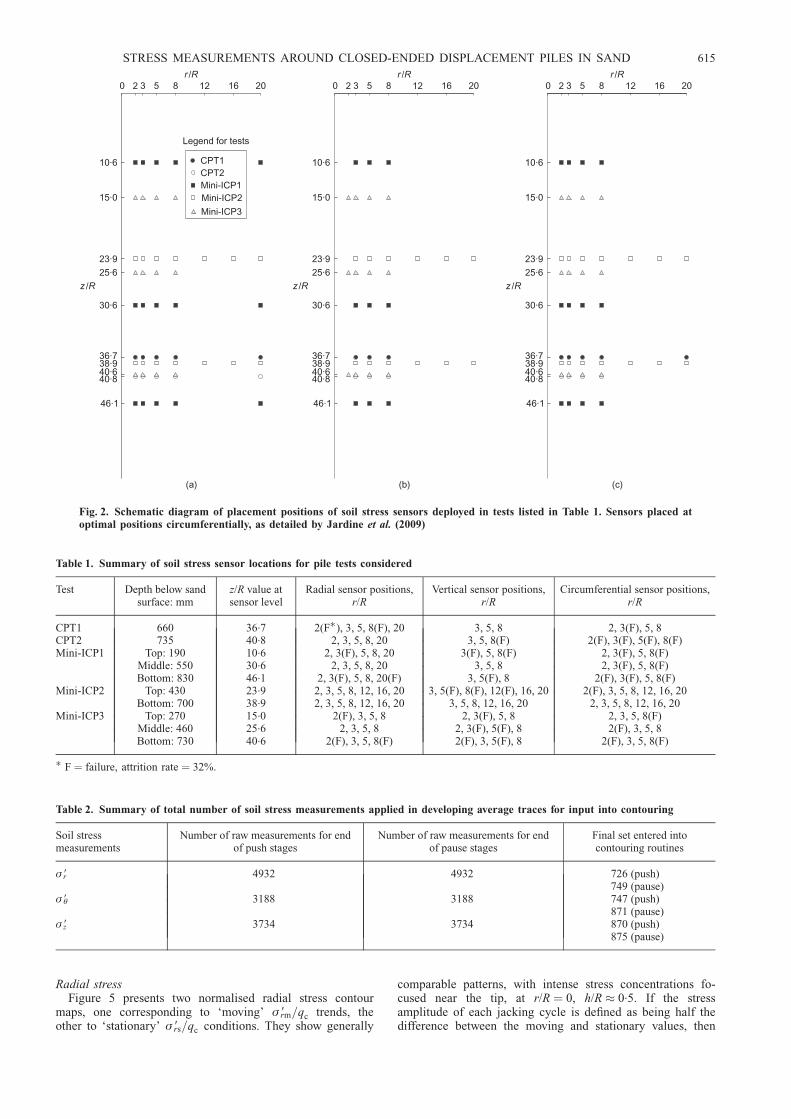
Fig. 2. Schematic diagram of placement positions of soil stress sensors deployed in tests listed in Table 1. Sensors placed atoptimal positions circumferentially, as detailed by Jardine et al. (2009)
Table 1. Summary of soil stress sensor locations for pile tests considered
Test Depth below sandsurface: mm
z/R value atsensor level
Radial sensor positions,r/R
Vertical sensor positions,r/R
Circumferential sensor positions,r/R
CPT1 660 36.7 2(F�), 3, 5, 8(F), 20 3, 5, 8 2, 3(F), 5, 8CPT2 735 40.8 2, 3, 5, 8, 20 3, 5, 8(F) 2(F), 3(F), 5(F), 8(F)Mini-ICP1 Top: 190 10.6 2, 3(F), 5, 8, 20 3(F), 5, 8(F) 2, 3(F), 5, 8(F)
Middle: 550 30.6 2, 3, 5, 8, 20 3, 5, 8 2, 3(F), 5, 8(F)Bottom: 830 46.1 2, 3(F), 5, 8, 20(F) 3, 5(F), 8 2(F), 3(F), 5, 8(F)
Mini-ICP2 Top: 430 23.9 2, 3, 5, 8, 12, 16, 20 3, 5(F), 8(F), 12(F), 16, 20 2(F), 3, 5, 8, 12, 16, 20Bottom: 700 38.9 2, 3, 5, 8, 12, 16, 20 3, 5, 8, 12, 16, 20 2, 3, 5, 8, 12, 16, 20
Mini-ICP3 Top: 270 15.0 2(F), 3, 5, 8 2, 3(F), 5, 8 2, 3, 5, 8(F)Middle: 460 25.6 2, 3, 5, 8 2, 3(F), 5(F), 8 2(F), 3, 5, 8Bottom: 730 40.6 2(F), 3, 5, 8(F) 2(F), 3, 5(F), 8 2(F), 3, 5, 8(F)
� F ¼ failure, attrition rate ¼ 32%.
Table 2. Summary of total number of soil stress measurements applied in developing average traces for input into contouring
Soil stressmeasurements
Number of raw measurements for endof push stages
Number of raw measurements for endof pause stages
Final set entered intocontouring routines
� 9r 4932 4932 726 (push)749 (pause)
� 9Ł 3188 3188 747 (push)871 (pause)
� 9z 3734 3734 870 (push)875 (pause)
STRESS MEASUREMENTS AROUND CLOSED-ENDED DISPLACEMENT PILES IN SAND 615
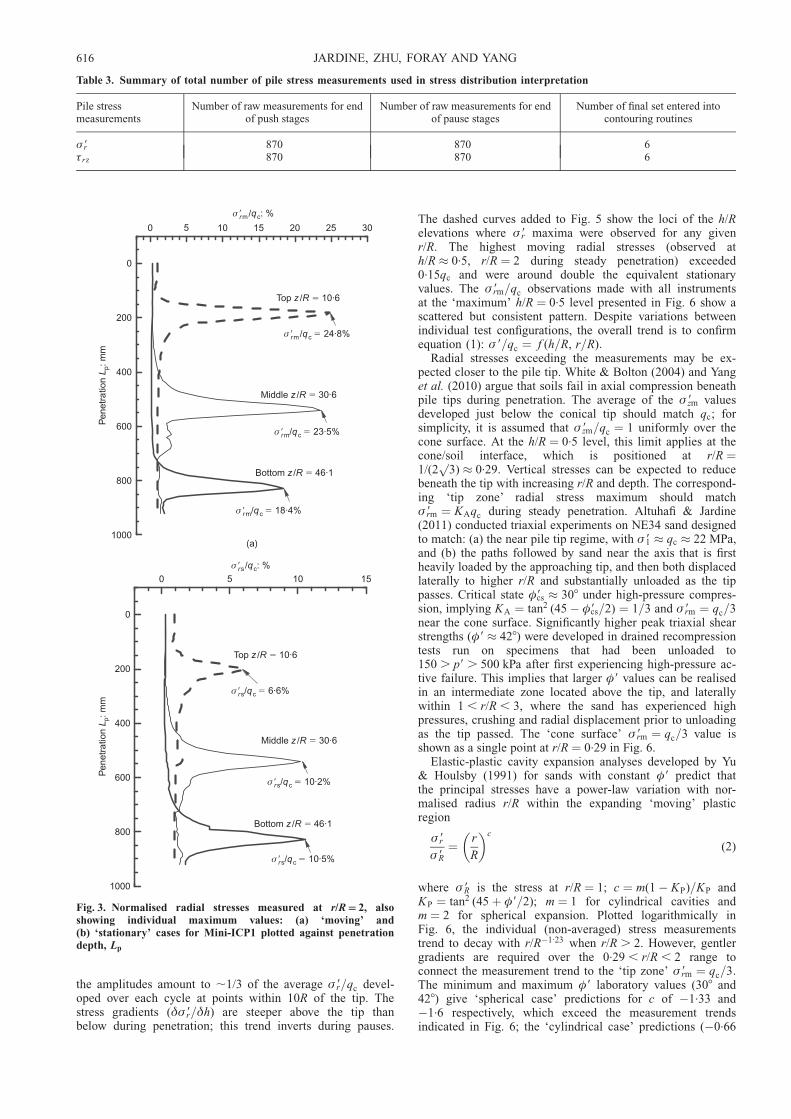
the amplitudes amount to ,1/3 of the average � 9r=qc devel-oped over each cycle at points within 10R of the tip. Thestress gradients (�� 9r=�h) are steeper above the tip thanbelow during penetration; this trend inverts during pauses.
The dashed curves added to Fig. 5 show the loci of the h/Relevations where � 9r maxima were observed for any givenr/R. The highest moving radial stresses (observed ath/R � 0.5, r/R ¼ 2 during steady penetration) exceeded0.15qc and were around double the equivalent stationaryvalues. The � 9rm=qc observations made with all instrumentsat the ‘maximum’ h/R ¼ 0.5 level presented in Fig. 6 show ascattered but consistent pattern. Despite variations betweenindividual test configurations, the overall trend is to confirmequation (1): � 9=qc ¼ f (h=R, r=R):
Radial stresses exceeding the measurements may be ex-pected closer to the pile tip. White & Bolton (2004) and Yanget al. (2010) argue that soils fail in axial compression beneathpile tips during penetration. The average of the � 9zm valuesdeveloped just below the conical tip should match qc; forsimplicity, it is assumed that � 9zm=qc ¼ 1 uniformly over thecone surface. At the h/R ¼ 0.5 level, this limit applies at thecone/soil interface, which is positioned at r/R ¼1/(2p
3) � 0.29. Vertical stresses can be expected to reducebeneath the tip with increasing r/R and depth. The correspond-ing ‘tip zone’ radial stress maximum should match� 9rm ¼ KAqc during steady penetration. Altuhafi & Jardine(2011) conducted triaxial experiments on NE34 sand designedto match: (a) the near pile tip regime, with � 91 � qc � 22 MPa,and (b) the paths followed by sand near the axis that is firstheavily loaded by the approaching tip, and then both displacedlaterally to higher r/R and substantially unloaded as the tippasses. Critical state �9cs � 308 under high-pressure compres-sion, implying KA ¼ tan2 (45� �9cs=2) ¼ 1=3 and � 9rm ¼ qc=3near the cone surface. Significantly higher peak triaxial shearstrengths (�9 � 428) were developed in drained recompressiontests run on specimens that had been unloaded to150 . p9 . 500 kPa after first experiencing high-pressure ac-tive failure. This implies that larger �9 values can be realisedin an intermediate zone located above the tip, and laterallywithin 1 , r/R , 3, where the sand has experienced highpressures, crushing and radial displacement prior to unloadingas the tip passed. The ‘cone surface’ � 9rm ¼ qc=3 value isshown as a single point at r/R ¼ 0.29 in Fig. 6.
Elastic-plastic cavity expansion analyses developed by Yu& Houlsby (1991) for sands with constant �9 predict thatthe principal stresses have a power-law variation with nor-malised radius r/R within the expanding ‘moving’ plasticregion
� 9r
� 9R¼ r
R
� �c
(2)
where � 9R is the stress at r/R ¼ 1; c ¼ m(1� KP)=KP andKP ¼ tan2 (45þ �9=2); m ¼ 1 for cylindrical cavities andm ¼ 2 for spherical expansion. Plotted logarithmically inFig. 6, the individual (non-averaged) stress measurementstrend to decay with r/R�1:23 when r/R . 2. However, gentlergradients are required over the 0.29 , r/R , 2 range toconnect the measurement trend to the ‘tip zone’ � 9rm ¼ qc=3:The minimum and maximum �9 laboratory values (308 and428) give ‘spherical case’ predictions for c of �1.33 and�1.6 respectively, which exceed the measurement trendsindicated in Fig. 6; the ‘cylindrical case’ predictions (�0.66
Table 3. Summary of total number of pile stress measurements used in stress distribution interpretation
Pile stressmeasurements
Number of raw measurements for endof push stages
Number of raw measurements for endof pause stages
Number of final set entered intocontouring routines
� 9r 870 870 6�rz 870 870 6
σ �rm c/ : %q
30252015105
σ � �rm c/ 24·8%q
σ � �rm c/ 23·5%q
σ � �rm c/ 18·4%q
(a)
15105
σ �rs c/ : %q
Pen
etra
tion
: mm
L p
σ � �rs c/ 6·6%q
σ � �rs c/ 10·2%q
σ � �rs c/ 10·5%q
1000
800
600
400
200
0
0
Bottom / 46·1z R �
Middle / 30·6z R �
Pen
etra
tion
: mm
L p
Top / 10·6z R �
1000
800
600
400
200
0
0
Bottom / 46·1z R �
Middle / 30·6z R �
Top / 10·6z R �
Fig. 3. Normalised radial stresses measured at r/R 2, alsoshowing individual maximum values: (a) ‘moving’ and(b) ‘stationary’ cases for Mini-ICP1 plotted against penetrationdepth, Lp
616 JARDINE, ZHU, FORAY AND YANG
and �0.80 respectively) imply gradients that are substan-tially flatter than measured gradients.
Figure 7 presents the individual stationary radial stressesmeasured at levels above the pile tip (h/R . 5) after thefinal stroke of (a) CPT2 and (b) the three Mini-ICP tests,covering 6 , h/R , 41. The ‘stationary’ soil sensor meas-urements, made well above the tip, are more scattered thanthe ‘moving’ maxima discussed above. The measurementsmade on the pile shaft (at r/R ¼ 1) were, however, madewith the much larger, stiffer, and more accurate Mini-ICPinstruments. Interpreted profiles have been plotted for fourh/R values, with the on-pile measurements made at r/R ¼ 1providing critically important evidence of marked near-shaftstress reductions. An iterative process was required tointerpret the final stationary stress conditions applying inthe region above the pile tip after installation, by consider-
ing in parallel: the interrelated � 9Łs and � 9zs trends (follow-ing the equilibrium approach detailed in Appendix 2);upper-bound stationary stress maxima taken from the con-tour plots at the h/R ¼ 0.5 level; and the need to limit theimplied KP and �9 values, accounting for the vertical shearstresses applied by the shaft. The interpreted stresses do nottend to far-field K0 conditions over the soil volume consid-ered. Rimoy (2012) has confirmed that pile installationleads to significant radial stress perturbations out tor/R ¼ 33 in calibration chambers having rigid boundaries.However, his tests, which include an active system thatgives a better simulation of in situ far-field conditions(following Huang & Hsu, 2004) indicate that � 9rs=qc is notunduly sensitive to the boundary arrangements over the r/R,h/R range considered.
The interpreted � 9rs trends are compatible with the impor-
σ� rm
c/
: %q
30150�15�30h R/(a)
0
σ� rs
c/
: %q
30150�15�30h R/(b)
�45
0
7
14
21
28
�45
18·5%, 2TMini-ICP1_Bottom (1B)
Mini-ICP1_Middle (1M)
Mini-ICP1_Top (1T)
Mini-ICP2_Bottom (2B)
Mini-ICP2_Top (2T)
Mini-ICP3_Middle (3M)
Maxima
24·8%, 1T
23·5%, 1M
18·4%, 1B
18·1%, 3M
14·5%, 2B
3
6
9
12
8·2%, 2T
10·2%, 1M
Mini-ICP1_Bottom (1B)
Mini-ICP1_Middle (1M)
Mini-ICP1_Top (1T)
Mini-ICP2_Bottom (2B)
Mini-ICP2_Top (2T)
Mini-ICP3_Middle (3M)
Maxima
10·5%, 1B
8·0%, 2B
6·9%, 3M
6·0%, 1T
Fig. 4. Normalised radial stresses measured at r/R 2, also showing individual maximumvalues: (a) ‘moving’ and (b) ‘stationary’ traces from three tests plotted against relative piletip depth, h/R
STRESS MEASUREMENTS AROUND CLOSED-ENDED DISPLACEMENT PILES IN SAND 617
tant dependence of local shaft friction capacity on h/Robserved in field tests by Lehane et al. (1993) and Chow(1997). The profiles show maxima at r/R � 3 that are arounddouble those measured on the shaft at r/R ¼ 1 and declinesystematically with h/R at all r/R ratios. Yang et al. (2010)linked these features with (a) strain path reversals that takeplace as the soil flows past the shoulder of the pile tip(which reduce the stresses dramatically and lead to archingwith � 9Ł . � 9r near the shaft), and (b) the development of anannulus of intensely compressed, fractured and sheared sandaround the shaft, whose thickness grew from around 0.5 mmto a maximum of 1.8 mm as the tip advanced to its finaldepth. Load cycling and compression within this band wereinterpreted as the principal causes of the shaft radial stressesfalling with increasing h/R. Potential scale effects are im-plied, as the interface shear bandwidths are controlled ini-tially by grain size alone (Frost et al., 2004; Ho et al.,2011), and grow with absolute shear displacement ratherthan pile diameter (Yang et al., 2010; Ho et al., 2011).Steeper normalised stress gradients �� 9r=�(r=R) and�� 9Ł=�(r=R) could apply to full-scale piles, potentially affect-
ing processes such as the time dependence reported byJardine et al. (2006).
Circumferential stressUnlike radial stresses, direct measurements could not be
made of � 9Łs on the Mini-ICP shaft (at r/R ¼ 1). They arealso very difficult to make in the near-field 1 , r/R , 3region. The radially oriented, disc-shaped sensors’ finitesizes lead to r/R varying by ,0.4 over their measurementsurface; the near-field gauges also experience steep radialand vertical soil movement gradients that tend to part theconnecting wires from the instrument bodies. Concerns alsoarise regarding the sensors’ presence potentially affecting thenear-field stresses and leading to under-registration of � 9Ł:These limitations led to fewer circumferential (than radial)gauges being installed, and a relatively high proportion of
hR/
2015105r R/
hR/
105r R/
0·25
0·500·75
0·75
1·0
0·50
1·5
2·03·0
4·06·0
0·50
0·25
0�30
�20
�10
0
10
20
30
40
500
4·0
8·0
12
16
20
16
0·500·75
1·0
1·5
2·0
2·0
1·5
3·0
1·0
4·06·0
101216
0�10
�5
0
5
100
4·0
8·0
12
16
20
33
(a)
hR/
2015105r R/
105r R/
0 0
(b)
hR/
0·25
0·500·75
0·75
0·50
1·0
0·50
1·5
2·03·04·0
�30
�20
�10
0
10
20
30
40
500
2·0
4·0
6·0
8·0
10
8·3
0·75
1·0
1·5
1·5
2·03·0
1·0
4·06·0
8·3
�10
�5
0
5
100
2·0
4·0
6·0
8·0
10
Fig. 5. Radial stress contours during installation shown at twoscales, normalised by qc, shown in %: (a) ‘moving’ conditions atend of each push (�9rm); (b) ‘stationary’ at end of each pause (�9rs).Dashed curves show locus connecting maxima developed in eachcase
σ � �z qc
σ � �r /q Kc P
2R
O
r R/ 0·29�
r R/ 2� r R/ 3�
h R/ 0·5�r R/ 1�
σ� rm
c/
: %q
r R/2520151050
0
5
10
15
20
25
30
35
66 cm (CPT1)z �
19 cm (Mini-ICP1)�z55 cm (Mini-ICP1)�z83 cm (Mini-ICP1)�z43 cm (Mini-ICP2)�z70 cm (Mini-ICP2)�z27 cm (Mini-ICP3)�z46 cm (Min -ICP3)�z73 cm (Mini-ICP3)�z
Contour fit
10
σ� rm
c/
: %q
r R/1
1
10
30
3035
1/3 at / 0·29σ � � �r cq r R
�1·225
Raw measurementsLogarithmic fit / 2r R �
1
0·2
20
20
Fig. 6. Non-dimensional ‘moving’ radial stresses developed ath/R 0.5 during penetration
618 JARDINE, ZHU, FORAY AND YANG
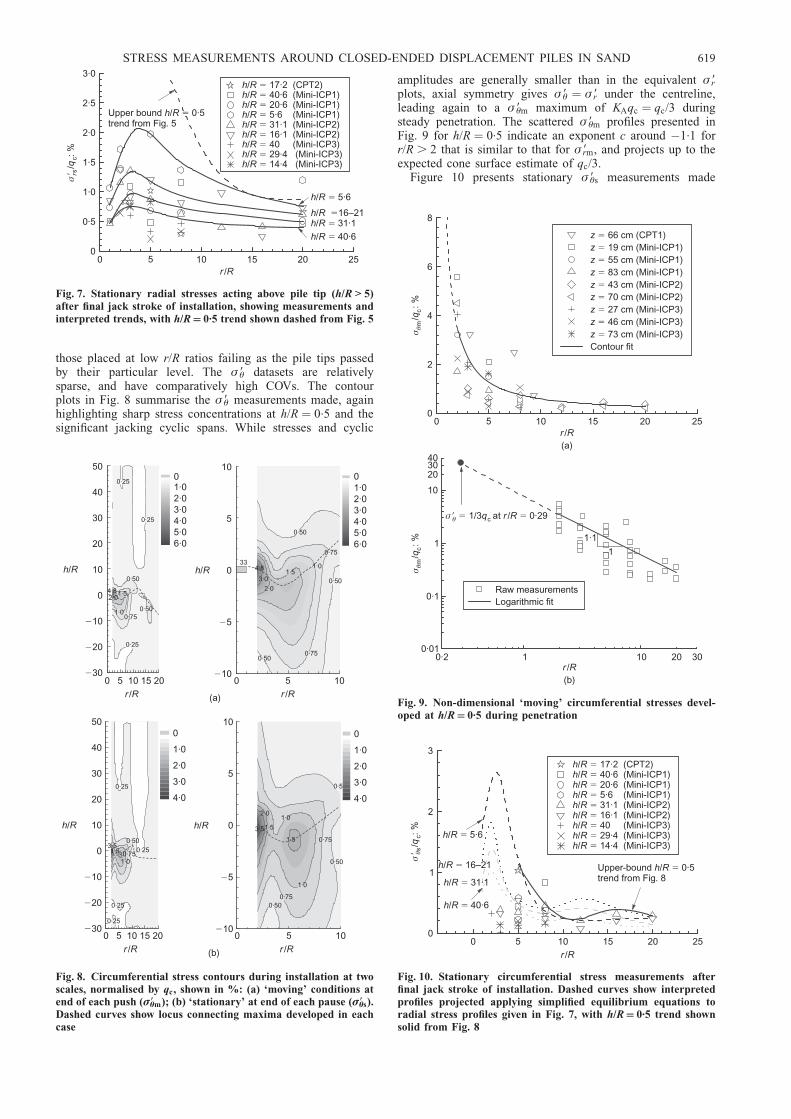
those placed at low r/R ratios failing as the pile tips passedby their particular level. The � 9Ł datasets are relativelysparse, and have comparatively high COVs. The contourplots in Fig. 8 summarise the � 9Ł measurements made, againhighlighting sharp stress concentrations at h/R ¼ 0.5 and thesignificant jacking cyclic spans. While stresses and cyclic
amplitudes are generally smaller than in the equivalent � 9rplots, axial symmetry gives � 9Ł ¼ � 9r under the centreline,leading again to a � 9Łm maximum of KAqc ¼ qc/3 duringsteady penetration. The scattered � 9Łm profiles presented inFig. 9 for h/R ¼ 0.5 indicate an exponent c around �1.1 forr/R . 2 that is similar to that for � 9rm, and projects up to theexpected cone surface estimate of qc/3.
Figure 10 presents stationary � 9Łs measurements madeσ� rs
c/
: %q
r R/2520151050
0
0·5
1·0
1·5
2·0
2·5
3·017·2 (CPT2)�h R/40·6 (Mini-ICP1)�h R/20·6 (Mini-ICP1)�h R/5·6 (Mini-ICP1)�h R/31·1 (Mini-ICP2)�h R/16·1 (Mini-ICP2)�h R/40 (Mini-ICP3)�h R/29·4 (Mini-ICP3)�h R/14·4 (Mini-ICP3)�h R/
h R/ 5·6�
h R/ 16–21�h R/ 31·1�
h R/ 40·6�
Upper bound / 0·5h R �trend from Fig. 5
Fig. 7. Stationary radial stresses acting above pile tip (h/R > 5)after final jack stroke of installation, showing measurements andinterpreted trends, with h/R 0.5 trend shown dashed from Fig. 5
h R/
2015105
r R/
h R/
r R/105
0·25
0·25
0·25
0·50
0·751·0
1·52·0
0·50
0�30
�20
�10
0
10
20
30
40
5001·02·03·04·05·06·0
4·8
0·500·75
0·75
0·50
1·01·5
0·502·0
3·0
4·8
0�10
�5
0
5
1001·02·03·04·05·06·0
33
(a)
h R/
2015105
r R/
h R/
r R/1050 0
(b)
0·25
0·25
0·25
0·250·50
0·751·0
1·5
�30
�20
�10
0
10
20
30
40
500
1·0
2·0
3·0
4·0
3·50·75
0·75
0·5
1·0
1·0
0·50
0·50
1·5
2·0
3·5
1·5
�10
�5
0
5
100
1·0
2·0
3·0
4·0
Fig. 8. Circumferential stress contours during installation at twoscales, normalised by qc, shown in %: (a) ‘moving’ conditions atend of each push (�9Łm); (b) ‘stationary’ at end of each pause (�9Łs).Dashed curves show locus connecting maxima developed in eachcase
2015105r R/(a)
σ θm
c/
: %q
r R/(b)
10
σ θm
c/
: %q
0 250
2
4
6
8
66 cm (CPT1)z �
19 cm (Mini-ICP1)�z55 cm (Mini-ICP1)�z83 cm (Mini-ICP1)�z43 cm (Mini-ICP2)�z70 cm (Mini-ICP2)�z27 cm (Mini-ICP3)�z46 cm (Mini-ICP3)�z73 cm (Mini-ICP3)�z
Contour fit
10·01
0·1
1
10
3020
4030
1/3 at / 0·29σ � � �θ cq r R
1
�1·1
Raw measurementsLogarithmic fit
0·2
20
Fig. 9. Non-dimensional ‘moving’ circumferential stresses devel-oped at h/R 0.5 during penetration
r R/252015105
σ� θs
c/
: %q
00
1
2
3
/ 17·2 (CPT2)h R �40·6 (Mini-ICP1)�h R/20·6 (Mini-ICP1)�h R/5·6 (Mini-ICP1)�h R/31·1 (Mini-ICP2)�h R/16·1 (Mini-ICP2)�h R/40 (Mini-ICP3)�h R/29·4 (Mini-ICP3)�h R/14·4 (Mini-ICP3)�h R/
h R/ 5·6�
h R/ 16–21�
h R/ 31·1�
h R/ 40·6�
Upper-bound / 0·5h R �trend from Fig. 8
Fig. 10. Stationary circumferential stress measurements afterfinal jack stroke of installation. Dashed curves show interpretedprofiles projected applying simplified equilibrium equations toradial stress profiles given in Fig. 7, with h/R 0.5 trend shownsolid from Fig. 8
STRESS MEASUREMENTS AROUND CLOSED-ENDED DISPLACEMENT PILES IN SAND 619
above the tip after the final jack stroke. As explained above,there are very few data for r/R , 5. The degree of scatter,which increases with h/R, makes it hard to establish cleartrends, and the measurements made at low r/R may not bereliable. Further insight into the near-field conditions can begained from the more comprehensive and reliable radialstress dataset interpreted by considering the equilibriumrelationships between � 9Łs and � 9rs: As outlined in Appendix2, � 9Ł curves were derived (for points above the tip zone,with h/R . 5) by applying the simplified cylindrical equili-brium equation (3) to the interpreted � 9rs trends given in Fig.7. The results are sensitive to the � 9rs/qc –r/R distributionshapes, and iteration was required to produce an integratedinterpretation of the combined experimental dataset.
� 9Ł ¼ � 9r þ r@� 9r
@r(3)
The interpreted � 9Łs trends, shown as dashed curves inFig. 10, were constructed by numerical differentiation andmanipulation of the curves drawn in Fig. 7 through thescattered � 9rs datasets. While their detailed shapes cannotbe considered to be fully reliable, the assessment over the1 , r/R , 3 range of high � 9Łs=qc ratios that exceed� 9rs=qc is a secure and inescapable consequence of substi-tuting into equation (3) the firm experimental evidencethat @� 9rs=@r is positive over this ‘near-field’ range. Theprojections are broadly comparable with the scatteredmeasurements made at 5 , r/R , 20, and the stationary h/R ¼ 0.5 trend from Fig. 8, but pass above the sparser andpotentially less reliable measurements made at r/R ¼ 2and 3.
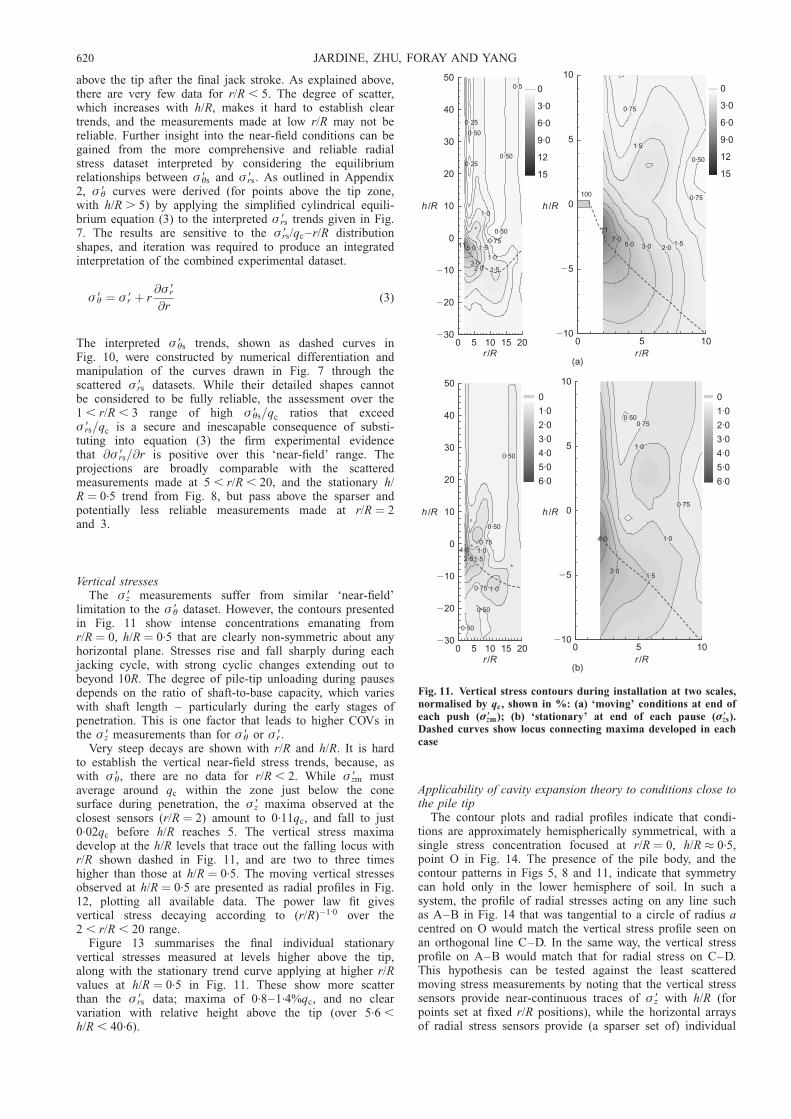
Vertical stressesThe � 9z measurements suffer from similar ‘near-field’
limitation to the � 9Ł dataset. However, the contours presentedin Fig. 11 show intense concentrations emanating fromr/R ¼ 0, h/R ¼ 0.5 that are clearly non-symmetric about anyhorizontal plane. Stresses rise and fall sharply during eachjacking cycle, with strong cyclic changes extending out tobeyond 10R. The degree of pile-tip unloading during pausesdepends on the ratio of shaft-to-base capacity, which varieswith shaft length – particularly during the early stages ofpenetration. This is one factor that leads to higher COVs inthe � 9z measurements than for � 9Ł or � 9r:
Very steep decays are shown with r/R and h/R. It is hardto establish the vertical near-field stress trends, because, aswith � 9Ł, there are no data for r/R , 2. While � 9zm mustaverage around qc within the zone just below the conesurface during penetration, the � 9z maxima observed at theclosest sensors (r/R ¼ 2) amount to 0.11qc, and fall to just0.02qc before h/R reaches 5. The vertical stress maximadevelop at the h/R levels that trace out the falling locus withr/R shown dashed in Fig. 11, and are two to three timeshigher than those at h/R ¼ 0.5. The moving vertical stressesobserved at h/R ¼ 0.5 are presented as radial profiles in Fig.12, plotting all available data. The power law fit givesvertical stress decaying according to (r/R)�1:0 over the2 , r/R , 20 range.
Figure 13 summarises the final individual stationaryvertical stresses measured at levels higher above the tip,along with the stationary trend curve applying at higher r/Rvalues at h/R ¼ 0.5 in Fig. 11. These show more scatterthan the � 9rs data; maxima of 0.8–1.4%qc, and no clearvariation with relative height above the tip (over 5.6 ,h/R , 40.6).
Applicability of cavity expansion theory to conditions close tothe pile tip
The contour plots and radial profiles indicate that condi-tions are approximately hemispherically symmetrical, with asingle stress concentration focused at r/R ¼ 0, h/R � 0.5,point O in Fig. 14. The presence of the pile body, and thecontour patterns in Figs 5, 8 and 11, indicate that symmetrycan hold only in the lower hemisphere of soil. In such asystem, the profile of radial stresses acting on any line suchas A–B in Fig. 14 that was tangential to a circle of radius acentred on O would match the vertical stress profile seen onan orthogonal line C–D. In the same way, the vertical stressprofile on A–B would match that for radial stress on C–D.This hypothesis can be tested against the least scatteredmoving stress measurements by noting that the vertical stresssensors provide near-continuous traces of � 9z with h/R (forpoints set at fixed r/R positions), while the horizontal arraysof radial stress sensors provide (a sparser set of) individual
(a)
h R/
r R/2015105 105
r R/
h R/
0·75
0·50
0·50
1·0
1·0
1·5
0·50
2·0
0·5
3·0
5·0
0·25
1·5
0·25
0�30
�20
�10
0
10
20
30
40
500
3·0
6·0
9·0
12
15
11 2·01·5
1·5
3·0
0·75
5·0
0·75
7·0
0·50
11
0�10
�5
0
5
10
0
3·0
6·0
9·0
12
15
100
(b)
h R/
r R/2015105 105
r R/
h R/
0 0
0·50
0·50
0·50
0·75
0·75
1·01·52·0
1·0
0·50
�30
�20
�10
0
10
20
30
40
50
0
1·0
2·0
3·0
4·0
5·0
6·0
4·0
1·0
1·5
0·75
0·75
2·0
4·0
1·0
0·50
�10
�5
0
5
10
0
1·0
2·0
3·0
4·0
5·0
6·0
Fig. 11. Vertical stress contours during installation at two scales,normalised by qc, shown in %: (a) ‘moving’ conditions at end ofeach push (�9zm); (b) ‘stationary’ at end of each pause (�9zs).Dashed curves show locus connecting maxima developed in eachcase
620 JARDINE, ZHU, FORAY AND YANG
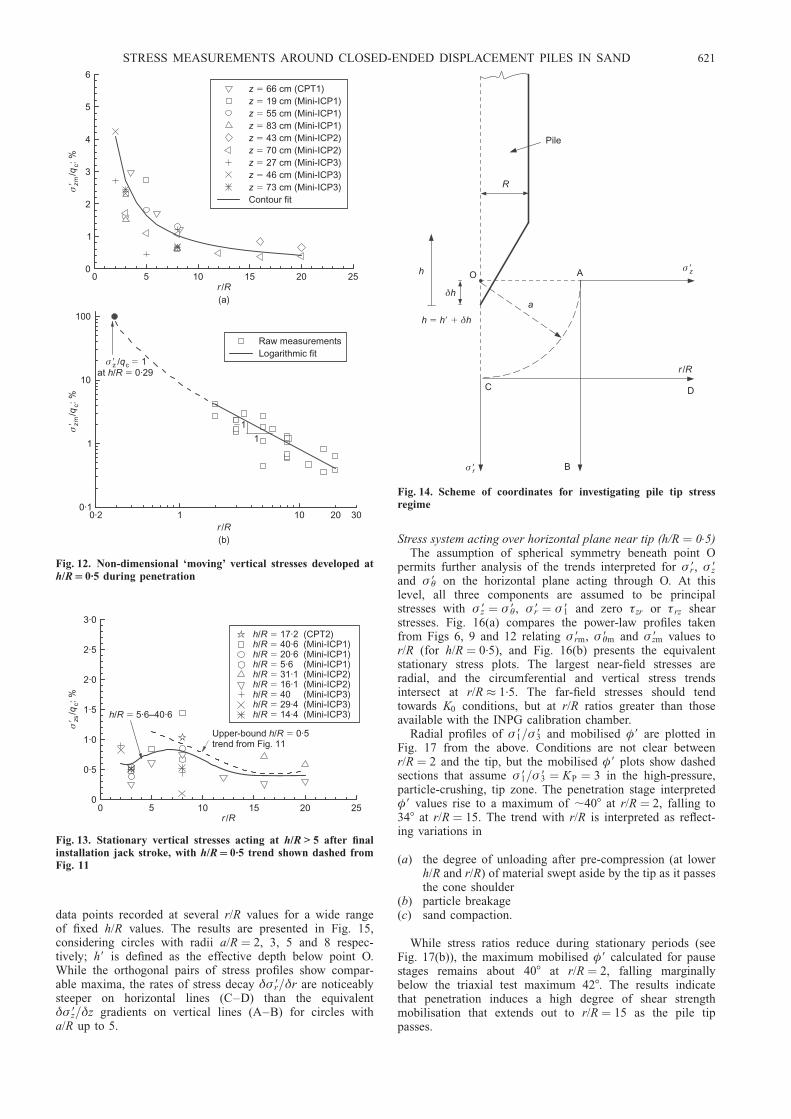
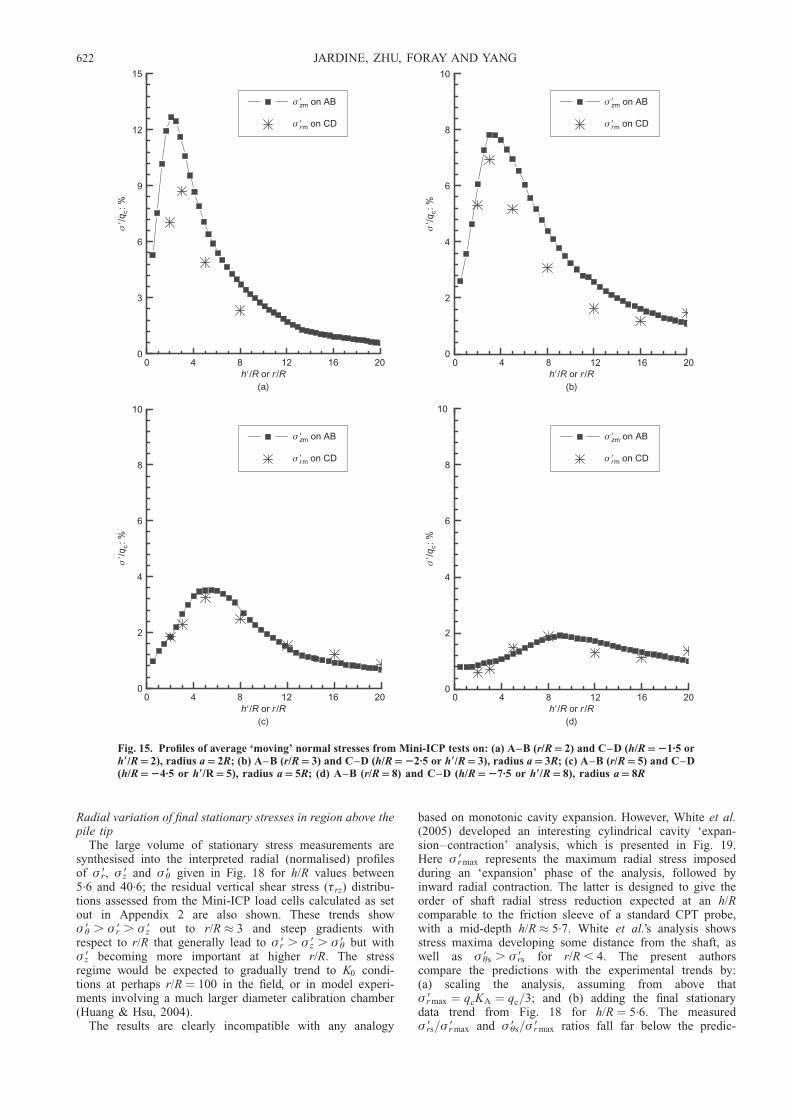
data points recorded at several r/R values for a wide rangeof fixed h/R values. The results are presented in Fig. 15,considering circles with radii a/R ¼ 2, 3, 5 and 8 respec-tively; h9 is defined as the effective depth below point O.While the orthogonal pairs of stress profiles show compar-able maxima, the rates of stress decay �� 9r=�r are noticeablysteeper on horizontal lines (C–D) than the equivalent�� 9z=�z gradients on vertical lines (A–B) for circles witha/R up to 5.
Stress system acting over horizontal plane near tip (h/R ¼ 0.5)The assumption of spherical symmetry beneath point O
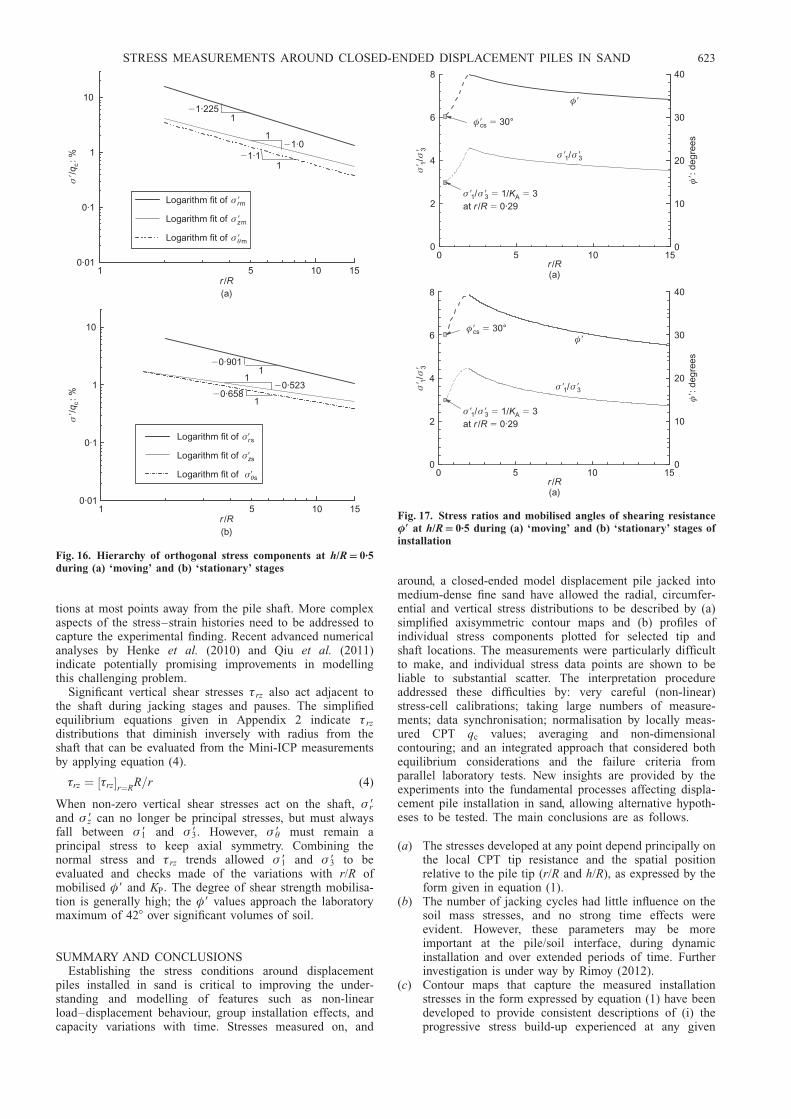
permits further analysis of the trends interpreted for � 9r, � 9zand � 9Ł on the horizontal plane acting through O. At thislevel, all three components are assumed to be principalstresses with � 9z ¼ � 9Ł, � 9r ¼ � 91 and zero �zr or �rz shearstresses. Fig. 16(a) compares the power-law profiles takenfrom Figs 6, 9 and 12 relating � 9rm, � 9Łm and � 9zm values tor/R (for h/R ¼ 0.5), and Fig. 16(b) presents the equivalentstationary stress plots. The largest near-field stresses areradial, and the circumferential and vertical stress trendsintersect at r/R � 1.5. The far-field stresses should tendtowards K0 conditions, but at r/R ratios greater than thoseavailable with the INPG calibration chamber.
Radial profiles of � 91=� 93 and mobilised �9 are plotted inFig. 17 from the above. Conditions are not clear betweenr/R ¼ 2 and the tip, but the mobilised �9 plots show dashedsections that assume � 91=� 93 ¼ KP ¼ 3 in the high-pressure,particle-crushing, tip zone. The penetration stage interpreted�9 values rise to a maximum of ,408 at r/R ¼ 2, falling to348 at r/R ¼ 15. The trend with r/R is interpreted as reflect-ing variations in
(a) the degree of unloading after pre-compression (at lowerh/R and r/R) of material swept aside by the tip as it passesthe cone shoulder
(b) particle breakage(c) sand compaction.
While stress ratios reduce during stationary periods (seeFig. 17(b)), the maximum mobilised �9 calculated for pausestages remains about 408 at r/R ¼ 2, falling marginallybelow the triaxial test maximum 428. The results indicatethat penetration induces a high degree of shear strengthmobilisation that extends out to r/R ¼ 15 as the pile tippasses.
σ� zm
c/
: %q
252015105r R/(a)
10
σ� zm
c/
: %q
r R/(b)
00
1
2
3
4
5
6
66 cm (CPT1)z �
19 cm (Mini-ICP1)�z55 cm (Mini-ICP1)�z83 cm (Mini-ICP1)�z43 cm (Mini-ICP2)�z70 cm (Mini-ICP2)�z27 cm (Mini-ICP3)�z46 cm (Mini-ICP3)�z73 cm (Mini-ICP3)�z
Contour fit
10·1
1
10
100
30
σ � ��
z c/ 1at / 0·29
qh R
1
�1
Raw measurementsLogarithmic fit
0·2 20
Fig. 12. Non-dimensional ‘moving’ vertical stresses developed ath/R 0.5 during penetration
252015105r R/
σ� zs
c/
: %q
00
0·5
1·0
1·5
2·0
2·5
3·0
/ 17·2 (CPT2)h R �40·6 (Mini-ICP1)�h R/20·6 (Mini-ICP1)�h R/5·6 (Mini-ICP1)�h R/31·1 (Mini-ICP2)�h R/16·1 (Mini-ICP2)�h R/40 (Mini-ICP3)�h R/29·4 (Mini-ICP3)�h R/14·4 (Mini-ICP3)�h R/h R/ 5·6–40·6�
Upper-bound / 0·5h R �trend from Fig. 11
Fig. 13. Stationary vertical stresses acting at h/R > 5 after finalinstallation jack stroke, with h/R 0.5 trend shown dashed fromFig. 11
A
h h h� � � δ
σ �r
σ �z
R
O
δh
Pile
h
B
C D
r R/
a
Fig. 14. Scheme of coordinates for investigating pile tip stressregime
STRESS MEASUREMENTS AROUND CLOSED-ENDED DISPLACEMENT PILES IN SAND 621
Radial variation of final stationary stresses in region above thepile tip
The large volume of stationary stress measurements aresynthesised into the interpreted radial (normalised) profilesof � 9r, � 9z and � 9Ł given in Fig. 18 for h/R values between5.6 and 40.6; the residual vertical shear stress (�rz) distribu-tions assessed from the Mini-ICP load cells calculated as setout in Appendix 2 are also shown. These trends show� 9Ł . � 9r . � 9z out to r/R � 3 and steep gradients withrespect to r/R that generally lead to � 9r . � 9z . � 9Ł but with� 9z becoming more important at higher r/R. The stressregime would be expected to gradually trend to K0 condi-tions at perhaps r/R ¼ 100 in the field, or in model experi-ments involving a much larger diameter calibration chamber(Huang & Hsu, 2004).
The results are clearly incompatible with any analogy
based on monotonic cavity expansion. However, White et al.(2005) developed an interesting cylindrical cavity ‘expan-sion–contraction’ analysis, which is presented in Fig. 19.Here � 9r max represents the maximum radial stress imposedduring an ‘expansion’ phase of the analysis, followed byinward radial contraction. The latter is designed to give theorder of shaft radial stress reduction expected at an h/Rcomparable to the friction sleeve of a standard CPT probe,with a mid-depth h/R � 5.7. White et al.’s analysis showsstress maxima developing some distance from the shaft, aswell as � 9Łs . � 9rs for r/R , 4. The present authorscompare the predictions with the experimental trends by:(a) scaling the analysis, assuming from above that� 9r max ¼ qcKA ¼ qc=3; and (b) adding the final stationarydata trend from Fig. 18 for h/R ¼ 5.6. The measured� 9rs=� 9r max and � 9Łs=� 9r max ratios fall far below the predic-
σ�/
: %q c
20161284h R r R�/ or /
(c)
σ �zm on AB
σ �rm on CD
σ�/
: %q c
20161284h R r R�/ or /
(d)
σ �zm on AB
σ �rm on CD
0
σ�/
: %q c
20161284h R r R�/ or /
(a)
σ �zm on AB
σ �rm on CD
σ�/
: %q c
20161284h R r R�/ or /
(b)
σ �zm on AB
σ �rm on CD
000
3
6
9
12
15
0
0
2
4
6
8
10
0
2
4
6
8
10
0
2
4
6
8
10
Fig. 15. Profiles of average ‘moving’ normal stresses from Mini-ICP tests on: (a) A–B (r/R 2) and C–D (h/R 21.5 orh9/R 2), radius a 2R; (b) A–B (r/R 3) and C–D (h/R 22.5 or h9/R 3), radius a 3R; (c) A–B (r/R 5) and C–D(h/R 24.5 or h9/R 5), radius a 5R; (d) A–B (r/R 8) and C–D (h/R 27.5 or h9/R 8), radius a 8R
622 JARDINE, ZHU, FORAY AND YANG
tions at most points away from the pile shaft. More complexaspects of the stress–strain histories need to be addressed tocapture the experimental finding. Recent advanced numericalanalyses by Henke et al. (2010) and Qiu et al. (2011)indicate potentially promising improvements in modellingthis challenging problem.
Significant vertical shear stresses �rz also act adjacent tothe shaft during jacking stages and pauses. The simplifiedequilibrium equations given in Appendix 2 indicate �rz
distributions that diminish inversely with radius from theshaft that can be evaluated from the Mini-ICP measurementsby applying equation (4).
�rz ¼ �rz½ �r¼RR=r (4)
When non-zero vertical shear stresses act on the shaft, � 9rand � 9z can no longer be principal stresses, but must alwaysfall between � 91 and � 93: However, � 9Ł must remain aprincipal stress to keep axial symmetry. Combining thenormal stress and �rz trends allowed � 91 and � 93 to beevaluated and checks made of the variations with r/R ofmobilised �9 and KP: The degree of shear strength mobilisa-tion is generally high; the �9 values approach the laboratorymaximum of 428 over significant volumes of soil.
SUMMARY AND CONCLUSIONSEstablishing the stress conditions around displacement
piles installed in sand is critical to improving the under-standing and modelling of features such as non-linearload–displacement behaviour, group installation effects, andcapacity variations with time. Stresses measured on, and
around, a closed-ended model displacement pile jacked intomedium-dense fine sand have allowed the radial, circumfer-ential and vertical stress distributions to be described by (a)simplified axisymmetric contour maps and (b) profiles ofindividual stress components plotted for selected tip andshaft locations. The measurements were particularly difficultto make, and individual stress data points are shown to beliable to substantial scatter. The interpretation procedureaddressed these difficulties by: very careful (non-linear)stress-cell calibrations; taking large numbers of measure-ments; data synchronisation; normalisation by locally meas-ured CPT qc values; averaging and non-dimensionalcontouring; and an integrated approach that considered bothequilibrium considerations and the failure criteria fromparallel laboratory tests. New insights are provided by theexperiments into the fundamental processes affecting displa-cement pile installation in sand, allowing alternative hypoth-eses to be tested. The main conclusions are as follows.
(a) The stresses developed at any point depend principally onthe local CPT tip resistance and the spatial positionrelative to the pile tip (r/R and h/R), as expressed by theform given in equation (1).
(b) The number of jacking cycles had little influence on thesoil mass stresses, and no strong time effects wereevident. However, these parameters may be moreimportant at the pile/soil interface, during dynamicinstallation and over extended periods of time. Furtherinvestigation is under way by Rimoy (2012).
(c) Contour maps that capture the measured installationstresses in the form expressed by equation (1) have beendeveloped to provide consistent descriptions of (i) theprogressive stress build-up experienced at any given
10
σ�/
: %q c
r R/(a)
1
10
1
σ�/
: %q c
r R/(b)
10·01
0·1
1
10
5
�0·523
1
1�0·658
�0·901
Logarithm fit of σ�rs
Logarithm fit of σ�zs
Logarithm fit of σ�θs
15
10·01
0·1
1
10
5
�1·01
1�1·1
�1·225
Logarithm fit of σ �rm
Logarithm fit of σ �zm
Logarithm fit of σ �θm
15
Fig. 16. Hierarchy of orthogonal stress components at h/R 0.5during (a) ‘moving’ and (b) ‘stationary’ stages
σ� 1
/σ� 3
15105r R/(a)
φ�:
deg
rees
σ �1/σ �3
σ �1/σ �3 � �1/ 3KA
at / 0·29r R �
φ�
φ� �cs 30°
15105
σ� 1
/σ� 3
r R/(a)
φ�:
deg
rees
σ �1/σ �3
σ �1/σ �3 � �1/ 3KA
at / 0·29r R �
φ�φ� �cs 30°
00
2
4
6
8
0
10
20
30
40
00
2
4
6
8
0
10
20
30
40
Fig. 17. Stress ratios and mobilised angles of shearing resistance�9 at h/R 0.5 during (a) ‘moving’ and (b) ‘stationary’ stages ofinstallation
STRESS MEASUREMENTS AROUND CLOSED-ENDED DISPLACEMENT PILES IN SAND 623
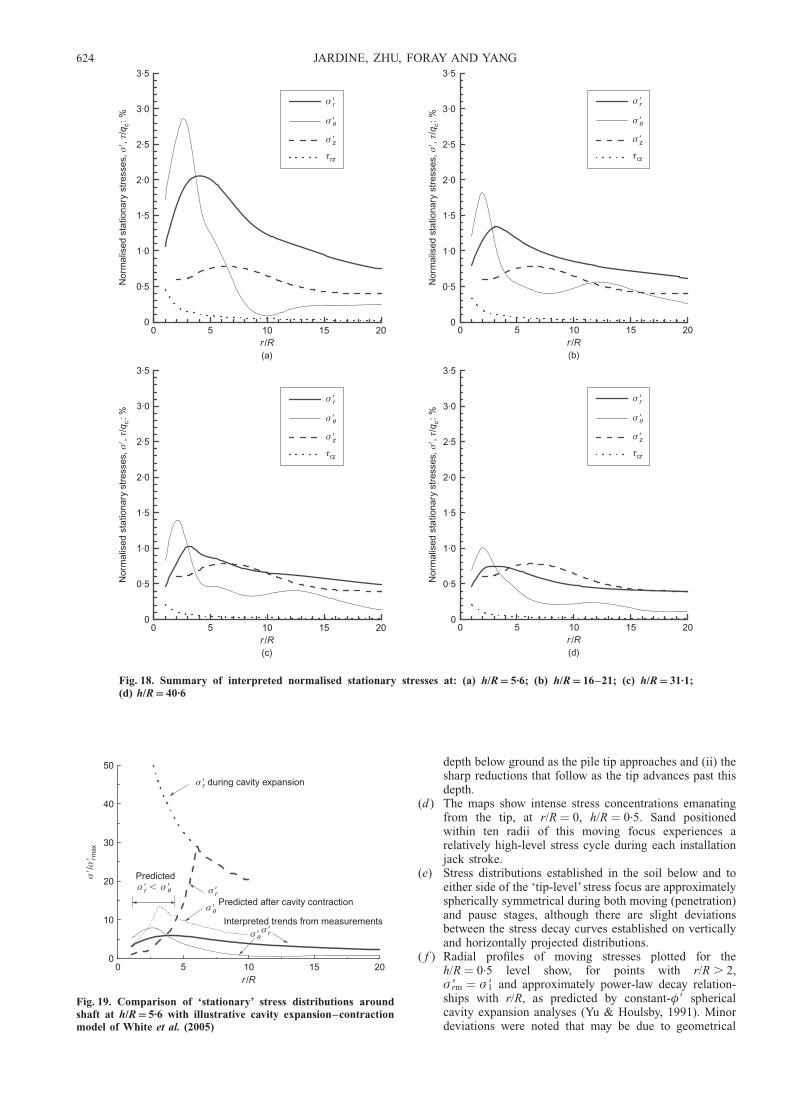
depth below ground as the pile tip approaches and (ii) thesharp reductions that follow as the tip advances past thisdepth.
(d ) The maps show intense stress concentrations emanatingfrom the tip, at r/R ¼ 0, h/R ¼ 0.5. Sand positionedwithin ten radii of this moving focus experiences arelatively high-level stress cycle during each installationjack stroke.
(e) Stress distributions established in the soil below and toeither side of the ‘tip-level’ stress focus are approximatelyspherically symmetrical during both moving (penetration)and pause stages, although there are slight deviationsbetween the stress decay curves established on verticallyand horizontally projected distributions.
( f ) Radial profiles of moving stresses plotted for theh/R ¼ 0.5 level show, for points with r/R . 2,� 9rm ¼ � 91 and approximately power-law decay relation-ships with r/R, as predicted by constant-�9 sphericalcavity expansion analyses (Yu & Houlsby, 1991). Minordeviations were noted that may be due to geometrical
0
0·5
1·0
1·5
2·0
2·5
3·0
3·5
Nor
mal
ised
sta
tiona
ry s
tres
ses,
,/
: %σ
τ�
q c
2015105r R/(a)
σ �r
σ �θ
σ �z
τrz
2015105r R/(b)
σ �r
σ �θ
σ �z
τrz
0
Nor
mal
ised
sta
tiona
ry s
tres
ses,
,/
: %σ
τ�
q c
2015105r R/(c)
σ �r
σ �θ
σ �z
τrz
2015105r R/(d)
σ �r
σ �θ
σ �z
τrz
00
Nor
mal
ised
sta
tiona
ry s
tres
ses,
,/
: %σ
τ�
q c
00
0·5
1·0
1·5
2·0
2·5
3·0
3·5
Nor
mal
ised
sta
tiona
ry s
tres
ses,
,/
: %σ
τ�
q c
0
0·5
1·0
1·5
2·0
2·5
3·0
3·5
0
0·5
1·0
1·5
2·0
2·5
3·0
3·5
Fig. 18. Summary of interpreted normalised stationary stresses at: (a) h/R 5.6; (b) h/R 16–21; (c) h/R 31.1;(d) h/R 40.6
2015105r R/
σσ
��
/rm
ax
σ �r
σ �θ
σ �rσ �θ
00
10
20
30
40
50
Interpreted trends from measurements
during cavity expansionσ �r
Predictedσ � �r σ �θ
Predicted after cavity contraction
Fig. 19. Comparison of ‘stationary’ stress distributions aroundshaft at h/R 5.6 with illustrative cavity expansion–contractionmodel of White et al. (2005)
624 JARDINE, ZHU, FORAY AND YANG
idealisation, mobilised �9 variations, or differences instress level, degree of unloading, particle breakage andcompaction.
(g) Very steep stress gradients apply close to the pile tip, withtriaxial compression dominating immediately beneath thetip, where � 9z ¼ � 91 � qc and � 9rm ¼ � 9Łm ¼ qc=KP:
(h) The stress distributions interpreted for r/R . 2 ath/R ¼ 0.5 imply high mobilised �9 values around thepile tip, even under zero pile-head loads. The highestinterpreted �9 is close to the maxima developed intriaxial tests that matched the local stress and strainhistory.
(i) The radial stress regime applying after installationdisplays maxima at normalised significant radial dis-tances of around r/R ¼ 3 that are about double thoseacting on the shaft (r/R ¼ 1). The radial stresses all decaywith radius at r/R . 3, and, for any given r/R, � 9rm=qc
falls systematically with h/R.( j) Consideration of the radial equations of equilibrium
indicates that circumferential stresses must also varysteeply over the 1 , r/R , 5 range. Analysis indicatesthat � 9rs , � 9Łm over 1 , r/R , 3 after installation,although practical limitations made this feature impos-sible to observe directly.
(k) The observation of radial stress maxima at some radialdistance from the shaft is in qualitative agreement withillustrative cylindrical cavity expansion–contraction ana-lyses by White et al. (2005). However, the measuredstress magnitudes fall considerably below their analyticalestimates. Additional aspects of the installation processneed to be considered, as in recent numerical analyses byHenke et al. (2010) and Qiu et al. (2011).
(l ) Yang et al. (2010) interpret the dip in radial stressesdeveloped above the tip at r/R , 3 as being due to thestrain paths developed around the pile tip, as well as theeffects of cyclic loading, particle breakage, creep andstress relaxation. These processes persist as penetrationcontinues, and are thought to contribute to the steadydecline with h/R of shaft � 9rs seen in field and laboratorytests.
(m) Simplified analyses of the stationary stress regimeapplying around the pile shaft indicate distributions ofmobilised �9 that are plausible in comparison withlaboratory test trends, showing a generally high degree ofshear strength mobilisation.
ACKNOWLEDGEMENTSThe research described was funded by Shell UK Limited,
the UK Health and Safety Executive, the UK EngineeringPhysical Sciences Research Council, Total France, and theUK Royal Society and the Natural Science Foundation ofChina (Nos. 51011130162 and 51178421). Their support isgratefully acknowledged. The authors acknowledge gratefullythe contributions of Dr Mark Emerson, Dr Satoshi Nishi-mura, Dr Cristina Tsuha, Mr Jean-Benoit Toni, Mr SteveAckerley, Mr Clive Dalton, Mr Siya Rimoy, Mr BernardRey, Mr Alan Bolsher, Mr Matias Silva and Mr FrancescoLa Malfa.
APPENDIX 1: PROCEDURES FOR DATA REDUCTIONAND PROCESSING
As outlined in Tables 1–3, the CPT and three Mini-ICP testsemployed multiple vertical, radial and circumferential sensors tomeasure � 9z, � 9r and � 9Ł: The strategy for data reduction andprocessing involved using combined sets considering single stresscomponents and fixed r/R position. The number of representative‘moving peak’ and ‘stationary minima’ interpreted from each soil
stress cell varied between 50 and 200 per test, depending on the jackstroke lengths and measurement intervals employed for theinstallation. The spread of results obtained for each particular sensortype and position was relatively broad (see Figs 3 and 4).
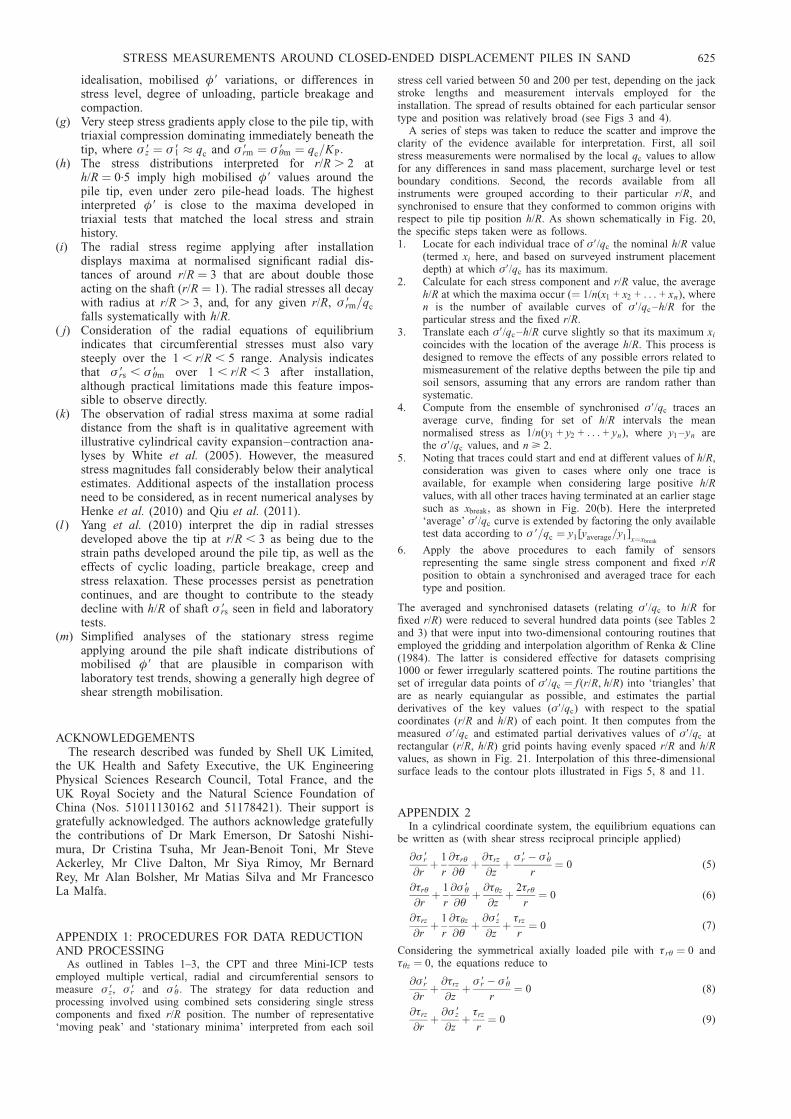
A series of steps was taken to reduce the scatter and improve theclarity of the evidence available for interpretation. First, all soilstress measurements were normalised by the local qc values to allowfor any differences in sand mass placement, surcharge level or testboundary conditions. Second, the records available from allinstruments were grouped according to their particular r/R, andsynchronised to ensure that they conformed to common origins withrespect to pile tip position h/R. As shown schematically in Fig. 20,the specific steps taken were as follows.1. Locate for each individual trace of �9/qc the nominal h/R value
(termed xi here, and based on surveyed instrument placementdepth) at which �9/qc has its maximum.
2. Calculate for each stress component and r/R value, the averageh/R at which the maxima occur (¼ 1/n(x1 + x2 + . . . + xn), wheren is the number of available curves of �9/qc –h/R for theparticular stress and the fixed r/R.
3. Translate each �9/qc –h/R curve slightly so that its maximum xi
coincides with the location of the average h/R. This process isdesigned to remove the effects of any possible errors related tomismeasurement of the relative depths between the pile tip andsoil sensors, assuming that any errors are random rather thansystematic.
4. Compute from the ensemble of synchronised �9/qc traces anaverage curve, finding for set of h/R intervals the meannormalised stress as 1/n(y1 + y2 + . . . + yn), where y1 –yn arethe �9/qc values, and n > 2.
5. Noting that traces could start and end at different values of h/R,consideration was given to cases where only one trace isavailable, for example when considering large positive h/Rvalues, with all other traces having terminated at an earlier stagesuch as xbreak, as shown in Fig. 20(b). Here the interpreted‘average’ �9/qc curve is extended by factoring the only availabletest data according to � 9=qc ¼ y1[yaverage=y1]
x¼xbreak
6. Apply the above procedures to each family of sensorsrepresenting the same single stress component and fixed r/Rposition to obtain a synchronised and averaged trace for eachtype and position.
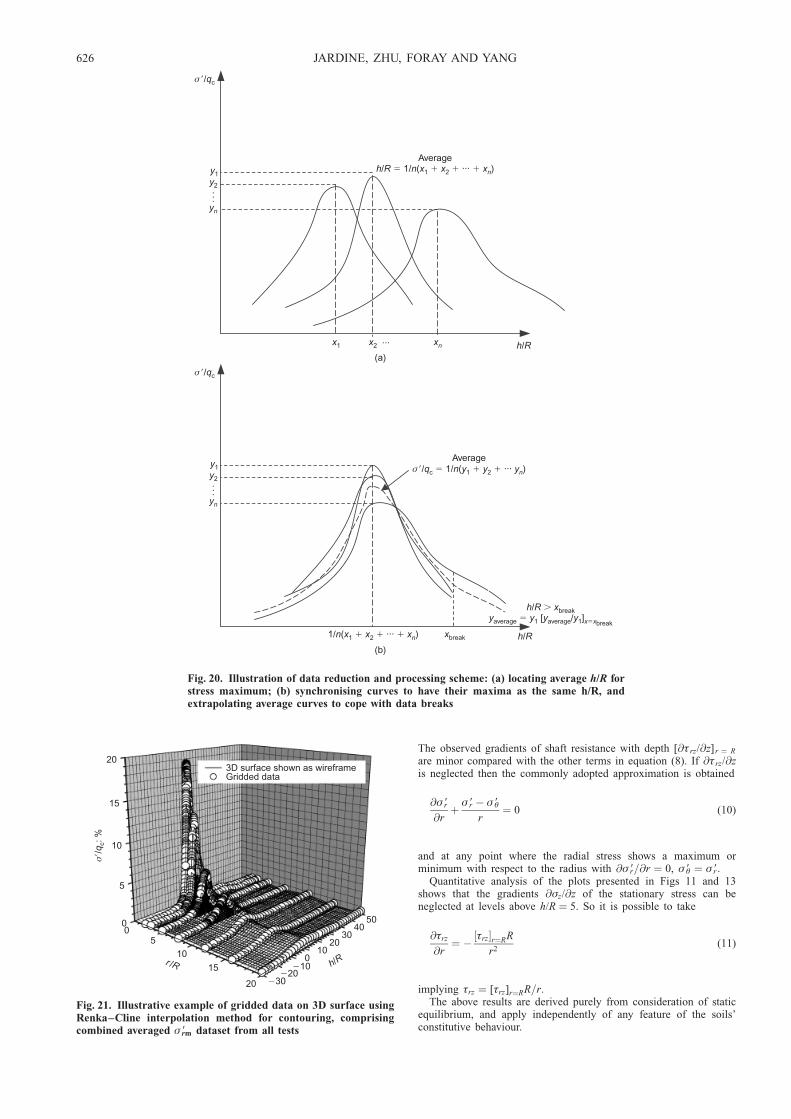
The averaged and synchronised datasets (relating �9/qc to h/R forfixed r/R) were reduced to several hundred data points (see Tables 2and 3) that were input into two-dimensional contouring routines thatemployed the gridding and interpolation algorithm of Renka & Cline(1984). The latter is considered effective for datasets comprising1000 or fewer irregularly scattered points. The routine partitions theset of irregular data points of �9/qc ¼ f (r/R, h/R) into ‘triangles’ thatare as nearly equiangular as possible, and estimates the partialderivatives of the key values (�9/qc) with respect to the spatialcoordinates (r/R and h/R) of each point. It then computes from themeasured �9/qc and estimated partial derivatives values of �9/qc atrectangular (r/R, h/R) grid points having evenly spaced r/R and h/Rvalues, as shown in Fig. 21. Interpolation of this three-dimensionalsurface leads to the contour plots illustrated in Figs 5, 8 and 11.
APPENDIX 2In a cylindrical coordinate system, the equilibrium equations can
be written as (with shear stress reciprocal principle applied)
@� 9r
@rþ 1
r
@�rŁ
@Łþ @�rz
@zþ � 9r � � 9Ł
r¼ 0 (5)
@�rŁ
@rþ 1
r
@� 9Ł
@Łþ @�Łz
@zþ 2�rŁ
r¼ 0 (6)
@�rz
@rþ 1
r
@�Łz
@Łþ @� 9z
@zþ �rz
r¼ 0 (7)
Considering the symmetrical axially loaded pile with �rŁ ¼ 0 and�Łz ¼ 0, the equations reduce to
@� 9r
@rþ @�rz
@zþ � 9r � � 9Ł
r¼ 0 (8)
@�rz
@rþ @� 9z
@zþ �rz
r¼ 0 (9)
STRESS MEASUREMENTS AROUND CLOSED-ENDED DISPLACEMENT PILES IN SAND 625
The observed gradients of shaft resistance with depth [@�rz/@z]r ¼ R
are minor compared with the other terms in equation (8). If @�rz/@zis neglected then the commonly adopted approximation is obtained
@� 9r
@rþ � 9r � � 9Ł
r¼ 0 (10)
and at any point where the radial stress shows a maximum orminimum with respect to the radius with @� 9r=@r ¼ 0, � 9Ł ¼ � 9r:
Quantitative analysis of the plots presented in Figs 11 and 13shows that the gradients @�z/@z of the stationary stress can beneglected at levels above h/R ¼ 5. So it is possible to take
@�rz
@r¼ � ½�rz�r¼RR
r2(11)
implying �rz ¼ [�rz]r¼RR=r:The above results are derived purely from consideration of static
equilibrium, and apply independently of any feature of the soils’constitutive behaviour.
σ �/qc
y1y2···
x2 ··· h R/x1 xn
yn
Average/ 1/ ( ··· )h R n x x x� � � �1 2 n
(a)
σ �/qc
y1y2···
yn
1/ ( ··· )n x x x1 2� � � n
h R xy y y y
/[ / ]�
�break
average 1 average 1 breakx x�
(b)
h R/
Average/ 1/ ( ··· )σ � � � �q n y y yc 1 2 n
xbreak
Fig. 20. Illustration of data reduction and processing scheme: (a) locating average h/R forstress maximum; (b) synchronising curves to have their maxima as the same h/R, andextrapolating average curves to cope with data breaks
20
15
10
5
00
5
10
15
20
r R/
�30�20
�100
1020
3040
50
h R/
σ�/
: %q c
3D surface shown as wireframeGridded data
Fig. 21. Illustrative example of gridded data on 3D surface usingRenka–Cline interpolation method for contouring, comprisingcombined averaged � 9rm dataset from all tests
626 JARDINE, ZHU, FORAY AND YANG
NOTATIONc, m, a coefficients for cavity expansion analysis and radius
from cavity originD50 particle diameter that corresponds to 50% point on
particle size distributionDr relative density of sande0 initial void ratioh height above pile tip
h9 effective depth below point O shown in Fig. 14KA, KP Rankine coefficients of active and passive earth
pressureLp penetration depth of pile tipN number of installation jacking stroke cyclesp9 mean effective stressqc CPT cone resistanceR pile radiusr radius of point from pile axisz depth below sand surface�9 effective angle of interface shearing resistance
� 91, � 92, � 93 major, intermediate and minor principal effectivestresses
� 9r effective radial stress; � 9rm, � 9rs, � 9r max are moving,stationary and maximum values
� 9Ł effective circumferential stress; � 9Łm, � 9Łs, � 9Łmax aremoving, stationary and maximum values
� 9z effective vertical stress; � 9zm, � 9zs, � 9z max are moving,stationary and maximum values
� 9z0 initial vertical stress�rz vertical shear stress on radial surface; �zr
complementary shear stress�rŁ circumferential shear stress on radial surface; �Łr
complementary shear stress�Łz vertical shear stress on circumferential surface; �zŁ
complementary shear stress�9 effective angle of shearing resistance; �9cs critical state
value
REFERENCESAltuhafi, F. & Jardine, R. J. (2011). Effect of particle breakage and
strain path reversal on the properties of sands located near todriven piles. Proc. 5th Int. Symp. on Deformation Character-istics of Geomaterials, Seoul 1, 386–395.
Axelsson, G. (2000). Long-term set-up of driven piles in sand. PhDthesis, Department of Civil and Environmental Engineering,Royal Institute of Technology, Stockholm, Sweden.
Chow, F. C. (1997). Investigations into displacement pile behaviourfor offshore foundations. PhD thesis, Department of Soil Mech-anics, Imperial College, London, UK.
Chow, F. C., Jardine, R. J., Brucy, F. & Nauroy, J. F. (1998). Effectsof time on capacity of pipe piles in dense marine sand.J. Geotech. Geoenviron. Engng ASCE 124, No. 3, 254–264.
Frost, J. D., Hebeler, G. L., Evans, T. M. & DeJong, J. T. (2004).Interface behaviour of granular soils. In Earth and space 2004 (edsR. B. Malla and A. Maji), pp. 65–72. Reston, VA, USA: ASCE.
Henke, S., Qiu, G. & Grabe, J. (2010). A coupled EulerianLagrangian approach to solve geotechnical problems involvinglarge deformations. Proc. 7th Eur. Conf. Numer. Methods Geo-tech. Engng, Trondheim, 233–238.
Huang, A. B. & Hsu, H. H. (2004). Advanced calibration chambersfor cone penetration testing in cohesionless soils. Proc. 2nd Int.Conf. Geotech. Geophys. Site Characterization, Porto, 147–166.
Jardine, R. J., Chow, F. C., Overy, R. F. & Standing, J. R. (2005).ICP design methods for driven piles in sands and clays. London,UK: Thomas Telford.
Jardine, R. J., Standing, J. R. & Chow, F. C. (2006). Someobservations of the effects of time on the capacity of pilesdriven in sand. Geotechnique 56, No. 4, 227–244, http://dx.doi.org/10.1680/geot.2006.56.4.227.
Jardine, R. J., Zhu, B. T., Foray, P. & Dalton, J. C. P. (2009).Experimental arrangements for investigation of soil stressesdeveloped around a displacement pile. Soils Found. 49, No. 5,661–673.
Jardine, R. J., Zhu, B. T., Foray, P. & Yang, Z. X. (2013). Measure-ment of stress field developed around close-ended piles in sand.Geotechnique 63, No. 1, 1–17, http://dx.doi.org/10.1680/geot.9.P.137.
Ho, T. Y. K., Jardine, R. J. & Minh, N. A. (2011). Large displace-ment interface shear between steel and granular media. Geotech-nique 61, No. 3, 221–234, http://dx.doi.org/10.1680/geot.8.P.086.
Lehane, B. M., Jardine, R. J., Bond, A. J. & Frank, R. (1993).Mechanisms of shaft friction in sand from instrumented piletests. J. Geotech. Engng. Div. ASCE 119, No. 1, 19–35.
Qiu, G., Henke, S. & Grabe, J. (2011). Application of a coupledEulerian-Lagrangian approach on geomechanical problems invol-ving large deformations. Comput. Geotech. 38, No. 1, 30–39.
Renka, R. J. & Cline, A. K. (1984). A triangle-based C1 interpola-tion methods. Rocky Mountain J. Math. 14, No. 1, 223–237.
Rimoy, S. (2012). Internal technical report on calibration chamberexperiments. London, UK: Imperial College.
Salgado, R., Mitchell, J. K. & Jamiolkowski, M. (1997). Cavityexpansion and penetration resistance in sand. J. Geotech. Geoen-viron. Engng ASCE 123, No. 4, 344–354.
Vesic, A. S. (1972). Expansion of cavities in infinite soil mass.J. Soil Mech. Found. Div. ASCE 98, No. 3, 265–290.
White, D. J. & Bolton, M. D. (2004). Displacement and strain pathsduring plane-plain model pile installation in sand. Geotechnique54, No. 6, 375–397, http://dx.doi.org/10.1680/geot.2004.54.6.375.
White, D. J., Schneider, J. A. & Lehane, B. M. (2005). Theinfluence of effective area ratio on shaft friction of displacementpiles in sand. Proc. 1st Int. Symp. on Frontiers in OffshoreGeotechnics, Perth, 741–747.
Yang, Z. X., Jardine, R. J., Zhu, B. T., Foray, P. & Tsuha, C. H. C.(2010). Sand grain crushing and interface shearing duringdisplacement pile installation in sand. Geotechnique 60, No. 6,469–482, http://dx.doi.org/10.1680/geot.2010.60.6.469.
Yu, H. S. & Houlsby, G. T. (1991). Finite cavity expansion indilatant soils: loading analysis. Geotechnique 41, No. 2,173–183, http://dx.doi.org/10.1680/geot.1991.41.2.173.
STRESS MEASUREMENTS AROUND CLOSED-ENDED DISPLACEMENT PILES IN SAND 627