Embed Size (px)
Citation preview
1
Interpreting Hemp Proficiency Testing Reports
Program Year 2018
Statistical analysis of data in the Hemp Proficiency Testing Program follows guidelines in ISO 13528 (ISO, 2015). Laboratories are asked to provide the method performed and triplicate results for each sample. Laboratory results are evaluated for trueness and precision. This document presents information on interpreting each of the following reports. a) Laboratory Trueness Report - Individualized lab report evaluating lab’s trueness. b) Laboratory Precision Report - Individualized lab report evaluating lab’s precision. c) Summary Statistics - Summary report comparing analytes and methods. d) Summary All Labs Trueness - Summary report evaluating trueness of all Lab Values. e) Summary All Labs Precision - Summary report evaluating precision of all lab coefficients of variation (CVs). Laboratory Trueness and Precision Reports
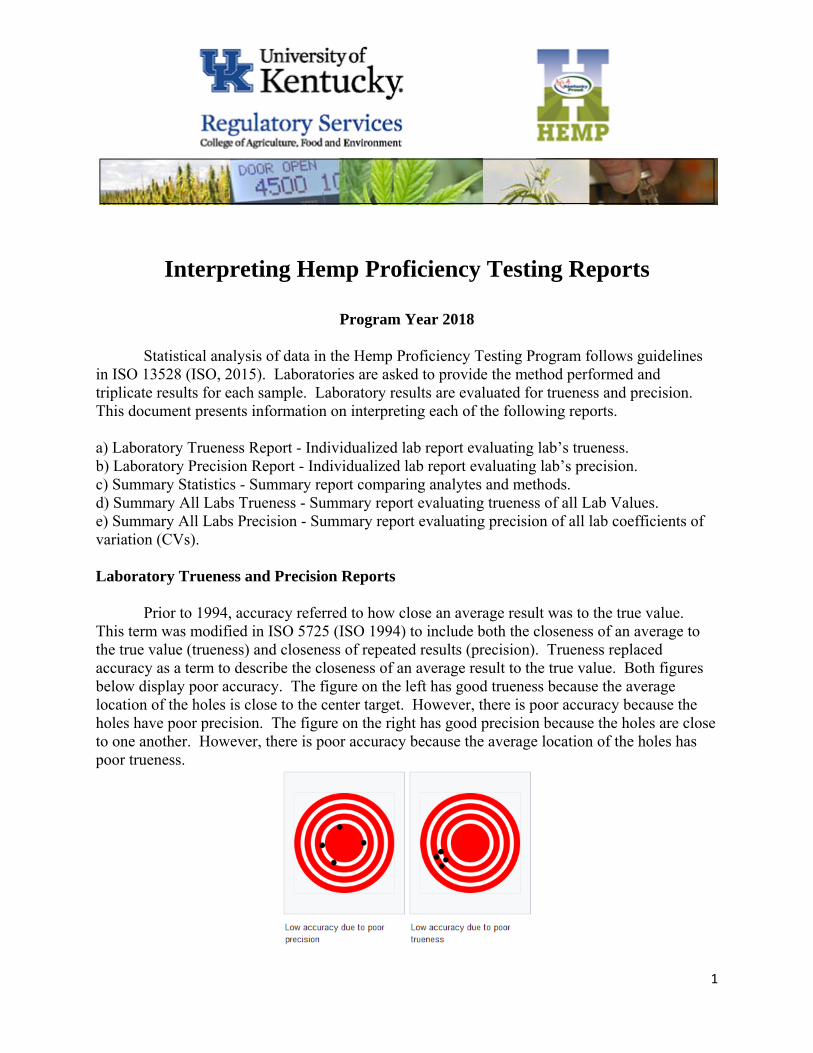
Prior to 1994, accuracy referred to how close an average result was to the true value. This term was modified in ISO 5725 (ISO 1994) to include both the closeness of an average to the true value (trueness) and closeness of repeated results (precision). Trueness replaced accuracy as a term to describe the closeness of an average result to the true value. Both figures below display poor accuracy. The figure on the left has good trueness because the average location of the holes is close to the center target. However, there is poor accuracy because the holes have poor precision. The figure on the right has good precision because the holes are close to one another. However, there is poor accuracy because the average location of the holes has poor trueness.
2
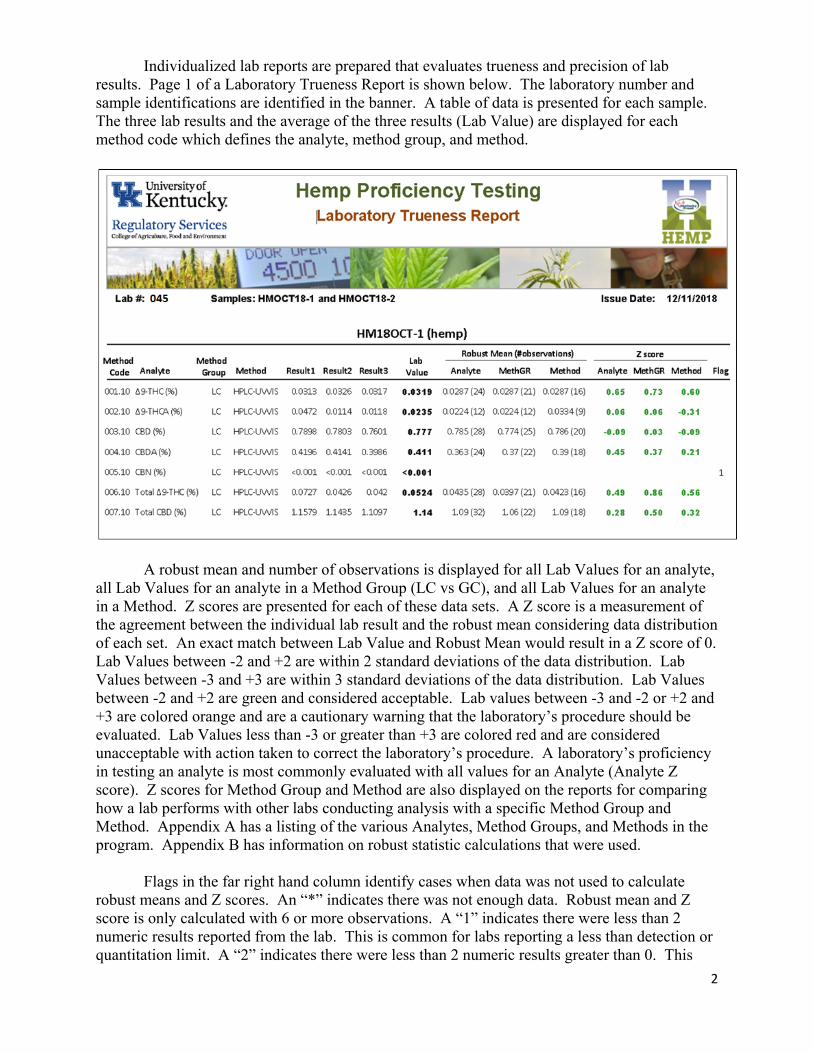
Individualized lab reports are prepared that evaluates trueness and precision of lab
results. Page 1 of a Laboratory Trueness Report is shown below. The laboratory number and sample identifications are identified in the banner. A table of data is presented for each sample. The three lab results and the average of the three results (Lab Value) are displayed for each method code which defines the analyte, method group, and method.
A robust mean and number of observations is displayed for all Lab Values for an analyte,
all Lab Values for an analyte in a Method Group (LC vs GC), and all Lab Values for an analyte in a Method. Z scores are presented for each of these data sets. A Z score is a measurement of the agreement between the individual lab result and the robust mean considering data distribution of each set. An exact match between Lab Value and Robust Mean would result in a Z score of 0. Lab Values between -2 and +2 are within 2 standard deviations of the data distribution. Lab Values between -3 and +3 are within 3 standard deviations of the data distribution. Lab Values between -2 and +2 are green and considered acceptable. Lab values between -3 and -2 or +2 and +3 are colored orange and are a cautionary warning that the laboratory’s procedure should be evaluated. Lab Values less than -3 or greater than +3 are colored red and are considered unacceptable with action taken to correct the laboratory’s procedure. A laboratory’s proficiency in testing an analyte is most commonly evaluated with all values for an Analyte (Analyte Z score). Z scores for Method Group and Method are also displayed on the reports for comparing how a lab performs with other labs conducting analysis with a specific Method Group and Method. Appendix A has a listing of the various Analytes, Method Groups, and Methods in the program. Appendix B has information on robust statistic calculations that were used.
Flags in the far right hand column identify cases when data was not used to calculate
robust means and Z scores. An “*” indicates there was not enough data. Robust mean and Z score is only calculated with 6 or more observations. A “1” indicates there were less than 2 numeric results reported from the lab. This is common for labs reporting a less than detection or quantitation limit. A “2” indicates there were less than 2 numeric results greater than 0. This
3
indicator is used to denote when data is not used because of zero being reported. Appendix C presents rules used for handling nonnumeric results.
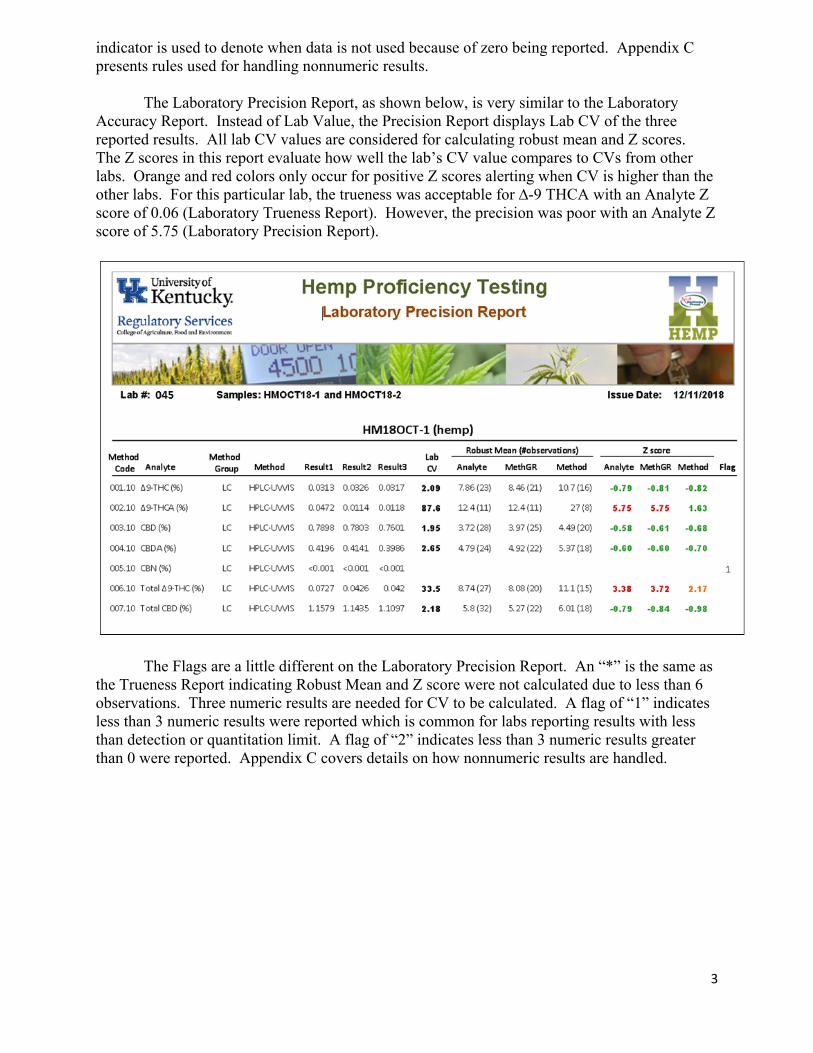
The Laboratory Precision Report, as shown below, is very similar to the Laboratory
Accuracy Report. Instead of Lab Value, the Precision Report displays Lab CV of the three reported results. All lab CV values are considered for calculating robust mean and Z scores. The Z scores in this report evaluate how well the lab’s CV value compares to CVs from other labs. Orange and red colors only occur for positive Z scores alerting when CV is higher than the other labs. For this particular lab, the trueness was acceptable for ∆-9 THCA with an Analyte Z score of 0.06 (Laboratory Trueness Report). However, the precision was poor with an Analyte Z score of 5.75 (Laboratory Precision Report).
The Flags are a little different on the Laboratory Precision Report. An “*” is the same as the Trueness Report indicating Robust Mean and Z score were not calculated due to less than 6 observations. Three numeric results are needed for CV to be calculated. A flag of “1” indicates less than 3 numeric results were reported which is common for labs reporting results with less than detection or quantitation limit. A flag of “2” indicates less than 3 numeric results greater than 0 were reported. Appendix C covers details on how nonnumeric results are handled.
4
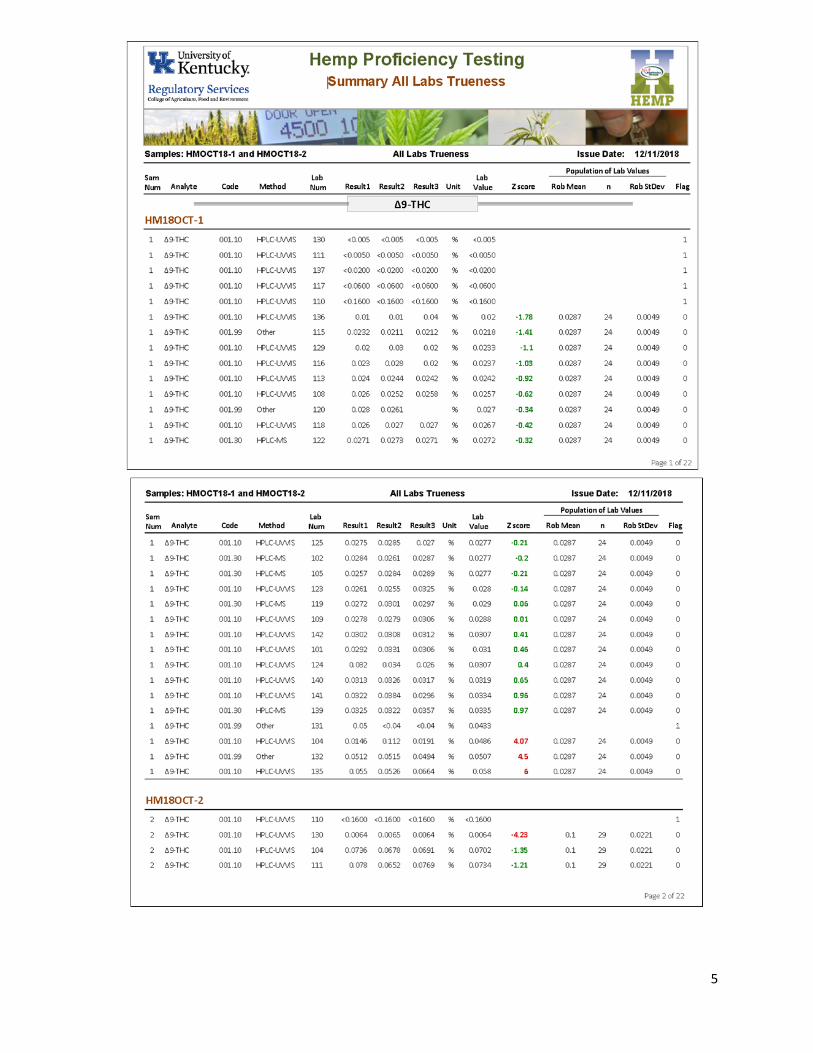
Summary All Labs Trueness Report
The Summary All Labs Trueness report is a multipage report displaying all lab results grouped by Analyte and Sample Number. For each set of Analyte and Sample Number, data is sorted by Lab Value. Page 1 and 2 of the report is shown on page 5. Z scores are also shown in green, orange, and red colors as described for Laboratory Trueness and Precision reports. Flag values other than 0 note Lab Values were not used to calculate robust mean or Z scores due to limited numeric results. This report is useful to compare where an individual Lab Value fell within the range of all Lab Values for an analyte. Although values reported less than a limit of detection or quantitation are not used in the statistical calculations, the report also provides useful information on the lower limits used by various labs.
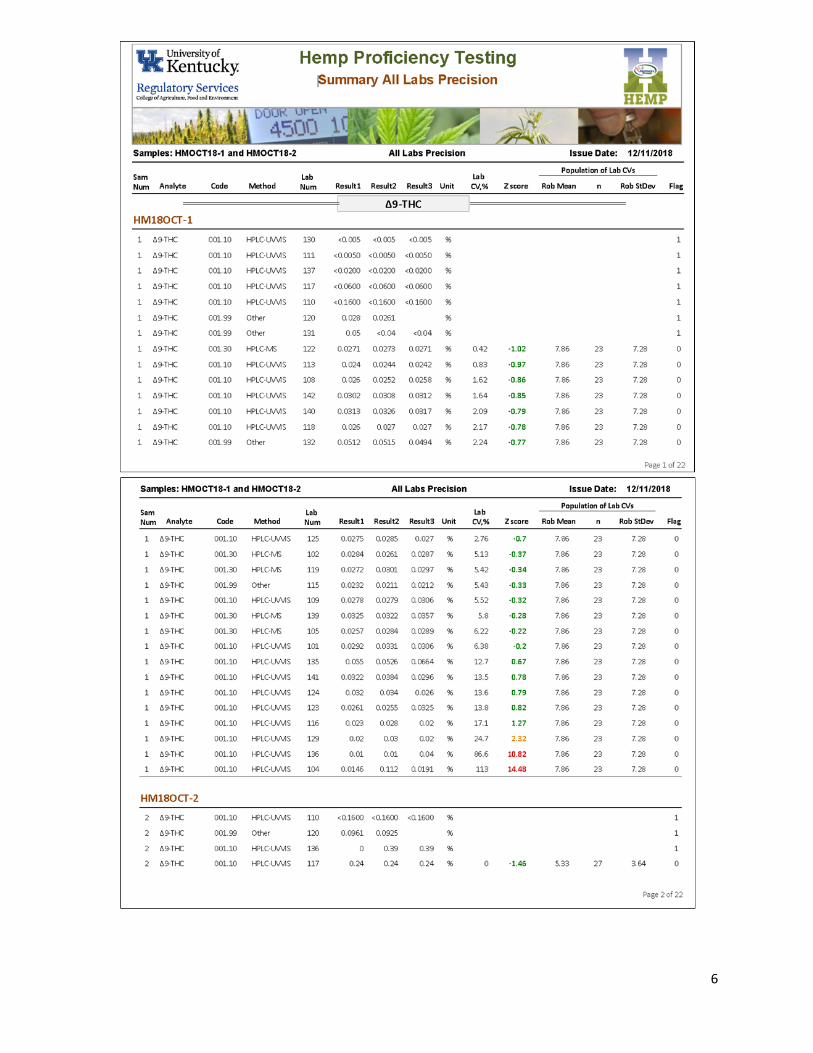
Summary All Labs Precision Report
The Summary All Labs Precision report is a multipage report displaying all lab CVs grouped by Analyte and Sample Number. For each set of Analyte and Sample Number, data is sorted by CV. Page 1 and 2 of the report is shown on page 6. Z scores are also shown in green, orange, and red colors as described for Laboratory Trueness and Precision reports. Flag values other than 0 note CVs were not calculated due to limited numeric results. This report is useful to compare where an individual Lab CV value fell within the range of all Lab CVs for an analyte.
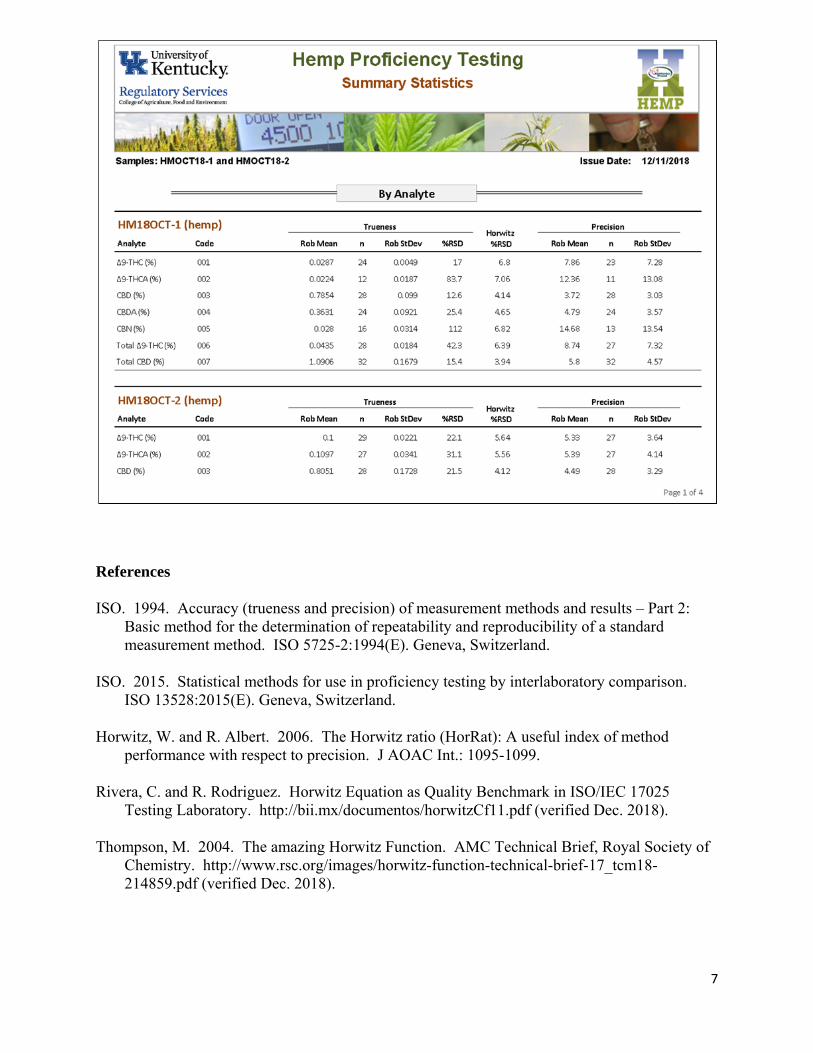
Summary Statistics Report The Summary Statistics report presents robust means, number of observations (n), and robust standard deviation for Lab Values used for trueness evaluation and CVs used for precision evaluation. Page 1 of the report is shown on page 7. Robust means, n, and robust standard deviation are presented for data for an Analyte, Method Group, and Method. The robust means and standard deviation in this report are used for determining lab Z scores presented in the other reports. This report also has % relative standard deviation (%RSD) and Horwitz %RSD for Trueness. The %RSD is the trueness robust standard deviation divided by the trueness robust mean times 100. Horwitz was a scientist who studied results from several collaborative studies and found %RSD for reproducibility from those data followed the formula shown as Horwitz %RSD = 2 x C-0.15
where C is the concentration expressed as dimensionless mass fraction (eg., C = 0.03 for 3%). The Horwitz %RSD is a benchmark value that the trueness %RSD values can be compared against. A reasonable goal would be to have trueness %RSD values for hemp analysts be approximately equal to or less than Horwitz %RSD.
5
6
7
References ISO. 1994. Accuracy (trueness and precision) of measurement methods and results – Part 2:
Basic method for the determination of repeatability and reproducibility of a standard measurement method. ISO 5725-2:1994(E). Geneva, Switzerland.
ISO. 2015. Statistical methods for use in proficiency testing by interlaboratory comparison.
ISO 13528:2015(E). Geneva, Switzerland. Horwitz, W. and R. Albert. 2006. The Horwitz ratio (HorRat): A useful index of method
performance with respect to precision. J AOAC Int.: 1095-1099. Rivera, C. and R. Rodriguez. Horwitz Equation as Quality Benchmark in ISO/IEC 17025
Testing Laboratory. http://bii.mx/documentos/horwitzCf11.pdf (verified Dec. 2018). Thompson, M. 2004. The amazing Horwitz Function. AMC Technical Brief, Royal Society of
Chemistry. http://www.rsc.org/images/horwitz-function-technical-brief-17_tcm18-214859.pdf (verified Dec. 2018).
8
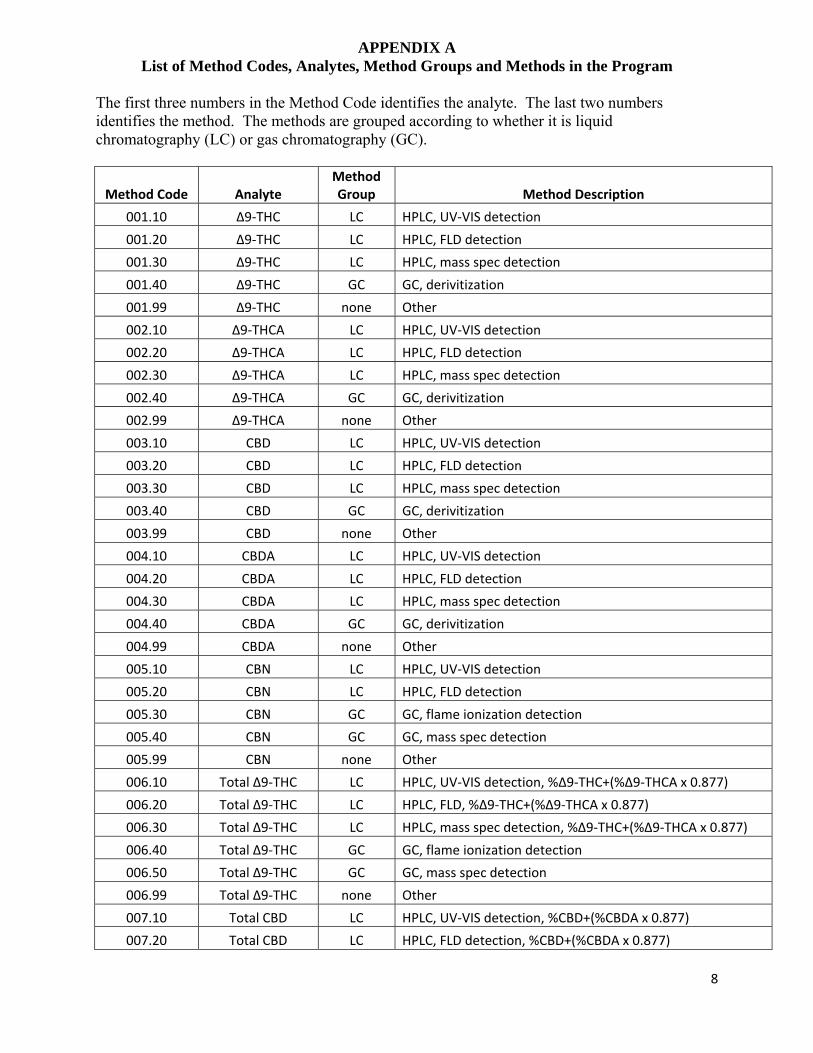
APPENDIX A List of Method Codes, Analytes, Method Groups and Methods in the Program
The first three numbers in the Method Code identifies the analyte. The last two numbers identifies the method. The methods are grouped according to whether it is liquid chromatography (LC) or gas chromatography (GC).
Method Code Analyte Method Group Method Description
001.10 ∆9‐THC LC HPLC, UV‐VIS detection
001.20 ∆9‐THC LC HPLC, FLD detection
001.30 ∆9‐THC LC HPLC, mass spec detection
001.40 ∆9‐THC GC GC, derivitization
001.99 ∆9‐THC none Other
002.10 ∆9‐THCA LC HPLC, UV‐VIS detection
002.20 ∆9‐THCA LC HPLC, FLD detection
002.30 ∆9‐THCA LC HPLC, mass spec detection
002.40 ∆9‐THCA GC GC, derivitization
002.99 ∆9‐THCA none Other
003.10 CBD LC HPLC, UV‐VIS detection
003.20 CBD LC HPLC, FLD detection
003.30 CBD LC HPLC, mass spec detection
003.40 CBD GC GC, derivitization
003.99 CBD none Other
004.10 CBDA LC HPLC, UV‐VIS detection
004.20 CBDA LC HPLC, FLD detection
004.30 CBDA LC HPLC, mass spec detection
004.40 CBDA GC GC, derivitization
004.99 CBDA none Other
005.10 CBN LC HPLC, UV‐VIS detection
005.20 CBN LC HPLC, FLD detection
005.30 CBN GC GC, flame ionization detection
005.40 CBN GC GC, mass spec detection
005.99 CBN none Other
006.10 Total ∆9‐THC LC HPLC, UV‐VIS detection, %∆9‐THC+(%∆9‐THCA x 0.877)
006.20 Total ∆9‐THC LC HPLC, FLD, %∆9‐THC+(%∆9‐THCA x 0.877)
006.30 Total ∆9‐THC LC HPLC, mass spec detection, %∆9‐THC+(%∆9‐THCA x 0.877)
006.40 Total ∆9‐THC GC GC, flame ionization detection
006.50 Total ∆9‐THC GC GC, mass spec detection
006.99 Total ∆9‐THC none Other
007.10 Total CBD LC HPLC, UV‐VIS detection, %CBD+(%CBDA x 0.877)
007.20 Total CBD LC HPLC, FLD detection, %CBD+(%CBDA x 0.877)
9
007.30 Total CBD LC HPLC, mass spec detection, %CBD+(%CBDA x 0.877)
007.40 Total CBD GC GC, flame ionization detection
007.50 Total CBD GC GC, mass spec detection
007.99 Total CBD none Other
500.10 Moisture none Water content by oven drying (wt loss on drying / sample wt x 100)
500.99 Moisture none Other
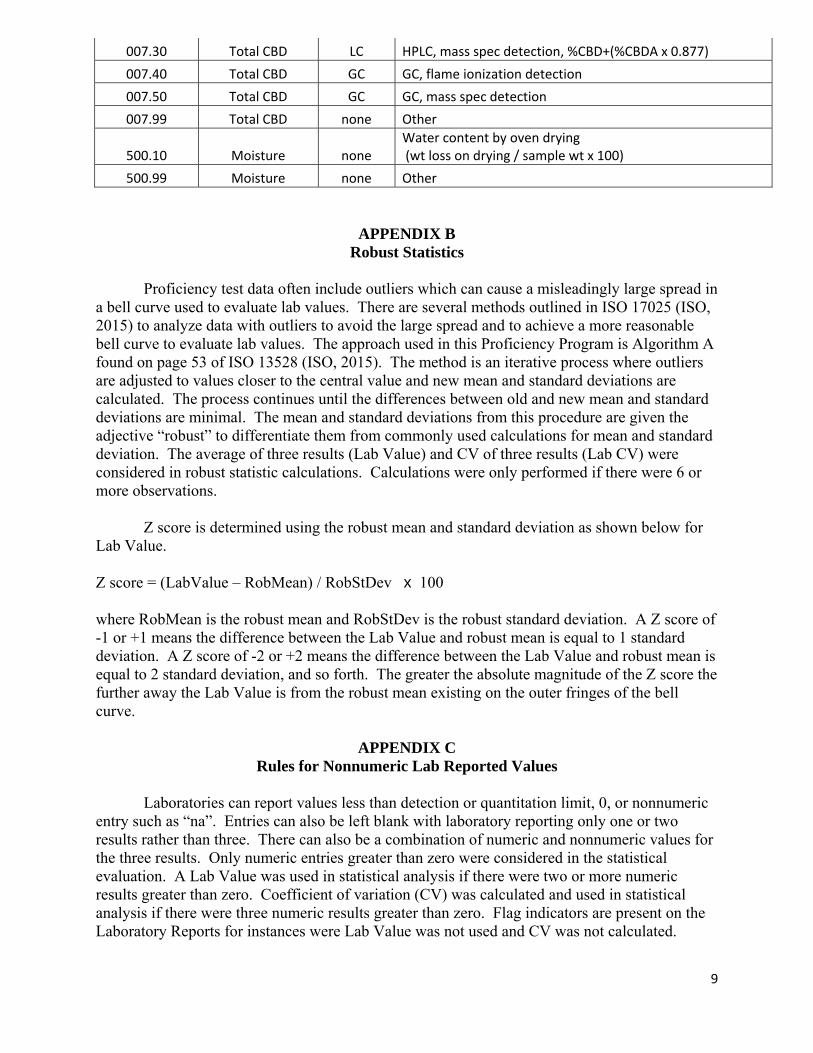
APPENDIX B Robust Statistics
Proficiency test data often include outliers which can cause a misleadingly large spread in
a bell curve used to evaluate lab values. There are several methods outlined in ISO 17025 (ISO, 2015) to analyze data with outliers to avoid the large spread and to achieve a more reasonable bell curve to evaluate lab values. The approach used in this Proficiency Program is Algorithm A found on page 53 of ISO 13528 (ISO, 2015). The method is an iterative process where outliers are adjusted to values closer to the central value and new mean and standard deviations are calculated. The process continues until the differences between old and new mean and standard deviations are minimal. The mean and standard deviations from this procedure are given the adjective “robust” to differentiate them from commonly used calculations for mean and standard deviation. The average of three results (Lab Value) and CV of three results (Lab CV) were considered in robust statistic calculations. Calculations were only performed if there were 6 or more observations.
Z score is determined using the robust mean and standard deviation as shown below for
Lab Value.
Z score = (LabValue – RobMean) / RobStDev x 100 where RobMean is the robust mean and RobStDev is the robust standard deviation. A Z score of -1 or +1 means the difference between the Lab Value and robust mean is equal to 1 standard deviation. A Z score of -2 or +2 means the difference between the Lab Value and robust mean is equal to 2 standard deviation, and so forth. The greater the absolute magnitude of the Z score the further away the Lab Value is from the robust mean existing on the outer fringes of the bell curve.
APPENDIX C
Rules for Nonnumeric Lab Reported Values
Laboratories can report values less than detection or quantitation limit, 0, or nonnumeric entry such as “na”. Entries can also be left blank with laboratory reporting only one or two results rather than three. There can also be a combination of numeric and nonnumeric values for the three results. Only numeric entries greater than zero were considered in the statistical evaluation. A Lab Value was used in statistical analysis if there were two or more numeric results greater than zero. Coefficient of variation (CV) was calculated and used in statistical analysis if there were three numeric results greater than zero. Flag indicators are present on the Laboratory Reports for instances were Lab Value was not used and CV was not calculated.