Embed Size (px)
Citation preview
Clinical Science and Molecular Medicine (1973) 45,417428.
INTERRELATIONSHIPS BETWEEN BLOOD PRESSURE, RENIN, RENIN SUBSTRATE A N D BLOOD VOLUME
I N TERMINAL RENAL FAILURE
M . A. D. H . SCHALEKAMP, M. P. A. SCHALEKAMP-KUYKEN, M. DE MOOR-FRUYTIER, TH. MEININGER,
Department of Internal Medicine, Zuiderziekenhuis, Rotterdam, The Netherlanh
D. J . VAANDRAGER-KRANENBURG A N D W. H. BIRKENHAGER
(Received 9 May 1973)
SUMMARY 1. The effect of haemodialysis on blood pressure was assessed in forty-six patients
with end-stage kidney disease, in relation to measurements of plasma renin con- centration (PRC), plasma renin substrate (PRS) and blood volume. Parallel measure- ments of PRC and blood volume were carried out before and during the period of regular dialysis treatment. PRS was measured during this period only.
2. Both before and during regular dialysis PRC was higher in relation to blood volume in patients whose hypertension persisted after fluid withdrawal than in cases who became normotensive. PRS levels were similar in both groups.
3. The decrease of blood volume by regular dialysis led to a rise in plasma renin both in patients with controllable hypertension and in those with persistent hypertension. After at least 5 months of regular dialysis, the acute removal of 1.5 litres of body fluid caused a similar percentage rise in PRC in six patients with persistent hyper- tension and twelve patients with controllable hypertension. In three other patients with controllable hypertension and very low PRC, PRC was unresponsive both to the acute and the chronic volume depletion. 4. The pressor response to exogenous angiotensin in anephric patients, in whom no
renin could be detected in the plasma, was decreased after ultrafiltration. This was caused by an increase in the threshold dose and not by a decrease in the slope of the dose-response relationship. This effect of ultrafiltration was due to fluid loss itself rather than to a rise in endogenous angiotensin.
5. The results indicate that the presence of hypertension in the face of fluid loss reflects a disturbance in renin release which is rather associated with the pathologic state of the kidney than with an excessive stimulus to the kidney. The decrease in sensitivity to angiotensin caused by fluid loss is presumably overridden by the effect of a high renin level.
Correspondence: Dr W. H. BirkenhBger, Department of Internal Medicine, Zuiderziekenhuis, Groeneveld 15 Rotterdam, The Netherlands.
417
418 M. A . D. H . Schalekamp et al.
Key words : hypertension, renal failure, renin, renin substrate, blood volume.
Both the activity of the renin-angiotensin system and the state of fluid balance are thought to be involved in the pathogenesis of hypertension in terminal renal failure (Brown, Dusterdieck, Fraser, Lever, Robertson, Tree & Weir, 1971 ; Ledingham, 1971). In the majority of patients on maintenance haemodialysis, hypertension is obviously due to fluid expansion, since blood pressure can be controlled by adjustments of fluid balance. In a minority of patients hyper- tension is shown to be resistant to vigorous attempts to decrease body fluid volumes. This refractory type of hypertension has been ascribed to inappropriate activity of the renin- angiotensin system. Several authors have reported that plasma renin levels were increased in patients with resistant hypertension, and not in those with controllable hypertension (Vertes, Cangiano, Berman & Gould, 1969; Weidmann, Maxwell, Lupu, Lewin & Massry, 1971). In other studies the renin values in these patient groups showed a large area of overlap (Safar, Fendler, Weil, Beuve-Mtry, Brisset, Idatte, Meyer & Milliez, 1970; Stokes, Mani & Stewart, 1970; Wilkinson, Scott, Uldall, Kerr & Swinney, 1970; Verniory, Potvliege, Van Geertruyden, Vereerstraeten, Kinnaert, Staroukine & Toussaint, 1972), or even no difference at all (Nielsen, Clausen & Jensen, 1970). Patients with chronic renal failure can still produce a rise in plasma renin in response to fluid removal. The variations in renin levels between differ- ent dialysis centres may therefore be partly due to the varying tenacity of attempts to treat hypertension by means of dietary sodium and fluid restriction and by fluid removal during dialysis. It is still uncertain whether the occurrence of increased renin levels in patients on regular dialysis treatment should be considered as a primary phenomenon or as secondary to excessive fluid depletion.
The purpose of the present study was to evaluate the role of renin in relation to fluid balance in hypertensive patients with end-stage kidney disease. In the first place plasma renin con- centration (PRC), plasma renin substrate (PRS) and blood volume were measured. Secondly we studied the pressor response to infusions of angiotensin at different levels of fluid balance in nephrectomized patients whose plasma renin was undetectable.
SUBJECTS A N D METHODS
Forty-six patients (twenty-eight men, eighteen women), aged between 16 and 60 years, were investigated. Haemodialysis was performed twice a week with a Kiil-type dialyser. The duration of each dialysis was between 8 and 10 h. Hypertension was treated by dietary sodium restriction and by ultrafiltration, either until a recumbent diastolic pressure below 95 mmHg was attained, or adverse symptoms related to fluid loss occurred. In twenty-eight patients (Group 1) blood pressure could be decreased to normal with these conservative measures without serious side- effects. In some of them recurrence of mild hypertension with diastolic pressures between 95 and 105 mmHg was noted during the 2 or 3 days interval between successive dialysis periods. But this form of hypertension could be easily kept under control with a more strict regime. The underlying kidney diseases in group 1 were glomerulonephritis (twenty cases), pyelo- nephritis (four), and hereditary nephritis (four). In eighteen patients (Group 2) satisfactory control of blood pressure could not be achieved by conservative measures. These patients remained hypertensive, even though body weight was decreased to a level at which further fluid loss caused gross postural hypotension. The duration of regular dialysis treatment was
Renin and blood volume in renal failure 419 not less than 5 months in these cases, with the exception of two patients who were on mainten- ance dialysis for 2 months. Group 2 comprised patients with glomerulonephritis (ten cases), pyelonephritis (two), toxaemia of pregnancy (one), accelerated phase hypertension (three) and unidentified kidney disease, stated as nephrosclerosis (two). Some of these patients received methyldopa at daily dosages of 5OO-1OOO mg, but this drug was stopped at least 14 days before the investigations were started. The patients were allocated to the study from different dialysis centres. Since they were not randomly allocated, no comparisons can be made between the incidence of resistant hypertension in this and other published series. Informed consent was given by all patients.
Blood samples for the measurement of PRC, PRS and blood volume were taken between 09.00 and 10.00 hours, after the patient had been recumbent for at least 1 h. PRC and PRS were estimated after processing the plasma samples and preparing standards of renin sub- strate and plasma renin as described by Skinner (1967). The results are expressed as Asp'-Ile5- angiotensin I equivalents. Asp'-Ile5-angiotensin I was obtained from Schwartz Bioresearch. This preparation is not pure. Its strength was therefore tested by bioassay in the rat against angiotensin II-amide (Hypertension, Ciba). When allowance was made for the impurities present in the angiotensin I standard, as stated by the manufacturer, the pressor activity of both standards on a molar base was found to be equal. This agrees with the results of Tree (1973). In PRC estimations, plasma at a dilution of 1/4 to 1/20 was incubated for 3 h with sheep renin substrate at a concentration of 800 ng/ml, as determined by the PRS method (see below). PRS was estimated by incubating plasma at a dilution of 1/50 for 6 h with human plasma renin from a patient with Bartter's syndrome at a concentration of 450 mg ml-'h-', as determined by the PRC method, by using plasma samples with a PRS level up to 2500 nglml it was shown in a pilot study that during a 6 h period of incubation the concentration of angiotensin had reached a plateau. The angiotensin produced by incubation was measured by radio-immunoassay, by using antibodies against Asp'-Ile5-angiotensin 1, as described by Stockigt, Collins & Biglieri (1971). The concentration of angiotensin I in the incubate did not exceed 50 ng/ml. The normal value of PRC obtained by radio-immunoassay was between 6.0 and 24 ng ml-lh- ' (n = 20). The normal range of PRS was from 550 to 1550 ng/ml(n = 15). As in a previous study from our department, normal individuals were studied during re- cumbency and a Na' intake of 40-60 mmol 1-' day-' (Schalekamp, Schalekamp-Kuyken & Birkenhager, 1970). The 95% confidence limits for reproducibility of results were calculated to be mean & 16% and mean +22% for the assays of PRC and PRS respectively (series of thirty- five separate duplicate assays carried out within 4 weeks). The reproducibility of results in the radio-immunoassay of PRC is similar to that in the bioassay (Schalekamp et al., 1970).
Plasma volume was measured by the l3lI-labe1led serum albumin (RISA) method (Birkenhager, Van Es, Houwing, Lamers & Mulder, 1968). The blood samples were drawn without stasis from an indwelling venous catheter (Braunule), 15, 30, 45 and 60 min after injecting 5 pCi of 1311-labelled serum albumin. The extrapolated zero-time value of plasma radioactivity was used for subsequent calculations. Owing to variations in red cell mass in patients on maintenance dialysis, changes in plasma volume do not reflect changes in total blood volume. In most cases with chronic renal failure plasma volume is increased and this is almost certainly related to anaemia, rather than to generalized overhydration. It was therefore felt that for the purpose of the study blood volume was a more relevant variable than plasma volume. Calculations of blood volume were based on the peripheral venous haematocrit, assuming it
420 M. A . D. H . Schalekamp et al.
to be an index of total body haematocrit (Chaplin, Mollison & Vetter, 1953). Haematocrit was measured by the microcapillary method. A correction for plasma trapping was not applied. Body height rather than weight was used as a reference, in view of alterations in body weight owing to changes in the nutritional status and body fluid volumes. The validity of body height as a reference has been supported by observations in a large number of normal individuals
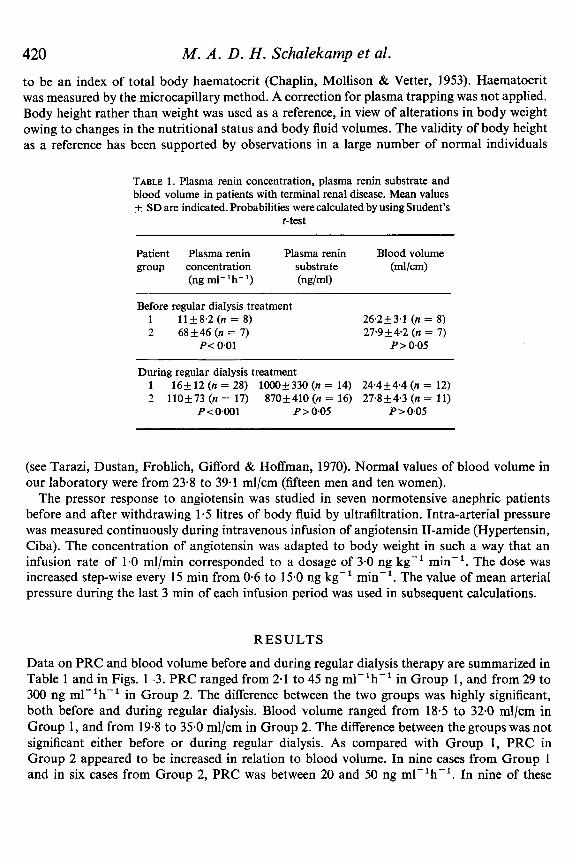
TABLE 1. Plasma renin concentration, plasma renin substrate and blood volume in patients with terminal renal disease. Mean values f SD are indicated. Probabilities were calculated by using Student's
f-test
Patient Plasma renin Plasma renin Blood volume group concentration substrate (ml/cm)
(ng rnl-lh-') (ng/d)
Before regular dialysis treatment 1 l l+8 .2(n = 8) 26.2k3.1 (n = 8) 2 68f46(n= 7) 27.9 f 4 2 (n = 7)
P< 001 P > 0.05
During regular dialysis treatment 1 16f12 (n = 28) 1OOOf330 (n = 14) 24.4f4.4 (n = 12) 2 11Oi-73 (n = 17) 870+410(n = 16) 27.8f4.3 (n = 11)
P < 0~001 P > 0.05 P > 0.05
(see Tarazi, Dustan, Frohlich, Gifford & Hoffman, 1970). Normal values of blood volume in our laboratory were from 23.8 to 39.1 ml/cm (fifteen men and ten women).
The pressor response to angiotensin was studied in seven normotensive anephric patients before and after withdrawing 1-5 litres of body fluid by ultrafiltration. Intra-arterial pressure was measured continuously during intravenous infusion of angiotensin II-amide (Hypertensin, Ciba). The concentration of angiotensin was adapted to body weight in such a way that an infusion rate of 1.0 ml/min corresponded to a dosage of 3.0 ng kg-' min-l. The dose was increased step-wise every 15 min from 0.6 to 15.0 ng kg-' min-'. The value of mean arterial pressure during the last 3 min of each infusion period was used in subsequent calculations.
RESULTS
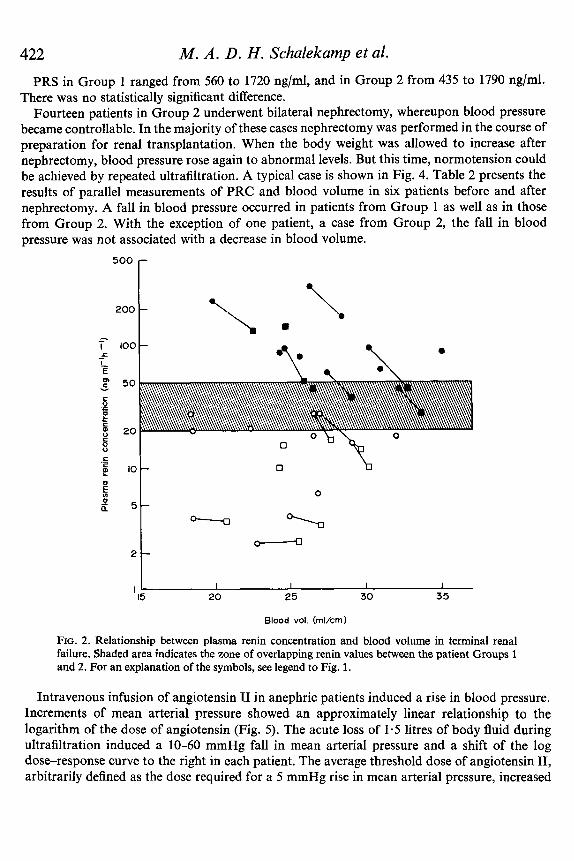
Data on PRC and blood volume before and during regular dialysis therapy are summarized in Table 1 and in Figs. 1-3. PRC ranged from 2.1 to 45 ng ml-'h-' in Group 1, and from 29 to 300 ng ml-lh-' in Group 2. The difference between the two groups was highly significant, both before and during regular dialysis. Blood volume ranged from 18.5 to 32.0 ml/cm in Group 1 , and from 19.8 to 35-0 ml/cm in Group 2. The difference between the groups was not significant either before or during regular dialysis. As compared with Group 1, PRC in Group 2 appeared to be increased in relation to blood volume. In nine cases from Group 1 and in six cases from Group 2, PRC was between 20 and 50 ng ml-'h-'. In nine of these
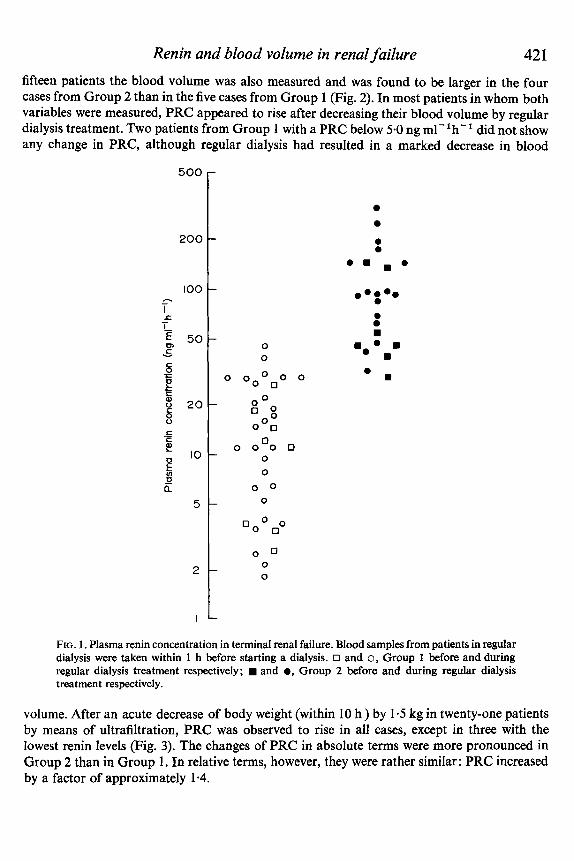
Renin and blood volume in renal failure 421 fifteen patients the blood volume was also measured and was found to be larger in the four cases from Group 2 than in the five cases from Group 1 (Fig. 2). In most patients in whom both variables were measured, PRC appeared to rise after decreasing their blood volume by regular dialysis treatment. Two patients from Group 1 with a PRC below 5.0 ng rnl-lh-' did not show any change in PRC, although regular dialysis had resulted in a marked decrease in blood
500
200
100 - I
I- € 50
LZ
0, C Y
- 6 +
E g 20 8
E 0 ' 0 E
c .-
0 - a 5
2
I
0 0
0 0 0 0 0 0 0
O 0 Qoo" 0 0 0
0 0 0 0 0
0
0 0 0
0 0 0 0
a a
e m . a
a
FIG. 1. Plasma renin concentration in terminal renal failure. Blood samples from patients in regular dialysis were taken within 1 h before starting a dialysis. 0 and 0, Group 1 before and during regular dialysis treatment respectively; and a, Group 2 before and during regular dialysis treatment respectively.
volume. After an acute decrease of body weight (within 10 h ) by 1.5 kg in twenty-one patients by means of ultrafiltration, PRC was observed to rise in all cases, except in three with the lowest renin levels (Fig. 3). The changes of PRC in absolute terms were more pronounced in Group 2 than in Group 1. In relative terms, however, they were rather similar: PRC increased by a factor of approximately 1.4.
422 PRS in Group 1 ranged from 560 to 1720 ng/ml, and in Group 2 from 435 to 1790 ng/ml.
There was no statistically significant difference. Fourteen patients in Group 2 underwent bilateral nephrectomy, whereupon blood pressure
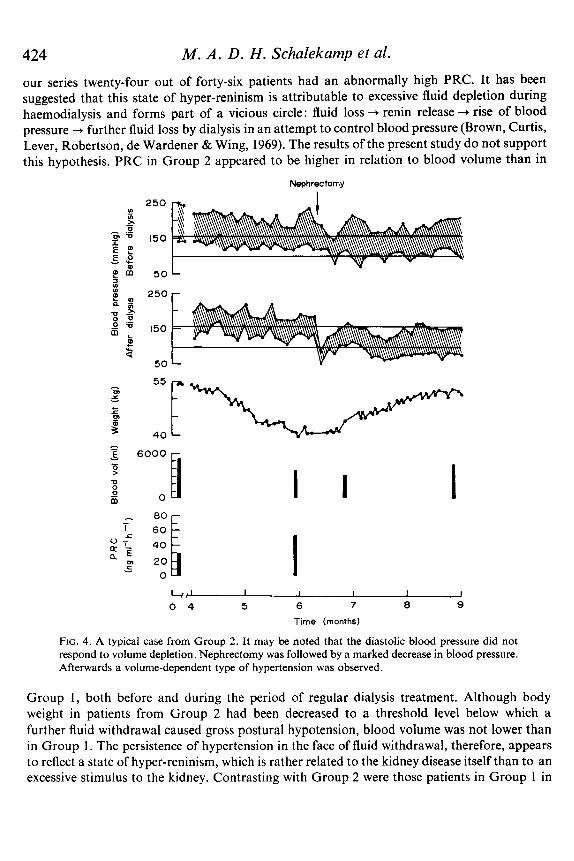
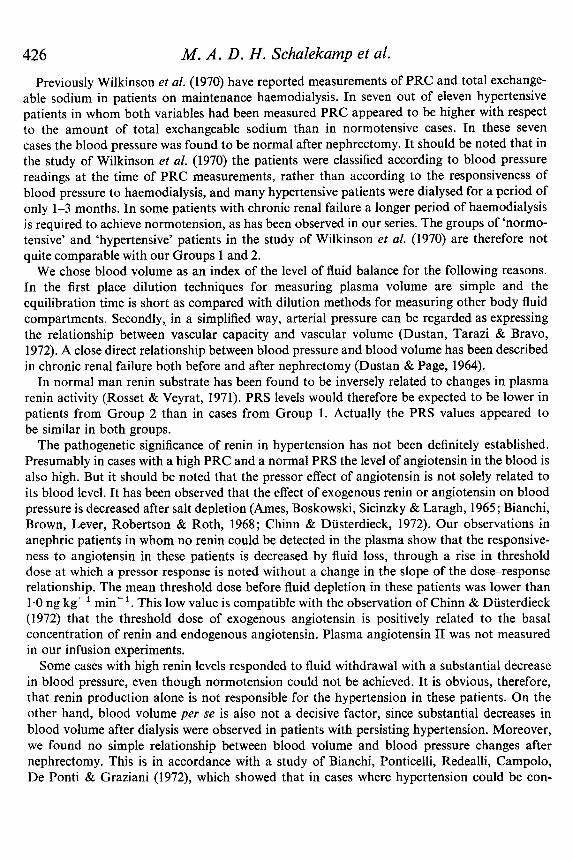
became controllable. In the majority of these cases nephrectomy was performed in the course of preparation for renal transplantation. When the body weight was allowed to increase after nephrectomy, blood pressure rose again to abnormal levels. But this time, normotension could be achieved by repeated ultrafiltration. A typical case is shown in Fig. 4. Table 2 presents the results of parallel measurements of PRC and blood volume in six patients before and after nephrectomy. A fall in blood pressure occurred in patients from Group 1 as well as in those from Group 2. With the exception of one patient, a case from Group 2, the fall in blood pressure was not associated with a decrease in blood volume.
M. A . D. H . Schalekarnp et al.
500 r
50 Y
C P c
E 8 20 5
2t I I I I
I5 20 25 30 35 I 1
Blood vol. (rnl/crn)
FIG. 2. Relationship between plasma renin concentration and blood volume in terminal renal failure. Shaded area indicates the zone of overlapping renin values between the patient Groups 1 and 2. For an explanation of the symbols, see legend to Fig. 1.
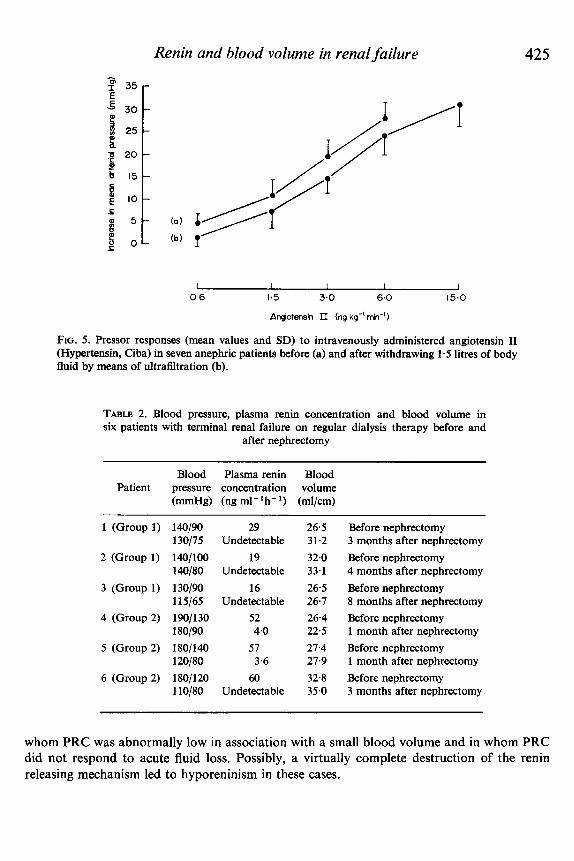
Intravenous infusion of angiotensin I1 in anephric patients induced a rise in blood pressure. Increments of mean arterial pressure showed an approximately linear relationship to the logarithm of the dose of angiotensin (Fig. 5). The acute loss of 1.5 litres of body fluid during ultrafiltration induced a 10-60 mmHg fall in mean arterial pressure and a shift of the log dose-response curve to the right in each patient. The average threshold dose of angiotensin 11, arbitrarily defined as the dose required for a 5 mmHg rise in mean arterial pressure, increased
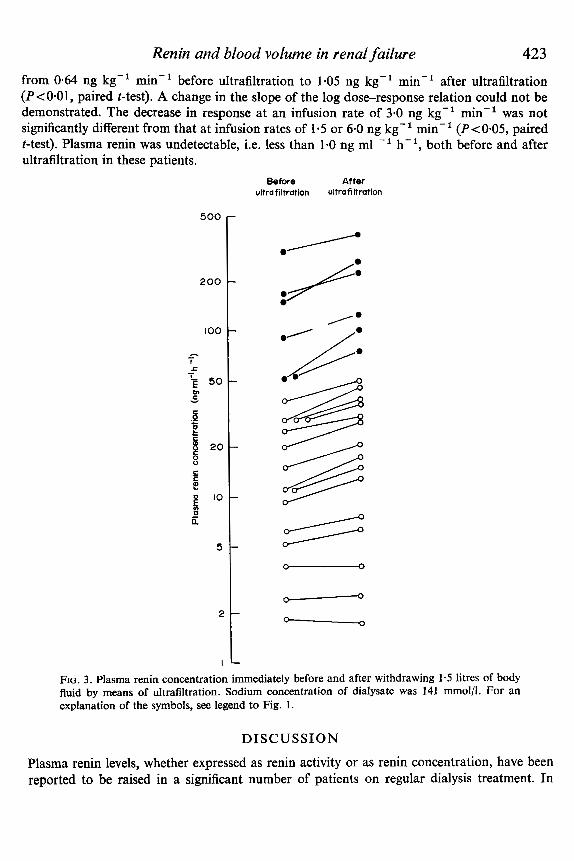
Renin and blood volume in renal failure 423 from 0-64 ng kg-' min-' before ultrafiltration to 1-05 ng kg-l min-' after ultrafiltration (P<O*Ol, paired t-test). A change in the slope of the log dose-response relation could not be demonstrated. The decrease in response at an infusion rate of 3.0 ng kg-I min-l was not significantly different from that at infusion rates of 1.5 or 6.0 ng kg-l min-' (P<0.05, paired t-test). Plasma renin was undetectable, i.e. less than 1.0 ng ml -' h-' , both before and after ultrafiltration in these patients.
Before After ultrafiltration ultrafiltration
500
200 /:
FIG. 3. Plasma renin concentration immediately before and after withdrawing 1.5 litres of body fluid by means of ultrafiltration. Sodium concentration of dialysate was 141 mmol/l. For an explanation of the symbols, see legend to Fig. 1 .
DISCUSSION
Plasma renin levels, whether expressed as renin activity or as renin concentration, have been reported to be raised in a significant number of patients on regular dialysis treatment. In
424 M. A . D . H . Schalekamp et al.
our series twenty-four out of forty-six patients had an abnormally high PRC. It has been suggested that this state of hyper-reninism is attributable to excessive fluid depletion during haemodialysis and forms part of a vicious circle: fluid loss + renin release + rise of blood pressure + further fluid loss by dialysis in an attempt to control blood pressure (Brown, Curtis, Lever, Robertson, de Wardener & Wing, 1969). The results of the present study do not support this hypothesis. PRC in Group 2 appeared to be higher in relation to blood volume than in
Nephrec tomy
250r
4 J I I I 1 I 0 4 5 6 7 8 9
Time (months)
FIG. 4. A typical case from Group 2. It may be noted that the diastolic blood pressure did not respond to volume depletion. Nephrectomy was followed by a marked decrease in blood pressure. Afterwards a volume-dependent type of hypertension was observed.
Group 1 , both before and during the period of regular dialysis treatment. Although body weight in patients from Group 2 had been decreased to a threshold level below which a further fluid withdrawal caused gross postural hypotension, blood volume was not lower than in Group 1. The persistence of hypertension in the face of fluid withdrawal, therefore, appears to reflect a state of hyper-reninism, which is rather related to the kidney disease itself than to an excessive stimulus to the kidney. Contrasting with Group 2 were those patients in Group 1 in
Renin and blood volume in renal failure 425
I I I I I 0-6 1.5 3.0 6.0 15.0
APngiotensin II (ng kg-' min-'1
FIG. 5 . Pressor responses (mean values and SD) to intravenously administered angiotensin I1 (Hypertensin, Ciba) in seven anephric patients before (a) and after withdrawing 1.5 litres of body fluid by means of ultrafiltration (b).
TABLE 2. Blood pressure, plasma renin concentration and blood volume in six patients with terminal renal failure on regular dialysis therapy before and
after nephrectomy
Blood Plasma renin Blood Patient pressure concentration volume
(mmHg) (ng ml-lh-l) (ml/cm)
1 (Group 1) 1 4 / 9 0 130/75
2 (Group 1) 140/100 1 4 / 8 0
3 (Group 1) 130/90 11 5/65
4 (Group 2) 190/130 180/90
5 (Group 2) 180/14 120/80
6 (Group 2) 180/120 1 l0/80
29 Undetectable
19 Undetectable
16 Undetectable
52
57
60 Undetectable
4.0
3.6
26.5 31.2 32.0 33.1 26.5 26.7 26.4 22.5 27.4 27.9 32.8 35.0
Before nephrectomy 3 months after nephrectomy Before nephrectomy 4 months after nephrectomy Before nephrectomy 8 months after nephrectomy Before nephrectomy 1 month after nephrectomy Before nephrectomy 1 month after nephrectomy Before nephrectomy 3 months after nephrectomy
whom PRC was abnormally low in association with a small blood volume and in whom PRC did not respond to acute fluid loss. Possibly, a virtually complete destruction of the renin releasing mechanism led to hyporeninism in these cases.
426 M. A . D . H. Schalekamp et al.
Previously Wilkinson et al. (1970) have reported measurements of PRC and total exchange- able sodium in patients on maintenance haemodialysis. In seven out of eleven hypertensive patients in whom both variables had been measured PRC appeared to be higher with respect to the amount of total exchangeable sodium than in normotensive cases. In these seven cases the blood pressure was found to be normal after nephrectomy. It should be noted that in the study of Wilkinson et al. (1970) the patients were classified according to blood pressure readings at the time of PRC measurements, rather than according to the responsiveness of blood pressure to haemodialysis, and many hypertensive patients were dialysed for a period of only 1-3 months. In some patients with chronic renal failure a longer period of haemodialysis is required to achieve normotension, as has been observed in our series. The groups of ‘normo- tensive’ and ‘hypertensive’ patients in the study of Wilkinson et al. (1970) are therefore not quite comparable with our Groups 1 and 2.
We chose blood volume as an index of the level of fluid balance for the following reasons. In the first place dilution techniques for measuring plasma volume are simple and the equilibration time is short as compared with dilution methods for measuring other body fluid compartments. Secondly, in a simplified way, arterial pressure can be regarded as expressing the relationship between vascular capacity and vascular volume (Dustan, Tarazi & Bravo, 1972). A close direct relationship between blood pressure and blood volume has been described in chronic renal failure both before and after nephrectomy (Dustan & Page, 1964).
In normal man renin substrate has been found to be inversely related to changes in plasma renin activity (Rosset & Veyrat, 1971). PRS levels would therefore be expected to be lower in patients from Group 2 than in cases from Group 1 . Actually the PRS values appeared to be similar in both groups.
The pathogenetic significance of renin in hypertension has not been definitely established. Presumably in cases with a high PRC and a normal PRS the level of angiotensin in the blood is also high. But it should be noted that the pressor effect of angiotensin is not solely related to its blood level. It has been observed that the effect of exogenous renin or angiotensin on blood pressure is decreased after salt depletion (Ames, Boskowski, Sicinzky & Laragh, 1965; Bianchi, Brown, Lever, Robertson & Roth, 1968; Chinn & Diisterdieck, 1972). Our observations in anephric patients in whom no renin could be detected in the plasma show that the responsive- ness to angiotensin in these patients is decreased by fluid loss, through a rise in threshold dose at which a pressor response is noted without a change in the slope of the dose-response relationship. The mean threshold dose before fluid depletion in these patients was lower than 1.0 ng kg-’ min-l. This low value is compatible with the observation of Chinn & Diisterdieck (1972) that the threshold dose of exogenous angiotensin is positively related to the basal concentration of renin and endogenous angiotensin. Plasma angiotensin I1 was not measured in our infusion experiments.
Some cases with high renin levels responded to fluid withdrawal with a substantial decrease in blood pressure, even though normotension could not be achieved. It is obvious, therefore, that renin production alone is not responsible for the hypertension in these patients. On the other hand, blood volume per se is also not a decisive factor, since substantial decreases in blood volume after dialysis were observed in patients with persisting hypertension. Moreover, we found no simple relationship between blood volume and blood pressure changes after nephrectomy. This is in accordance with a study of Bianchi, Ponticelli, Redealli, Campolo, De Ponti & Graziani (1972), which showed that in cases where hypertension could be con-
Renin and blood volume in renal failure 427 trolled by haemodialysis a further decrease in blood pressure could be achieved by nephrectomy without significant changes in plasma volume. Thus, the hypertension in terminal renal disease seems to be both renin and volume dependent, although the relative importance of these factors varies from patient to patient.
A C K N O W L E D G M E N T S
We are indebted to Professor J. de Graeff, Dr L. D. F. Lameyer, Dr E. E. Twiss and Dr M. de Jong, who referred patients, and to Dr L. A. van Es and P. Zondervan, who participated in the earlier stage of this study. Invaluable technical assistance was given by Mrs A. E. Muller-de Ruiter. Miss J. E. Schot, Mr R. 0. Hatt and Mr L. Ries assisted in preparing the manuscript.
This investigation was supported by grant G.O. 683-61 from the Organization for Health Research T.N.O. and by a grant from the Kidney Foundation in the Netherlands (Nierstichting Nederland).
R E F E R E N C E S
AMES, R.P., BORKOWSKI, A.J., SICINKI, A.M. & LARAGH, J.H. (1965) Prolonged infusions of angiotensin I1 and norepinephrine and blood pressure, electrolyte balance and aldosterone and cortisol secretion in normal man and in cirrhosis with ascites. Journal of Clinical Investigation, 44, 1171.
BIANCHI, G., BROWN, J.J., LEVER, A.F., ROBERTSON, J.I.S. & ROTH, N. (1968) Changes of plasma renin con- centration during pressor infusions of renin in the conscious dog: the influence of dietary sodium intake. Clinical Science, 34,303-314.
BIANCHI, G., PONTICELLI, C., BARDI, U., REDEALLI, B., CAMPOLO, L., DE PONTI. C. & GRAZIANI, G. (1972) Role of the kidney in ‘salt and water dependent hypertension’ of end-stage renal disease. Clinical Science, 42, 47-55.
BIRKENHAGER, W.H., VAN Es, L.A., HOUWING, A., LAMERS, H.J. & MULDER, A.H. (1968) Studies on the lability of hypertension in man. Clinical Science, 35,445-556.
BROWN, J.J., CURTIS, J.R., LEVER, A.F., ROBERTSON, J.I.S., DE WARDENER, H.E. &WING, A.J. (1969) Plasma renin concentration and the control of blood pressure in patients on maintenance haemodialysis. Nephron,
BROWN, J.J., DUSTERDIECK, G., FRASER, R., LEVER, A.F., ROBERTSON, J.I.S., TREE, M. & WEIR, R.J. (1971) Hypertension and chronic renal failure. British Medical Bulletin, 27, 128-134.
CHAPLIN, H., MOLLISON, P.L. & VETTER, H. (1953) The bodylvenous hematocrit ratio: its constancy over a wide hematocrit change. Journal of Clinical Investigation, 32, 1309-1316.
CHINN, R.H. & DUSTERDECK, G. (1972) The response of blood pressure to infusion of angiotensin 11: relation to plasma concentration of renin and angiotensin 11. Clinical Science, 42,489-504.
DUSTAN, H.P. & PAGE, J.H. (1964) Some factors in renal and renoprival hypertension. Journal ofhboratory and Clinical Medicine, 64,948-959.
DUSTAN, H.P., TARAZI, R.C. & BRAVO, E.L. (1972) Physiologic characteristics of hypertension. American Journal of Medicine, 52, 610-622.
LEDINGHAM, J.M. (1971) Blood pressure regulation in renal failure. Journal ofthe Royal College of Physicians of London, 5, 103-134.
NIELSEN, J., CLAUSEN, E. & JENSEN, G. (1970) Plasma renin activity in chronic nephropathy. Actu Medica Scandinavicu, 188, 3 5 1-3 54.
ROSSET, E. & VEYRAT, R. (1971) Inverse variations of plasma renin activity and renin substrate in normal man. European Journal of Clinicallnvestigation, 1,328.
SAFAR, M., FENDLER, J.P., BEUVE-MERY, P., BRISSET, J.M., IDATTE, J.M., MEYER, P. & MILLIEZ, P. (1970) Hypertension in patients on maintenance haemodialysis. Revue EuropJenne &Etudes Clinques et Biologique, 15,740-747.
6, 329-349.
428 M. A . D. H. Schalekamp et al. SCHALEKAMP, M.A.D.H., SCHALEKAMP-KUYKEN, M.P.A. & BIRKENHAGER, W.H. (1970) Abnormal renal
SKINNER, S.L. (1967) Improved assay methods for renin ‘concentration’ and ‘activity’ in human plasma.
STOCKIGT, J.R., COLLINS, R.D. & BIGLIERI, E.G. (1971) Determination of plasma renh concentration by angio-
STOKES, G.S., MANI, M.K. & STEWART, J.H. (1970) Relevance of salt, water and renin in hypertension in
TARAZI, R.C., DUSTAN, H.P., FROHLICH, E.D., GIFFORD, R.W. & HOFFMAN, G.C. (1970) Plasma volume and
TREE, M. (1973) Measurement of plasma renin substrate in man. Journal of Endocrinology, 56,159-171. VERNIORY, A., POTVLIEGE, P., VAN GEERTRUYDEN, J.J., VEREERSTRAETEN, P., KINNAERT, P., STAROUKINE, M. &
TOUSSAINT, C. (1972) Renin and control of arterial blood pressure during terminal renal failure treated by haemodialysis and by transplantation. Clinical Science, 42, 685-700.
VERTES, V., CANGIANO, J.L., BERMAN, L.B. & GOULD, A. (1969) Hypertension in end-stage renal disease. New England Journal of Medicine, 280,978-981.
WEIDMANN, P., MAXWELL, M.H., LUPU, A.N., LEWIN, A.J. & MASSRY, S.G. (1971) Plasma renin activity and blood pressure in terminal renal failure. New England Journal of Medicine, 285, 757.
WILKINSON, R., Scorn, D.F., ULDALL, P.R., KERR, D.N.S. & SWINNEY, J. (1970) Plasma renin and exchange- able sodium in the hypertension of chronic renal failure. Quarterly Journal of Medicine, 39, 377-394.
haemodynamics and renin suppression in hypertensive patients. Clinical Science, 38,101-1 10.
Circulation Research, 20, 391-402.
tensin I immuno-assay. Circulation Research, Supplement II,28 and 29, 175-189.
chronic renal failure. British Medical Journal, iii, 126-129.
chronic hypertension. Archives of Internal Medicine, 125, 835-942.