Embed Size (px)
Citation preview

Journal of Ecology
2009,
97
, 186–197 doi: 10.1111/j.1365-2745.2008.01444.x
© 2008 The Authors. Journal compilation © 2008 British Ecological Society
Blackwell Publishing Ltd
Interspecific variation in seedling responses to seed
limitation and habitat conditions for 14 Neotropical
woody species
Natalia Norden
1
†, Jérôme Chave
1
*, Pierre Belbenoit
2
, Adeline Caubère
2
, Patrick Châtelet
3
,
Pierre-Michel Forget
2
, Bernard Riéra
2
, Jérôme Viers
4
and Christophe Thébaud
1
1
Laboratoire Evolution et Diversité Biologique, UMR 5174 Université Paul Sabatier/CNRS, 118 route de Narbonne, F-31062 Toulouse, France;
2
Département Ecologie et Gestion de la Biodiversité, UMR 5176 MNHN/CNRS, 4 av. du Petit Château, F-91800 Brunoy, France;
3
Station d’Etudes des Nouragues, CNRS-Guyane, UPS 2561, 16 Avenue André Aron, F-97300, Cayenne, French Guiana, France; and
4
Laboratoire des Mécanismes et Transferts en Géologie UMR 5563 UR
154 Université Paul Sabatier/CNRS/IRD, 14 av. Edouard Belin, F-31400 Toulouse, France
Summary
1.
We assessed the relative importance of dispersal and niche processes in structuring plantpopulations at the seedling stage for 14 woody plant species (12 trees and 2 lianas) in an old-growthtropical forest of French Guiana.
2.
We combined long-term data from a network of 160 stations, each comprising a seed trap andtwo to three neighbouring seedling plots, with fine-scale quantification of environmental variables.
3.
For each species, we quantified seed limitation as the proportion of seed traps that were notreached by seeds, and establishment limitation as the proportion of stations where seeds arrived butwhere seedlings did not occur. All species showed strong seed limitation, whereas only one speciesshowed significant establishment limitation.
4.
We determined the proportion of variance in local seedling density explained by either seeddensity or environmental factors, and we assessed the effect of environment on seedling survival.
5.
Although seeds showed considerable spatial clumping in all species, seed density explaineda significant fraction of the variance in seedling density for only five species. Habitat preferencesexplained a significant fraction of the variance in seedling density for six species. Of the remainingspecies, four showed no significant relationship with either seed arrival or habitat conditions.
6.
Environmental effects on local seedling abundance were weakly related to those on seedlingsurvival. When seedling density was significantly correlated with a given environmental factor,survival was usually not correlated with that factor. Habitat association patterns might change overtime, as environmental filtering operates.
7.
Synthesis
. Our results show that both seed arrival and habitat preferences contribute to explainingthe abundance of tropical woody species at the seedling stage, but their relative importance showedimportant interspecific differences. Although our study was limited to a subset of woody species,they accounted for 27% of the individuals composing the seedling layer. Thus, our findings are likelyto have important consequences in the structuring of the seedling community.
Key-words:
environmental heterogeneity, French Guiana, habitat preferences, seed limitation,seedling regeneration, spatial distribution, survival
Introduction
Predicting the ecological processes that determine thestructure of species-rich plant communities across life-historychanges remains one of the major challenges in plant ecology(Tilman 1982; Hubbell & Foster 1986; Weiher & Keddy 1995;Hubbell 2001). Recently, a number of studies have examined
*Correspondence author. E-mail: [email protected]†Present address: Department of Ecology and Evolutionary Biology,75 North Eagleville Road, University of Connecticut, Storrs, CT06269-3043, USA.

Recruitment limitation in Neotropical seedlings
187
© 2008 The Authors. Journal compilation © 2008 British Ecological Society,
Journal of Ecology
,
97
, 186–197
the relative roles of environment and geographical distance inexplaining variation of floristic diversity in tropical treecommunities at different spatial scales (Potts
et al
. 2002;Tuomisto
et al
. 2003; Potts
et al
. 2004; Svenning
et al
. 2004; Chust
et al
. 2006; Jones
et al
. 2006). These approaches have reliedupon the assumption that in the absence of competition or habitatpartitioning, floristic similarity among plant communities shoulddecrease with increased geographical distance as a consequenceof dispersal limitation (Hubbell 2001; Chave & Leigh 2002).However, spatial variation in adult plant communities shouldalso reflect species filtering events occurring throughout plantontogeny (Grubb 1977; Nathan & Muller-Landau 2000), andit is unclear how these local processes scale-up spatially.
At local scales, the successful establishment of a plantnecessitates overcoming two consecutive ecological filters,seed limitation, the absence of recruitment because of limitedseed supply, and establishment limitation, the absence ofrecruitment because of limited availability of suitablemicrosites (Muller-Landau
et al
. 2002). Both processes havecritical implications for species coexistence. Seed limitationallows inferior competitors to reach sites where bettercompetitors fail to arrive, thereby slowing competitiveexclusion and favouring chance events (Tilman 1994; Hurtt &Pacala 1995). Establishment limitation is expected to favourspecies coexistence if species have evolved in the habitatsin which they are found, developing adaptations that mayenable them to out-compete the other species in these habitats.
The respective roles of seed limitation and establishmentlimitation in fostering diversity during the regeneration phasehave been studied in detail for several tropical tree species.Previous studies found that both rates of seed arrival (Dalling
et al
. 1998, 2002; Makana & Thomas 2004; Svenning &Wright 2005) and of seed dispersal (Stevenson 2000; Webb &Peart 2001; Hardesty
et al
. 2006) play a critical role inseedling recruitment. Another set of empirical studies hasexplored the role of environmental variables on the per-formance of selected species. Limited light availability (Nicotra
et al
. 1999; Montgomery & Chazdon 2002), soil fertility (Hall
et al
. 2003; Fine
et al
. 2004; Palmiotto
et al
. 2004), drought(Engelbrecht
et al
. 2002), and litter depth (Molofsky &Augspurger 1992) were all found to be limiting factors duringthe establishment of the studied tree species.
Despite the importance of these two processes, studiesevaluating simultaneously the role of seed dispersal and ofhabitat specialization in structuring tropical plant com-munities during early stages remain scarce. Muller-Landau
et al
. (2002) used long-term seedfall data from seed traps andneighbouring seedling plots on Barro Colorado Island (BCI,Panama), to evaluate the importance of both seed arrival andestablishment limitation for four tree species. They quantifiedthe intensity of establishment limitation by the failure ofseedlings to establish at a given microsite when seed arrivalwas not limiting, not by directly measuring habitat variables.Uriarte
et al
. (2005) used levels of light availability to predictthe spatial variation of seedling recruitment in a tropicalforest of Puerto Rico, but they used local trees as a proxy ofseed sources, and did not directly quantify seed arrival. In a
previous study, we assessed the influence of seed arrival and ofseveral environmental factors on seedling dynamics at thecommunity level in a tropical forest of French Guiana(Norden
et al
. 2007). We showed that, irrespective of speciesidentity, community-wide seedling dynamics were drivenboth by inter-annual variation in seedfall and by environmentalfiltering. Yet, it remains unclear whether this pattern is uniformamong species or whether species show differential responsesto seed supply and to environmental factors.
In this study, we investigated the role of seed limitation andestablishment limitation on the abundance and survival of 14woody seedling species displaying a wide variety of life-historytraits in an old-growth tropical forest of French Guiana. Wequantified seed limitation using long-term seedfall data fromseed traps, and we evaluated establishment limitation bymonitoring seedling plots adjacent to the seed traps, in whichseveral environmental variables were measured (lightavailability, soil fertility, topography and litter depth). Thespatial distribution of seedlings may follow one of two patternsdepending on the relative importance of dispersal- and niche-based processes. If the main predictor of seedling recruitment isseed arrival, then we predict spatial concordance betweenseedfall and seedling abundance. The more seed-limited aspecies is, the more dependent on seed arrival seedling spatialpatterns should be (Nathan & Muller-Landau 2000). However, ifseedlings are filtered by the habitat, differential survival amonghabitat conditions should lead to niche-based distributionalbiases in the spatial distribution of seedlings (Grubb 1977).Specifically, we address the following questions: (i) What isthe relative strength of seed limitation and of establishmentlimitation during seedling regeneration? (ii) To what extentdoes spatial variation in seedling density reflect seed limitationand further environmental filtering? (iii) Are the differences inspecies abundance among habitats generated by differentialsurvival across environmental conditions?
Methods
STUDY
S ITE
This study was conducted at the Nouragues Biological Station, in apristine tropical rainforest of French Guiana (4
°
05
′
N, 52
°
40
′
W;Bongers
et al
. 2001). Average annual rainfall is 2990 mm with a 2–3 month dry season, from September to November. The study areaconsists of two permanent sampling sites of tropical rain forestcovering 82 ha in total. One of the sites, henceforth called GrandPlateau (GP), is 70-ha in area and it is on clay soil with a metamorphicvolcanic substrate. The other site, Petit Plateau (PP), is 12-ha and itssoil is a granitic-derived sandy-clay mixture. Fruiting phenology inthe area shows marked seasonal patterns. The species richness andbiomass of ripe fruits, especially of animal-dispersed ones, peaks inApril–May and is minimal in August–September (Sabatier 1985;P.-M. Forget, N. Norden and P. Châtelet unpublished data).
SEED
AND
SEEDLING
CENSUSES
Beginning in February 2001, we established a network of 160 seedtraps, each 0.5-m
2
in size, and placed at 1.5 m above-ground to avoid

188
N. Norden
et al.
© 2008 The Authors. Journal compilation © 2008 British Ecological Society,
Journal of Ecology
,
97
, 186–197
disturbance by large mammals. Twenty traps were set up along eachof five parallel trails in the GP (totalling 100 traps), and fifteen alongeach of four parallel trails in the PP (totalling 60 traps; Norden
et al
.2007). Seeds and fruits were collected twice monthly since theestablishment of the network. This study presents results based ondata until July 2006. Viable seeds (with undamaged endosperm ortegument) were counted and identified to species or morpho-speciesusing a reference seed collection, but also using van Roosmalen(1985), and examining vouchers at the Herbier de Guyane (Cayenne,CAY). When a sample could not be given a species name, it was givena morpho-species name (see Appendix S1 in Supporting Information).
In February 2004, we established three 1-m
2
seedling plots around50 seed traps within the GP, and two 1-m
2
seedling plots around theremaining 110 traps; totalling 370 plots (250 plots in the GP and 120plots in the PP). Seedling plots were established 1.5 m from the edgeof the trap in the directions that do not face the trail. We henceforthcall a ‘station’ the seed trap plus the seedling plots around the trap.Between February and March 2004, all woody seedlings in the plotswere tagged with a unique number, mapped, and were measured forheight to the apical bud. Here, we focus our analyses on seedlings< 100 cm in height. Subsequent censuses took place twice a year, inOctober 2004, March 2005, October 2005, and July 2006. Duringeach census, newly recruited seedlings were tagged, mapped andmeasured, and missing seedlings were recorded as ‘dead’. Survivingseedlings were measured once a year. Seedlings were identified tomorpho-species by comparing them to digital photographs of areference collection of seedling specimens growing in the vicinity ofthe plots. Vouchers were compared to botanical specimens at theHerbier de Guyane. When vouchers could not be matched reliablyto botanical specimens, they were given morpho-species name (seeAppendix S1).
ENVIRONMENTAL
VARIABLES
In October 2004, we took hemispherical photographs above eachseedling plot using a Nikon Coolpix 2300 camera with a Nikon FC-8 fisheye lens. Photographs were taken at 1.30 m above the ground,early in the morning (6:30–8:00 am) or late in the afternoon(4:40–6:30 pm) to avoid over-exposure by direct sunrays (Mont-gomery & Chazdon 2002). Because light intensity varies considerably
during sunset and sunrise, the pictures were taken at differentexposure times (1/60, 1/125 and 1/250) to ensure the same level ofcontrast between canopy openings and the surrounding vegetation.Digital photographs were analyzed using the software Gap LightAnalyzer (GLA Version 2.0; Frazer
et al
. 1999). Photographs withthe best contrast and the least over-exposure were selected foranalysis so that all had approximately the same level of contrast.
In October 2004, we collected soil samples near each seed trap tocharacterize the soil chemical composition. Around each trap 1 kg oftopsoil (0–10 cm depth) was collected, by bulking four soil samples.Superficial leaf litter and the humus layer were removed before soilsampling. Soil samples were dried in the field at
c
. 60
°
C during24-h and then stored in dried conditions until laboratory analysis. Inthe laboratory, the samples were re-dried at 50
°
C during 3 days, andthen filtered with a 2-mm mesh sieve. After crushing the fine fraction(< 2 mm), total concentration of five major elements (Ca, Mg, K,Al, Fe) was measured with an ICP-OES (Inductively CoupledPlasma-Optical Emission Spectrometry, Thermo Jarrell Ash® IrisAdvantage). Carbon and Nitrogen concentrations were measuredusing a CHN analyzer (NA 2100 Protein, CE Instruments®). SoilpH was measured in a standard solution made of one volume of soildiluted into three volumes of water.
For each plot, mean leaf litter depth was measured to the nearest0.5 cm from five random points using a ruler. Because leaf litter fallis strongly seasonal, it was measured at each census. Mean valuesover time were computed at every station from all values obtainedfor each census. Finally, we measured the slope at each station witha laser telemeter (LaserAce® 300), and we defined the local topographyas a categorical variable with three levels: flat (1–7
°
), low slope (8–14
°
),and steep slope (15–31
°
).
STUDY
SPECIES
Fourteen taxa were present in sufficient number both as seeds andseedlings to be included in the analyses (Table 1). For 10 species(nine trees and one liana), identification was reliable to the species-level. Two additional trees (
Qualea
sp. 1 and
Licania
sp. 1) could notbe confidently matched to specimens at the Herbier de Cayenne.However these trees were unambiguously identified to the morpho-species level both at the seed and seedling stage and thus were also
Table 1. Species, life forms, dispersal syndromes, seed masses and sample sizes. Life forms are tree (T), liana (L). Life histories are shade-tolerant(ST) and light-demanding (LD). Life forms and life histories are from Mori et al. (2002). Dispersal mode is from van Roosmalen (1985). Seedmass is the mean diaspore mass estimated from 10 dried seeds
Species FamilyLife form
Life history
Dispersal mode
Seed mass (g)
Number of seeds
Number of recruits
Bauhinia spp. Fabaceae L ST Ballistic 0.27 101 289Chrysophyllum lucentifolium Cronquist Sapotaceae T ST Animal 1.08 41 110Dicorynia guianensis Amshoff Fabaceae T LD Wind 0.32 396 29Eperua falcata Aubl. Fabaceae T ST Ballistic 3.52 37 65Hippocratea volubilis L. Celastraceae L LD Wind 0.07 272 563Licania membranacea Laness. Chrysobalanaceae T ST Animal 0.37 1083 141Licania sp. 1 Chrysobalanaceae T ST Animal 0.61 418 136Pourouma spp. Urticaceae T LD Animal 0.44 525 182Pseudopiptadenia suaveolens (Miq.) J. W. Grimes Fabaceae T LD Wind 0.05 374 121Qualea sp. 1 Vochysiaceae T LD Wind 0.02 312 46Quararibea duckei Huber Malvaceae T ST Animal 0.45 94 212Sterculia pruriens (Aubl.) K. Schum. Malvaceae T ST Animal 1.71 56 160Tetragastris altissima (Aubl.) Swart Burseraceae T ST Animal 0.49 33 132Virola michelii Heckel Myristicaceae T ST Animal 1.62 55 59

Recruitment limitation in Neotropical seedlings
189
© 2008 The Authors. Journal compilation © 2008 British Ecological Society,
Journal of Ecology
,
97
, 186–197
included in the analyses (see Appendix S1). We also included twotaxa that contain more than one species.
Bauhinia
spp. is a species-rich liana genus, but in the study area it potentially contains only twospecies:
Bauhinia guianensis
Aubl. (abundant) and
Bauhinia siqueirae
Ducke (rare), plus other taxa often considered as synonymous to
B. guianensis
(Boggan
et al
. 1997; Mori
et al
. 2002). Their distinction,based on the secondary venation of the leaf blades, is difficult sinceseedlings show an important heterophylly, and the seeds look verysimilar.
Pourouma
spp. may comprise up to seven species in the studyarea (Mori
et al
. 2002). While seeds and seedlings are easily identifiedto genus, species-level identifications are difficult to make, with theexception of one species,
Pourouma minor
. In our analysis,
Pourouma
spp. denoted all species in the genus
Pourouma
, except for theshade-tolerant strategist
P. minor
. Throughout the paper, we looselyrefer to all taxa with the term ‘species’, and for brevity, we refer tothem by their generic names, except for
Licania.
A detailed descrip-tion for each species, comprising pictures of seeds and seedlings, isprovided in Appendix S1. The selected species are scattered acrossthe angiosperm phylogeny, thus we do not expect any phylogeneticbias in our results.
STATISTICAL
ANALYSES
Seed and establishment limitation
To assess the relative strength of seed limitation, we measured theproportion of stations that were not reached by seeds (‘fundamentalseed limitation’
sensu
Muller-Landau
et al
. 2002). This measure wasdefined as follows:
eqn 1
where
a
is the number of stations receiving seeds throughout thestudy period, and
n
is the total number of stations. To quantify thestrength of establishment limitation, we measured the proportion ofstations where seeds arrived but where seedlings did not occur(‘realized establishment limitation’
sensu
Muller-Landau
et al
. 2002).
eqn 2
where
r
is the number of stations where both seeds and seedlingsoccurred. This calculation gives information on establishment, onceseeds have successfully reached a site.
Because abundant species tend to reach more sites than rare species,these measures are biased by sample size. We thus compared observedseed and establishment limitation measures with those obtainedfrom simulations using a null model in which seeds and seedlingsoccurred randomly in the stations, according to a Poisson distribution.One thousand random replications were generated using the observednumber of seeds and seedlings of each species. For each replication,we first calculated the number of stations reached randomly byseeds, then the number of stations where seeds had already beenfound, also reached by seedlings. We then compared observedvalues with 95% confidence limits of the simulated ones. Tocompare the strength of seed and establishment limitation amongspecies by accounting for differences in seed abundance, we calculated
δ
seed
and
δ
seedling
, the relative difference between the observed andexpected seed and establishment limitation, respectively. Thismeasure varies between
−
1 and 1: the more positive
δ
is, the morelimited the species is, and vice-versa. Finally, to test the influence ofeach of seed size, dispersal syndrome and life history on
δ
, we performeda one-way
anova
followed by a
post hoc
Tukey HDS test. Seed mass
was transformed to a 3-level factor distinguishing small size(< 0.1 g), medium size (0.1–1 g) and large size seeds (> 1 g).
Linear modelling of seedling density
For each species, we used linear regression models to evaluate theextent to which local seedling abundance reflected seed arrival andenvironmental filtering. We modelled the ln-transformed values ofseedling density (number of seedlings m
–2
) at each station against theln-transformed values of seed density (number of seeds m
–2
) at eachtrap. We added 1 before the ln-transformations because seed orseedling densities were equal to zero in several stations. We usedseedling density rather than the total number of seedlings at eachstation because the number of seedling plots per station was unevenacross stations. Since seedlings censused in the initial census representa multiple-aged cohort, and it was impossible to date the fruitingevents from which they were recruited, we distinguished the initiallysampled seedlings from seedlings recruited in the subsequent cen-suses. We thus separately related (i) seedlings censused in the initialcensus (March 2004) with seeds censused from February 2001 toFebruary 2004 (period henceforth called ‘c0’); and (ii) seedlingsrecruited in subsequent censuses (October 2004 to July 2006) withseeds censused from April 2004 to June 2006 (period henceforth called‘recruits’). Species were excluded from a particular analysis if theyhad < 20 recorded seeds or seedlings, to avoid bias due to lack ofstatistical power. Because seedlings were unevenly distributed acrossstations, we restricted this analysis to the stations where the presenceof either seeds or seedlings was reported. Hence, we tested the exist-ence of a correlation between seed and seedling densities only withinthe restricted range of potential seed distribution in the study area.
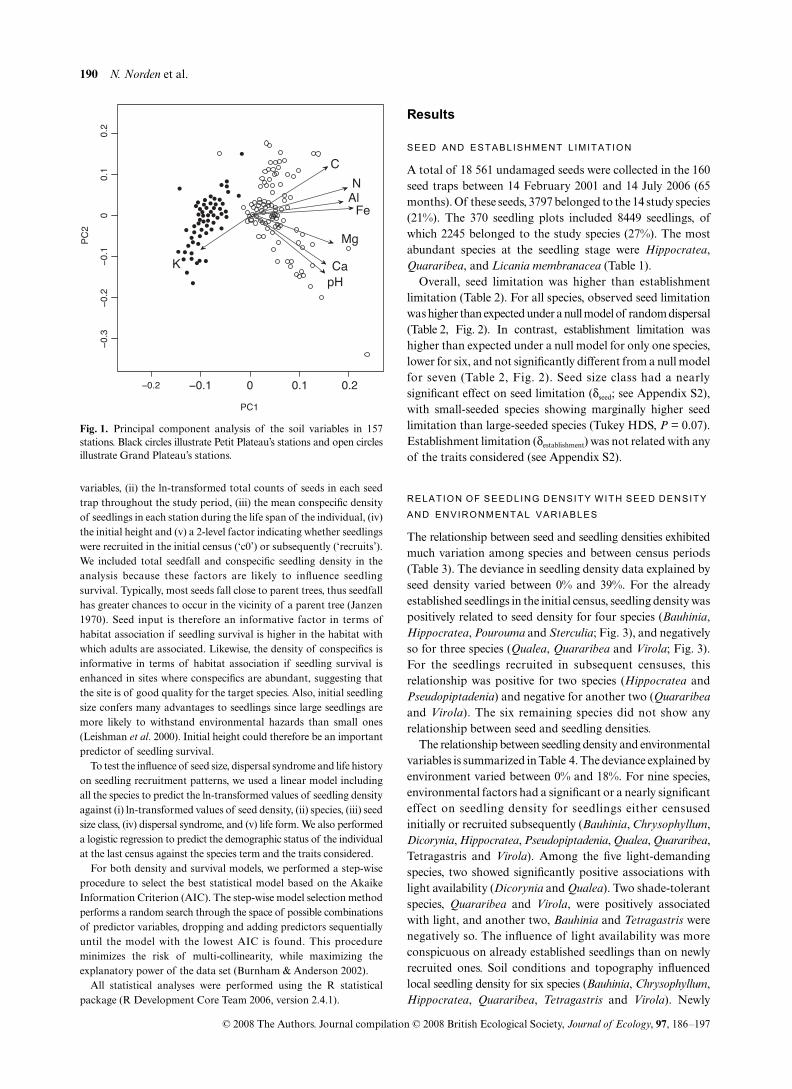
Since establishment limitation operates after seed limitation, weassessed the effect of habitat conditions after seed deposition by modellingthe residuals from the seed-seedling regression model against envi-ronmental variables. To reduce the number of variables describingsoil factors, we performed a principal components analysis (PCA)on physical and chemical soil variables for the entire set of samplingstations. Of the 160 stations, three were excluded because of technicaldifficulties during the chemical analyses, hence reducing our sam-pling size to 157 stations. In all subsequent correlative analyses, weused the scores of the two principal components describing variationin soil environmental conditions. The first PCA axis distinguishedGP from PP stations, highlighting geological differences betweenthese two plots (Fig. 1). The second PCA axis represented a gradientof conditions in soil fertility. This axis was positively related with soilorganic matter and it was negatively related with pH. Together, theseaxes explained 69.6% of the variance in soil conditions. Henceforth,we refer to the first PCA axis as ‘soil PC1’ and to the second as ‘soilPC2’. Because several measures were taken to describe light availability(canopy openness, percentage of diffuse and direct transmittedradiation), we also performed a PCA on light variables and used thefirst PCA axis, which explained 99.3% of the variance in light condi-tions. Our full set of environmental variables therefore included fivevariables: the two PC variables describing soil conditions, the PCvariable describing light conditions (‘light’), litter depth, and slope.
Linear modelling of seedling survival
To analyse seedling survival, we performed an individual-basedanalysis for each species. We predicted the demographic status of theindividual (alive = 1, dead = 0) at the last census date by logisticregressions. The dependent variables were (i) the environmental
Seed limitation = −1a
n
Establishment limitation = −1r
a
190 N. Norden et al.
© 2008 The Authors. Journal compilation © 2008 British Ecological Society, Journal of Ecology, 97, 186–197
variables, (ii) the ln-transformed total counts of seeds in each seedtrap throughout the study period, (iii) the mean conspecific densityof seedlings in each station during the life span of the individual, (iv)the initial height and (v) a 2-level factor indicating whether seedlingswere recruited in the initial census (‘c0’) or subsequently (‘recruits’).We included total seedfall and conspecific seedling density in theanalysis because these factors are likely to influence seedlingsurvival. Typically, most seeds fall close to parent trees, thus seedfallhas greater chances to occur in the vicinity of a parent tree (Janzen1970). Seed input is therefore an informative factor in terms ofhabitat association if seedling survival is higher in the habitat withwhich adults are associated. Likewise, the density of conspecifics isinformative in terms of habitat association if seedling survival isenhanced in sites where conspecifics are abundant, suggesting thatthe site is of good quality for the target species. Also, initial seedlingsize confers many advantages to seedlings since large seedlings aremore likely to withstand environmental hazards than small ones(Leishman et al. 2000). Initial height could therefore be an importantpredictor of seedling survival.
To test the influence of seed size, dispersal syndrome and life historyon seedling recruitment patterns, we used a linear model includingall the species to predict the ln-transformed values of seedling densityagainst (i) ln-transformed values of seed density, (ii) species, (iii) seedsize class, (iv) dispersal syndrome, and (v) life form. We also performeda logistic regression to predict the demographic status of the individualat the last census against the species term and the traits considered.
For both density and survival models, we performed a step-wiseprocedure to select the best statistical model based on the AkaikeInformation Criterion (AIC). The step-wise model selection methodperforms a random search through the space of possible combinationsof predictor variables, dropping and adding predictors sequentiallyuntil the model with the lowest AIC is found. This procedureminimizes the risk of multi-collinearity, while maximizing theexplanatory power of the data set (Burnham & Anderson 2002).
All statistical analyses were performed using the R statisticalpackage (R Development Core Team 2006, version 2.4.1).
Results
SEED AND ESTABLISHMENT L IMITATION
A total of 18 561 undamaged seeds were collected in the 160seed traps between 14 February 2001 and 14 July 2006 (65months). Of these seeds, 3797 belonged to the 14 study species(21%). The 370 seedling plots included 8449 seedlings, ofwhich 2245 belonged to the study species (27%). The mostabundant species at the seedling stage were Hippocratea,Quararibea, and Licania membranacea (Table 1).
Overall, seed limitation was higher than establishmentlimitation (Table 2). For all species, observed seed limitationwas higher than expected under a null model of random dispersal(Table 2, Fig. 2). In contrast, establishment limitation washigher than expected under a null model for only one species,lower for six, and not significantly different from a null modelfor seven (Table 2, Fig. 2). Seed size class had a nearlysignificant effect on seed limitation (δseed; see Appendix S2),with small-seeded species showing marginally higher seedlimitation than large-seeded species (Tukey HDS, P = 0.07).Establishment limitation (δestablishment) was not related with anyof the traits considered (see Appendix S2).
RELATION OF SEEDLING DENSITY WITH SEED DENSITY AND ENVIRONMENTAL VARIABLES
The relationship between seed and seedling densities exhibitedmuch variation among species and between census periods(Table 3). The deviance in seedling density data explained byseed density varied between 0% and 39%. For the alreadyestablished seedlings in the initial census, seedling density waspositively related to seed density for four species (Bauhinia,Hippocratea, Pourouma and Sterculia; Fig. 3), and negativelyso for three species (Qualea, Quararibea and Virola; Fig. 3).For the seedlings recruited in subsequent censuses, thisrelationship was positive for two species (Hippocratea andPseudopiptadenia) and negative for another two (Quararibea
and Virola). The six remaining species did not show anyrelationship between seed and seedling densities.
The relationship between seedling density and environmentalvariables is summarized in Table 4. The deviance explained byenvironment varied between 0% and 18%. For nine species,environmental factors had a significant or a nearly significanteffect on seedling density for seedlings either censusedinitially or recruited subsequently (Bauhinia, Chrysophyllum,Dicorynia, Hippocratea, Pseudopiptadenia, Qualea, Quararibea,Tetragastris and Virola). Among the five light-demandingspecies, two showed significantly positive associations withlight availability (Dicorynia and Qualea). Two shade-tolerantspecies, Quararibea and Virola, were positively associatedwith light, and another two, Bauhinia and Tetragastris werenegatively so. The influence of light availability was moreconspicuous on already established seedlings than on newlyrecruited ones. Soil conditions and topography influencedlocal seedling density for six species (Bauhinia, Chrysophyllum,Hippocratea, Quararibea, Tetragastris and Virola). Newly
Fig. 1. Principal component analysis of the soil variables in 157stations. Black circles illustrate Petit Plateau’s stations and open circlesillustrate Grand Plateau’s stations.

Recruitment limitation in Neotropical seedlings 191
© 2008 The Authors. Journal compilation © 2008 British Ecological Society, Journal of Ecology, 97, 186–197
recruited seedlings of Pseudopiptadenia were negativelyinfluenced by litter depth.
All species combined, none of the traits considered (seedsize, dispersal syndrome and life history) was selected in thestep-wise procedure. Only the term ‘species’ had a significanteffect on seedling density (P < 0.005).
RELATION OF SEEDLING SURVIVAL WITH ENVIRONMENTAL VARIABLES
The relationship between seedling survival and independentvariables is summarized in Table 5. Survival of Chrysophyllum,
Licania sp. 1 and Sterculia, all shade-tolerant, was negativelyassociated with light availability. Soil variables and topographyalso had a significant or a nearly significant effect on survivalfor seven species (Bauhinia, Dicorynia, Eperua, Pseudopiptadenia,Quararibea, Sterculia and Virola). Litter depth had a significantlynegative effect on the survival of Bauhinia. Overall, thesefindings were not consistent with environmental effects onseedling density (see Discussion).
Although we expected seedling height to be a strongpredictor of seedling survival, only six species showed apositive relationship between seedling survival and initialseedling height (Bauhinia, Chrysophyllum, Hippocratea, Licania
membranacea, Licania sp. 1 and Quararibea). The census periodwas a significant predictor of seedling survival for only onespecies, Virola, which showed higher survival for newly recruitedseedlings.
Seedling survival showed a variety of species-specific responsesto conspecific seed and seedling densities. Seedling survival ofBauhinia and Sterculia was lower in stations with highseedling density but higher in stations receiving higher seeddensities. In contrast, seed density suppressed survivalsignificantly in Tetragastris and marginally in Hippocratea.
All species combined, none of the traits considered wasselected in the step-wise procedure. Only the term ‘species’had a significant effect on seedling survival (P < 0.005).
Discussion
SEEDLING RESPONSES TO SEED L IMITATION AND TO ENVIRONMENTAL F ILTERING
Many studies have shown that in tropical plant communities,seed limitation plays an important role in seedling recruitment(Hubbell et al. 1999; Nathan & Muller-Landau 2000; Muller-Landau et al. 2002; Svenning & Wright 2005). The spatial
Table 2. Number of stations where the presence of seeds and/or seedling have been reported over the 160 stations, observed seed- andestablishment-limitation measures, and mean of the randomized seed- and establishment-limitation measures for each species. Confidenceintervals of the randomized measures (obtained from 1000 replications) are given in parentheses. Significant observed values of seed and establishmentlimitation are indicated in bold. A sign (+) or (−) indicates whether limitation is higher or lower than expected under a null model, respectively
Species
Number stations receiving seeds
Number stations with seedlings
Seed limitation
Randomized seed limitation
Establishment limitation
Randomized establishment limitation
Bauhinia spp. 28 52 0.83 (+) 0.53 (0.49–0.57) 0.11 0.16 (0.08–0.24)Chrysophyllum lucentifolium 13 32 0.92 (+) 0.77 (0.75–0.80) 0.23 (−−−−) 0.50 (0.36–0.65)Dicorynia guianensis 46 20 0.71 (+) 0.08 (0.05–0.12) 0.67 (−−−−) 0.83 (0.81–0.86)Eperua falcata 14 17 0.91 (+) 0.79 (0.78–0.81) 0.36 (−−−−) 0.66 (0.52–0.79)Hippocratea volubilis 55 78 0.66 (+) 0.18 (0.14–0.23) 0.16 (+) 0.03 (0.01–0.06)Licania membranacea 31 70 0.81 (+) 10–3 (10–4–10–3) 0.32 (−−−−) 0.41 (0.37–0.46)Licania sp. 1 55 68 0.66 (+) 0.07 (0.04–0.11) 0.42 0.43 (0.37–0.47)Pourouma spp. 46 77 0.71 (+) 0.04 (0.01–0.07) 0.33 0.32 (0.27–0.37)Pseudopiptadenia suaveolens 43 35 0.73 (+) 0.10 (0.06–0.14) 0.47 0.47 (0.42–0.52)Qualea sp. 1 22 27 0.86 (+) 0.14 (0.10–0.18) 0.50 (−−−−) 0.75 (0.71–0.79)Quararibea duckei 44 70 0.73 (+) 0.55 (0.51–0.59) 0.20 0.27 (0.17–0.36)Sterculia pruriens 14 35 0.91 (+) 0.70 (0.68–0.73) 0.36 0.37 (0.24–0.49)Tetragastris altissima 18 43 0.89 (+) 0.81 (0.79–0.83) 0.39 0.44 (0.27–0.60)Virola michelii 33 40 0.79 (+) 0.71 (0.68–0.74) 0.45 (−−−−) 0.69 (0.58–0.80)
Fig. 2. Seed and establishment limitation for the 14 studied species,calculated as δ, the difference between the observed values of seed andestablishment limitation and the mean of the expected seed andestablishment limitation under a null model, respectively. Speciesabbreviations correspond to the first three letters of the genus and species.

192 N. Norden et al.
© 2008 The Authors. Journal compilation © 2008 British Ecological Society, Journal of Ecology, 97, 186–197
distribution of seed-limited species is thus expected to correlatewith that of seed arrival. However, our findings based on thenull model approach were not consistent with those based onthe correlative approach. While all the study species showedconsiderable seed limitation, only five out of 14 species showed apositive relationship between seed and seedling densities atany of the two periods of time considered. A possible explanationfor the discrepancy between these two approaches is thatthey embrace different aspects of seed limitation. In the nullmodel, seed limitation is measured as the failure of seeds toarrive at a given site (Muller-Landau et al. 2002), while in thecorrelative approach seed limitation is measured as thestrength of the dependency of seedling establishment on seed
arrival (Turnbull et al. 2000; Svenning & Wright 2005). Seedlimitation involves manifold processes affecting variousstages over the seed to seedling transition (Nathan & Muller-Landau 2000). Here, by dissecting seed limitation into twodifferent aspects, we address important processes explainingthe spatial pattern of woody species at the seedling stage.
A remarkable example for the discrepancy between the nullmodel approach and the correlative approach is given by themost seed-limited species, L. membranacea (Fig. 2), for whichits initial seedling cohort was unrelated to the seed arrivalrecorded during the three previous years. This species fruitedmassively in 2002 (Table 2), and seedfall showed a stronglyaggregated pattern, with over 90% of the seeds reaching only
Table 3. Estimates from the linear model predicting the ln-transformed values of seedling density as a function of the ln-transformed values ofseed density, at each station. Estimates in bold are significant or marginally significant (***P ≤ 0.001, **P ≤ 0.01, *P ≤ 0.05, †P ≤ 0.1). Alsoreported are the R2, numbers of seeds in 160 seed traps; numbers of seedlings in 370 1-m2 seedling plots over periods ‘c0’ and ‘recruits’.NA denoted species excluded from a particular analysis
Speciesln(seedling density + 1)
ln(seeddensity + 1) R2Number of seeds
Number of seedlings
c0 recruits c0 recruits c0 recruits c0 recruits
Bauhinia spp. 0.28** −0.10 0.22 0.01 63 38 197 92Chrysophyllum lucentifolium 0.12 0.12 0.06 0.02 24 17 47 63Dicorynia guianensis −0.02 NA 0.01 NA 169 227 23 6Eperua falcata 0.01 −0.17 0 0.03 24 13 47 18Hippocratea volubilis 0.15** 0.51*** 0.14 0.37 191 81 128 435Licania membranacea 0.01 NA 0 NA 1067 16 130 11Licania sp. 1 −0.01 NA 0 NA 386 32 124 12Pououma spp. 0.08* 0.02 0.08 0 352 173 57 124Pseudopiptadenia suaveolens NA 0.20*** NA 0.20 32 342 13 108Qualea sp. 1 −−−−0.07† −0.05 0.11 0.05 88 42 26 20Quararibea duckei −−−−0.10† −−−−0.11† 0.05 0.06 52 42 114 98Sterculia pruriens 0.27** NA 0.23 NA 54 2 109 51Tetragastris altissima −−−−0.08 −0.10 0 0 31 2 72 60Virola michelii −−−−0.21** −−−−0.21*** 0.22 0.39 39 16 35 24
Table 4. Estimates from the linear model predicting the residuals from the seed-seedling regression as a function of environmental measures.Estimates in bold are significant or marginally significant (***P ≤ 0.001, **P ≤ 0.01, *P ≤ 0.05, †P ≤ 0.1). Also reported is the If thepredictor was not selected in the step-wise procedure, the cell is empty (−). NA denoted species excluded from a particular analysis
Species Soil PC1 Soil PC2 Light Slope Litter depth
c0 recruits c0 recruits c0 recruits c0 recruits c0 recruits c0 recruits
Bauhinia spp. − − 0.15† − − −−−−0.09* 0.44**‡ − − − 0.18 0.09Chrysophyllum lucentifolium −−−−0.18* −0.21 − 0.22 − − − 0.81*‡ − 0.50 0.18 0.23Dicorynia guianensis − NA − NA 0.06** NA − NA − NA 0.16 NAEperua falcata − − − − − − − − − − 0 0Hippocratea volubilis − 0.08† − − − − −0.32** − − − 0.12 0.03Licania membranacea −0.03 NA − NA − NA − NA − NA 0.02 NALicania sp.1 − NA − NA − NA − NA − NA 0 NA Pourouma spp. − − − − − − 0.13 − − − 0.03 0Pseudopiptadenia suaveolens NA − NA − NA − NA − NA −−−−0.08† NA 0.04Qualea sp. 1 − − − − 0.11** 0.06* − − 0.05 − 0.31 0.15Quararibea duckei − 0.06† − − 0.07** −0.03 0.17*‡ − − − 0.14 0.06Sterculia pruriens − NA − NA − NA − NA − NA 0 NATetragastris altissima 0.08 − − − − − −−−−0.26†‡ − − − 0.05 0Virola michelii −−−−0.06 −0.02 − − − 0.17†‡ − − − 0.08 0.05
‡Denoted association to flat slope.
Radj
2 .
Radj
2

Recruitment limitation in Neotropical seedlings 193
© 2008 The Authors. Journal compilation © 2008 British Ecological Society, Journal of Ecology, 97, 186–197
six traps out of 160 (see Appendix S3). In contrast, seedlingswere widely distributed across the study area. Six further spe-cies also exhibited a lack of relationship between seed andseedling densities over this period. Such patterns might be dueto the fact that seedlings from the initial cohort arose fromfruiting events occurring before the initiation of the seedcensuses. These findings suggest that temporal variation inspatial patterns in seedfall mitigate seed limitation over time(Nathan & Muller-Landau 2000; Muller-Landau et al. 2002).
Yet, temporal inconsistencies between fruiting events andseedling recruitment were not the only cause for the absenceof relationship between seed and seedling spatial distributions.When focusing on subsequent cohorts, among the 10 speciesincluded in the analyses, six did not show any relationshipbetween seed and seedling spatial distributions. Two furtherspecies showed a negative relationship between seeds andseedling densities throughout the study period. Environmental
filtering might have uncoupled the spatial concordancebetween seeds and seedlings subsequently to seed deposition(Nathan & Muller-Landau 2000; Wang & Smith 2002). How-ever, among the nine species showing no positive response toseed arrival, only four were significantly influenced by someof the environmental factors studied. We were unable todetermine whether these observed habitat associations weredirectly responsible for the lack of relationship between seedand seedling densities. Thus, we did not find direct evidencethat habitat partitioning following seed deposition wasresponsible for such patterns. Reciprocal transplantationsshould bring further light to this hypothesis (e.g. Fine et al. 2004).
Overall, many species showed significant habitat prefer-ences. Soil-driven biases in seedling abundance were observedin six species and light had a significant influence in the spatialpatterns of four species. In addition, five species (Chrysophyllum,Hippocratea, Quararibea and Virola) were widely distributed
Fig. 3. Relationships between the ln-transformed values of seed and seedlingdensity for the 14 studied species in one ofthe two periods studied. We report N, thenumber of stations, and the census period.Note that points overlap in some cases.

194 N. Norden et al.
© 2008 The Authors. Journal compilation © 2008 British Ecological Society, Journal of Ecology, 97, 186–197
within the GP plot, whereas they were absent in the PP as bothseeds and seedlings (and trees). Since both GP and the PPoccur on distinctive soil types with well-defined boundaries,habitat heterogeneity is probably responsible for thesedistributional biases (Poncy et al. 2001). Because werestricted our analysis to stations where either seeds orseedlings occurred, this result is not highlighted in theregression analyses.
For four species, the fraction of variance explained byeither seedfall or habitat conditions was < 5%. These specieswere abundant in the seedling layer, suggesting that ourresults do not reflect a lack of statistical power. Several studieshave suggested that seed dispersal is an important source ofstochasticity in seed deposition patterns (Feer et al. 2001;Poulsen et al. 2002; Russo 2005). If an important proportionof the established seedlings arose form isolated dispersalevents (Stevenson 2000; Webb & Peart 2001) or from secondarydispersal (Forget 1996; Jansen et al. 2004), the large proportionof unexplained variance in local seedling density could be dueto the difficulty to sample both rare dispersal events and theirsubsequent seedling recruitment when using seed traps. Inaddition, we did not monitor all possible environmentalfactors, such as water availability (Engelbrecht et al. 2007),and this might explain the small predictive power of the model.However, our study did encompass a broad array of finelymeasured environmental descriptors, and it is unlikely that alarge fraction of the variance would be accounted for byunmeasured variables.
HOW ARE DISTRIBUTION BIASES GENERATED IN THE SPATIAL DISTRIBUTION OF SEEDLINGS?
For species showing habitat partitioning, one would expectconsistent differences in survival rates across habitats.However, the factors that influenced seedling abundanceappeared to be unrelated to the factors influencing seedling
survival. An illustration is provided by the legume tree speciesDicorynia guianensis. Light availability was an importantpredictor for the spatial distribution of Dicorynia seedlings ofthe initial cohort, confirming its light-demanding status(van der Meer et al. 1998; Rijkers et al. 2000). However,Dicorynia’s survival was only affected by soil fertility. Thisresult suggests that seedlings undergo a strong filter driven bylight conditions early on during establishment, so that thespatial distribution of established seedlings shows biasestowards high light environments. The influence of soil factorson seedling survival may occur subsequently, mostly forseedlings with a well-developed root system. Many otherspecies showed inconsistencies in habitat preferences betweenseedling spatial patterns and seedling survival. This patternmay be the result of different habitat associations throughsubsequent stages of recruitment (Schupp 1995). Duringgermination and early establishment, seedlings requireparticular environmental conditions that may become eitherneutral or antagonistic for seedling persistence. For example,a recent study showed that many trees of Barro ColoradoIsland exhibit different habitat associations across life stages(Comita et al. 2007). Our results suggest that such changesmay also occur at a finer level, within the same developmentalstage.
Conspecific seed and seedling densities did not correlatesimply with seedling survival. Only two species survivedbetter in stations with high seed densities, suggesting positiveinteractions between seedlings and neighbouring conspecificadults. This could reflect the fact that seedlings survive betternear parents because they show consistent habitat preferencesacross life-history stages (Webb & Peart 2000). At the sametime, the stations with high seedling density of these speciesalso showed higher mortality, suggesting a density-dependentregulation on population size at the seedling stage (Webb &Peart 1999). Thus, at least for some species, seedlings interactboth negatively with conspecific neighbouring seedlings
Table 5. Estimates from the logistic model predicting seedling survival as a function of environmental variables, height, conspecific seed andseedling densities and census period. Estimates in bold are significant or marginally significant (***P ≤ 0.001, **P ≤ 0.01, *P ≤ 0.05, †P ≤ 0.1).Also reported is the If the predictor was not selected in the step-wise procedure, the cell is empty (−)
Species HeightSoil PC1
Soil PC2 Light Slope
Litter depth ln(cons. dens. +1) ln(seed dens. +1) Census
Bauhinia spp. 0.02† − 0.46* − − −−−−0.23* −−−−0.32*** 0.63** − 0.06Chrysophyllum lucentifolium 0.14† 0.77 − −−−−0.36† −1.47 − − − − 0.14Dicorynia guianensis 0.16 − 1.13† − − − − −0.65 − 0.26Eperua falcata − 0.37 − − −−−−2.41*‡ − −0.47 − − 0.03Hippocratea volubilis 0.14* − − − − − − −−−−0.21† − 0.04Licania membranacea 0.04** − − − − − − − − 0.04Licania sp. 1 0.07* − − −−−−0.27* − − − − − 0.07Pourouma spp. 0.02 −0.21 − − − − −0.26 − 0.71 0.09Pseudopiptadenia suaveolens 0.13 − −−−−1.14* − −1.43 − − − − 0.15Qualea sp. 1 − − − − − − − − −1.07 0.02Quararibea duckei 0.07* − 0.35* − − − − − − 0.07Sterculia pruriens − − 0.55* −−−−0.53** −−−−1.80* − −−−−0.27* 0.82** − 0.06Tetragastris altissima − − 0.37 0.23 − − − −−−−0.70* − 0.08Virola michelii − −−−−0.30* − − − 0.43 − − 1.78* 0.07
‡Denoted association to low slope.
Radj
2 .
Radj
2

Recruitment limitation in Neotropical seedlings 195
© 2008 The Authors. Journal compilation © 2008 British Ecological Society, Journal of Ecology, 97, 186–197
(see also Queenborough et al. 2007), and positively withconspecific neighbouring adults, a pattern that could blurspecies habitat preferences.
COMPARING SPECIES RESPONSES TO SEED L IMITATION AND NICHE PARTIT IONING
We found that seedling abundances depended in a species-spe-cific manner on seed arrival and environmental heterogeneity. Weexpected this interspecific variation to be related with life-historytraits (Westoby et al. 2002), and particularly with seed size.Large-seeded species are usually more dispersal-limited thansmall-seeded species (Foster & Janson 1985), and therefore spatialaggregation could be related to seed size. Seidler & Plotkin(2006) showed that conspecific spatial aggregation in tropicaladult trees is significantly correlated with seed size and seeddispersal syndrome. In our study, however, we found that thethree small-seeded species (Hippocratea, Pseudopiptadenia
and Qualea) showed higher seed limitation than the four large-seeded species (Chrysophyllum, Eperua, Sterculia and Virola).These findings might be the result of large-seeded specieshaving more seed sources near traps than small-seeded species.Indeed, these large-seeded species are abundant trees inthe study area. Yet, we do not have extensive data on treedistribution for these species that could bring support to thisassumption.
The species showing a significant relationship between seedand seedling abundances displayed a variety of life-historytraits, being either trees or lianas, shade-tolerant or light-demanding and dispersed by animals, wind or gravity. Thissuggests that the relation between seed arrival and seedlingspatial distribution is independent of these life-history traits.However, this could be also explained by the fact that ourstudy is limited to a finite subset of species. Also, we expectedthat light-demanding species would show a different responseto light availability than shade-tolerant species. Surprisingly,only two of the five species reported as light-demanding weremore abundant in high light environments. The three remain-ing light-demanding species did not show any positiveresponse to higher light availability. Environmental filteringmay require more time to operate (Webb & Peart 2000; Paoliet al. 2006).
CONCLUSIONS
Our study provides evidence that woody species show a varietyof ecological responses to biotic and abiotic factors at theseedling stage. Both seed arrival and environmental filteringappeared to substantially explain seedling abundance ofseveral plant populations, but their relative importanceshowed notable interspecific differences. Dispersal processesappeared to play a critical role in limiting the local abundanceof some species, and habitat specialization was detected forothers. Thus, community assembly emerges from the interactionof different mechanisms involving both dispersal- and niche-based processes. Understanding which ecological processesdetermine the structure of woody plant communities will
require a synthetic theory integrating diverse mechanismsof species coexistence (Chave 2008).
Many seedling populations appear to adopt the ‘sit andwait’ strategy (Baraloto & Goldberg 2004), therefore increasingthe range of occupied sites and the opportunity to be at theright place at the right time for growth to adult stages. Con-tradictory patterns in habitat preferences at the seedling stagesuggest that habitat associations observed in adult trees arenot the result of clear niche differences during regeneration,but rather build up as the plant grows (Webb & Peart 2000;Comita et al. 2007). Linking the importance of dispersal andniche processes with life-history traits in multiple species andin different forests will provide valuable insights into betterunderstanding the spatial distribution of tropical woodyspecies in a changing environment.
Acknowledgements
Authors thank Mailyn Gonzalez, Ludovic Lagrange, Emilie Morin, FloreMoser, Diego Navarrete, Jean-Phillipe Orts, and Thomas Samel for their helpduring the seedling censuses. David Coomes, Robin Chazdon, BettinaEngelbrecht, Kyle Harms, Franck Jabot, Simon Queenborough, and CamWebb, provided insightful comments on the manuscript. This work has beenfunded through a grant Action Concertée Incitative Jeunes Chercheurs of theFrench Research Ministry to JC, by the CNRS and the MNHN to PMF.
References
Baraloto, C. & Goldberg, D.E. (2004) Microhabitat associations and seedlingbank dynamics in a neotropical forest. Oecologia, 141, 701–712.
Boggan, J., Funk, V., Kelloff, C., Hoff, M., Cremers, G. & Feuillet, C. (1997)Checklist of the Plants of the Guianas (Guyana, Surinam, French Guiana),2nd edn. Department of Botany, Smithsonian Institution, Washington,USA.
Bongers, F., Charles-Dominique, P., Forget, P.-M. & Théry, M. (eds) (2001)Nouragues: Dynamics and Plant Animal Interactions in a Neotropical
Rainforest. Kluwer Academic Publishers, Dordrecht.Burnham, K.P. & Anderson, D.R. (2002) Model Selection and Multimodel
Inference: A Practical Information-Theoretic Approach. Springer, New York.Chave, J. (2008) Spatial variation in tree species composition across tropical
forest: patterns and process. Tropical Forest Community Ecology (edsS. Schnitzer & W. Carson). In press.
Chave, J. & Leigh, E.G. (2002) A spatially explicit neutral model of ß-diversityin tropical forests. Theoretical Population Biology, 62, 153–168.
Chust, G., Chave, J., Condit, R., Aguilar, S., Lao, S. & Perez, R. (2006)Determinants and spatial modeling of tree beta-diversity in a tropical forestlandscape in Panama. Journal of Vegetation Science, 17, 83–92.
Comita, L.S., Condit, R. & Hubbell, S.P. (2007) Developmental changes inhabitat associations of tropical trees. Journal of Ecology, 95, 482–492.
Dalling, J.W., Hubbell, S.P. & Silvera, K. (1998) Seed dispersal, seedlingestablishment and gap partitioning among tropical pioneer trees. Journal of
Ecology, 86, 674–689.Dalling, J.W., Muller-Landau, H.C., Wright, S.J. & Hubbell, S.P. (2002) Role of
dispersal in the recruitment limitation of neotropical pioneer species.Journal of Ecology, 90, 714–727.
Engelbrecht, B.M.J., Comita, L.S., Condit, R., Kursar, T.A., Tyree, M.T.,Turner, B.L. & Hubbell, S.P. (2007) Drought sensitivity shapes speciesdistribution patterns in tropical forests. Nature, 447, 80–83.
Engelbrecht, B.M.J., Wright, S.J. & DeSteven, D. (2002) Survival and ecophys-iology of tree seedlings during El Niño drought in a tropical moist forest inPanama. Journal of Tropical Ecology, 18, 569–579.
Feer, F., Juillot, C., Simmen, B., Forget, P.-M., Bayart, F. & Chauvet, S. (2001)Recruitment, a multi-stage process with unpredictable result: the case of aSapotaceae in French Guianan forest. Revue d’Ecologie – La Terre et la Vie,56, 119–145.
Fine, P.V.A., Mesones, I. & Coley, P.D. (2004) Herbivores promote habitatspecialization by trees in Amazonian forests. Science, 305, 663–665.
Forget, P.-M. (1996) Removal of seeds of Carapa procera (Meliaceae) by

196 N. Norden et al.
© 2008 The Authors. Journal compilation © 2008 British Ecological Society, Journal of Ecology, 97, 186–197
rodents and their fate in rainforest in French Guiana. Journal of Tropical
Ecology, 12, 751–761.Foster, S.A. & Janson, C.H. (1985) The relationship between seed size and
establishment conditions in tropical woody plants. Ecology, 66, 773–780.Frazer, G.W., Canham, C.D. & Lertzman, K.P. (1999) Gap Light Analyzer
(GLA), Version 2.0. Copyright © 1999: Simon Fraser University, Burnaby,British Columbia, and the Institute of Ecosystem Studies, Millbrook, NewYork.
Grubb, P.J. (1977) Maintenance of species-richness in plant communities:importance of regeneration niche. Biological Reviews of the Cambridge
Philosophical Society, 52, 107–145.Hall, J.S., Ashton, P.M.S. & Berlyn, G.P. (2003) Seedling performance of four
sympatric Entandrophragma species (Meliaceae) under simulated fertilityand moisture regimes of a Central African rain forest. Journal of Tropical
Ecology, 19, 55–66.Hardesty, B.D., Hubbell, S.P. & Bermingham, E. (2006) Genetic evidence of
frequent long-distance recruitment in a vertebrate-dispersed tree. Ecology
Letters, 9, 516–525.Hubbell, S.P. (2001) The Unified Neutral Theory of Biodiversity and Biogeography.
Princeton University Press, Princeton.Hubbell, S.P. & Foster, R.B. (1986) Biology, chance, and history and the
structure of tropical rain forest tree communities. Community Ecology (edsJ. Diamond & T.J. Case), pp. 314–329. Harper & Row, New York.
Hubbell, S.P., Foster, R.B., O’Brien, S.T., Harms, K.E., Condit, R., Wechsler,B., Wright, S.J. & Lao, S.L. (1999) Light-gap disturbances, recruitment lim-itation, and tree diversity in a neotropical forest. Science, 283, 554–557.
Hurtt, G.C. & Pacala, S.W. (1995) The consequences of recruitment limitation– Reconciling chance, history and competitive differences between plants.Journal of Theoretical Biology, 176, 1–12.
Jansen, P.A., Bongers, F. & Hemerik, L. (2004) Seed mass and mast seedingenhance dispersal by a neotropical scatter-hoarding rodent. Ecological
Monographs, 74, 569–589.Janzen, D.H. (1970) Herbivores and the number of tree species in tropical
forests. American Naturalist, 104, 501–528.Jones, M.M., Tuomisto, H., Clark, D.B. & Olivas, P. (2006) Effects of
mesoscale environmental heterogeneity and dispersal limitation on floristicvariation in rain forest ferns. Journal of Ecology, 94, 181–195.
Leishman, M.R., Wright, I.A., Moles, A.T. & Westoby, M. (2000) Theevolutionary ecology of seed size. Seeds: The Ecology of Regeneration in
Plant Communities (ed. M. Fenner), pp. 31–57. CAB International,Wallingford, Oxfordshire.
Makana, J.R. & Thomas, S.C. (2004) Dispersal limits natural recruitment ofAfrican mahoganies. Oikos, 106, 67–72.
Molofsky, J. & Augspurger, C.K. (1992) The effect of leaf litter on earlyseedling establishment in a tropical forest. Ecology, 73, 68–77.
Montgomery, R.A. & Chazdon, R.L. (2002) Light gradient partitioning bytropical tree seedlings in the absence of canopy gaps. Oecologia, 131, 165–174.
Mori, S.A., Cremers, G., Gracie, C., de Granville, J.J., Heald, S.V., Hoff, M. &Mitchell, J.D. (2002) Guide to the Vascular Plants of Central French Guiana.
Part 2. Dicotyledons. New York Botanical Garden Press, New York.Muller-Landau, H.C., Wright, S.J., Calderón, O., Hubbell, S.P. & Foster, R.B.
(2002) Assessing recruitment limitation: concepts, methods and case-studiesfrom a topical forest. Seed Dispersal and Frugivory (eds D.J. Levey, W.R.Silva & M. Galetti), pp. 35–53. CAB International, Wallingford.
Nathan, R. & Muller-Landau, H.C. (2000) Spatial patterns of seed dispersal,their determinants and consequences for recruitment. Trends in Ecology and
Evolution, 15, 278–285.Nicotra, A.B., Chazdon, R.L. & Iriarte, S.V.B. (1999) Spatial heterogeneity of
light and woody seedling regeneration in tropical wet forests. Ecology, 80,1908–1926.
Norden, N., Chave, J., Caubère, A., Châtelet, P., Ferroni, N., Forget, P.-M. &Thébaud, C. (2007) Is temporal variation in seedling dynamics determinedby environment or by seed arrival? A test in a neotropical forest. Journal of
Ecology, 95, 507–516.Palmiotto, P.A., Davies, S.J., Vogt, K.A., Ashton, M.S., Vogt, D.J. & Ashton, P.S.
(2004) Soil-related habitat specialization in dipterocarp rain forest treespecies in Borneo. Journal of Ecology, 92, 609–623.
Paoli, G.D., Curran, L.M. & Zak, D.R. (2006) Soil nutrients and beta diversityin the Bornean Dipterocarpaceae: evidence for niche partitioning by tropicalrain forest trees. Journal of Ecology, 94, 157–170.
Poncy, O., Sabatier, D., Prévost, M.-F. & Hardy, I. (2001) The lowland highrainforest: structure and tree species diversity. Nouragues: Dynamics and
Plant Animal Interactions in a Neotropical Rain Forest (eds F. Bongers,
P. Charles-Dominique, P.-M. Forget & M. Théry), pp. 31–46. KluwerAcademic Publishers, Dordrecht.
Potts, M.D., Ashton, P.S., Kaufman, L.S. & Plotkin, J.B. (2002) Habitat pat-terns in tropical rain forests: a comparison of 105 plots in northwest Borneo.Ecology, 83, 2782–2797.
Potts, M.D., Davies, S.J., Bossert, W.H., Tan, S. & Supardi, M.N.N. (2004)Habitat heterogeneity and niche structure of trees in two tropical rain for-ests. Oecologia, 139, 446–453.
Poulsen, J.R., Clark, C.J., Connor, E.F. & Smith, T.B. (2002) Differentialresource use by primates and hornbills: implications for seed dispersal.Ecology, 83, 228–240.
Queenborough, S.A., Burslem, D.F.R.P., Garwood, N.C. & Valencia, R. (2007)Neighborhood and community interactions determine the spatial pattern oftropical tree seedling survival. Ecology, 88, 2248–2258.
R Development Core Team (2006) R: A Language and Environment for Statistical
Computing. R Foundation for Statistical Computing, Vienna, Austria.Rijkers, T., de Vries, P.J., Pons, T.L. & Bongers, F. (2000) Photosynthetic
induction in saplings of three shade-tolerant tree species: comparingunderstorey and gap habitats in a French Guiana rain forest. Oecologia, 125,331–340.
Russo, S.E. (2005) Linking seed fate to natural dispersal patterns: factorsaffecting predation and scatter-hoarding of Virola calophylla seeds in Peru.Journal of Tropical Ecology, 21, 243–253.
Sabatier, D. (1985) Saisonnalité et déterminisme du pic de fructification enforêt guyanaise. Revue d’Ecologie – La Terre et la Vie, 40, 289–320.
Schupp, E.W. (1995) Seed seedling conflicts, habitat choice, and patterns ofplant recruitment. American Journal of Botany, 82, 399–409.
Seidler, T.G. & Plotkin, J.B. (2006) Seed dispersal and spatial pattern in tropicaltrees. PLoS Biology, 4, e344. DOI: 10.1371/journal.pbio.0040344.
Stevenson, P.R. (2000) Seed dispersal by woolly monkeys (Lagothrix
lagothricha) at Tinigua National Park, Colombia: dispersal distance,germination rates, and dispersal quantity. American Journal of Primatology,50, 275–289.
Svenning, J.C. & Wright, S.J. (2005) Seed limitation in a Panamian forest.Journal of Ecology, 93, 853–862.
Svenning, J.C., Kinner, D.A., Stallard, R.F., Engelbrecht, B.M.J. & Wright, S.J.(2004) Ecological determinism in plant community structure across atropical forest landscape. Ecology, 85, 2526–2538.
Tilman, D. (1982) Ressource Competition and Community Structure. PrincetonUniversity Press, Princeton.
Tilman, D. (1994) Competition and biodiversity in spatially structured habitats.Ecology, 75, 2–16.
Tuomisto, H., Poulsen, A.D., Ruokolainen, K., Moran, R.C., Quintana, C.,Celi, J. & Canas, G. (2003) Linking floristic patterns with soil heterogeneityand satellite imagery in Ecuadorian Amazonia. Ecological Applications, 13,352–371.
Turnbull, L.A., Crawley, M.J. & Rees, M. (2000) Are plant populationsseed-limited? A review of seed sowing experiments. Oikos, 88, 225–238.
Uriarte, M., Canham, C.D., Thompson, J., Zimmerman, J.K. & Brokaw, N.(2005) Seedling recruitment in a hurricane-driven forest: light limitation,density-dependence and the spatial distribution of parent trees. Journal of
Ecology, 93, 291–304.van der Meer, P.J., Sterck, F.J. & Bongers, F. (1998) Tree seedling performance
in canopy gaps in a tropical rain forest at Nouragues, French Guiana.Journal of Tropical Ecology, 14, 119–137.
van Roosmalen, M.G.M. (1985) Fruits of the Guianan Flora. Institute ofSystematic Botany, Utrecht University, Utrecht.
Wang, B.C. & Smith, T.B. (2002) Closing the seed dispersal loop. Trends in
Ecology and Evolution, 17, 379–385.Webb, C.O. & Peart, D.R. (1999) Seedling density dependence promotes
coexistence of Bornean rain forest trees. Ecology, 80, 2006–2017.Webb, C.O. & Peart, D.R. (2000) Habitat associations of trees and seedlings in
a Bornean rain forest. Journal of Ecology, 88, 464–478.Webb, C.O. & Peart, D.R. (2001) High seed dispersal rates in faunally intact
tropical rain forest: theoretical and conservation implications. Ecology
Letters, 4, 491–499.Weiher, E. & Keddy, P.A. (1995) Assembly rules, null models, and trait dispersion:
new questions from old patterns. Oikos, 74, 159–164.Westoby, M., Falster, D.S., Moles, A.T., Vesk, P.A. & Wright, I.J. (2002) Plant
ecological strategies: some leading dimensions of variation between species.Annual Review of Ecology and Systematic, s33, 125–159.
Received 21 January 2008; accepted 9 September 2008
Handling Editor: Bettina Engelbrecht

Recruitment limitation in Neotropical seedlings 197
© 2008 The Authors. Journal compilation © 2008 British Ecological Society, Journal of Ecology, 97, 186–197
Supporting Information
Additional Supporting Information may be found in theonline version of this article:
Appendix S1. Plates illustrating the study species.
Appendix S2. One-way anova for the effect of species, seedsize, dispersal syndrome and life history on seed andestablishment limitation.
Appendix S3. Figure illustrating the mean number of seedsper trap (± SD) for each species.
Please note: Wiley-Blackwell are not responsible for thecontent or functionality of any supporting materials suppliedby the authors. Any queries (other than missing material)should be directed to the corresponding author for the article.