Embed Size (px)
Citation preview

Interstage Business Process Manager Analytics V12.0
Studio Guide
Windows/Linux
January 2012

Studio Guide
ii
Trademarks
Trademarks of other companies are used in this documentation only to identify particular products or systems.
Product Trademarks/Registered Trademarks
Microsoft, Windows, and Windows Server are trademarks or registered trademarks of Microsoft Corporation in the United States and other countries.
Oracle and Java are registered trademarks of Oracle and/or affiliates. Other names may be trademarks of their respective owners.
Linux is a registered trademark or trademark of Linus Torvalds in the United States and other countries.
Red Hat is a trademark or registered trademark of Red Hat Inc. in the United States and other countries.
SQL Server is a Microsoft Corporation (USA) product.
All other company and product names referred to in this document are general trademarks or registered trademarks of their respective owners.
Request
This document may be revised without notice.
Do not pass on this document to other parties without permission.
Fujitsu bears no responsibility for third-party infringements of patent or other rights arising out of use of the data contained in this document.
This document contains technology relating to strategic products controlled by export control laws of the producing and/or exporting countries. This document or a portion thereof should not be exported (or re-exported) without authorization from the appropriate government authorities in accordance with such laws. -- Fujitsu Limited
January 2012 First Edition All Rights Reserved, Copyright © FUJITSU LIMITED 2012
Interstage Business Process Manager Analytics

About this Manual
About this Manual
This chapter provides a general introduction to this user guide, describing its contents, such as an overview of the chapters, common terms used in the manual, and other related information to help you effectively use the guide.
Key concepts covered in this chapter include:
Purpose of this Guide
Target Audience
Chapter Overview
Reference Material
Customer Support
Purpose of this Guide
The Fujitsu Interstage Business Process Manager Analytics (BPMA) comprises two key components—the Management Console and Studio.
The Analytics Management Console facilitates configuration of BPMA environment settings, while the Analytics Studio enables data collection, data analysis, and displays the end result using appropriate visualization techniques, such as pie-charts and bar graphs.
This user guide describes the Analytics Studio, explaining its features, functionality, and how to effectively use it to derive relevant Business Process Management (BPM) metrics.
Target Audience
This user guide is intended for those who need to use the Analytics Studio graphical user interface (GUI) to define, configure, and administer various elements that enforce the BPMA Business Activity Monitoring (BAM) capabilities.
NOTE
Prior experience of the BPMA 11.1 is beneficial but not mandatory.
iii
Studio Guide
Chapter Overview
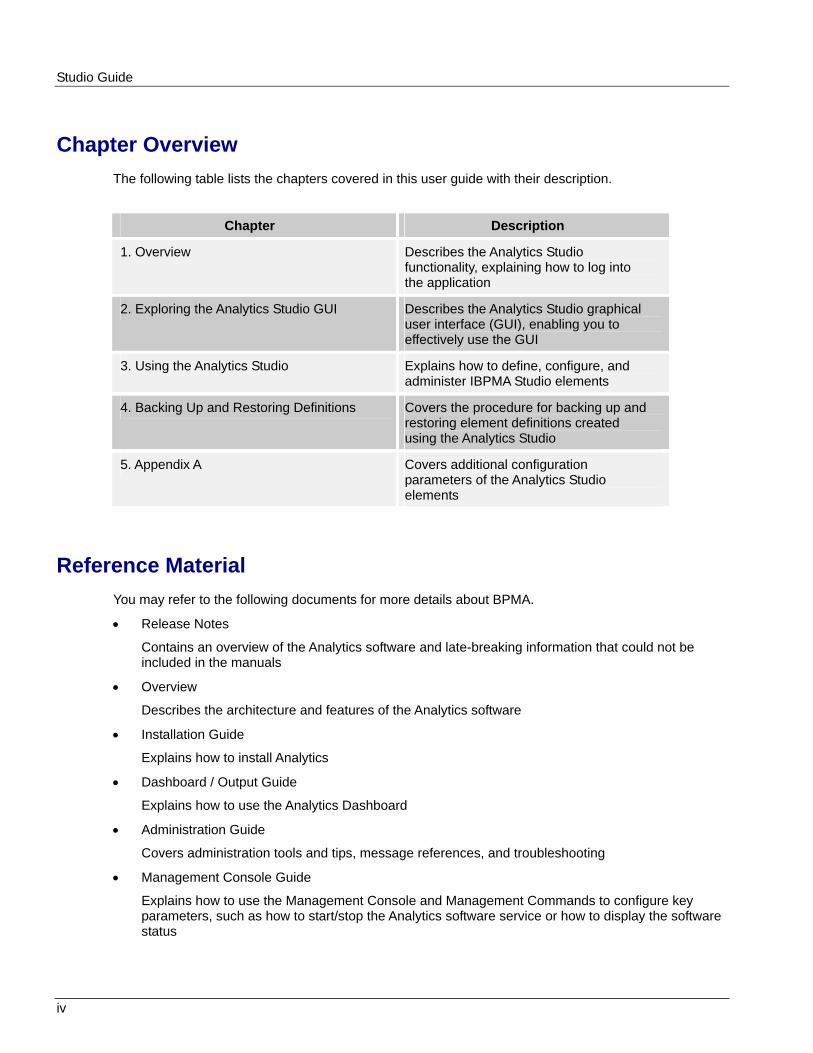
The following table lists the chapters covered in this user guide with their description.
Chapter Description
1. Overview Describes the Analytics Studio functionality, explaining how to log into the application
2. Exploring the Analytics Studio GUI Describes the Analytics Studio graphical user interface (GUI), enabling you to effectively use the GUI
3. Using the Analytics Studio Explains how to define, configure, and administer IBPMA Studio elements
4. Backing Up and Restoring Definitions Covers the procedure for backing up and restoring element definitions created using the Analytics Studio
5. Appendix A Covers additional configuration parameters of the Analytics Studio elements
Reference Material
You may refer to the following documents for more details about BPMA.
Release Notes
Contains an overview of the Analytics software and late-breaking information that could not be included in the manuals
Overview
Describes the architecture and features of the Analytics software
Installation Guide
Explains how to install Analytics
Dashboard / Output Guide
Explains how to use the Analytics Dashboard
Administration Guide
Covers administration tools and tips, message references, and troubleshooting
Management Console Guide
Explains how to use the Management Console and Management Commands to configure key parameters, such as how to start/stop the Analytics software service or how to display the software status
iv

About this Manual
v
Process Discovery Guide
Explains how to use Process Discovery that generates process diagrams using historical data
Customer Support
In case you encounter any issues using the IBPMA Studio or require further assistance, contact the Fujitsu Technical Support consultant.

About this Manual
vi

Table of Contents
Table of Contents
About this Manual Purpose of this Guide .................................................................................................................................. iii Target Audience........................................................................................................................................... iii Chapter Overview........................................................................................................................................ iv Reference Material ...................................................................................................................................... iv Customer Support ........................................................................................................................................v
Chapter 1 Overview
What is the Analytics Studio? ......................................................................................................................... 1-2 How to Access the Analytics Studio?.............................................................................................................. 1-4
Chapter 2 Exploring the Analytics Studio GUI
Using the Menu Bar ....................................................................................................................................... 2-2 Using the Navigation Pane............................................................................................................................. 2-4
Element Navigation .................................................................................................................................. 2-4 Using the Draft Tab ............................................................................................................................. 2-5 Using the Ready Tab........................................................................................................................... 2-5 Using the Published Tab ..................................................................................................................... 2-5
Related Elements ..................................................................................................................................... 2-6 Recent Elements ...................................................................................................................................... 2-7
Using the Workspace ..................................................................................................................................... 2-8 Studio Home............................................................................................................................................. 2-8 Overview ................................................................................................................................................ 2-10
View element specifications ...............................................................................................................2-11 Change the state of multiple elements simultaneously .................................................................................................................................. 2-12 View related elements....................................................................................................................... 2-15
Editor ....................................................................................................................................................... 2-16 Using the Quick Panel.................................................................................................................................. 2-17
Element Issues Tab ................................................................................................................................ 2-18 Preview Tab ............................................................................................................................................ 2-19 Running Status Tab ................................................................................................................................ 2-20 Locked Elements Tab ............................................................................................................................. 2-21
Using the Analytics Studio GUI Icons ........................................................................................................... 2-23
vii

Table of Contents
Chapter 3 Using the Analytics Studio
Understanding the Draft-Ready-Published Lifecycle..........................................................................................................................................................3-2 Creating Elements ..........................................................................................................................................3-4
Creating Connections................................................................................................................................3-4 Creating Collection Rules..........................................................................................................................3-4
Creating RDB Collection Rules............................................................................................................3-5 Creating Text Collection Rules...........................................................................................................3-11
Creating Event Groups............................................................................................................................3-18 Creating Events.......................................................................................................................................3-19 Creating Event Modifiers.........................................................................................................................3-23
Creating Statistical Event Modifiers ...................................................................................................3-23 Creating Alert Summary (business) Event Modifiers............................................................................................................................................3-26
Creating Alerts.........................................................................................................................................3-30 Creating Alert Filters................................................................................................................................3-33 Creating Charts .......................................................................................................................................3-35 Creating Layouts .....................................................................................................................................3-37 Creating Dashboard Profiles ...................................................................................................................3-37 Creating Dashboard Groups ...................................................................................................................3-39 Creating Reports .....................................................................................................................................3-42
Editing Elements...........................................................................................................................................3-44 Editing Connections ................................................................................................................................3-44 Editing Collection Rules ..........................................................................................................................3-44
Editing RDB collection rules ..............................................................................................................3-45 Editing Text collection rules ...............................................................................................................3-45 Editing BPM collection rules ..............................................................................................................3-46
Editing Event Groups ..............................................................................................................................3-51 Editing Events .........................................................................................................................................3-52
Editing System Events.......................................................................................................................3-55 Editing Event Modifiers ...........................................................................................................................3-56
Example of How to Set the Calculation Target Period .....................................................................................................................................3-57
Editing Alerts ...........................................................................................................................................3-58 Editing Alert Filters ..................................................................................................................................3-61 Editing Charts..........................................................................................................................................3-62 Editing Layouts........................................................................................................................................3-68 Editing Dashboard Profiles......................................................................................................................3-70 Editing Dashboard Groups ......................................................................................................................3-72 Editing Reports........................................................................................................................................3-73
Duplicating Elements ....................................................................................................................................3-75 Deleting Elements.........................................................................................................................................3-77 Deactivating and Activating Elements...........................................................................................................3-79
viii

Table of Contents
Deactivating Elements............................................................................................................................ 3-79 Activating Elements ................................................................................................................................ 3-80
Sharing Elements......................................................................................................................................... 3-81 Readying Elements ...................................................................................................................................... 3-82 Publishing Elements..................................................................................................................................... 3-83
Chapter 4 Backing Up and Restoring Definitions
Backing Up Definitions ................................................................................................................................... 4-2 Procedure for Backing Up Definitions....................................................................................................... 4-2
Stop related systems........................................................................................................................... 4-2 Create a backup directory................................................................................................................... 4-2 Copy definition files and Analytics eRule Engine resources................................................................................................................................ 4-2 Back up tables .................................................................................................................................... 4-3 Restart related systems ...................................................................................................................... 4-3
Restoring Definitions ...................................................................................................................................... 4-4 Procedure for Restoring Definitions.......................................................................................................... 4-4
Stop related systems........................................................................................................................... 4-4 Restore definition files and Analytics eRule Engine resources...................................................................................................................... 4-4 Restore tables..................................................................................................................................... 4-4 Restart related systems ...................................................................................................................... 4-5
Appendix A Additional Configuration Parameters
RDB Collection Rule Configuration Parameters.............................................................................................A-2 Collection Management Parameters ........................................................................................................A-2 Records Difference Settings .....................................................................................................................A-3
Alert Configuration Parameters ......................................................................................................................A-6 Event Configuration Parameters...............................................................................................................A-6 Alert Action Configuration Parameters......................................................................................................A-7
Chart Configuration Parameters.....................................................................................................................A-9 Event Configuration Parameters...............................................................................................................A-9 Chart Settings...........................................................................................................................................A-9
ix

Table of Contents
x

Chapter 1 Overview
This chapter provides a general introduction to the Interstage Business Process Manager Analytics (BPMA) Studio, a graphical user interface (GUI) used to configure and administer objects for the Analytics system.
Key concepts covered in this chapter include:
What is the Analytics Studio?
How to Access the Analytics Studio?
1-1

Chapter 1: Overview
What is the Analytics Studio?
A key aspect of BPMA is the collection and management of appropriate business metrics to derive business trends, identify critical conditions, and optimize production.
The Analytics Studio (see Figure 1-1) enables you to define objects, referred to as elements, for collecting, analyzing, and administering business metrics.
Figure 1-1 Analytics Studio home page
Using the Analytics Studio, you can:
Identify the data to be collected from a data source
Apply specific conditions for data collection
Assign the collected data to specific events for data storage
Define calculations on the collected data to derive business statistics and trends
Select appropriate visualization techniques, such as bar graphs and pie charts, to display business metrics
Define alerts to highlight exceptions or critical situations in a business environment
Design layouts for the Analytics Dashboard to depict the most relevant Key Performance Indicators (KPIs) specific to your business
Implement user profiling by assigning specific Analytics Studio features, functionality, and dashboard views to distinct users depending on their role and responsibilities
1-2

What is the Analytics Studio?
Figure 1-2 below displays the key Analytics Studio procedures. All procedures are identified by a number indicative of the preferred order in which they should be created.
Figure 1-2 Analytics Studio procedures
1-3

Chapter 1: Overview
How to Access the Analytics Studio?
IMPORTANT!
Before accessing the Analytics Studio, ensure the iFlow.jar (for IBPM) is configured with the Analytics Server. This file enables integration of Analytics with Interstage BPM systems. For more details, refer to the Interstage Business Process Manager Analytics Installation Guide.
To log into the Analytics Studio:
1. Open a Web browser, and type the following URL in the Address bar:
http://server:port/ibpmm
In the above URL, server is the host name or IP address of the Analytics Server and port is the port number used by the Web server. The default port number for the built-in application server is 40330. For other application servers, confirm and specify their respective port number. If omitted, the default value of 80 is used.
2. On the login page, specify your user ID, password, and click Login.
NOTE
You will not be able to log into the Analytics Studio if your user ID does not have the required permissions for accessing the application. Contact the Management Console administrator to assign you appropriate permissions, or even, create a new user ID, if required.
Figure1-3 BPMA login page
3. Select the Analytics Studio tab to display the Analytics Studio home page.
1-4

Chapter 2 Exploring the Analytics Studio GUI
The Interstage Business Process Manager Analytics (BPMA) Studio provides an intuitive graphical user interface (GUI) comprising four distinct sections—the menu bar, navigation pane, Workspace, and Quick Panel (see Figure 2-1). Each of these sections provides several options to define and configure objects that enforce the Business Activity Monitoring (BAM) capabilities of Analytics.
Figure 2-1 Analytics Studio GUI
This chapter describes the different sections of the Analytics Studio GUI, explaining their purpose and how to effectively use them.
Key concepts covered in this chapter include:
Using the Menu Bar
Using the Navigation Pane
Using the Workspace
Using the Quick Panel
Using the Analytics Studio GUI Icons
2-1

Chapter 2: Exploring the Analytics Studio GUI
Using the Menu Bar
NOTE
The Analytics Studio uses objects, referred to as "elements", for collecting and managing Business Process Management (BPM) metrics. An example of an Analytics Studio element is the "collection rule" that is used to collect data from a monitored data source. Another example is the "event" that stores this collected data.
The menu bar provides options that facilitate basic Analytics Studio functions, such as creating new elements, refreshing the current view, and accessing Help.
Figure 2-2 displays the various menus that comprise the Analytics Studio menu bar. Refer to Table 2-1 for a brief description of these menus and their respective menu options.
Figure 2-2 Analytics Studio menu bar
IMPORTANT!
The menus and their respective options vary for different Analytics Studio users depending on their access rights and permissions.
Table 2-1 Analytics Studio menu options
Menu Menu Option Description
Action New Provides options for creating Analytics Studio elements, such as collection rules, events, and alerts
Recent Elements Displays a list of recently modified elements
View Refresh Updates the Analytics Studio GUI with the latest data
Studio Home Displays the Analytics Studio home page
Element Issues Opens the Element Issues tab of the Quick Panel
Preview Opens the Preview tab of the Quick Panel
2-2

Using the Menu Bar
2-3
Menu Menu Option Description
Running Status Opens the Running Status tab of the Quick Panel
Locked Elements Opens the Locked Elements tab of the Quick Panel
Help Help Displays the Analytics Studio Help
About Analytics Studio Displays the version and copyright information for the Analytics Studio
IMPORTANT!
The Analytics Studio online help requires the Java Runtime Environment (JRE) installed and enabled on your local computer. If JRE is not installed, download the latest version from http://www.java.com/en/download/index.jsp.

Chapter 2: Exploring the Analytics Studio GUI
Using the Navigation Pane
The navigation pane displays elements that you can manipulate using the Analytics Studio. It comprises three key areas—Element Navigation, Related Elements, and Recent Elements. Selecting an element from the navigation pane displays its specification.
Element Navigation
The Element Navigation area is the key area of the navigation pane that enables processing of Analytics Studio elements. It comprises the Draft, Ready, and Published tabs that enable you to define, verify, and apply element definitions to an Analytics system. The Draft tab is selected by default.
2-4
Using the Navigation Pane
IMPORTANT!
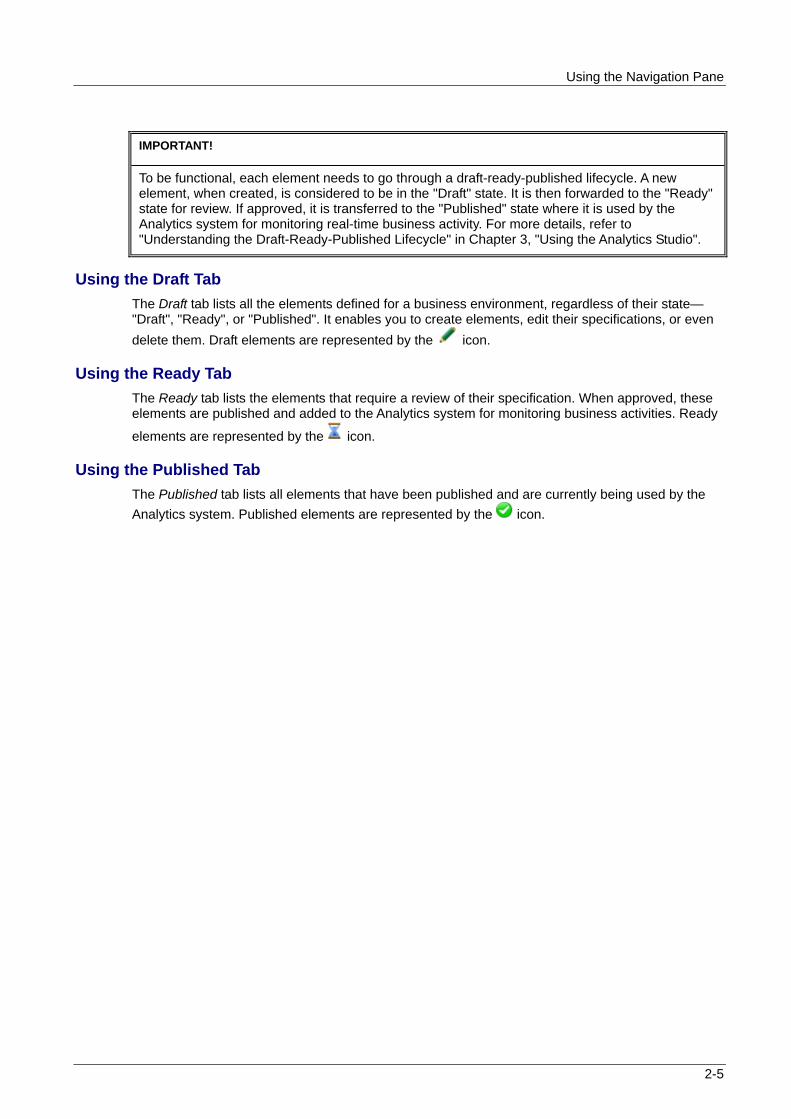
To be functional, each element needs to go through a draft-ready-published lifecycle. A new element, when created, is considered to be in the "Draft" state. It is then forwarded to the "Ready" state for review. If approved, it is transferred to the "Published" state where it is used by the Analytics system for monitoring real-time business activity. For more details, refer to "Understanding the Draft-Ready-Published Lifecycle" in Chapter 3, "Using the Analytics Studio".
Using the Draft Tab
The Draft tab lists all the elements defined for a business environment, regardless of their state—"Draft", "Ready", or "Published". It enables you to create elements, edit their specifications, or even
delete them. Draft elements are represented by the icon.
Using the Ready Tab
The Ready tab lists the elements that require a review of their specification. When approved, these elements are published and added to the Analytics system for monitoring business activities. Ready
elements are represented by the icon.
Using the Published Tab
The Published tab lists all elements that have been published and are currently being used by the
Analytics system. Published elements are represented by the icon.
2-5

Chapter 2: Exploring the Analytics Studio GUI
Related Elements
Analytics Studio elements are dependent on each other. For example, to be functional, a layout requires chart details, which in turn, uses event properties. Similarly, layouts are referenced by dashboard profiles, which are further used in dashboard groups.
Modifying the specification of an element impacts its related elements. Therefore, before making changes to an element, it is recommended you view its related elements. The Related Elements panel (see Figure 2-3) enables you to do so.
Simply, select an element from the navigation pane, and then, select the Open panel icon ( ) of the Related Elements panel to display its related elements. Additionally, select an element from the Related Elements panel to view its specification.
NOTE
The Related Elements panel displays the relationship between "Shared" elements only. You can browse up to three levels of nested elements, including the root element. However, note that related connections are not displayed in the relation view.
Figure 2-3 Related Elements panel
2-6
Using the Navigation Pane
Recent Elements
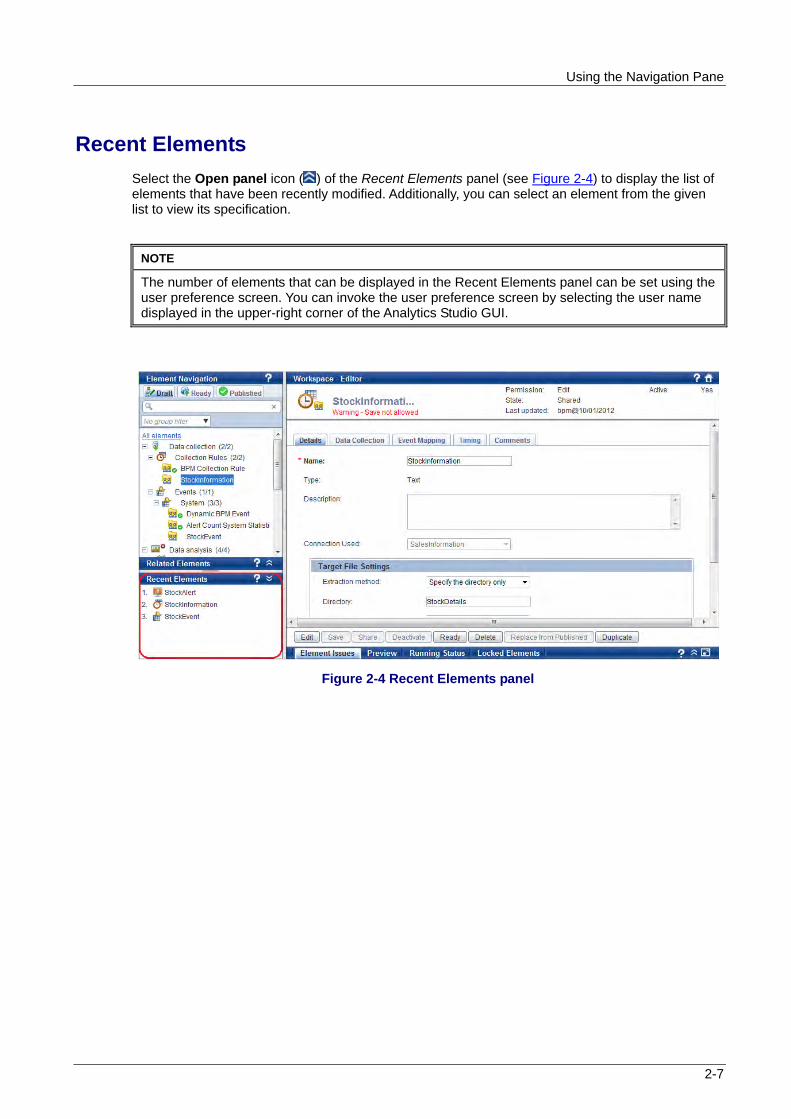
Select the Open panel icon ( ) of the Recent Elements panel (see Figure 2-4) to display the list of elements that have been recently modified. Additionally, you can select an element from the given list to view its specification.
NOTE
The number of elements that can be displayed in the Recent Elements panel can be set using the user preference screen. You can invoke the user preference screen by selecting the user name displayed in the upper-right corner of the Analytics Studio GUI.
Figure 2-4 Recent Elements panel
2-7

Chapter 2: Exploring the Analytics Studio GUI
Using the Workspace
The Workspace is the primary area where you can edit element specifications, define their function, and control their behavior to derive relevant business metrics.
The Analytics Studio provides three distinct views of the Workspace:
Studio Home
Overview
Editor
Studio Home
The Studio Home is the Analytics Studio home page (see Figure 2-5) that is displayed when you first log into the application. It depicts all the studio elements aligned in a sequential flow indicative of their interdependencies on each other. For example, events are referenced by event modifiers, charts, and alerts. Similarly, alert filters are used by layouts, which are further referenced by dashboard profiles.
Figure 2-5 Studio Home
As depicted in Figure 2-5, the Studio Home classifies elements as Data collection, Data analysis, and Presentation elements. Refer to Table 2-2 or a brief description of these elements.
2-8

Using the Workspace
TIP!
On the Studio Home, move the pointer over an element to view its description. Moreover, each element is functional, and on being clicked, enables you to create a new element of a specific type.
Table 2-2: Analytics Studio elements
Element Category Description Types
Data collection elements Collect and store data from various data sources deployed in a business environment
- Collection rules
- Events
Data analysis elements Manipulate the collected data—perform calculations, apply conditions, sort and filter data—to derive business statistics, trends, and patterns
- Event modifiers
- Alerts
- Alert filters
- Charts
Presentation elements Components used in the Analytics dashboard
- Layouts
- Dashboard profiles
- Dashboard groups
- Reports
IMPORTANT!
The Studio Home displays elements that are specific to an end user's profile. Therefore, if you do not have the appropriate rights and permissions, some elements might appear disabled, restricting you access.
Note that the "Connection" element would always be disabled for all Analytics Studio users because connections are configured in the Management Console.
2-9

Chapter 2: Exploring the Analytics Studio GUI
Overview
Select a parent node, such as Collection Rules, Events, or Alerts, from the navigation pane to display the Overview page. This page provides a cumulative view of all the elements, of a specific type, defined for the Analytics system. Figure 2-6 depicts the Collection Rules Overview page displayed on selecting the Collection Rules node in the navigation pane.
Figure 2-6 Collection Rules Overview page
Each element listed on the Overview page is qualified by several attributes, such as Name, Type, Schedule, and State (see Figure 2-6). However, these attributes vary for different element types. For example, the Events Overview page does not list the "Schedule" details though they are displayed in the Collection Rules Overview.
Using the Overview page, you can:
View element specifications
Change the state of multiple elements simultaneously
View related elements
2-10

Using the Workspace
View element specifications
The Overview page displays elements of a specific type. You can select an element to view its specification (see Figure 2-7). Additionally, if you have the appropriate rights, edit the specifications to conform to your requirements.
Figure 2-7 Viewing element specifications
2-11

Chapter 2: Exploring the Analytics Studio GUI
Change the state of multiple elements simultaneously
To change the state of multiple elements collectively:
1. Select a parent node, such as Collection Rules, Events, or Alerts, from the Draft tab of the navigation pane to display its respective Overview page. The following image displays the Events Overview page with the Events node selected in the navigation pane.
2. From the State list, select any of the following values to filter elements in that state.
Being edited — Displays elements that are currently being edited
Shared — Displays elements in the Shared state, available to all users for editing
Ready — Displays elements that are in the Ready state and require a review of their specification before they can be published
Rejected — Displays elements that have been rejected and cannot be published
Being edited (published) — Displays published elements that are currently being edited
Shared (published) — Displays published elements that are in the Shared state
Ready (published) — Displays published elements that are in the Ready state
Rejected (published) — Displays published elements that have been rejected from being published
Deleted (published) — Displays published elements that have been deleted
IMPORTANT!
To be functional, each element undergoes the draft-ready-published lifecycle. A new element, when created, is considered to be in the "draft" state. It is then forwarded to the "Ready" state for review. If approved, it is transferred to the "Published" state where it is used by the Analytics system for monitoring real-time business activity. For more details, refer to "Understanding the Draft-Ready-Published Lifecycle".
2-12

Using the Workspace
3. Select the check box for elements whose state needs to be changed.
4. Select any of the buttons, aligned at the bottom of the Overview page, to change the state of the element. Refer to Table 2-3 for a brief description of these buttons.
NOTE
Only specific buttons will be enabled depending on the current state of the selected elements and your Analytics Studio rights and permissions. Moreover, all these buttons are available for elements in the Draft state only.
Table 2-3 Action buttons
Button Description
Edit - Enables you to edit an element's definition and sets an exclusive lock on the element, restricting other users from viewing the changes you make to the element
- While you edit the element, other Analytics Studio users view the previous version of the element's definition
- On being clicked, changes to Cancel Edit, indicating that the element's specification is currently being edited; select Cancel Edit to complete editing
Save - Enables you to save changes made to the element specification
- Saving does not display the revised element specifications to all Analytics Studio users. You need to "share" an element to display its specifications globally.
Share Shares the element with all Analytics Studio users, displaying the latest version of the element with the most current specification; however, the element is not editable at this stage
2-13

Chapter 2: Exploring the Analytics Studio GUI
2-14
Button Description
Deactivate - Disables an element's definition, restricting it from being used by Analytics
- Is applicable to certain elements, including collection rules, event modifiers, alerts, alert filters, and reports
- Deactivated elements can progress to the Shared state though they are not used in Analytics operations
Activate Enables a deactivated element
Ready Aligns the element under the Ready tab for a review of its specification; at this stage, the element is not editable
Cancel Ready Enables you to revoke the Ready state of an element and return it to the Shared state, enabling you to edit the element
Delete - Enables you to delete an element
- "Shared" elements that have not been published are deleted immediately; however, deleting "published" elements in the "Shared" state simply changes their state to Deleted (published) and requires deletion by Advanced Analytics Studio users (with appropriate rights and permissions) to remove the element from the Analytics system
Replace from Published Replaces the shared, draft version of an element with its published version, discarding any changes that may have been made since it was last published
Duplicate Creates a duplicate copy of the element; regardless of the state of its parent element, a duplicate element always originates in the Being Edited (edit) state
NOTE
For a detailed account of how elements are processed using the Analytics Studio, refer to "Understanding the Draft-Ready-Published Lifecycle" in Chapter 3, "Using the Analytics Studio".

Using the Workspace
View related elements
All Analytics Studio elements are interdependent on each other. For example, to be functional, an alert filter requires alert details, which in turn, uses event properties.
From the displayed list of elements in the Overview page, select the Related Elements icon ( ) for an element to display its related elements in the Related Elements panel.
Figure 2-8 displays related elements for a dashboard group, Role 2.
Figure 2-8 Viewing related elements
2-15

Chapter 2: Exploring the Analytics Studio GUI
Editor
The Editor (see Figure 2-9) is the element specifications page that appears on selecting an element.
TIP!
The Analytics Studio provides multiple ways to select an element—using the navigation pane, Overview page, and the Related Elements and Recent Elements panels.
Figure 2-9 Editor view
Use the Editor to modify element specifications. Additionally, you can set the status of elements using the buttons aligned at the bottom of the Editor. Refer to "Change the state of multiple elements simultaneously" for a brief description of these buttons.
2-16
Using the Quick Panel
Using the Quick Panel
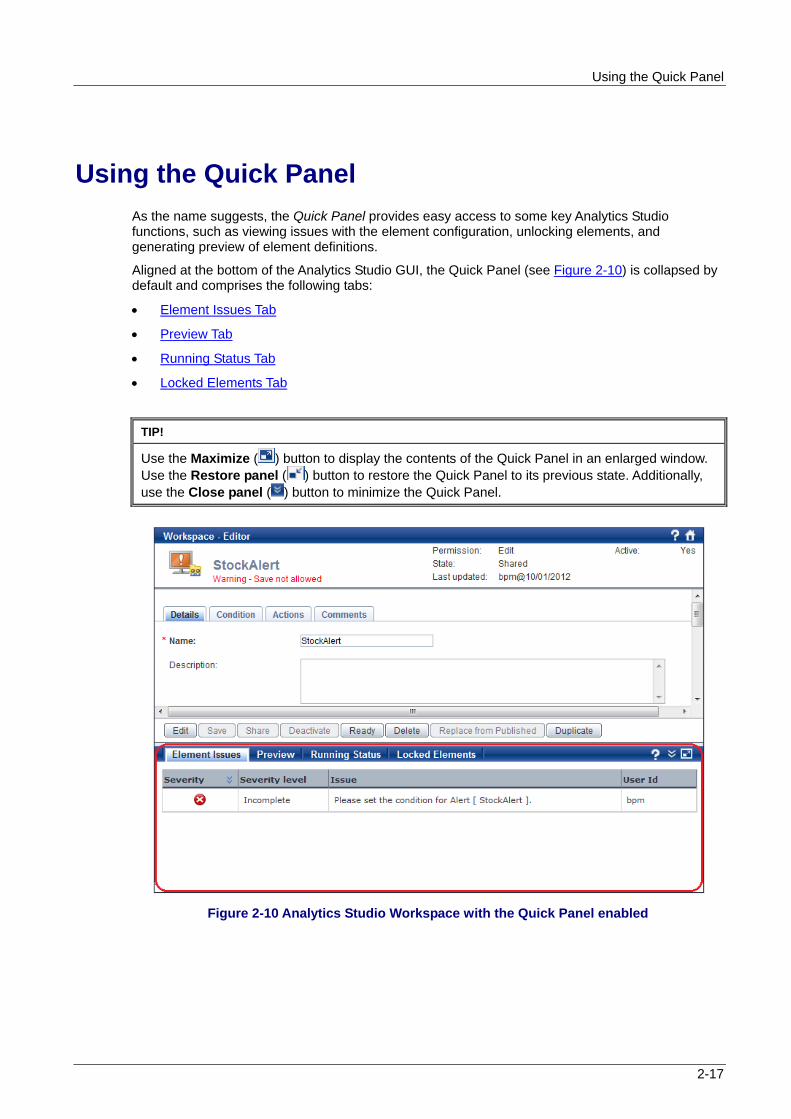
As the name suggests, the Quick Panel provides easy access to some key Analytics Studio functions, such as viewing issues with the element configuration, unlocking elements, and generating preview of element definitions.
Aligned at the bottom of the Analytics Studio GUI, the Quick Panel (see Figure 2-10) is collapsed by default and comprises the following tabs:
Element Issues Tab
Preview Tab
Running Status Tab
Locked Elements Tab
TIP!
Use the Maximize ( ) button to display the contents of the Quick Panel in an enlarged window. Use the Restore panel ( ) button to restore the Quick Panel to its previous state. Additionally, use the Close panel ( ) button to minimize the Quick Panel.
Figure 2-10 Analytics Studio Workspace with the Quick Panel enabled
2-17

Chapter 2: Exploring the Analytics Studio GUI
Element Issues Tab
Before you submit an element for publishing, it is recommended you review its specification for correctness to ensure it can be readily published. For this, select the element you want to review, and then, select the Element Issues tab on the Quick Panel. Doing this lists all the issues with the element, if any.
TIP!
The Analytics Studio provides multiple ways to select an element—using the navigation pane, Overview page, and the Related Elements and Recent Elements panels.
Figure 2-11 displays the Element Issues tab for a sample alert.
Figure 2-11 Element issues for an alert
Each issue listed in the Element Issues tab is qualified by several attributes, such as Severity, Severity Level, and Issue, described in Table 2-4. To resolve an issue, refer to the given description, update the element specification, and click Save.
Table 2-4 Element Issues fields
Field Description Possible Values
Severity Contains an icon indicative of the type of issue with the element
– Error icon indicative of an error with the element that might disrupt the normal behavior of the element; elements with this error icon cannot progress to the Ready state
– Warning icon indicative of an issue with the element
2-18

Using the Quick Panel
2-19
Field Description Possible Values
Severity level Describes the severity level of the error
Mandatory — Indicates that certain key parameters in the element's definition that are critical for the normal behavior of the element are empty
Combination — Indicates that a certain combination of parameters in the element's definition is incorrect
Missing — Indicates that some parameters in the element's definition are empty
Incomplete — Indicates that certain related elements' parameters are incorrect
Issue Provides a brief description of the element issue
-
User Id Displays the user ID of the user currently logged into the Analytics Studio
-
Preview Tab
As the name suggests, the Preview tab of the Quick Panel (see Figure 2-12) enables you to generate a preview of the element, ensuring the element has been correctly configured and its implementation is correct.
To generate a preview for an element, select the element to display its specification. Then, select the Preview tab on the Quick Panel.
IMPORTANT!
Previews are available for charts and layouts only.

Chapter 2: Exploring the Analytics Studio GUI
Figure 2-12 Preview Tab
Running Status Tab
You can view the runtime status of published elements added to the Analytics system using the Running Status tab of the Quick Panel. Simply, select the element to display its specification, and then, select the Running Status tab.
Figure 2-13 displays the runtime status for a sample alert.
IMPORTANT!
The Analytics Studio displays the runtime status only for events and alerts.
Figure 2-13 Running status of a sample alert
The running status includes details, such as the total count of events or alerts triggered, rate of occurrence of alerts, occurrence date for the first event or alert triggered, and occurrence date for the most recent event or alert triggered.
2-20

Using the Quick Panel
Locked Elements Tab
The Analytics Studio uses the concept of "locking" and "unlocking" to maintain data integrity and restrict multiple users from editing the same element simultaneously.
When you edit an element, the Analytics Studio locks the element, providing you exclusive rights to edit it without displaying the revisions being made to other users. While you edit the element, other Analytics Studio users view the previous "Shared" version of the element's specification. The revised specification becomes visible only when you share the element. This exclusive lock can be revoked using the Locked Elements tab (see Figure 2-14), but only certain Analytics Studio users are authorized to do so.
IMPORTANT!
The Quick Panel displays the Locked Elements tab only for specific users with appropriate rights and permissions. Moreover, removing the lock causes any changes made to the element's specification to be lost.
To unlock an element:
1. Select the Locked Elements tab on the Quick Panel.
2. The Locked Elements tab, as the name suggests, lists all elements that are currently locked for editing. Browse through the given list and select the elements you want to unlock.
Figure 2-14 Locked Elements tab
2-21

Chapter 2: Exploring the Analytics Studio GUI
TIP!
In case the Locked Elements tab provides an exhaustive list, use the Filter to sort specific elements you want to unlock. You can filter elements for specific Analytics Studio users, or even, enter a time period to derive specific elements locked within that duration.
The Filter is displayed by default. To hide the filter, select Close panel. Invoke the filter by selecting Open panel.
3. Click Remove Lock to unlock the selected elements.
2-22
Using the Analytics Studio GUI Icons
Using the Analytics Studio GUI Icons
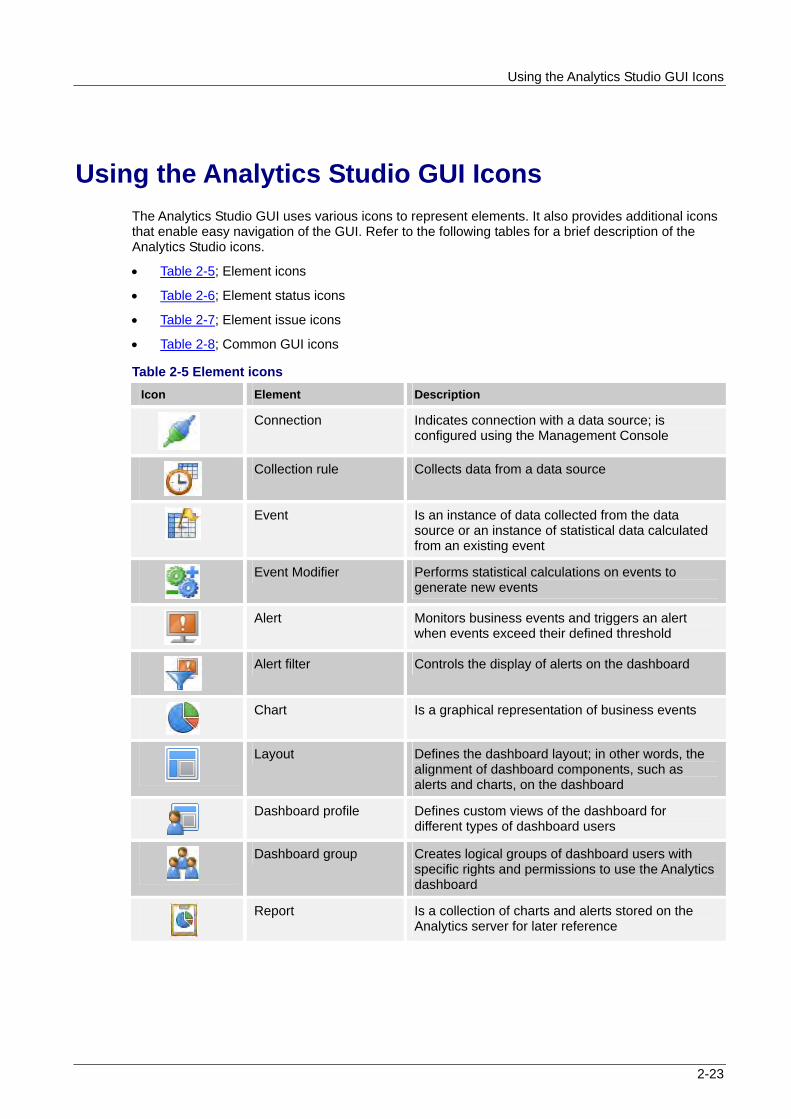
The Analytics Studio GUI uses various icons to represent elements. It also provides additional icons that enable easy navigation of the GUI. Refer to the following tables for a brief description of the Analytics Studio icons.
Table 2-5; Element icons
Table 2-6; Element status icons
Table 2-7; Element issue icons
Table 2-8; Common GUI icons
Table 2-5 Element icons
Icon Element Description
Connection Indicates connection with a data source; is configured using the Management Console
Collection rule Collects data from a data source
Event Is an instance of data collected from the data source or an instance of statistical data calculated from an existing event
Event Modifier Performs statistical calculations on events to generate new events
Alert Monitors business events and triggers an alert when events exceed their defined threshold
Alert filter Controls the display of alerts on the dashboard
Chart Is a graphical representation of business events
Layout Defines the dashboard layout; in other words, the alignment of dashboard components, such as alerts and charts, on the dashboard
Dashboard profile Defines custom views of the dashboard for different types of dashboard users
Dashboard group Creates logical groups of dashboard users with specific rights and permissions to use the Analytics dashboard
Report Is a collection of charts and alerts stored on the Analytics server for later reference
2-23

Chapter 2: Exploring the Analytics Studio GUI
Table 2-6 Element status icons
Icon Element Description
Being edited Indicates that an element is currently being edited by a user; additionally, the name of the element will be bold if the current user logged into the system holds the lock for the element
Shared Indicates an element is in the Shared state
Ready Indicates an element is in the Ready state
Rejected Indicates an element that has been rejected from being published
Published Indicates a published element
Published (being edited)
Indicates that a published element is currently being edited
Published (shared) Indicates that a published element is in the Shared state
Published (ready) Indicates that a published element is in the Ready
state
Published (rejected) Indicates that a published element has been rejected from being published again with updated specifications
Deleted (published) Indicates that a published element that has been marked for deletion
Table 2-7 Element issue icons
Icon Element Issue Description
Error Indicates there is an error with the element's configuration, which must be resolved for proper functioning of the element
Warning Indicates that there is a fault with the element's configuration, which does not directly impact the functioning of the element
Table 2-8 Common GUI icons
Icon Description
Displays the Analytics Studio Help
Opens a panel
Closes a panel
Opens the Analytics Studio home page
Maximizes a panel
Restores a panel
2-24

Chapter 3 Using the Analytics Studio
This chapter explains how to create elements, such as events, alerts, and charts, using the Fujitsu Interstage Business Process Manager Analytics (BPMA) Studio.
Key concepts covered in this chapter include:
Understanding the Draft-Ready-Published Lifecycle
Creating Elements
Editing Elements
Duplicating Elements
Deleting Elements
Deactivating and Activating Elements
Sharing Elements
Readying Elements
Publishing Elements
3-1

Chapter 3: Using the Analytics Studio
Understanding the Draft-Ready-Published Lifecycle
All Analytics Studio elements undergo the Draft:Ready:Published lifecycle before they can be implemented in an Analytics system. Represented by the "Draft", "Ready", and "Published" tabs of the navigation pane, each of these states requires specific user action to process elements and transfer them to the next stage.
Figure 3-1 illustrates this concept by using a typical Analytics Studio scenario requiring a Draft element to be published. Refer to Table 3-1 for a description of the diagram.
Figure 3-1 Typical element processing scenario
3-2

Understanding the Draft-Ready-Published Lifecycle
Table 3-1 Typical element processing scenario
Step Description
1 - New element needs to be added to Analytics
- Is currently in the "Being edited" state
- Is listed under the Draft tab represented by the icon
- Edit the element's definition
- Click Save at the bottom of the Workspace-Editor to apply the changes
2 - Share the element to display the revised specifications to all Analytics Studio users
- Click Share at the bottom of the Workspace-Editor
- Element is listed under the Draft tab represented by the icon
2a - Shared elements can also be edited, if required
Click Edit to begin editing the element; doing this sets an exclusive lock on the element, restricting any other user, except for the current user, to edit the element
Click Cancel Edit to remove the lock, losing any changes made to the element specification
- Click Share to share the element's specification with other users, and click Save to save the specification
3/3a - "Ready" the element for being published
- Click Ready at the bottom of the Workspace-Editor
Element is listed under the Draft and Ready tabs represented by the
icon
Element specifications are reviewed in the Ready tab
- If the specifications are correct, click Publish All Elements to publish the element for use in the Analytics system
- If the specifications are inappropriate, click Reject Selected Element(s) to send the element back to the Draft state for further editing of its specification
Rejected element is listed in the Draft tab represented by the icon
- Click Cancel Ready to revoke the Ready state and return to the Shared state
4 - Published elements are listed in the Draft and Published tabs
represented by the icon
3-3

Chapter 3: Using the Analytics Studio
3-4
Creating Elements
This section explains how to create Analytics Studio elements. Refer to the following procedures for details.
Creating Connections
Creating Collection Rules
Creating Event Groups
Creating Events
Creating Event Modifiers
Creating Alerts
Creating Alert Filters
Creating Charts
Creating Layouts
Creating Dashboard Profiles
Creating Dashboard Groups
Creating Reports
Creating Connections
A connection defines how to connect to a data source. For example, an RDB connection uses the JDBC URL and login credentials (username/password) to connect to an RDB database.
You can configure connections using the Management Console. For details, refer to the Interstage Business Process Manager Analytics V12.0 Management Console Guide.
Creating Collection Rules
As the name suggests, a Collection Rule defines the criteria or rule for collecting data from a data source. In other words, it defines how, what, where, and when the data is collected. The collected data is stored as events in the Events database, which are later referenced by other Studio elements, such as alerts and charts, for display on the dashboard.
Analytics supports three types of collection rules—RDB, Text, and BPM. However, you can only create RDB and Text collection rules.
Refer to the following sections for details about creating collection rules.
Creating RDB Collection Rules
Creating Text Collection Rules

Creating Elements
Creating RDB Collection Rules
As the name suggests, RDB Collection Rules collect data from relational databases.
To create an RDB collection rule:
1. From the menu bar, click Action > New > Collection Rule to display the Create Collection Rule Wizard.
TIP!
An alternate method of displaying the Create Collection Rule Wizard is to select the Collection Rule icon from the Studio Home. Additionally, you can right-click Collection Rules from the navigation pane, and select Create New to display the Create Collection Rule Wizard.
2. Begin defining the collection rule's specification.
Name — Type a name for the collection rule
Type — Select RDB to specify the collection rule type
NOTE
Ensure you provide a meaningful, unique name to the rule indicative of the type of data source it communicates with. For example, DB_MonthlySales indicates that it is an RDB collection rule. You can use any character, number, and even, embed spaces in a name, but it must not exceed 64 characters.
3. Click Next to continue defining an RDB collection rule.
4. From the Connection Used list, select the connection that will be used to connect to the target data source.
5. Click Next to define the target data source attributes to be captured by the collection rule.
6. From the Collection type area, select either Table or Stored procedure to indicate the type of relational database object from where the collection rule will retrieve data.
NOTE
For demonstration purpose, this procedure uses tables as the target relational database object.
3-5
Chapter 3: Using the Analytics Studio
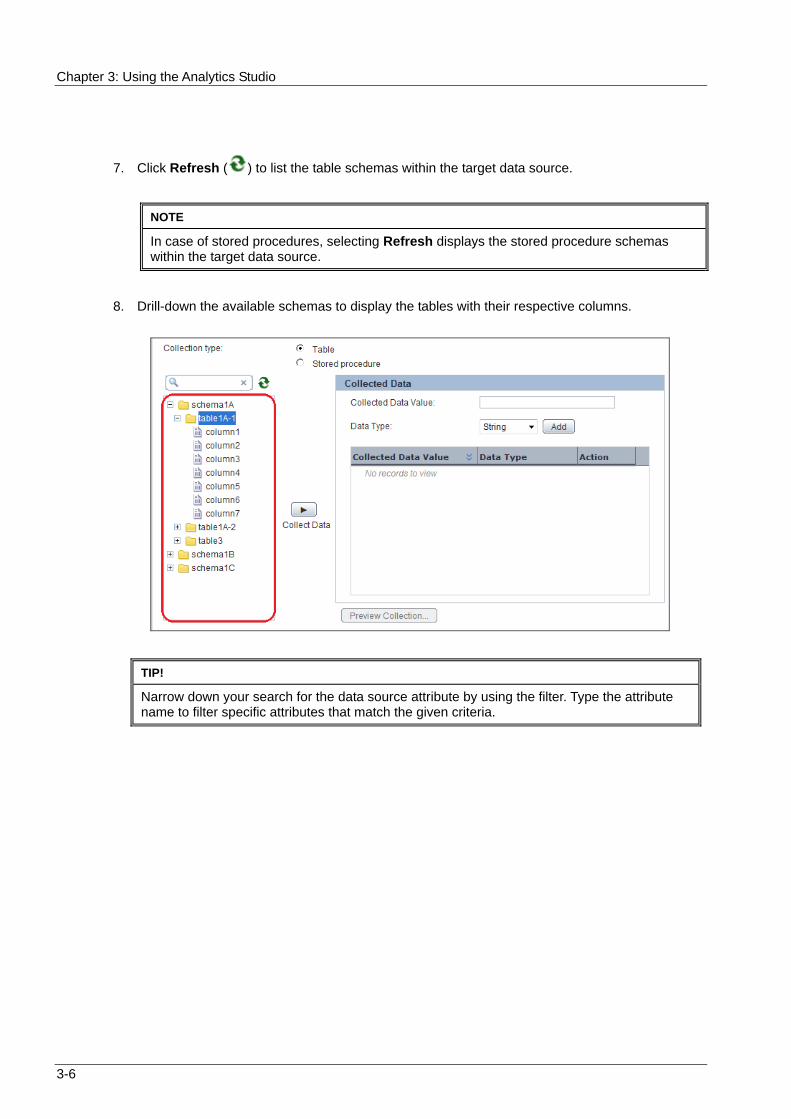
7. Click Refresh ( ) to list the table schemas within the target data source.
NOTE
In case of stored procedures, selecting Refresh displays the stored procedure schemas within the target data source.
8. Drill-down the available schemas to display the tables with their respective columns.
TIP!
Narrow down your search for the data source attribute by using the filter. Type the attribute name to filter specific attributes that match the given criteria.
3-6

Creating Elements
9. Select the columns to be referenced by the collection rule, and click Collect Data to add the selected columns to the Collected Data area.
NOTE
Click Remove ( ) to cancel a selection from the Collected Data area. For a quick glance of the data source attributes selected for data collection, select Preview Collection.
3-7

Chapter 3: Using the Analytics Studio
TIP!
In addition to collecting data from predefined columns of a table, you can perform statistical calculations on these columns to derive custom attributes for data collection. For this, type the SQL expression signifying your collection criteria in the Collected Data Value box, select the data type for the resultant value from the Data Type list, and click Add.
10. Click Next to define events for the collection rule.
11. The Select Event to Map area contains options to select events that will store the data captured by the collection rule.
From the Event Group list, select the event group, which contains the event that will store the collected data.
IMPORTANT!
You can only select General Events for storing the collected data. Analytics does not permit using predefined events for storing data collected by the RDB or Text collection rules.
12. From the Event list, select the event to display its attributes.
13. Select event attributes to store the collected data. Ensure you select appropriate attributes compatible with the target data source attributes you selected in Step 9.
3-8

Creating Elements
Each event attribute comprises the following details:
Attribute — Name of the event attribute
Data Type — Data type of the event attribute, such as String, Integer, or Boolean
Unique key — Indicates whether an event attribute acts as a unique key for the event; is only applicable to General Events
NOTE
A unique key is an event attribute that controls data insertion, rejection, and update in an event. An event can have multiple unique keys where each key is identified by an index number, such as 1, 2, and so on, indicative of the priority of a key during a data update.
Mapping Type — Enables you to map event attributes with the collected data
None — Indicates that the event attribute will not be used for storing the collected data
Constant — Enables you to specify any custom value to be stored as a constant in the event attribute; selecting this option displays the Value box where you can type a custom value
Collected data — Enables you to assign a data source attribute to the target event attribute; selecting this option displays the Value box that allows you to select the appropriate target data source attribute
3-9

Chapter 3: Using the Analytics Studio
TIP!
To automate event:attribute mapping, use Set Default Mapping that maps event attributes with their respective target data source attributes, provided both entities have the same name and data type.
Additionally, use New Event to define a new event with attributes that have the same name and data type as the target data source attributes. These new event attributes are automatically mapped with their respective target data source attributes.
The following screen displays a new event, P_Details, with the P_ID, P_Name, P_Cost, and P_Expiry event attributes automatically mapped with their respective target data source attributes of the same name and data type.
14. Click Next to define the collection schedule.
15. The Schedule area provides various options that allow you to define a schedule for executing the collection rule.
Interval — Enables you to specify a collection interval
3-10

Creating Elements
First execution — Select the Open Calendar icon to select a date and time for executing the rule
Then every — Specify the time frame to set the iteration for the rule
Daily — Executes the rule every day at a specific time
Execution time (HH:mm:ss) — Select appropriate values to specify time in the 24-hour format
Weekly — Executes the rule at a specific time every week; select days of the week and specify time in the 24-hour format
Monthly — Executes the rule at a specific day and time every month
Day of month — Select a value from 1 to 31 to specify the day for executing the rule
Execution time (HH:mm:ss) — Select appropriate values to specify the time in the 24-hour format
Yearly — Executes the rule at a specific time every year
Execution date — Select a date and month to execute the rule
Execution time (HH:mm:ss) — Select appropriate values to specify the time in the 24-hour format
16. Click Finish to create the RDB collection rule. The new rule appears in the navigation pane under Collection Rules.
Creating Text Collection Rules
Text Collection Rules collect data from files.
To create a text collection rule:
1. From the menu bar, click Action > New > Collection Rule to display the Create Collection Rule Wizard.
TIP!
An alternate method of displaying the Create Collection Rule Wizard is to select the Collection Rule icon from the Studio Home. Additionally, you can right-click Collection Rules from the navigation pane, and then, select Create New to display the Create Collection Rule Wizard.
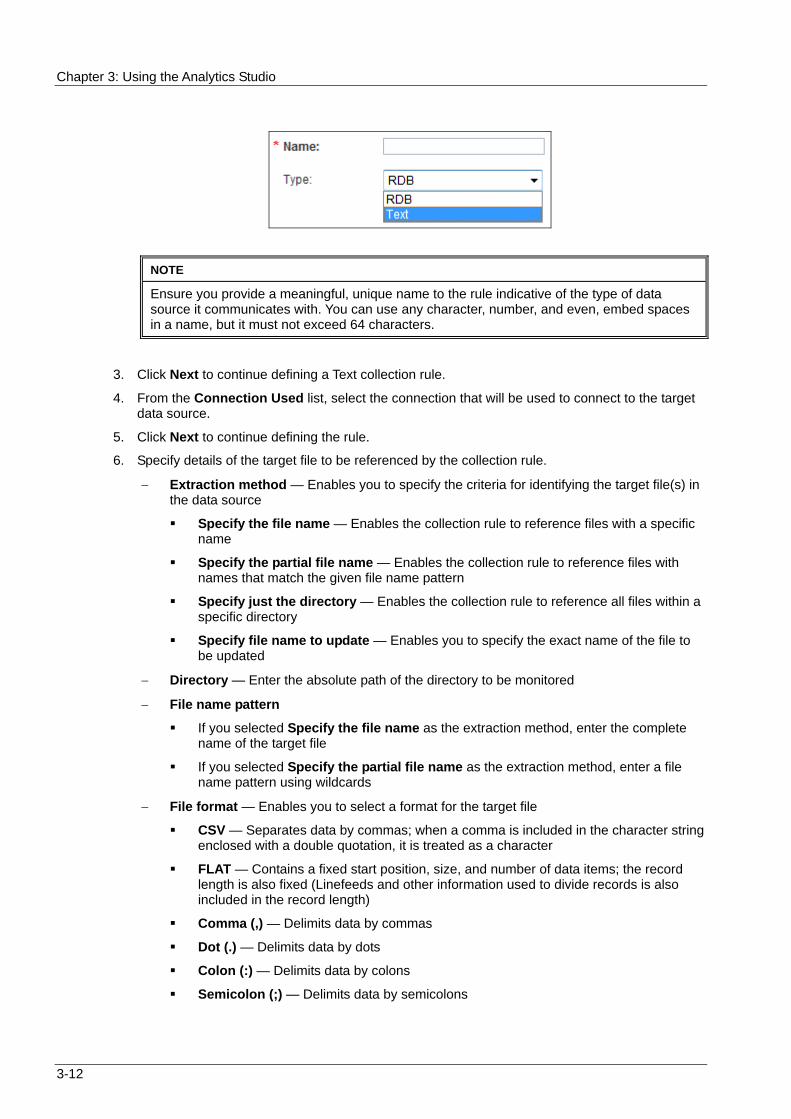
2. Begin defining the collection rule's specification.
Name — Type a name for the collection rule
Type — Select Text to specify the collection rule type
3-11
Chapter 3: Using the Analytics Studio
NOTE
Ensure you provide a meaningful, unique name to the rule indicative of the type of data source it communicates with. You can use any character, number, and even, embed spaces in a name, but it must not exceed 64 characters.
3. Click Next to continue defining a Text collection rule.
4. From the Connection Used list, select the connection that will be used to connect to the target data source.
5. Click Next to continue defining the rule.
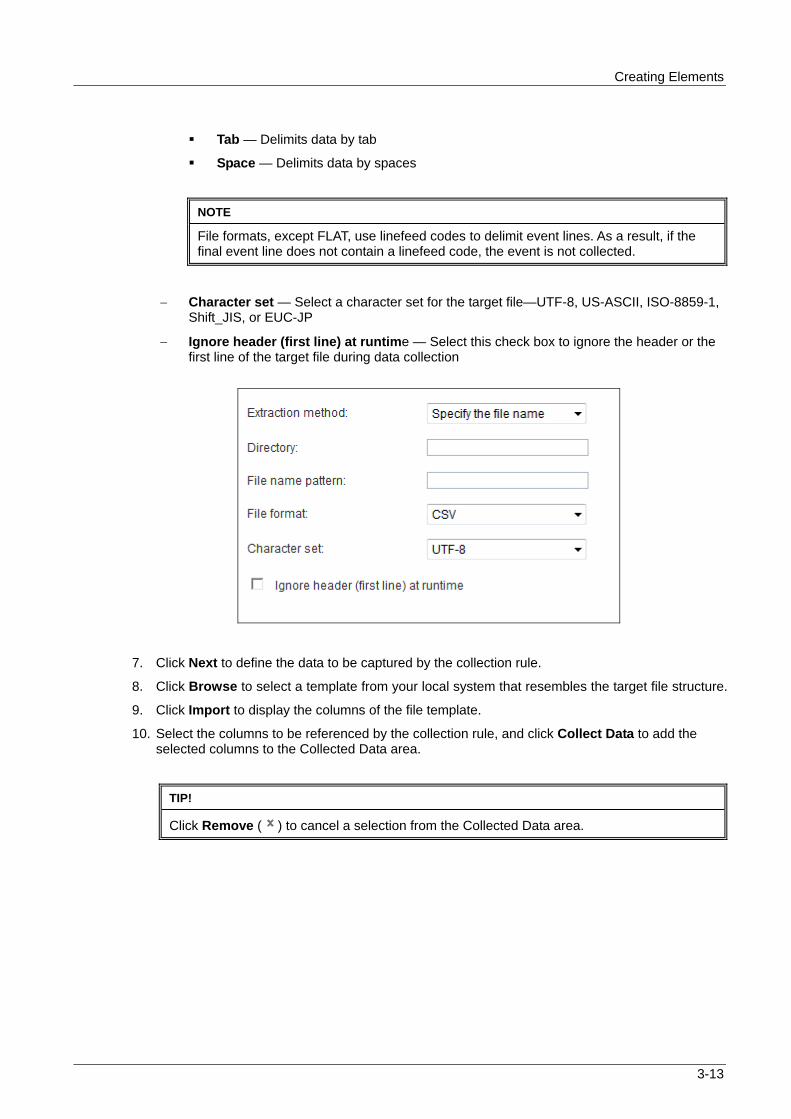
6. Specify details of the target file to be referenced by the collection rule.
Extraction method — Enables you to specify the criteria for identifying the target file(s) in the data source
Specify the file name — Enables the collection rule to reference files with a specific name
Specify the partial file name — Enables the collection rule to reference files with names that match the given file name pattern
Specify just the directory — Enables the collection rule to reference all files within a specific directory
Specify file name to update — Enables you to specify the exact name of the file to be updated
Directory — Enter the absolute path of the directory to be monitored
File name pattern
If you selected Specify the file name as the extraction method, enter the complete name of the target file
If you selected Specify the partial file name as the extraction method, enter a file name pattern using wildcards
File format — Enables you to select a format for the target file
CSV — Separates data by commas; when a comma is included in the character string enclosed with a double quotation, it is treated as a character
FLAT — Contains a fixed start position, size, and number of data items; the record length is also fixed (Linefeeds and other information used to divide records is also included in the record length)
Comma (,) — Delimits data by commas
Dot (.) — Delimits data by dots
Colon (:) — Delimits data by colons
Semicolon (;) — Delimits data by semicolons
3-12
Creating Elements
Tab — Delimits data by tab
Space — Delimits data by spaces
NOTE
File formats, except FLAT, use linefeed codes to delimit event lines. As a result, if the final event line does not contain a linefeed code, the event is not collected.
Character set — Select a character set for the target file—UTF-8, US-ASCII, ISO-8859-1, Shift_JIS, or EUC-JP
Ignore header (first line) at runtime — Select this check box to ignore the header or the first line of the target file during data collection
7. Click Next to define the data to be captured by the collection rule.
8. Click Browse to select a template from your local system that resembles the target file structure.
9. Click Import to display the columns of the file template.
10. Select the columns to be referenced by the collection rule, and click Collect Data to add the selected columns to the Collected Data area.
TIP!
Click Remove ( ) to cancel a selection from the Collected Data area.
3-13

Chapter 3: Using the Analytics Studio
TIP!
If you do not want to use a template to import columns, add columns manually using the Collected Data area.
1. Type the column name in the Column box.
2. In the Position box, type a numeric value indicative of the column position in the target file.
3. From the Data type list, select the appropriate data type for the column.
4. Click Add to save the column's specification.
3-14

Creating Elements
11. Click Next to define events for the collection rule.
12. The Select Event to Map area contains options to select events that will store the data captured by the collection rule.
From the Event Group list, select the event group, which contains the event that will store the collected data.
IMPORTANT!
You can only select General Events for storing the collected data. Analytics does not permit using predefined events for storing data collected by the RDB or Text collection rules.
13. From the Event list, select the event to display its attributes.
14. Select event attributes to store the collected data. Ensure you select appropriate attributes compatible with the target data source attributes you selected in Step 10.
Each event attribute comprises the following details:
Attribute — Specifies the name of the event attribute
Data Type — Specifies the data type of the event attribute, such as String, Integer, or Boolean
Unique key — Indicates whether an event attribute acts as a unique key for the event; is only applicable to General Events
3-15

Chapter 3: Using the Analytics Studio
3-16
NOTE
A unique key is an event attribute that controls data insertion, rejection, and update in an event. An event can have multiple unique keys where each key is identified by an index number, such as 1, 2, and so on, indicative of the priority of a key during a data update.
Mapping Type — Enables you to map event attributes with the collected data
None — Indicates that the event attribute will not be used for storing the collected data
Constant — Enables you to specify any custom value to be stored as a constant in the event attribute; selecting this option displays the Value box where you can type a custom value
Collected data — Enables you to assign a target data source attribute to the event attribute; selecting this option displays the Value box that enables you to select the appropriate target data source attribute
Joint collected data — Is only applicable to data source attributes of the String data type; enables you to embed special characters, such as hyphens or semicolons, to separate the collected data when stored in an event
Selecting Joint collected data displays the Open Editor icon, which in turn, displays the Joint Value Editor dialog box that provides the following options:
Separator character — Select a special character, such as hyphen (-), Space, or Colon (:) to separate the collected data
Collected data — Select the target file attributes to be separated by special characters
Add — Use this button to add the target file attributes to be separated by the selected separator character
Preview Value — Displays the target file attributes separated by the selected character indicating how the collected data will appear when stored in an event
TIP!
To automate event:attribute mapping, use Set Default Mapping that maps event attributes with their respective target data source attributes, provided both entities have the same name and data type.

Creating Elements
Additionally, use New Event to define a new event with attributes that have the same name and data type as the target data source attributes. These new event attributes are automatically mapped with their respective target data source attributes.
The following screen displays a new event, P_Details, with the P_ID, P_Name, P_Cost, and P_Expiry event attributes automatically mapped with their respective target data source attributes of the same name and data type.
15. Click Next to define the collection schedule.
16. The Schedule area provides various options that allow you to define a schedule for executing the collection rule.
Interval — Enables you to specify a collection interval
3-17

Chapter 3: Using the Analytics Studio
First execution — Select the Open Calendar icon to select a date and time for executing the rule
Then every — Specify the time frame to set the iteration for the rule
Daily — Executes the rule every day at a specific time
Execution time (HH:mm:ss) — Select appropriate values to specify time in the 24-hour format
Weekly — Executes the rule at a specific time every week; select days of the week and specify time in the 24-hour format
Monthly — Executes the rule at a specific day and time every month
Day of month — Select a value from 1 to 31 to specify the day for executing the rule
Execution time (HH:mm:ss) — Select appropriate values to specify the time in the 24-hour format
Yearly — Executes the rule at a specific time every year
Execution date — Select a date and month to execute the rule
Execution time (HH:mm:ss) — Select appropriate values to specify the time in the 24-hour format
17. Click Finish to create the Text collection rule. The new rule appears in the navigation pane under Collection Rules.
Creating Event Groups
The Analytics Studio uses the concept of Event Groups to logically combine events in distinct groups. Therefore, before your begin creating events for your workflow, ensure their respective event groups have already been defined in the Studio.
To create an event group:
1. From the menu bar, click Action > New > Event Group to display the Create Event Group Wizard.
TIP!
An alternate method of displaying the Create Event Group Wizard is to right-click Events from the navigation pane, and then, select Create New Event Group.
2. In the Name box, enter a meaningful, unique name for the event group.
3-18

Creating Elements
3. Click Finish to create the event group. The new event group appears in the navigation pane under Events.
NOTE
The Analytics Studio contains a predefined event group, System, which comprises events that are defined when Analytics is initially configured.
Creating Events
Events signify the business data captured from a data source deployed in a business environment. Events are the key to any Analytics operation, such as the statistical analysis of business processes or reporting of business anomalies using alerts.
NOTE
Before you create an event, ensure that its respective event group has already been defined in the Analytics Studio.
To create an event:
1. From the menu bar, click Action > New > Event to display the Create Event Wizard.
TIP!
Analytics Studio provides alternate methods for displaying the Create Event Wizard.
- Select the Event icon from the Studio Home.
- Right-click Events from the navigation pane, and select Create New Event.
- Right-click the event group in which you want to create an event, and select Create New Event.
- Use the New Event button from the collection rule and event modifiers wizards.
2. Begin defining the event's specification.
Name — Type a name for the event; ensure you provide a meaningful, unique name to the event
Event Group — Select an event group for the event
NOTE
An event group is a logical grouping of events.
Event Type — Select an event type to denote the type of data stored in the event
General — Indicates the event stores data collected by sensors
Statistical — Indicates the event stores statistical data generated by event modifiers
3-19

Chapter 3: Using the Analytics Studio
Alert Summary (business) — Indicates that the event stores statistical data related to alerts generated by the Alert Summary (business) event modifier
3. Click Next to continue defining the event.
4. Define the event attributes.
Name — Type a name for the event attribute
NOTE
By default, the system automatically generates event attributes names in a consecutive order, such as ATT1, ATT2, and so on. You can, however, provide meaningful names to the event attributes indicative of the data they store.
Type — Select a data type for the attribute
String — Indicates that the attribute stores alphanumeric values
Integer — Indicates that the attribute stores Integer values
Real — Indicates that the attribute stores Real data type values
DateTime — Indicates that the attribute stores date and time values
Date — Indicates that the attribute only stores date values
Time — Indicates that the attribute only stores time values
Boolean — Indicates that the attribute stores Boolean values of TRUE and FALSE
5. Click Add to apply the event attribute to the event. You can add multiple attributes to an event.
All event attributes are qualified by the following parameters:
Name — Name of the event attribute
Data Type — Data type of the event attribute
Size or Scale — Maximum data that can be stored by the event attribute, is only applicable to event attributes of the String and Real data type
Action — Enables you to delete an attribute by selecting the Remove ( ) icon
3-20

Creating Elements
NOTE
An alternate method of adding event attributes to an event is extracting event attributes from collection rules.
1. Click Extract Attributes from Collection Rule to display the Extract Attributes from Collection Rule dialog box.
2. From the Collection Rule type list, select the type, such as RDB or Text, for the collection rule.
3. From the Collection Rule name list, select the collection rule whose event attributes you want to import. Doing this displays the event attributes used by the collection rule.
4. Click Extract to add the collection rule attributes to the event.
6. Skip to Step 10 if you are creating a Statistical or Alert Summary (business) event, else, click Next to configure unique key settings for your General Event.
7. From the Collection Management area, configure the following settings to define additional criteria for defining the type of data to be stored in the event.
3-21

Chapter 3: Using the Analytics Studio
Management type
Master data — Includes data used for updating, such as inventories and summaries
Transaction data — Includes data that is added, such as sales and transaction records
None — No criteria is applied for filtering the target source data
Monitor type
Add difference records — Only the newly added data is collected
Easy mirroring — Mirrors the business data except deleted data
All history — Both the newly added and the updated data are collected (the latter is collected as new data)
None — No monitor type is applied to the event
8. Select Upsert to update the event—insert a new record if the record does not exist or update already existing records.
9. From the Unique key list, select the event attributes that will act as unique keys for the event and click Add.
NOTE
A unique key is an event attribute that controls data insertion, rejection, and update in an event. An event can have multiple unique keys where each key is identified by an index number, such as 1, 2, and so on, indicative of the priority of a key during a data update.
TIP!
Use the Move Up and Move Down buttons to adjust the priority of unique keys during an
update. Additionally, click the Remove ( ) icon to cancel a selection.
3-22

Creating Elements
10. Click Finish to create the event. The new event appears in the navigation pane under its event group.
Creating Event Modifiers
An Event Modifier performs statistical calculations, such as totals, average, and other arithmetic operations, on existing events and generates new statistical events.
Analytics supports two types of event modifiers—Statistical and Alert Summary (business).
Refer to the following procedures for details about creating event modifiers.
Creating Statistical Event Modifiers
Creating Alert Summary (business) Event Modifiers
Creating Statistical Event Modifiers
As the name suggests, Statistical Event Modifiers perform statistical calculations on events to generate new events.
To create a statistical event modifier:
1. From the menu bar, click Action > New > Event Modifier to display the Create Event Modifier Wizard.
TIP!
An alternate method of displaying the Create Event Modifier Wizard is to select the Event Modifier icon from the Studio Home. Additionally, you can right-click Event Modifiers from the navigation pane, and then, select Create New to display the Create Event Modifier Wizard.
2. Begin defining the event modifier's specification.
Name — Type a meaningful name for the event modifier
Type — Select Statistical to create a statistical event modifier.
3. Click Next to continue defining the event modifier.
4. Specify details of the source or input event to be manipulated by the event modifier.
Input Event Group — Select the event group to which the event belongs
Input Event — Select the event to be manipulated by the event modifier
5. Click Next to continue defining the event modifier.
6. Specify details of the output statistical event that will store the results of the calculation performed by the event modifier.
Output Event Group — Select the event group to which the statistical event belongs
Output Event — Select the output statistical event
Doing this displays the attributes for that event.
3-23
Chapter 3: Using the Analytics Studio
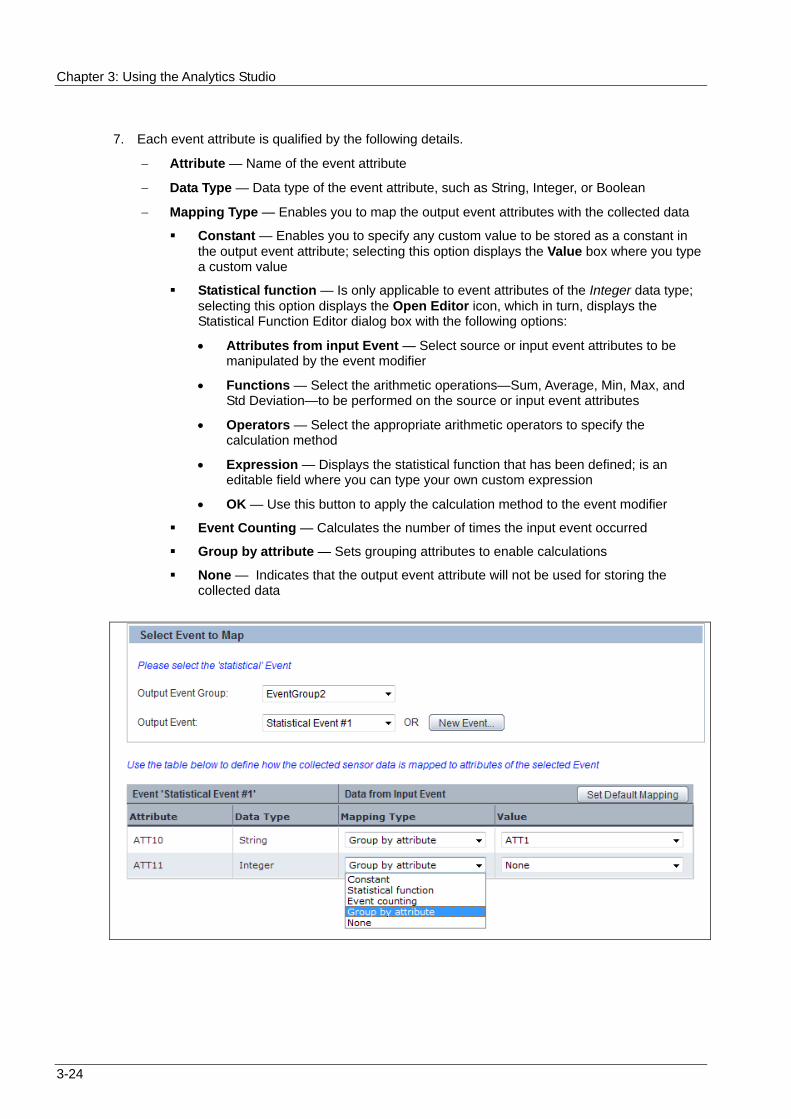
7. Each event attribute is qualified by the following details.
Attribute — Name of the event attribute
Data Type — Data type of the event attribute, such as String, Integer, or Boolean
Mapping Type — Enables you to map the output event attributes with the collected data
Constant — Enables you to specify any custom value to be stored as a constant in the output event attribute; selecting this option displays the Value box where you type a custom value
Statistical function — Is only applicable to event attributes of the Integer data type; selecting this option displays the Open Editor icon, which in turn, displays the Statistical Function Editor dialog box with the following options:
Attributes from input Event — Select source or input event attributes to be manipulated by the event modifier
Functions — Select the arithmetic operations—Sum, Average, Min, Max, and Std Deviation—to be performed on the source or input event attributes
Operators — Select the appropriate arithmetic operators to specify the calculation method
Expression — Displays the statistical function that has been defined; is an editable field where you can type your own custom expression
OK — Use this button to apply the calculation method to the event modifier
Event Counting — Calculates the number of times the input event occurred
Group by attribute — Sets grouping attributes to enable calculations
None — Indicates that the output event attribute will not be used for storing the collected data
3-24

Creating Elements
NOTE
To automate event:attribute mapping, use Set Default Mapping that maps output event attributes with their respective input event attributes, provided both entities have the same name and data type. The following screen depicts the default mapping of four attributes of an output event, General Event #1, with their respective input event attributes.
Use New Event to define a new event with attributes that have the same name and data type as the target data source attributes. These new event attributes are automatically mapped with their respective target data source attributes.
The following screen displays a new general event, P_Details, with the P_ID, P_Name, P_Cost, and P_Expiry event attributes automatically mapped with their respective target data source attributes of the same name and data type.
8. Click Next to continue defining the event modifier.
3-25

Chapter 3: Using the Analytics Studio
9. Select any of the following options to define the calculation period for the event modifier.
Auto calculation — Automatically executes the calculation according to the time when the event is generated
Schedule — Provides options to define a schedule for the event modifier's calculation
Interval — Enables you to specify a collection interval
First execution — Select the Open Calendar icon to select a date and time for the calculation
Then every — Specify the time frame to set the iteration for the calculation
Daily — Enables calculation every day at a specific time
Execution time (HH:mm:ss) — Select appropriate values to specify time in the 24-hour format
Weekly — Enables calculation at a specific time every week; select days of the week and specify time in the 24-hour format
Monthly — Enables calculation at a specific day and time every month
Day of month — Select a value from 1 to 31 to specify the day for the calculation
Execution time (HH:mm:ss) — Select appropriate values to specify the time in the 24-hour format
Yearly — Enables calculation at a specific time every year
Execution date — Select a date and month for the calculation
Execution time (HH:mm:ss) — Select appropriate values to specify the time in the 24-hour format
10. Click Finish to create the event modifier. The new event modifier appears in the navigation pane under Event Modifiers.
Creating Alert Summary (business) Event Modifiers
An Alert Summary (business) Event Modifier counts the total number of alerts associated with an event. The event modifier then stores its results in the Alert Summary (business) event, which is displayed on the Analytics Dashboard.
To create an Alert Summary event modifier:
1. From the menu bar, click Action > New > Event Modifier to display the Create Event Modifier Wizard.
3-26

Creating Elements
TIP!
An alternate method of displaying the Create Event Modifier Wizard is to select the Event Modifier icon from the Studio Home. Additionally, you can right-click Event Modifiers from the navigation pane, and then, select Create New to display the Create Event Modifier Wizard.
2. Begin defining the event modifier's specification.
Name — Type a meaningful name for the event modifier
Type — Select Alert Summary (business) to create an Alert Summary (business) event modifier
3. Click Next to continue defining the event modifier.
4. From the Alert list, select the alert to be monitored by the event modifier. Doing this displays the event related to the selected alert.
5. Click Next to continue defining the event modifier.
6. Specify details of the output Alert Summary (business) event that will store the results of the calculation performed by the event modifier.
Output Event Group — Select the event group to which the Alert Summary (business) event belongs
Output Event — Select the output Alert Summary (business) event
Doing this displays the attributes for that event.
7. Each event attribute is qualified by the following details.
Attribute — Name of the event attribute
Data Type — Data type of the event attribute, such as String, Integer, or Boolean
Mapping Type — Enables you to map the output event attributes with the collected data
Group by attribute — Sets grouping attributes to enable calculations
3-27

Chapter 3: Using the Analytics Studio
NOTE
To automate event:attribute mapping, use Set Default Mapping that maps output event attributes with their respective input event attributes, provided both entities have the same name and data type.
The following screen depicts the default mapping for a sample general event.
Use New Event to define a new event with attributes that have the same name and data type as the target data source attributes. These new event attributes are automatically mapped with their respective target data source attributes.
The following screen displays a new general event, P_Details, with the P_ID, P_Name, P_Cost, and P_Expiry event attributes automatically mapped with their respective target data source attributes of the same name and data type.
3-28

Creating Elements
8. Click Next to continue defining the event modifier.
9. Select any of the following options to define the calculation period for the event modifier.
Auto calculation — Automatically executes the calculation according to the time when the event is generated
Schedule — Provides options to define a schedule for the event modifier's calculation
Interval — Enables you to specify a collection interval
First execution — Select the Open Calendar icon to select a date and time for the calculation
Then every — Specify the time frame to set the iteration for the calculation
Daily — Enables calculation every day at a specific time
Execution time (HH:mm:ss) — Select appropriate values to specify time in the 24-hour format
Weekly — Enables calculation at a specific time every week; select days of the week and specify time in the 24-hour format
Monthly — Enables calculation at a specific day and time every month
Day of month — Select a value from 1 to 31 to specify the day for the calculation
Execution time (HH:mm:ss) — Select appropriate values to specify the time in the 24-hour format
Yearly — Enables calculation at a specific time every year
Execution date — Select a date and month for the calculation
Execution time (HH:mm:ss) — Select appropriate values to specify the time in the 24-hour format
3-29

Chapter 3: Using the Analytics Studio
10. Click Finish to create the event modifier. The new event modifier appears in the navigation pane under Event Modifiers.
Creating Alerts
Alerts are used to highlight exceptions or critical situations in a business process workflow. They are triggered when business events exceed their defined threshold. For example, an alert can trigger when the monthly sales are less than $5,000,000 or when a business process is still incomplete as the next process onsets.
To create an alert:
1. From the menu bar, click Action > New > Alert to display the Create Alert Wizard.
TIP!
An alternate method of displaying the Create Alert Wizard is to select the Alert icon from the Studio Home. Additionally, you can right-click Alerts from the navigation pane, and then, select Create New to display the Create Alert Wizard.
2. In the Name box, type a meaningful name for the alert.
3. From the Rule type list, select any of the following values to specify the alert rule.
Check parameters (general Event) — Indicates that the alert checks parameters of a general event
Check parameters (workflow Event) — Indicates that the alert checks parameters of a workflow event
Time limit — Indicates that the alert checks the due date of a workflow event
Waiting time — Implies that the alert checks the lead time of a workflow event
Occurrence of a specific Event — Indicates that the alert checks the activities of a workflow event, such as the starting process or ending activity
Check relation of pair Events — Implies that the alert checks the relationship between events; for example, the lead time of a business activity is more than 5 hours by checking sequence between a start and an end event
Check parameters between pair Events (general Event) — Parameters of two general events are checked
Check parameters between pair Events (workflow Event) — Parameters of two Workflow events are checked
3-30

Creating Elements
Check performance of workflow — Checks the performance of workflow events; for example, number of events per hour
4. From the Event Group list, select the event group that contains the event to be monitored by the alert.
5. From the Event list, select the event to be monitored by the alert.
IMPORTANT!
Selecting the Check relation of pair Events rule type and Check parameters between pair Events (general Event) requires you to specify the Base Event and Other Event details. A Base Event is the leading event to check a pair of events, whereas, the Other Event is the following event to check a pair of events. For each of these event types, you need to specify an event group and the respective event to be monitored by the alert.
Additionally, selecting the Check performance of workflow rule type requires you to specify relevant details for a performance analysis, such as the workflow entity to be analyzed and duration of the analysis. Refer to "Appendix A, Additional Configuration Parameters" for a description of these fields.
3-31

Chapter 3: Using the Analytics Studio
6. Click Next to continue defining the alert.
7. Define the alert message and its severity.
English — Select a value, which will comprise the alert message, from the drop-down list,
and click to add the value to the box
Japanese — Select a value, which will comprise the alert message, from the drop-down
list, and click to add the value to the box
TIP!
Type your alert message, and use the predefined parameters from the English and Japanese lists to define the alert message.
Type — Select the alert type—Unknown, Information, Warning, or Critical; the default alert type is Critical
Level (0–100) — Select an appropriate value to rate the severity of the alert from 0 through 100; the default alert level is 100
3-32

Creating Elements
8. Click Finish to create the alert. The new alert appears in the navigation menu under Alerts.
Creating Alert Filters
Alert Filters enable you to control the display of alerts on the Analytics Dashboard.
To create an alert filter:
1. From the menu bar, click Action > New > Alert Filter to display the Create Alert Filter Wizard.
TIP!
An alternate method of displaying the Create Alert Filter Wizard is to select the Alert Filter icon from the Studio Home. Additionally, you can right-click Alert Filters from the navigation pane, and then, select Create New to display the Create Alert Filter Wizard.
2. In the Name box, type a meaningful name for the alert filter.
3. Add alerts to the alert filter.
In the Alert(s) area, select an alert from the Available box and click Add Selected ( ). Doing this positions the alert in the Selected box.
3-33
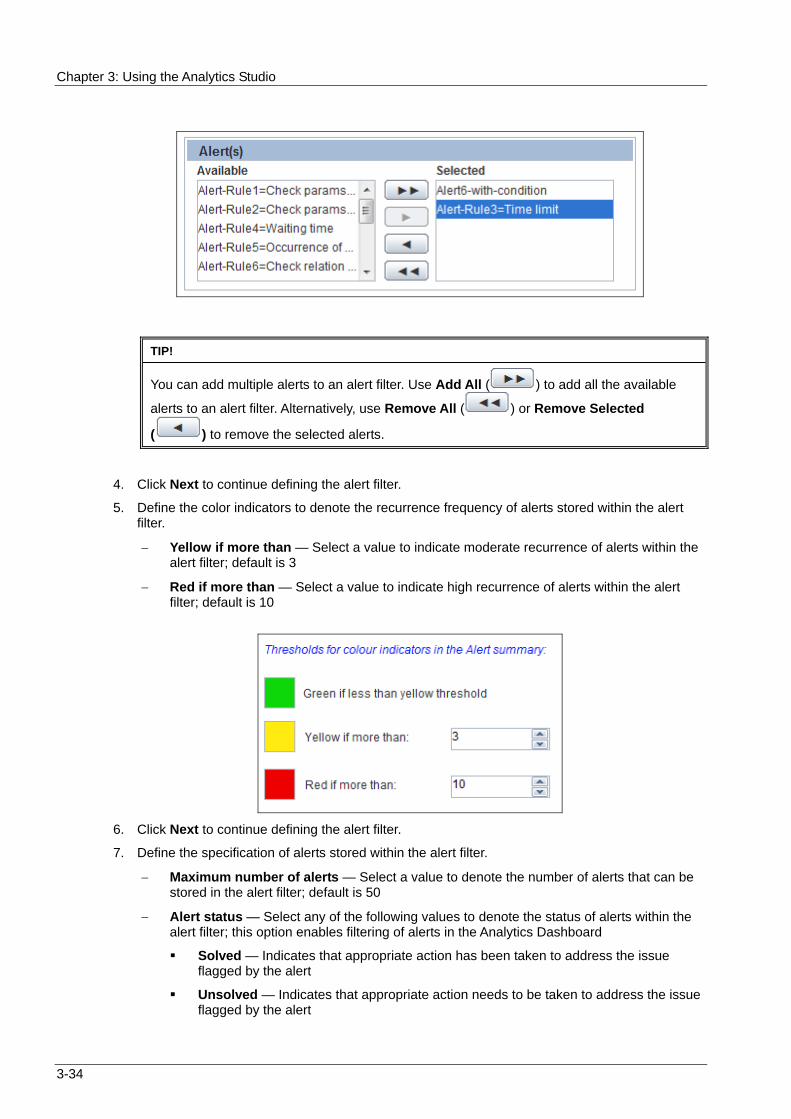
Chapter 3: Using the Analytics Studio
TIP!
You can add multiple alerts to an alert filter. Use Add All ( ) to add all the available
alerts to an alert filter. Alternatively, use Remove All ( ) or Remove Selected
( ) to remove the selected alerts.
4. Click Next to continue defining the alert filter.
5. Define the color indicators to denote the recurrence frequency of alerts stored within the alert filter.
Yellow if more than — Select a value to indicate moderate recurrence of alerts within the alert filter; default is 3
Red if more than — Select a value to indicate high recurrence of alerts within the alert filter; default is 10
6. Click Next to continue defining the alert filter.
7. Define the specification of alerts stored within the alert filter.
Maximum number of alerts — Select a value to denote the number of alerts that can be stored in the alert filter; default is 50
Alert status — Select any of the following values to denote the status of alerts within the alert filter; this option enables filtering of alerts in the Analytics Dashboard
Solved — Indicates that appropriate action has been taken to address the issue flagged by the alert
Unsolved — Indicates that appropriate action needs to be taken to address the issue flagged by the alert
3-34

Creating Elements
All — Indicates alert filters with both Solved and Unsolved status
Alert type — Drag the slider to indicate the range of alerts—Unknown, Information, Warning, or Critical—to be stored within the alert filter
Alert level — Drag the slider to define the range of severity level for alerts within the alert filter
8. Click Finish to create the alert filter. The new alert appears in the navigation pane under Alert Filters.
Creating Charts
Charts enable graphical representation of business events in different formats, such as Pie Charts, Bar Graphs, or Histogram.
To create a chart:
1. From the menu bar, click Action > New > Chart to display the Create Chart wizard.
TIP!
Analytics Studio provides alternate methods for displaying the Create Event Wizard.
- Select the Chart icon from the Studio Home.
- Right-click Charts from the navigation pane, and select Create New.
- Right-click an existing chart from the navigation pane, and select Create New Drilling Chart. Doing this populates the parent chart's information in the new drill-down chart.
2. Begin defining the chart's specification.
Name — Type a name for the chart; ensure you provide a meaningful name indicative of the data the chart represents
Drilling Chart — Enables you to create a nested chart within the parent chart
Yes, with parent
Allows you to select the parent chart
Select this option to display a drop-down list containing charts currently implemented in the Analytics system; choose an appropriate chart from the given list
3-35

Chapter 3: Using the Analytics Studio
No — Is the default option; select this option if you do want to create a drill-down chart
Chart type — Allows you to select a chart type
Default Types
Provides typical charts for selection
Select an appropriate chart ideal for the data you want to represent on the Analytics Dashboard; for example, tabular data or information in chronological order may be best represented through an Event Table, whereas for volumetric data, such as monthly sales, a Pie Chart is more appropriate
Custom Types
Provides additional user-defined chart types
Select an appropriate custom chart type if any of the default charts do not meet your requirement
3. Click Next to continue defining the chart.
4. From the Event type list, select either Normal Event or BPM process Event to specify whether the General Event data or Workflow Event data is to be depicted on the chart.
3-36

Creating Elements
5. If you selected Normal Event as the event type, the Selected Event area displays the following options:
Event Group — Select the event group that contains the event whose data is to be represented on the chart
Event — Select the event to be represented on the chart
If you selected BPM process Event as the event type, refer to "Appendix A, Additional Configuration Parameters" for its configuration options.
6. Click Finish to create the chart. The new chart appears in the navigation pane under Charts.
Creating Layouts
The Layout element defines the positioning of presentation elements, such as charts and alerts, on the Analytics Dashboard.
To create a layout:
1. From the menu bar, click Action > New > Layout to display the Create Layout Wizard.
TIP!
An alternate method of displaying the Create Layout Rule Wizard is to select the Layout icon from the Studio Home. Additionally, you can right-click Layouts from the navigation pane, and then, select Create New to display the Create Layout Wizard.
2. Define the layout's specification.
Name — Type a meaningful name for the layout
Type — Select any of the following values to specify the type of layout
Overview Layout — Is used for dashboard groups
Profile Layout — Is used for dashboard profiles
3. Click Finish to create the layout. The new layout appears in the navigation pane under Layouts.
Creating Dashboard Profiles
Analytics displays custom views of the dashboard, also referred to as Dashboard Profiles, which display specific BPM metrics to specific users, depending on their rights and permissions.
3-37

Chapter 3: Using the Analytics Studio
To create a dashboard profile:
1. From the menu bar, click Action > New > Dashboard Profile to display the Create Dashboard Profile Wizard.
TIP!
An alternate method of displaying the Create Dashboard Profile Wizard is to select the Dashboard Profile icon from the Studio Home. Additionally, you can right-click Dashboard Profiles from the navigation pane, and then, select Create New to display the Create Dashboard Profile Wizard.
2. In the Name box, type a meaningful name for the dashboard profile.
3. Click Next to continue defining the dashboard profile.
4. Apply layouts to the dashboard profile.
In the Layout(s) area, select a layout from the Available box and click Add Selected ( ). Doing this positions the layout in the Selected box.
TIP!
You can add multiple layouts to a dashboard profile. Use Add All ( ) to add all the
available layouts to a dashboard profile. Alternatively, use Remove All ( ) or Remove
Selected ( ) to remove the selected layouts.
IMPORTANT!
You can only apply Profile layouts to dashboard profiles.
5. Click Next to continue defining the dashboard profile.
6. Add alert filters for the dashboard profile.
In the Alert Filter(s) area, select an alert filter from the Available box and click Add Selected
( ). Doing this positions the alert filter in the Selected box.
3-38
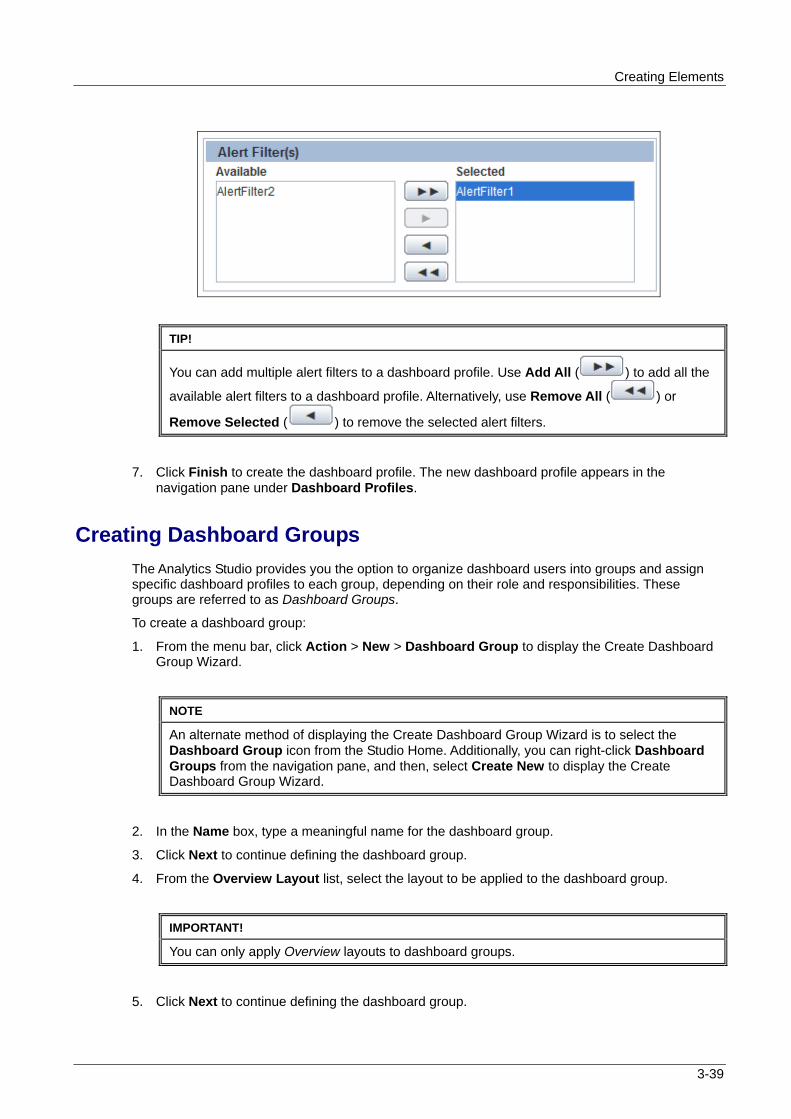
Creating Elements
TIP!
You can add multiple alert filters to a dashboard profile. Use Add All ( ) to add all the
available alert filters to a dashboard profile. Alternatively, use Remove All ( ) or
Remove Selected ( ) to remove the selected alert filters.
7. Click Finish to create the dashboard profile. The new dashboard profile appears in the navigation pane under Dashboard Profiles.
Creating Dashboard Groups
The Analytics Studio provides you the option to organize dashboard users into groups and assign specific dashboard profiles to each group, depending on their role and responsibilities. These groups are referred to as Dashboard Groups.
To create a dashboard group:
1. From the menu bar, click Action > New > Dashboard Group to display the Create Dashboard Group Wizard.
NOTE
An alternate method of displaying the Create Dashboard Group Wizard is to select the Dashboard Group icon from the Studio Home. Additionally, you can right-click Dashboard Groups from the navigation pane, and then, select Create New to display the Create Dashboard Group Wizard.
2. In the Name box, type a meaningful name for the dashboard group.
3. Click Next to continue defining the dashboard group.
4. From the Overview Layout list, select the layout to be applied to the dashboard group.
IMPORTANT!
You can only apply Overview layouts to dashboard groups.
5. Click Next to continue defining the dashboard group.
3-39

Chapter 3: Using the Analytics Studio
6. Select the users to be added to the dashboard group.
In the User(s) area, select a user from the Available box and click Add Selected ( ). Doing this positions the user in the Selected box.
TIP!
You can add multiple users to a dashboard group. Use Add All ( ) to add all the
available users to a dashboard group. Alternatively, use Remove All ( ) or Remove
Selected ( ) to remove the selected users.
7. Select dashboard profiles for the dashboard group. This allows you to control the information that will be visible to users on the Analytics Dashboard.
In the Profile(s) area, select a dashboard profile from the Available box and click Add Selected
( ). Doing this positions the dashboard profile in the Selected box.
3-40

Creating Elements
TIP!
You can add multiple profiles to a dashboard group. Use Add All ( ) to add all the
available dashboard profiles to a dashboard group. Alternatively, use Remove All ( )
or Remove Selected ( ) to remove the selected profiles.
8. Click Next to continue defining the dashboard group.
9. Select Edit Chart to enable dashboard users to edit charts displayed in the Analytics Dashboard.
10. Select Update Alert status to enable users to update the alert status from the Analytics Dashboard.
11. Click Finish to create the dashboard group. The new dashboard group appears in the navigation pane under Dashboard Groups.
3-41

Chapter 3: Using the Analytics Studio
Creating Reports
You can collect dashboard metrics at regular intervals and store it for later reference as Reports. These reports contain charts, alerts, and the data displayed on the Analytics Dashboard. Reports provide a dashboard-like view in a distributable and offline format.
To create a report:
1. From the menu bar, click Action > New > Report to display the Create Report Wizard.
NOTE
An alternate method of displaying the Create Report Wizard is to select the Reports icon from the Studio Home. Additionally, you can right-click Reports from the navigation pane, and then, select Create New to display the Create Report Wizard.
2. In the Name box, type a name for the report. Ensure you provide a meaningful, unique name to the report indicative of the data and the time period it conforms to.
3. Click Next to continue defining the report.
4. Apply layouts to the report.
In the Layout(s) area, select a layout from the Available box and click Add Selected ( ). Doing this positions the layout in the Selected box.
TIP!
You can add multiple layouts to a report. Use Add All ( ) to add all the available
layouts to a report. Alternatively, use Remove All ( ) or Remove Selected ( ) to remove the selected layouts.
5. Click Next to define the schedule for the report.
Interval — Enables you to specify the periodic time interval for report generation
First execution — Select the Open Calendar icon to select a date and time for generating the report
Then every — Specify the time frame to set the iteration for report generation
Daily — Generates the report every day at a specific time
Execution time (HH:mm:ss) — Select appropriate values to specify time in the 24-hour format
Weekly — Generates the report at a specific time every week; select days of the week and specify time in the 24-hour format
Monthly — Generates the report on a specific day and time every month
Day of month — Select a value from 1 to 31 to specify the day for report generation
Execution time (HH:mm:ss) — Select appropriate values to specify the time in the 24-hour format
3-42

Creating Elements
Yearly — Generates the report at a specific time every year
Execution date — Select a date and month to generate the report
Execution time (HH:mm:ss) — Select appropriate values to specify the time in the 24-hour format
6. Click Finish to create the report. The new report appears in the navigation pane under Reports.
3-43

Chapter 3: Using the Analytics Studio
Editing Elements
When you create an element, you define its most basic specification. The element definition, at this stage, might not complete. To complete the definition and create a fully operational element, you need to edit the element and update its specification to embed the relevant functionality. Refer to the following procedures for details.
Editing Connections
Editing Collection Rules
Editing Event Groups
Editing Events
Editing Event Modifiers
Editing Alerts
Editing Alert Filters
Editing Charts
Editing Layouts
Editing Dashboard Profiles
Editing Dashboard Groups
Editing Reports
Editing Connections
Connections are configured by the Administrator using the Management Console. Only users with administrative privileges can edit connections. You may, however, view the connection's specification using the Published tab of the Analytics Studio.
Editing Collection Rules
Refer to the following procedures for details about editing collection rules.
Editing RDB collection rules
Editing Text collection rules
Editing BPM collection rules
3-44

Editing Elements
Editing RDB collection rules
To edit an RDB collection rule:
1. Select the collection rule from the Draft tab of the navigation pane to display its specification.
NOTE
Analytics Studio provides multiple ways to select an element—using the navigation pane, Overview page, and the Related Elements and Recent Elements panels.
2. The Analytics Studio Workspace - Editor displays the Details, Data Collection, Event Mapping, Timing, and Comments tabs for the collection rule. The Details tab is selected by default.
Click Edit, positioned at the bottom of the Workspace – Editor, to begin editing the collection rule.
3. Review the collection rule's specification provided in the Details tab. If required, edit the available options to revise the collection rule settings. Refer to Creating RDB Collection Rules for details.
4. Select the Data Collection tab to edit the data source attributes to be captured by the collection rule.
Besides editing the data collection settings covered in Creating RDB Collection Rules, you may configure additional options to fine-tune the behavior of the collection rule.
In the Collection Condition area, type an SQL expression to define a data collection condition on the collection rule. You can specify conditions on the RDB table name, columns in the table, or even the position of the CSV data.
In the Collection Management area, configure additional options to define the type of data to be captured by the collection rule. Refer to "Appendix A, Additional Configuration Parameters" for details.
Click Advanced to configure additional settings for filtering the records to be collected. Refer to "Appendix A, Additional Configuration Parameters" for details.
5. Select the Event Mapping tab to edit the event attributes that store the data captured by the collection rule. Refer to Creating RDB Collection Rules for details.
6. Select the Timing tab to edit the collection rule schedule. Refer to Creating RDB Collection Rules for details.
7. Select the Comments tab to view the collection rule’s history. This tab contains user-defined comments and can be edited, if required.
8. Click Save to apply the revised settings to the collection rule.
Editing Text collection rules
To edit a text collection rule:
1. Select the collection rule from the Draft tab of the navigation pane to display its specification.
NOTE
Analytics Studio provides multiple ways to select an element—using the navigation pane, Overview page, and the Related Elements and Recent Elements panels.
2. The Analytics Studio Workspace - Editor displays the Details, Data Collection, Event Mapping, Timing, and Comments tabs for the collection rule. The Details tab is selected by default.
3-45

Chapter 3: Using the Analytics Studio
3-46
Click Edit, positioned at the bottom of the Workspace – Editor, to begin editing the collection rule.
3. Review the collection rule's specification provided in the Details tab. If required, edit the available options to revise the collection rule settings. Refer to Creating Text Collection Rules for details.
4. Select the Data Collection tab to edit the data source attributes to be captured by the collection rule.
Besides editing the data collection settings covered in Creating Text Collection Rules, you may configure additional options to fine-tune the behavior of the collection rule.
5. Select the Event Mapping tab to edit the event attributes that store the data captured by the collection rule. Refer to "Creating Text Collection Rules" for details.
6. Select the Timing tab to edit the collection rule schedule. Refer to "Creating Text Collection Rules" for details.
7. Select the Comments tab to view the collection rule’s history. This tab contains user-defined comments and can be edited, if required.
8. Click Save to apply the revised settings to the collection rule.
Editing BPM collection rules
BPM collection rules are predefined in the Analytics Studio.
To edit a BPM collection rule:
1. Select the collection rule from the Draft tab of the navigation pane to display its specification.
NOTE
Analytics Studio provides multiple ways to select an element—using the navigation pane, Overview page, and the Related Elements and Recent Elements panels.
2. The Analytics Studio Workspace - Editor displays the Details, Data Collection, Event Mapping, Timing, and Comments tabs for the collection rule. The Details tab is selected by default.
Click Edit, positioned at the bottom of the Workspace – Editor, to begin editing the collection rule.
3. Review the collection rule's specification provided in the Details tab. Edit the available options, if required.
Name — Name of the collection rule; this value cannot be edited
Type — Specifies the type of collection rule—BPM; this value cannot be edited
Description — Brief description for the collection rule; this value cannot be edited
Connection Used — Specifies the connection used by the collection rule to connect to the target system; this value cannot be edited
Active maintenance flow at runtime (check box) — Is selected by default; allows collection of past events; for BPM systems, collection rules can be configured to capture current as well archived data
Past event collection settings (for maintenance flow) — Provides options to configure past events collection

Editing Elements
Collect past events — Select On or Off to enable or disable the collection of past events, respectively
Collection period — Select either Specify start and end or Specify start to specify the period for collecting past events
Start date — Select the Open Calendar icon to specify the start date for past event collection
End date — Select the Open Calendar icon to specify the end date for past event collection
4. Select the Data Collection tab to edit the data source attributes to be captured by the collection rule.
5. Review the process definitions listed in the Collected Data area.
To edit this list, click Refresh ( ) to list the process definitions of the target system.
6. Drill-down the available process definitions to display their respective applications, processes, and user-defined attributes (UDAs).
7. Select the process definitions to be referenced by the collection rule, and click Collect Data to add the selected attributes to the Collected Data area.
3-47

Chapter 3: Using the Analytics Studio
8. Select the Event Mapping tab to edit the event attributes that store the data captured by the collection rule.
9. From the process definition area, select the process definition to be mapped with the event.
10. Select specific event attributes to store the collected data.
Each event attribute comprises the following details:
Attribute — Name of the event attribute
Data Type — Data type of the event attribute, such as String, Integer, or Boolean
Mapping Type — Enables you to map event attributes with the collected data
None — Indicates that the event attribute will not be used for storing the collected data
Constant — Enables you to specify any custom value to be stored as a constant in the event attribute; selecting this option displays the Value box where you can type a custom value
Collected data — Enables you to assign a target data source attribute to the event attribute; selecting this option displays the Value box that allows you to select the appropriate target data source attribute
3-48
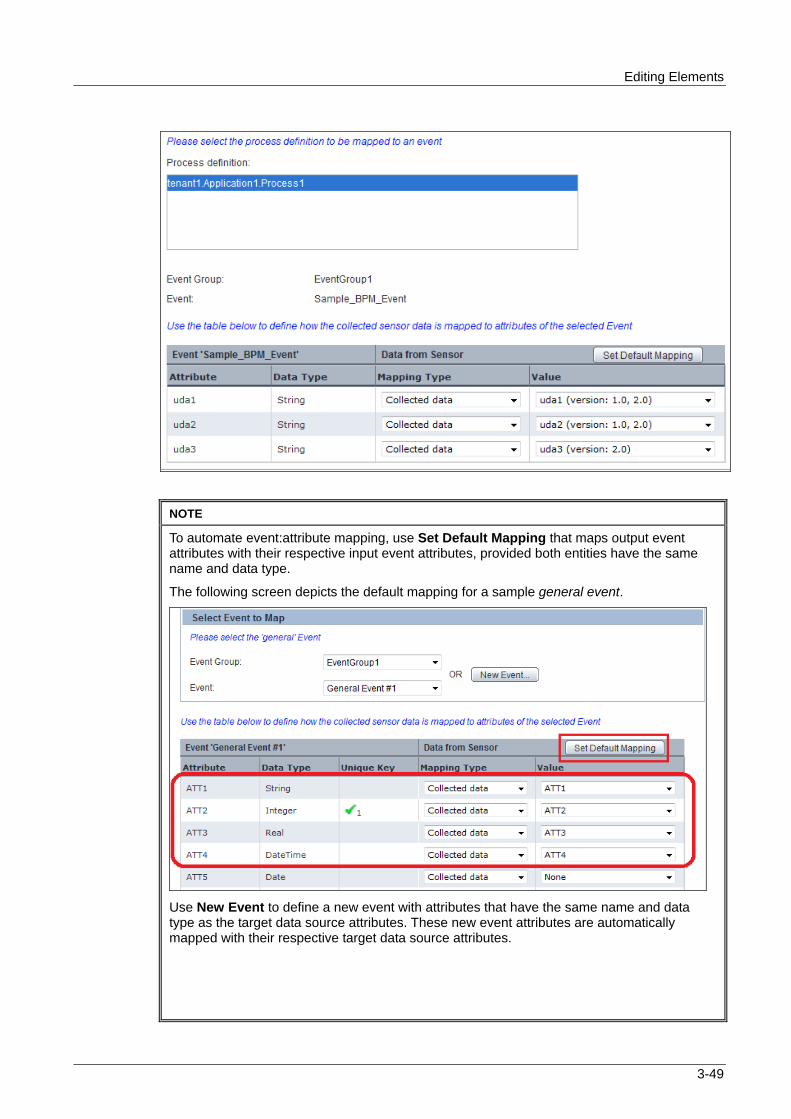
Editing Elements
NOTE
To automate event:attribute mapping, use Set Default Mapping that maps output event attributes with their respective input event attributes, provided both entities have the same name and data type.
The following screen depicts the default mapping for a sample general event.
Use New Event to define a new event with attributes that have the same name and data type as the target data source attributes. These new event attributes are automatically mapped with their respective target data source attributes.
3-49

Chapter 3: Using the Analytics Studio
The following screen displays a new general event, P_Details, with the P_ID, P_Name, P_Cost, and P_Expiry event attributes automatically mapped with their respective target data source attributes of the same name and data type.
11. Select the Timing tab to edit the collection rule schedule for both current and archived data (past events).
IBPM Flow Schedule — Enables you to define a schedule for collecting current data
Interval — Enables you to specify a collection interval
First execution — Select the Open Calendar icon to select a date and time for executing the rule
Then every — Specify the time frame to set the iteration for the rule
Daily — Executes the rule every day at a specific time
Execution time (HH:mm:ss) — Select appropriate values to specify time in the 24-hour format
Weekly — Executes the rule at a specific time every week; select days of the week and specify time in the 24-hour format
Monthly — Executes the rule at a specific day and time every month
Day of month — Select a value from 1 to 31 to specify the day for executing the rule
Execution time (HH:mm:ss) — Select appropriate values to specify the time in the 24-hour format
Yearly — Executes the rule at a specific time every year
Execution date — Select a date and month to execute the rule
Execution time (HH:mm:ss) — Select appropriate values to specify the time in the 24-hour format
IBPM Maintenance Flow Schedule — Enables you to define a schedule for collecting past events
3-50

Editing Elements
Interval — Enables you to specify a collection interval
First execution — Select the Open Calendar icon to select a date and time for executing the rule
Then every — Specify the time frame to set the iteration for the rule
Daily — Executes the rule every day at a specific time
Execution time (HH:mm:ss) — Select appropriate values to specify time in the 24-hour format
Weekly — Executes the rule at a specific time every week; select days of the week and specify time in the 24-hour format
Monthly — Executes the rule at a specific day and time every month
Day of month — Select a value from 1 to 31 to specify the day for executing the rule
Execution time (HH:mm:ss) — Select appropriate values to specify the time in the 24-hour format
Yearly — Executes the rule at a specific time every year
Execution date — Select a date and month to execute the rule
Execution time (HH:mm:ss) — Select appropriate values to specify the time in the 24-hour format
12. Select the Comments tab to view the collection rule’s history. This tab contains user-defined comments and can be edited, if required.
13. Click Save to apply the revised settings to the collection rule.
Editing Event Groups
An event group's definition only comprises a list of events it stores. An event group does not have additional specifications. Therefore, there are no specific settings for an event group that you can edit. To reorganize events within an event group, you need to modify event specifications to assign a new group to the event. You can, however, rename event groups in conformance with the type of events they store.
3-51

Chapter 3: Using the Analytics Studio
3-52
To rename an event:
1. Right-click the event group in the navigation pane, and select Rename. Doing this displays the Rename Event Group dialog box.
2. In the New name box, type a new name for the event group.
3. Click OK to save the revised settings.
Editing Events
To edit an event:
1. Select the event from the Draft tab in the navigation pane to display its specification.
NOTE
Analytics Studio provides multiple ways to select an element—using the navigation pane, Overview page, and the Related Elements and Recent Elements panels.
2. The Analytics Studio Workspace - Editor displays the Details and Comments tabs for the event. The Details tab is selected by default.
Click Edit, positioned at the bottom of the Workspace – Editor, to begin editing the event.
3. Review the event's specification provided in the Details tab. Edit the available options to revise the event settings.
Name — Name of the event attribute
Event Type — Type of event attribute—General; this value is not editable
Description — Type a brief description for the event
Event Group — Specifies the event group to which the event belongs
Attributes — Lists the event attributes details
Name — Name of the event attribute
Data Type — Data type of the event attribute, such as String, Integer, or Boolean
Size or Scale — Maximum data that can be stored by the event attribute, is only applicable to event attributes of the String and Real data type
Time — Select this check box to display the time-related data of the event attribute as the primary category in chart settings
Group — Select this check box to display the group attribute as the primary category in chart settings
KPI — Select this check box to display the data stored by the event attribute as the primary category in chart settings
Unique — Is only applicable to event attributes identified as unique keys; contains a numeric index value, such as 1, 2, and so on, indicative of the priority of a key during a data update

Editing Elements
NOTE
A unique key is an event attribute that controls data insertion, rejection, and update in an event. An event can have multiple unique keys.
Label — Select a value from the given list to assign a label to the event attribute
IMPORTANT!
Analytics uses labels to enforce data security by displaying the label for the event attribute instead of the actual data on the Analytics Dashboard. Labels are configured using the Management Console.
You can assign labels to event attributes of the String and Integer data type only.
Action — Select the Remove ( ) icon to delete the event attribute
NOTE
Use Extract Attributes from Collection Rule to import event attributes from collection rules. Refer to "Creating Events" for details.
4. Click Advanced to display additional event settings.
5. In the Alert Rule Parameters area, configure the time settings for alerts:
Expire — Lifespan of the alert; time period for which the alert remains active
Delay — Time period between two consecutive alerts
3-53

Chapter 3: Using the Analytics Studio
6. For general events, the Analytics Studio displays the Collection Management area that allows you to configure additional data storage settings for the event attribute. This is not applicable for statistical or Alert Summary (business) events.
Management type
Master data — Includes data used for updating, such as inventories and summaries
Transaction data — Includes data that is added, such as sales and transaction records
None — No criteria is applied for filtering the target source data
Monitor type
Add difference records — Only the newly added data is collected
Easy mirroring — Mirrors the business data except deleted data
All history — Both the newly added and the updated data are collected (the latter is collected as new data)
None — No monitor type is applied to the event
7. Edit the unique key configuration for the event in the Unique Key Setting area. This is only applicable to general events.
IMPORTANT!
Changing the unique key will cause all event-related data to be lost.
Upsert — Select this check box to enable data update using unique keys
3-54

Editing Elements
Unique key — Select an event attribute from the given list, and click Add to identify it as a unique key for the event; all unique keys identified for the event are collectively listed and qualified by the following parameters:
Index — Numeric value indicative of the priority of the event attributes during data update
Name — Name of the event attribute identified as the unique key
Action — Click the Remove ( ) icon to delete a unique key
TIP!
For the selected unique keys, use the Move Up and Move Down buttons to adjust their
priority while data update. Additionally, click the Remove ( ) icon to delete the selected key.
8. For statistical events, the Analytics Studio displays the Statistics Period Settings area that provides options to set the period for event calculation.
Start time — Select the Open Calendar icon to set the calculation start date and time for the event
Cycle time — Set the calculation cycle at which each event calculation unit starts
Period — Set the calculation unit specified for the event
9. Select the Comments tab to view the event’s history. This tab contains user-defined comments and can be edited, if required.
10. Click Save to apply the revised settings to the event.
Editing System Events
Analytics supports some predefined events, referred to as system events, which are configured by the Administrator in the Management Console or are created "on-the-fly" during collection rule creation.
Table 3-2 lists these system events with their description. For editing system events, refer to Editing Events.
Table 3-2 Analytics System Events
Event Name Description
Alert Count System Records the number of alert occurrences for each event group and event in the Analytics system
Dynamic BPM Event Stores BPM system information
3-55

Chapter 3: Using the Analytics Studio
3-56
Event Name Description
Process Discovery (system) Stores Process Discovery system information
NOTE
You cannot delete system events.
Editing Event Modifiers
To edit an event modifier:
1. Select the event modifier from the Draft tab in the navigation pane to display its specification.
NOTE
Analytics Studio provides multiple ways to select an element—using the navigation pane, Overview page, and the Related Elements and Recent Elements panels.
2. The Analytics Studio Work space - Editor displays the Details, Event Mapping, Timing, and Comments tab for the event modifier. The Details tab is selected by default.
Click Edit, positioned at the bottom of the Workspace – Editor, to begin editing the event modifier.
3. Review the event modifier's specification provided in the Details tab. Edit the available options, if required. Refer to "Creating Event Modifiers" for details.
Additionally, you may configure the Attribute Conditions area to apply conditions on input event attributes and filter specific data for calculation by the event modifier.
4. Select the Event Mapping tab to edit the input event attribute and output event attribute mapping for the event modifier. Refer to "Creating Event Modifiers", for the description of the available configuration options.
5. Select the Timing tab to edit the calculation period of the event modifier. Refer to "Creating Event Modifiers", for the description of the available configuration options.
6. Click Advanced to configure additional settings for the event modifier's calculation period.
7. From the Number of units box, select a numeric value to indicate the number of calculation units for the event modifier.
8. Select the Comments tab to view the event modifier’s history. This tab contains user-defined comments and can be edited, if required.
9. Click Save to apply the revised settings to the event modifier.

Editing Elements
Example of How to Set the Calculation Target Period
This section provides sample configurations to explain the calculation target period specified in the Define Calculation Rules window.
Case1: Calculations on events occurring within the calculation period
Item Value
Starting time 01-Apr-2006 09:00
Calculation unit 14 hours
Calculation cycle time
1 day
Collection time 01-May-2006 14:00
When the calculation period is configured as above, calculation will be performed on events that occur within the periods indicated by bars in the diagram below:
In this example, a calculation will be performed at 14:00 on May 1. Events between 9:00 and 14:00 on May 1 will be included in the calculation only if Calculate partial units is selected in the Calculation Rules window.
Case 2: Calculating daily sales between 9:00 and 12:00 over the previous month
Item Value
Starting time 01-04-2006 09:00
Calculation unit 14 hours
Calculation cycle time
1 day
Collection time 02-May-2006 02:00
3-57

Chapter 3: Using the Analytics Studio
When the calculation period is configured as above, calculation will be performed on events that occur within the periods indicated by bars in the diagram below:
In this example, a calculation will be performed at 2:00 on May 2, and will produce different results according to the values for the Number of Calculation Units in the Calculation Rules window:
If value is 1, only events occurring up to the final calculation period (9:00 to 23:00 on May 1) will be included in the calculation.
If value is a sufficiently large number, events occurring during all calculation periods after Start time of calculation will be included in the calculation.
Editing Alerts
To edit an alert:
1. Select the alert from the Draft tab in the navigation pane to display its specification.
NOTE
Analytics Studio provides multiple ways to select an element—using the navigation pane, Overview page, and the Related Elements and Recent Elements panels.
2. The Analytics Studio Work space - Editor provides the Details, Condition, Action, and Comments tab for the alert. The Details tab is selected by default.
Click Edit, positioned at the bottom of the Workspace – Editor, to begin editing the alert.
3. Review the alert's specification provided in the Details tab. Edit the available options, if required. Refer to "Creating Alerts" for details.
4. In the Details tab, click Advanced to configure additional settings for the alert.
5. Configure External URLs to open external web pages. You can use this option to provide additional information about the alert message.
Label — Type meaningful text that will act as the subject or label for the URL
URL — Type the URL; up to five URLs can be added
3-58

Editing Elements
6. Configure the Related Chart/Layout options:
Chart/Layout — Select a layout or chart from the given list to add it to the alert
Key for Alert Filter — Specify the key value to filter the displayed chart (layout)
7. Use the Frequency Control option to configure the frequency of the alert.
Ignore Alerts occurring during subsequent — Specify a numeric value to indicate a time period when the alert, if triggered, will be ignored
Attributes indicating same Alert — For alert suppression, select keys (event attributes) to judge whether two alerts are the same
8. Select the Condition tab to define the condition for the event data monitored by the alert.
Event Group — Select the event group that contains the event being monitored by the alert
Event — Select the event
Condition — Define the condition for event data being monitored by the alert
3-59

Chapter 3: Using the Analytics Studio
NOTE
For the Check relation of pair Events rule type and Check parameters between pair Events (general Event), the Condition tab displays the Base Event and Other Event specifications. For each of these event types, you need to specify an event group and the respective event to be monitored by the alert.
Additionally, for the Check performance of workflow rule type, the Condition tab displays BPM parameters for configuration. Refer to the "Appendix A, Additional Configuration Parameters" for details.
3-60

Editing Elements
9. Select the Actions tab to set a function, such as automatically deliver mail or start a BPM process when an alert occurs.
10. In the Name box, type a meaningful name for the action.
11. From the Type list, select either Email or BPM to specify the action that needs to be taken when the alert triggers.
Selecting Email sends an email when the alert triggers, while selecting BPM will initiate a BPM process.
12. Click Add Action to add the action to the alert.
NOTE
You can add multiple actions for an alert.
13. Configure additional settings for each action. Refer to "Appendix A, Additional Configuration Parameters" for details.
14. Select the Comments tab to view the alert’s history. This tab contains user-defined comments and can be edited, if required.
15. Click Save to apply the revised settings to the alert.
Editing Alert Filters
To edit an alert filter:
1. Select the alert filter from the Draft tab in the navigation pane to display its specification.
NOTE
Analytics Studio provides multiple ways to select an element—using the navigation pane, Overview page, and the Related Elements and Recent Elements panels.
2. The Analytics Studio Work space - Editor displays the Details, Event Mapping, Timing, and Comments tab for the alert filter. The Details tab is selected by default.
Click Edit, positioned at the bottom of the Workspace – Editor, to begin editing the alert filter.
3. Review the alert filter's specifications provided in the Details tab. Edit the available options, if required. Refer to "Creating Alert Filters" for details.
Additionally, from the Alert occurrence time list, select any of the following values to sort alerts within the alert filter.
3-61

Chapter 3: Using the Analytics Studio
All — Displays all alerts stored within the alert filter
Today — Displays alerts that triggered on the current day
This week — Displays alerts that triggered in the current week
This month — Displays alerts that triggered in the current month
Specify period — Displays alerts that triggered in a specific time period; specify appropriate For the past value.
4. Select the Comments tab to view the alert filter’s history. This tab contains user-defined comments and can be edited, if required.
5. Click Save to apply the revised settings to the alert filter.
Editing Charts
To edit a chart:
1. Select the chart from the Draft tab in the navigation pane to display its specification.
NOTE
Analytics Studio provides multiple ways to select an element—using the navigation pane, Overview page, and the Related Elements and Recent Elements panels.
2. The Analytics Studio Workspace - Editor provides the Details, Data Range, Chart Settings, Sub-Graph Settings, Options, and Comments tab, containing several options to configure the chart settings. The Details tab is selected by default.
Click Edit, positioned at the bottom of the Workspace – Editor, to begin editing the chart.
3. Review the chart's specifications provided in the Details tab. Edit the available options, if required.
Name — Name of the chart specified during its creation
Drill Chart — Is enabled only for drilling charts; displays the name of the parent chart
Description — Type a brief description for the chart
Chart type — Indicates the chart format, such as Bar chart, Pie chart, or Event table, applicable to the chart
Selected Event —
Event type — Specifies the type of event—normal Event or BPM process Event—applicable to the
Event Group — Specifies the event group that contains the event to be represented on the chart
Event — Specifies the event to be represented on the chart
3-62

Editing Elements
NOTE
Changing the event not only impacts the data displayed on the chart, but also, affects the properties of its nested chart.
Chart Axis — Allows you to define the chart's axis
Category — Specifies the event attribute selected as the chart's category
Series — Specifies the event attribute selected as the chart's series
Data — Specifies the event attribute whose data is to be displayed on the chart
Label Format — Allows you to specify a unit to the event attributes selected as the chart axis properties—Category, Series, and Data
None — Indicates that the label does not require a unit
Percent — Specifies the percentile symbol (%) as the unit for the label
Custom — Allows you to specify a custom unit to the label
IMPORTANT!
Label formats are not applicable to event attributes of the String and Boolean data types.
4. Click Advanced to display additional chart settings.
Operation type (for same category value) — Sum, Average, Maximum, Minimum
Operation for data attribute — Allows you to define a mathematical operation to be performed on the data before it is displayed in the chart; the default operator is multiply (*), while the default operand is 1.0.
5. Select the Data Range tab to configure additional chart settings.
6. From the Define the Period of Each Step area, to specify the data range to be displayed on the chart.
Latest data — Allows you to display the most recent event attribute data on the chart
Past point data — Allows you to specify a date in the past to extract event attribute data specific to that date; select the Open Calendar icon to choose a date and time; default is the current system date and time
Grid range — Allows you to set a time period that includes the time of onset; specify the time period for extracting the event attribute data
Period — Enables you to specify a data range for display on the chart by setting the current date as the end date of displayed data
3-63

Chapter 3: Using the Analytics Studio
Step start— Allows you to specify the data to be displayed by setting a date as the starting point
Step start and end date— Allows you to select a start and end date for filtering specific data to be displayed on the chart
7. Select a value from the Number of step(s) to display box to denote the number of steps in the period slider in the Analytics Dashboard.
8. From the Date/time Event attribute to use for display box, select the base time for the data range. The default value is "Event time", which implies the time when the event occurred. You may change this default with a DateTime event attribute.
9. If the data type of the event attribute selected as the chart's category is not of the DateTime/Date/Time type, the Calculation for time series box is displayed.
Select a mathematical operation—Sum, Average, Maximum, or Minimum—from the Calculation for time series box to calculate the time series for display on the period slider.
10. Select the Drilling Parameters tab to specify drill-down capabilities of the chart. This tab is only available for drill-down or nested charts.
11. Configure the following options to set the drill-down parameters for the chart.
Link label for popup menu — Specify the display name of the popup menu that appears on drilling down a target on the Analytics Dashboard; element name will be displayed if an empty value is specified
Chart link — Select this option to create a link to the parent chart
Drill down — Select this option to display the chart by inheriting the parent chart parameter values; specify the data to be inherited in the "Drilling Parameters" area
12. Select the Chart Settings tab to configure the display settings for the chart.
13. Configure the following settings in the View Detail area:
Refresh interval — Enter a time interval in minutes to refresh the displayed view of the chart
Title — Provides options to set the chart title
Display — Select this check box to display a title for the chart
Text — Type the chart title
Color (hex) — Select the Open Color Palette ( ) icon to display a color palette; Choose an appropriate color for the chart title
3-64

Editing Elements
Display Size — Provides options to configure the chart size
Fixed size — Select this check box to set specific dimensions for the chart
Width — Select a numeric value to set the chart width in pixels
Height — Select a numeric value to set the chart height in pixels
NOTE
Use the Preview tab of the Quick Panel to view how the resultant chart may appear on the Analytics Dashboard. Edit the chart settings to adjust the chart style according to your requirement.
14. Configure the following settings in the Style area.
NOTE
The style settings vary for different chart types. Refer to "Appendix A, Additional Configuration Parameters" for all the style settings supported by Analytics Studio.
Display legend — Shows a legend for the chart; is selected by default; clear the check box if you do not require a legend
Display data values — Shows data values in the chart; is selected by default; clear the check box if you do not want to show data values
NOTE
For line charts, the data values are not displayed in the Analytics Dashboard whether the Display data values check box is selected or not.
3-65

Chapter 3: Using the Analytics Studio
Direction of plot — Select either Vertical or Horizontal to set the direction of plot in a chart
Horizontal axis — Provides options to define the horizontal axis of the chart
Display name of axis — Select this check box if you want to specify a name for the horizontal axis of the chart; type the name in the adjacent box that appears
Display labels on axis — Select this check box to use labels on the horizontal axis
Vertical axis — Provides options to define the vertical axis of the chart
Display name of axis — Select this check box if you want to specify a name for the vertical axis of the chart; type the name in the adjacent box that appears
Upper bound — Select the check box, and then, select an Integer value to specify the upper bound value for the horizontal axis; alternatively, you can also type a value in the Upper bound box
Lower bound — Select the check box, and select an Integer value to specify the lower bound value for the horizontal axis; alternatively, you can also type a value in the Lower bound box
15. In the Threshold area, click Add to configure the threshold line for your chart.
Display name — Type a name for the threshold line; default is Threshold
Value — Set an Integer value for the threshold line
Line type — Set a line style for the threshold line
Line width — Set the line width
Line color (hex) — Select the Open Color Palette ( ) icon to select a line color
undefined — Click the Remove ( ) icon to delete a threshold line
You can add multiple threshold lines depending on your requirement.
16. Select the Sub-graph Settings tab to define several charts as overlays.
NOTE
You can define sub-graph charts for Bar and Line charts only.
17. Select the Share vertical axis check box to share the vertical axes of the sub graph and base graph.
18. Select the Add button to add a sub-graph.
19. From the Sub-Graph area, select either Bar chart or Line chart as the chart type for the sub-graph chart.
20. From the Select KPIs area, assign event attributes to the sub-graph chart.
Category — Select the event attribute to be designated as the chart's category
Series — Select the event attribute to be designated as the chart's series
Data — Select the event attribute whose data is to be displayed on the chart
21. Using the Label Format boxes, assign a unit to the event attributes selected as the chart's axis properties —Category, Series, and Data.
None — Indicates that the label does not require a unit
3-66

Editing Elements
Percent — Specifies the percentage symbol (%) as the unit for the label
Custom — Allows you to specify a custom unit to the label
NOTE
You cannot assign a label format for event attributes of the String and Boolean data types.
22. In the Calculation by time series, select a mathematical operation—Sum, Average, Maximum, or Minimum—to calculate the time series for display on the period slider.
23. Select the Display labels on axis check box to use labels on the chart axis.
24. Select the Display data values check box to show data values in the chart.
25. From the Line type list, select either Solid or Dotted to specify the line style for the chart
26. From the Line width list, select a value to specify the line width.
27. Select the Options tab to configure additional options for the chart.
28. In the Sort settings area, configure the following options for filtering specific event data to be displayed on the chart:
Sorted — Select this check box to perform a sort
Sort key — Select an event attribute that will be used as the criteria for the sort
Sort order — Select either Ascending or Descending to identify the sort order
3-67

Chapter 3: Using the Analytics Studio
3-68
29. From the Event Condition area, specify the condition for filtering the events to be visualized.
30. In the Control Plot Volume area, configure the following options to set the number of plots for the chart category or series.
Max number of plots for category
For date value on Category
To specify the number of plots below the specified upper bound, the grain degree is adjusted
For string or number value on Category
Narrow the Category only to the item that is a high-ranking data value
Max number of plots for series
For date value on Series
Do not correct the Series
For string or number value on Series
Narrow the Series only to the item that is a high-ranking data value.
31. In the Compare by Time Series, configure the following options to set the longitudinal data divided at a constant cycle.
Compare — Select this check box to set the longitudinal data divided at a constant cycle
Comparison cycle — Specify the cycle time for dividing time series
Display scope — Specify the time for horizontal display range
32. Select the Comments tab to view the chart’s history. This tab contains user-defined comments and can be edited, if required.
33. Click Save to apply the revised settings to the chart.
Editing Layouts
To edit a layout:
1. Select the layout from the Draft tab in the navigation pane to display its specification.
NOTE
Analytics Studio provides multiple ways to select an element—using the navigation pane, Overview page, and the Related Elements and Recent Elements panels.
2. The Analytics Studio Work space - Editor displays the Details and Comments tab for the layout. The Details tab is selected by default.
Click Edit, positioned at the bottom of the Workspace – Editor, to begin editing the layout.
3. Review the layout settings in the Details tab. Edit the available options, if required.
Name — Layout name
Type — Layout type—Overview or Profile
Description — Type a brief description of the layout
Layout — Specifies the shape of the layout; the default shape is One area

Editing Elements
Layout Shape Name Description
One area Defines one area in the layout
Two areas (columns) Defines two columns in the layout
Three areas (split top) Defines three areas, split at the top, in the layout
Three areas (split bottom)
Defines three areas, split at the bottom, in the layout
Three areas (columns) Defines three columns in the layout
Selecting a layout shape displays its corresponding areas in the bottom pane. For example, selecting the "Two areas" layout shape displays the Layout Area 1 and Layout Area 2.
4. Select a layout area for adding elements to it.
5. Select the Charts tab for a list of charts defined in the Analytics system.
6. From the given list, select charts you want to display on the dashboard, and click Add to Layout Area.
7. Select the Alter Filters tab for a list of alert filters defined in the Analytics Studio.
8. From the given list, select alert filters you want to display on the dashboard and click Add to Layout Area.
3-69

Chapter 3: Using the Analytics Studio
3-70
9. Select the URL tab to add an external URL that provides additional details about metrics displayed on the Analytics Dashboard. Enter appropriate details in the following fields:
Label — Type an appropriate title for the URL indicative of the subject it caters to
URL — Type the URL
10. Select the Alert Summary tab, and click Add to Layout Area to add an alert summary to the dashboard.
NOTE
Alert Summary can only be added to Overview layouts.
11. Repeat steps 5–10 to add elements to other layout areas.
12. Select the Comments tab to view the layout’s history. This tab contains user-defined comments and can be edited, if required.
13. Click Save to apply the revised settings to the layout.
NOTE
Use the Preview tab of the Quick Panel to view how the resultant layout may appear on the Analytics Dashboard.
Editing Dashboard Profiles
To edit a dashboard profile:
1. Select the dashboard profile from the Draft tab in the navigation pane to display its specification.
NOTE
Analytics Studio provides multiple ways to select an element—using the navigation pane, Overview page, and the Related Elements and Recent Elements panels.
2. The Analytics Studio Work space - Editor displays the Details, Direct Display URLs, and Comments tab for the dashboard profile. The Details tab is selected by default.
Click Edit, positioned at the bottom of the Workspace – Editor, to begin editing the dashboard profile.
3. Review the dashboard profile's settings in the Details tab. Edit the available options, if required.
Besides the configuration options already covered "Creating Dashboard Profiles", the Details tab provides the following additional options:
Columns to Display — Select all or specific check boxes to identify columns, comprising alert details, that will be displayed on the Analytics Dashboard
Process Scope of View — Enables you to define the data source for retrieving metrics for display on the dashboard
Scope — Select either Event or Event Group to identify the data source

Editing Elements
Available — Lists the events or event groups defined in the Analytics system; select
an item from the Available box, and click Add Selected ( ) to apply it to the dashboard profile
Selected — Lists the events/events groups identified for retrieving data for display on the Analytics Dashboard
TIP!
You can add multiple layouts to a dashboard profile. Use Add All ( ) to add all the
available layouts to a dashboard profile. Alternatively, use Remove All ( ) or Remove
Selected ( ) to remove the selected layouts.
4. Select the Direct Display URLs tab to configure additional display settings for the dashboard profile.
Element — Name of elements added to the dashboard profile, such as alert filters and layouts
URL — Location of the alert filters and layouts that enables direct access to these elements when viewed using a Web browser
Hide Header (check box) — Select this check box to disable the layout headers when displayed in the Analytics Dashboard
Action — Select the Copy to Clipboard icon ( ) to copy the given URL
5. Select the Process Performance Parameters tab to define settings for the Process Performance menu displayed on the Analytics Dashboard when the dashboard is integrated with the BPMA Console. This Process Performance menu has two submenus—Monitor and Analysis.
Layout for monitor — Assign the existing KPI layout to the Monitor screen of Process Performance
Layout for analysis — Assign the existing KPI layout to the Analysis screen of Process Performance
Display range — Specify the data range to be analyzed for business performance; this setting is enabled in the Analysis mode
For the past — Specify the time period for the analysis
6. Select the Process Search Parameters tab to configure settings to enable search of BPM processes on the Analytics Dashboard.
Search Key — Specify the UDA of the business process defined in the Analytics Studio and/or select predefined conditions from the BPM Event(s)/Available Attribute(s) boxes; the selected items are displayed as search conditions on the Analytics Dashboard
3-71

Chapter 3: Using the Analytics Studio
System Parameters — Select the system parameters to be displayed as search conditions on the Analytics Dashboard
Search Result Display Format — Specify the parameters and attributes for the results display on the Search result screen
7. Select the Comments tab to view the dashboard profile’s history. This tab contains user-defined comments and can be edited, if required.
8. Click Save to apply the revised settings to the dashboard profile.
Editing Dashboard Groups
To edit a dashboard group:
1. Select the dashboard group from the Draft tab in the navigation pane to display its specification.
NOTE
Analytics Studio provides multiple ways to select an element—using the navigation pane, Overview page, and the Related Elements and Recent Elements panels.
2. The Analytics Studio Workspace - Editor provides the Details and Comments tab that contain the dashboard group settings. The Details tab is selected by default.
Click Edit, positioned at the bottom of the Workspace – Editor, to begin editing the dashboard group.
3. Review the dashboard group's settings in the Details tab. Edit the available options, if required.
Name — Name of the dashboard group
Description — Enter a brief description for the dashboard group
Overview Layout — Lists the overview layout applied to the dashboard group
Allow label substitution (check box) — Is selected by default; applies labels to event attributes, securing the data to be displayed to the dashboard group; clear the check box to disable label substitution
3-72

Editing Elements
NOTE
Analytics uses the concept of labels to enforce data security by displaying the label for the event attribute instead of the actual data on the Analytics Dashboard. Labels are configured using the Management Console.
User(s) — Lists the users added to the dashboard group; ; refer to "Creating Dashboard Groups" for details about editing users added to a dashboard group
Profile(s) — Lists the dashboard profiles added to the dashboard group; refer to "Creating Dashboard Groups" for details about editing dashboard profiles added to a dashboard group
Dashboard Menu Settings — Allows you to select specific menus for display on the Analytics Dashboard for users in this dashboard group; by default, all menus are selected; clear the check box for the menus you do not want to display in the Analytics Dashboard
Permissions — Displays the permissions assigned to the dashboard group for using the Analytics Dashboard; refer to "Creating Dashboard Groups" for details
4. Select the Comments tab to view the dashboard group’s history. This tab contains user-defined comments and can be edited, if required.
5. Click Save to apply the revised settings to the dashboard group.
Editing Reports
To edit a report:
1. Select the report from the Draft tab in the navigation pane to display its specification.
NOTE
Analytics Studio provides multiple ways to select an element—using the navigation pane, Overview page, and the Related Elements and Recent Elements panels.
3-73

Chapter 3: Using the Analytics Studio
3-74
2. The Analytics Studio Workspace - Editor provides the Details, Timing, and Comments tab that contain the report settings. The Details tab is selected by default.
Click Edit, positioned at the bottom of the Workspace – Editor, to begin editing the report.
3. Review the report's settings in the Details tab. Edit the available options, if required.
Name — Name of the report
Description — Enter a brief description for the report
Allow label substitution (check box) — Is selected by default; applies labels to event attributes, securing the data to be displayed to the dashboard group; clear the check box to disable label substitution
NOTE
Analytics uses the concept of labels to enforce data security by displaying the label for the event attribute instead of the actual data on the Analytics Dashboard. Labels are configured using the Management Console.
Layout(s) — Lists the layouts added to the report; refer to " Creating Reports" for details on editing layouts for reports
4. Select the Timing tab for the data collection schedule applied to the report. Edit the available options, if required. Refer to "Creating Reports" for details.
5. Select the Comments tab to view the report’s history. This tab contains user-defined comments and can be edited, if required.
6. Click the Save button to save the revised settings for the report.

Duplicating Elements
Duplicating Elements
Analytics Studio allows you to copy an existing element's configuration and create a new element of the same type and the same configuration.
To duplicate an element:
1. Select an element from the Draft tab of the navigation pane to display its specification.
TIP!
The Analytics Studio provides multiple ways to select an element—using the navigation pane, Overview page, and the Related Elements and Recent Elements panels.
2. Select the Duplicate button positioned at the bottom of the Workspace-Editor.
3. In the Duplicate – Confirmation dialog box, click Yes to create a copy of the selected element. Doing this displays the "Duplicate successful" message.
NOTE
When duplicating a parent chart with drill-down child charts, the Analytics Studio provides you the option to duplicate child charts as well. Select the Also duplicate child drilling Charts check box to duplicate child charts along with the parent chart. Clear the check box if you do not want to duplicate child charts.
3-75

Chapter 3: Using the Analytics Studio
3-76
4. Click OK to close the dialog box.
The new, duplicate element is titled "Copy of <<name_of_the_element>>."
You can edit the default name of the duplicate element to provide a more meaningful name. Additionally, you may edit the duplicate element's configuration according to your requirement.
TIP!
An alternate method of duplicating an element is to right-click the element and select Duplicate from the shortcut menu.

Deleting Elements
Deleting Elements
You can delete an element you no longer require for your BPM needs.
NOTE
If there is a hierarchy of elements you want to delete, you need to use the bottom-up approach. For example, you cannot delete a parent chart that has drill-down child charts. For this, you need to first delete the child charts, and then, delete the parent chart. Similarly, you cannot delete an event group directly. You need to first delete the events within that event group, and then, delete the event group.
To delete an element:
1. Select an element from the Draft tab of the navigation pane to display its specification.
NOTE
The Analytics Studio provides multiple ways to select an element—using the navigation pane, Overview page, and the Related Elements and Recent Elements panels.
2. Select the Delete button positioned at the bottom of the Workspace-Editor.
NOTE
On selection, the Delete button changes to Cancel Delete. Click Cancel Delete to revoke deletion, and return the element to the "Shared" state.
3. In the Delete – Confirmation dialog box, click Yes to delete the element.
TIP!
As a best practice, enter a brief explanation for deleting the element in the Comment box.
When the element is deleted, the "Delete successful" message is displayed.
4. Click OK to close the dialog box.
TIP!
An alternate method of deleting an element is to right-click the element and select Delete from the shortcut menu.
3-77

Chapter 3: Using the Analytics Studio
IMPORTANT!
A published element that has been deleted is represented by the icon. However, the actual deletion only happens when a user with the appropriate privileges approves the deletion. For this, the user needs to publish the "deleted" element using the Ready tab. Doing this will remove the element from the system.
NOTE
Sometimes you might need to delete related elements of an element to completely remove it from the system. For example, in case of events, you must delete all the related elements to remove an event from the system. On the other hand, in case of charts, you need not delete related elements.
The thumb rule is that if an element impacts the functionality of its related elements, you must delete the related elements as well to completely remove the element from the system.
3-78

Deactivating and Activating Elements
Deactivating and Activating Elements
Analytics Studio allows you to temporarily disable elements that you do not require for managing your BPM operations. You can, however, enable these elements later, if required.
Deactivating Elements
Activating Elements
NOTE
The following element types can be deactivated/activated:
- Collection rules
- Event modifiers
- Alerts
- Alert filters
- Report
Deactivating Elements
IMPORTANT!
To deactivate a published element, the draft version of the element must be edited, deactivated, and then, published to take effect.
To deactivate an element using the Workspace-Editor:
1. Select an element from the Draft tab of the navigation pane to display its specification.
TIP!
The Analytics Studio provides multiple ways to select an element—using the navigation pane, Overview page, and the Related Elements and Recent Elements panels.
2. Click Deactivate positioned at the bottom of the Workspace-Editor. Doing this displays the "Deactivate successful" message.
3. Click OK to close the dialog box.
A deactivated element appears disabled, grayed out, and italicized. Additionally, note that the Deactivate button, positioned at the bottom of the Workspace-Editor, changes to Activate.
TIP!
An alternate method of deactivating an element is to right-click the element, and select Deactivate from the shortcut menu.
3-79

Chapter 3: Using the Analytics Studio
3-80
Activating Elements
You can enable or activate elements that have been deactivated. Analytics Studio provides two methods for activating an element:
To activate an element using the Workspace-Editor:
1. Select an element from the Draft tab of the navigation pane to display its specification.
2. Select the Activate button positioned at the bottom of the Workspace-Editor. Doing this displays the "Activate successful" message.
3. Click OK to close the dialog box.
Note that the Activate button, positioned at the bottom of the Workspace-Editor, changes to Deactivate on activating an element.
TIP!
An alternate method of activating an element is to right-click the element, and select Activate from the shortcut menu.

Sharing Elements
Sharing Elements
When an element's definition is complete and no more changes are required, you need to "share" it before you can publish it for real-time use.
NOTE
Only elements in the Edit state represented by the icon can be shared. In case of charts, you cannot share a parent drilling chart unless you share its child charts.
To share an element using the Workspace-Editor:
1. Select an element from the Draft tab of the navigation pane to display its specification. This
element will be in the edit state, identified by the icon.
2. Click Share positioned at the bottom of the Workspace-Editor. Doing this displays the "Share successful" message.
3. Click OK to close the dialog box.
A "shared" element is identified by the icon and is positioned under the Draft tab.
TIP!
An alternate method of sharing an element is to right-click the element, and select Share from the shortcut menu.
3-81

Chapter 3: Using the Analytics Studio
Readying Elements
After you have "shared" an element, you need to "ready" the element for a review of its specification before you publish it for use in a real-time Analytics environment.
TIP!
For an element to be "ready", it must be in the "Shared" state, identified by the icon, and positioned under the Draft tab. Additionally, the element should have the appropriate specification and must not have any issues.
To "ready" an element:
1. Select the element from the Draft tab of the navigation pane to display its specification.
TIP!
The Analytics Studio provides multiple ways to select an element—using the navigation pane, Overview page, and the Related Elements and Recent Elements panels.
2. Click Ready positioned at the bottom of the Workspace-Editor. Doing this displays a message box confirming the change.
3. Click Yes to "ready" the element.
The "Ready successful" message is displayed.
4. Click OK to close the dialog box.
A "Ready" element is represented by the icon and is positioned under the Draft tab. Additionally, note that the Ready button, positioned at the bottom of the Workspace-Editor, changes to Cancel Ready.
TIP!
An alternate method of "readying" an element is to right-click the element, and select Ready from the shortcut menu.
3-82

Publishing Elements
Publishing Elements
After an element has been identified as "ready" (see "Readying Elements"), it needs to be published for use in real-time BPM operations.
To publish an element:
1. Select the Ready tab from the navigation pane.
2. Select the element you want to publish to display its specification.
NOTE
The Ready tab lists all the elements that require a review of their specification. These elements are logically grouped in "blocks" based on their dependencies on each other.
IMPORTANT!
If you cannot view the element you want to publish, check the "Unpublishable" block because the element might have some dependent elements that are not yet "Ready".
3. Review the element specification to ensure it conforms to your business requirement.
4. Skip to step 8 below if the element specification is correct. If, however, the element specification does not meet your requirement, click Reject. Doing this displays a message box confirming rejection of the element.
TIP!
Another method to reject elements is to select the block from the navigation pane to display all "Ready" elements within the block. Select the check box for the element you want to reject, and click Reject Selected Element(s). Alternatively, you can simply right-click an element from the navigation pane and click Reject.
5. Click Yes to reject the element. Doing this returns the element to the Draft tab. A rejected
element is represented by the icon.
6. Click OK to close the message box confirming rejection of the element.
7. Repeat step 2-6 for the elements you want to reject.
8. If the element's specification meets your requirement, select its respective block from the navigation pane to display elements within the block.
9. Click Publish All Elements to collectively publish all elements in the block. Doing this displays a dialog box confirming the change.
3-83

Chapter 3: Using the Analytics Studio
10. Click Yes in Publish-Confirmation dialog box.
TIP!
Analytics Studio provides alternate methods for publishing an element.
- Right-click a block on the navigation pane, and click Publish.
- Click All blocks on the navigation pane to display all the blocks that are ready for publishing. Select the check box for the block you want to publish, and click Publish selected block(s).
A published element is represented by the icon and is positioned under the Draft and Published tabs,
3-84

Chapter 4 Backing Up and Restoring Definitions
This chapter explains how to back up and restore Interstage Business Process Manager Analytics (BPMA) Studio elements.
Key concepts covered in this chapter include:
Backing Up Definitions
Restoring Definitions
4-1
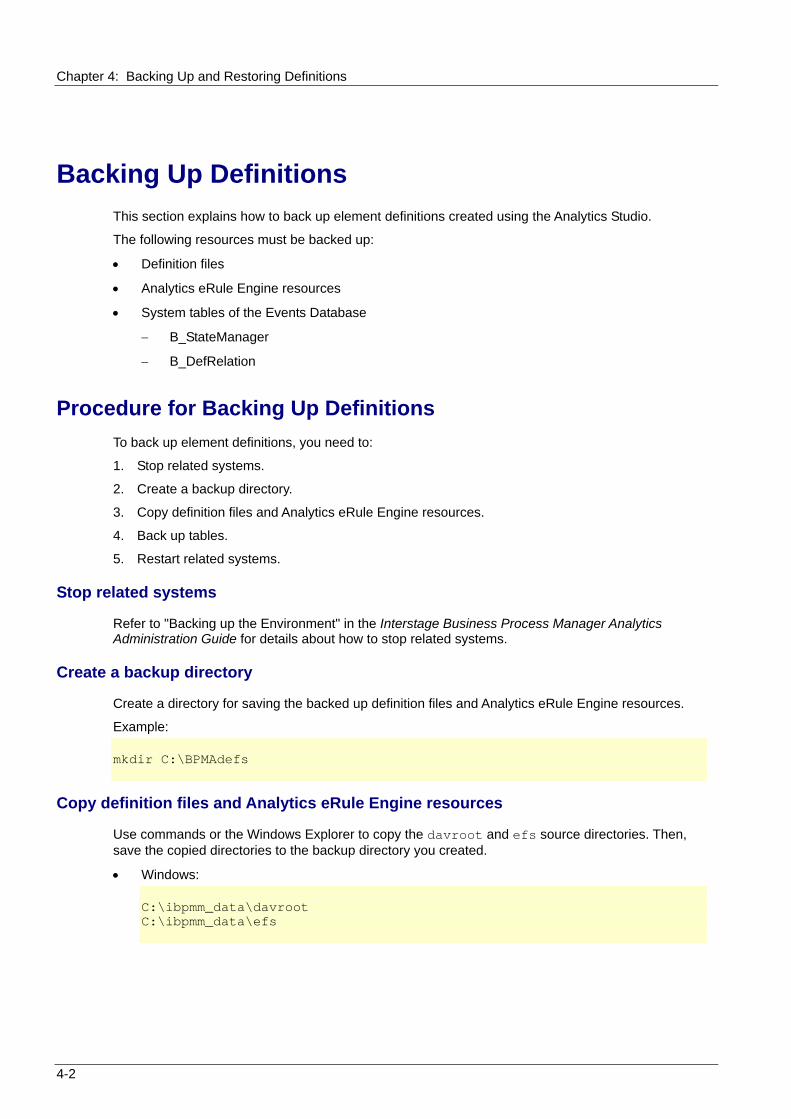
Chapter 4 Backing Up and Restoring Definitions:
4-2
Backing Up Definitions
This section explains how to back up element definitions created using the Analytics Studio.
The following resources must be backed up:
Definition files
Analytics eRule Engine resources
System tables of the Events Database
B_StateManager
B_DefRelation
Procedure for Backing Up Definitions
To back up element definitions, you need to:
1. Stop related systems.
2. Create a backup directory.
3. Copy definition files and Analytics eRule Engine resources.
4. Back up tables.
5. Restart related systems.
Stop related systems
Refer to "Backing up the Environment" in the Interstage Business Process Manager Analytics Administration Guide for details about how to stop related systems.
Create a backup directory
Create a directory for saving the backed up definition files and Analytics eRule Engine resources.
Example: mkdir C:\BPMAdefs
Copy definition files and Analytics eRule Engine resources
Use commands or the Windows Explorer to copy the davroot and efs source directories. Then, save the copied directories to the backup directory you created.
Windows: C:\ibpmm_data\davroot C:\ibpmm_data\efs

Backing Up Definitions
Linux/Solaris: /var/opt/FJSVibpma/data/davroot /var/opt/FJSVibpma/efs/dat
Back up tables
Back up the following resources from the Events database:
B_StateManager table
B_DefRelation table
Depending on the type of database used for the Events database, refer to the appropriate manual for details about how to back up the database and required resources.
The following example uses a built-in database.
Stop resource update
Stop the resources from updating before backing them up. set RDBNAME=BPMA rdbrtr -i EBPMDB.BPMMDSISTATEMANAGER
rdbrtr -i EBPMDB.BPMMDSIDEFRELATION
Back up resources
Back up the resources. set RDBNAME=BPMA rdbunl -i EBPMDB.BPMMDSISTATEMANAGER C:\BPMADefs\BSTATEMANAGER rdbunl -i EBPMDB.BPMMDSIDEFRELATION C:\BPMADefs\BDEFRELATION
Restart resource update
Restart updating of the resources. set RDBNAME=BPMA rdbrls -i EBPMDB.BPMMDSISTATEMANAGER rdbrls -i EBPMDB.BPMMDSIDEFRELATION
Restart related systems
Refer to "Backing up the Environment" in the Interstage Business Process Manager Analytics Administration Guide for details about how to restart related systems.
4-3

Chapter 4 Backing Up and Restoring Definitions:
4-4
Restoring Definitions
This section explains how to restore backed up definitions.
Before restoring the definitions, back up the entire execution environment.
The definitions you backed up are restored to the Analytics Server with the host name, port number, installation directory, and work directory specified during installation.
Procedure for Restoring Definitions
To restore definitions, you need to.
1. Stop related systems.
2. Restore definition files and Analytics eRule Engine resources.
3. Restore tables.
4. Restart Related Systems.
Stop related systems
Refer to "Restoring the environment" in the Interstage Business Process Manager Analytics Administration Guide for details about how to stop related systems.
Restore definition files and Analytics eRule Engine resources
1. Back up the current definition files, and delete the davroot directory.
2. Copy the davroot directory containing the backed up definition files.
3. Back up the current Analytics eRule Engine resources, and delete the efs directory.
4. Copy the efs directory containing the backed up Analytics eRule Engine resource.
Restore tables
Delete the records of the B_StateManager and B_DefRelation tables.
Depending on the type of database used for the Events database, refer to the appropriate manual for details about how to restore the tables.
Restore resources
Restore the resources. The following example uses a built-in database. set RDBNAME=BPMA rdbsloader -mi -i EBPMDB.BPMMDSISTATEMANAGER -h -s C:\BPMADefs C:\BPMADefs\BSTATEMANAGER rdbsloader -mi -i EBPMDB.BPMMDSIDEFRELATION -h -s C:\BPMADefs C:\BPMADefs\BDEFRELATION

Restoring Definitions
Restart related systems
Refer to "Restoring the environment" in the Interstage Business Process Manager Analytics Administration Guide for details about how to restart related systems.
4-5

Chapter 4: Backing Up and Restoring Definitions
4-6

Appendix A Additional Configuration Parameters
This appendix lists some additional configuration parameters for Analytics Studio Elements.
A-1

Appendix A: Additional Configuration Parameters
RDB Collection Rule Configuration Parameters
The section covers Data Collection settings for RDB collection rules.
Collection Management Parameters
The Collection Management area provides options (see Table A-1) to define the type of data to be captured by the collection rule.
Table A-1 Collection management parameters
Master data Includes data used for updating, such as inventories and summaries
Transaction data Includes data that is added, such as sales and transaction records
Management Type
None No criteria is applied for filtering the target source data
Monitor Type Add difference records Only the newly added data is collected
Easy mirroring Mirrors the business data except deleted data
All history Both the newly added and the updated data are collected (the latter is collected as new data)
None No monitor type is applied to the event
A-2

RDB Collection Rule Configuration Parameters
Records Difference Settings
Figure A-1 Record Difference Settings
A-3

Appendix A: Additional Configuration Parameters
Table A-2 Record Difference Settings
Extraction type - Specifies the incremental extraction key column type to use when performing an incremental extraction
- Event stored date — Incremental collection is performed based on the column specified in Column used for difference
- Sequential data — Incremental collection is performed based on the column specified in Column used for difference
Column used for difference - Specifies a column that will be used to compare the time when a task was previously executed and the current execution time, and then, use this information as a condition for filtering the records to be collected
- Different column data types can be set for different extraction types, for example, "Event registration time: Datetime type" or "Sequential data: Real number type, integer type, string type"
New Record Column
Data type for stored Date Specifies the data type for Column used for difference collection
- Timestamp with local timezone
- Timestamp with timezone
- Default
Extraction type Refer to the above description for the "New Record Column"
Column used for difference Refer to the above description for the "New Record Column"
Data type for stored Date Refer to the above description for the "New Record Column"
Key for records Is used as additional information of "Update record column"; the events are specified as target update record using attributes in the update events
Updated Record Column
Time delay - Allows the search to go back the specified interval into the past when a collection condition is executed
- Business data is not always registered with a business database in accordance with its time stamp; by setting a time delay, it is possible to reduce the risk of missing records that should be collected
A-4

RDB Collection Rule Configuration Parameters
Start of collected data Is used to specify conditions for filtering out business records during the initial operation
- ALL — Collects all data targeted for extraction
- Specified date — Collects target data that is dated no earlier than the specified date and time; can be set only when the extraction type in "New record column" is set to Event stored date
- Sequential data — Collects target data that exceeds the specified sequential data value; can be set only when the extraction type in "New record column" is set to Sequential data
A-5

Appendix A: Additional Configuration Parameters
Alert Configuration Parameters
This section covers additional alert configuration parameters.
Event Configuration Parameters
If you selected Check performance of workflow as the rule type for the alert, the Analytics Studio displays additional configuration options described in Table A -3.
Figure A-2 Create Alert Wizard — Event configuration parameters
NOTE
In the following table. a "Dimension" refers to fields in a workflow event that are used in calculation and "Type" refers to the calculation mode for the alert.
A-6

Alert Configuration Parameters
Table A-3 Event configuration parameters
Event Group Indicates that the data is to be analyzed according to event groups
Application Indicates that the data is to be analyzed according to applications
Process Indicates that the data is to be analyzed by processes
Version Indicates that the data is to be analyzed by the version of the business processes
Activity Indicates that the data is to be analyzed by activities
Aggregation Indicates that the data is to be analyzed by aggregation
Dimension
User Indicates that the data is to be analyzed by users
Type Active - Calculates activated processes
- Calculated data with this mode type is displayed on the Process Performance view of the Monitor mode in the Analytics Dashboard
Active snapshot (hourly) - Snapshot of values calculated with the Active mode per hour
- Calculated data with this mode type is displayed on the chart on the Process Performance view of the Monitor mode in the Analytics Dashboard
- Is not applicable to Business process and Application dimension types
Analysis (daily) - Calculates completed processes per day
- Calculated data with this mode type is displayed on the Process Performance view of the Analysis mode in the Analytics Dashboard
Alert Action Configuration Parameters
Table A-4 Alert action general details
Name Name of the alert action Description Brief description of the alert action Success message Message displayed when the issue notified by the alert has been
successfully resolved Failure message Message displayed when the issue notified by the alert has not been
resolved
A-7

Appendix A: Additional Configuration Parameters
Table A-5 Email action configuration parameters
Recipient(s) Email address of the recipient; add multiple email addresses, if required Subject Select one or more parameters from the list to specify the subject of the
email Body Select one or more parameters from the list to specify the content for the
Advanced Language Select a language for the email Encoding Select any of the following values to specify the character set for your
- UTF-8
- ISO-2022-JP
- US-ASCII
- ISO-8859-1
Display recipient(s) Select either Display as ‘undisclosed-recipients’ or Display as normal (e.g. [email protected]) to hide or display the email address of recipients in the email
Table A-6 BPM action configuration parameters
Action template Set the alert parameters to be sent to the Interstage BPM server. The server will forward them to a new process instance to start.
Message Destination Settings
Set system parameters (Display Detailed result, Host name or IP, User name, Password, BPM tenant, Application, Process name, and Process Version).
A-8

Chart Configuration Parameters
Chart Configuration Parameters
This section covers additional chart configuration parameters.
Event Configuration Parameters
If you selected BPM process Event as the event type for a chart, you need to configure specific workflow event-related settings. Refer to "Alert Configuration Parameters" for details.
Chart Settings
The Style settings vary for different chart types. Table A-7 lists additional style settings for different chart types supported by the Analytics Studio.
Table A-7 Additional Chart Configuration Options
Direction - Select either Red when < low threshold or Red when > high threshold to set the threshold color
- Is only applicable to Tachometer and Signal charts
Low threshold - Set a low threshold value for the tachometer
- Is only applicable to Tachometer, Thermometer, and Signal charts
High threshold - Set a high threshold value for the tachometer
- Is only applicable to Tachometer, Thermometer, and Signal charts
Display previous data - Select this check box to display previous data in the chart
- Is only applicable to Tachometer charts
Signal type - Select either One light or Three lights to define the number of lights to be displayed on the signal chart
Line type - Select either Solid or Dotted to specify the line style for the chart
- Is only applicable to Area Charts, Radar Charts, and Line Charts
Line width - Select a value to specify the line width
- Is only applicable to Area Charts, Radar Charts, and Line Charts
Number of partitions - Set a numeric value to specify the number of partitions in a chart
- Is only applicable to Histograms
Orientation - Set either Categories in rows or Categories in columns to set the format of the chart; default is Categories in rows
- Is only applicable to Data Table charts
A-9

Appendix A: Additional Configuration Parameters
A-10
Header Row - Set the background and foreground colors for the header row
- Select the Open Color Palette icon ( ) to choose a color
- Is only applicable to Data Table charts
Header Column - Set the background and foreground colors for the header column
- Select the Open Color Palette icon ( )to choose a color
- Is only applicable to Data Table charts
Data - Set the background and foreground colors for the data represented on the chart
- Select the Open Color Palette icon ( ) to choose a color
- Is only applicable to Data Table charts
Background color (hex) - Set the background color for the chart
- Select the Open Color Palette icon ( ) to choose a color
- Is only applicable to Event Table charts
Foreground color (hex) - Set the foreground color for the chart
- Select the Open Color Palette icon ( ) to choose a color
- Is only applicable to Event Table charts
Maximum display rows - Select a value to specify the number of rows in the chart
- Is only applicable to Event Table charts


![Interstage Coolers a Hot Item[1]](https://img.pdfslide.net/doc/110x75/5452d2d3af795904308b50ec/interstage-coolers-a-hot-item1.jpg)