Embed Size (px)
Citation preview
Intrafocus Limited 1 Park Road Winchester Hampshire SO226AA United Kingdom First published in Great Britain in 2019 Published as a Kindle version in 2019 This version published in 2019
© Intrafocus Limited All rights reserved. No part of this publication may be reproduced, stored in a retrieval system, or transmitted in any form or by any means, electronic, mechanical, photocopying, recording or otherwise, without prior written permission of the author. This book may not be lent, resold, hired out or otherwise disposed of by way of trade in any form of binding or cover other than that in which it is published, without prior consent of the author. All trademarks used herein are the property of their respective owners. The use of any trademark in this text does not vest in the author any trademark ownership rights in such trademarks, nor does the use of such trademarks imply any affiliation with the endorsement of this book by such owners.
Table of Contents
Introduction .......................................................................................................... 1
Step 1 – Foundation .............................................................................................. 4
Step 2 – Assessment ............................................................................................. 9
Step 3 – Strategic Objectives .............................................................................. 18
Step 4 – Key Performance Indicators .................................................................. 24
Step 5 – Projects ................................................................................................. 37
Step 6 - Communication ..................................................................................... 42
Step 7 – Automation ........................................................................................... 46
And Finally .......................................................................................................... 54

Forward
Thank you for downloading this workbook, we hope you will find it useful.
It has been designed to provide guidance for your strategic planning process
and should be used in conjunction with our Strategic Plan Template and the
Strategic Plan Summary one-page presentation. If you work though the seven
steps contained within this workbook, the result will be a strategy that can be
presented to your organisation.
As each step is described you will be invited to provide your own input. This
should be written directly into the Strategic Plan Template.
If you have not done so already, we strongly recommend you take out a free
trial of QuickScore our online strategy and KPI management system. In the
document we will provide some screenshots to show how easy it is to build and
manage your strategy with the software.

1 | P a g e
Introduction
The success of a strategy is not determined by how well it is written. Most
strategies are written with great thought and insight. Unfortunately, they are
often left on the shelf in head-offices around the world gathering dust.
Companies and organisations are good at writing strategies; very few are good
at implementing them.
Strategic Process
This is where a strategic process really helps. The most successful companies,
governments and organisations in the world use a strategic process. It is either
part of their operational process or works seamlessly alongside it.
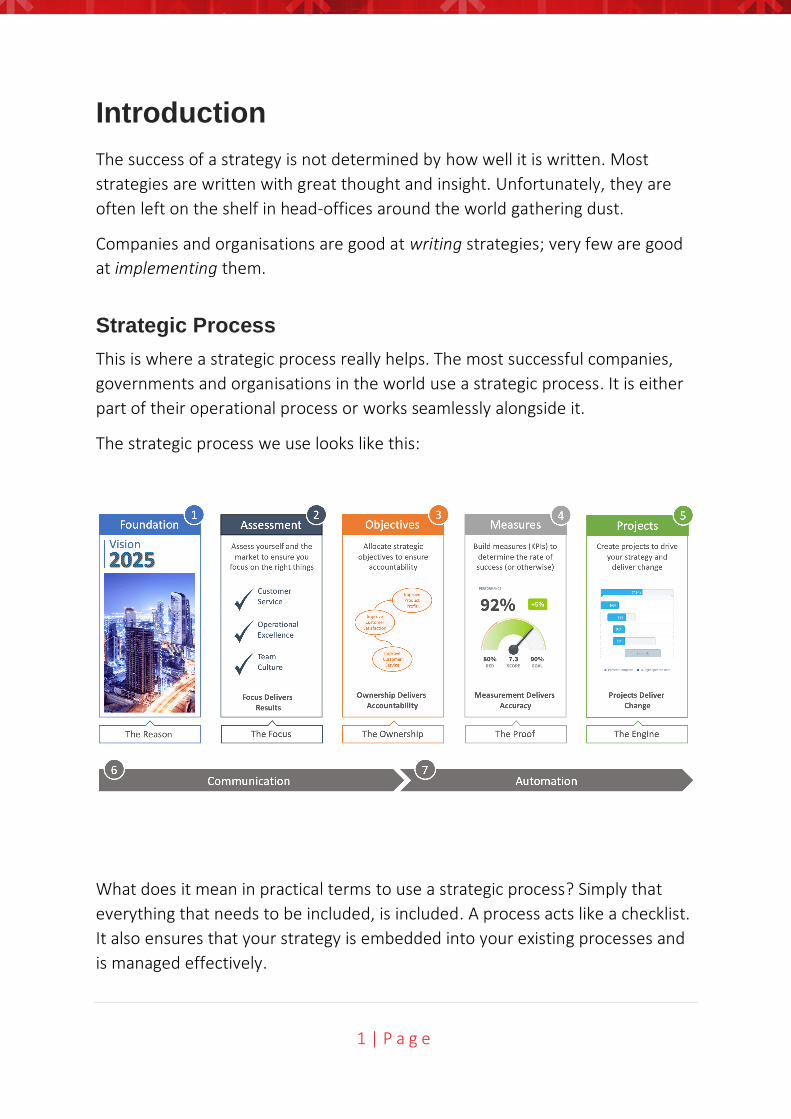
The strategic process we use looks like this:
What does it mean in practical terms to use a strategic process? Simply that
everything that needs to be included, is included. A process acts like a checklist.
It also ensures that your strategy is embedded into your existing processes and
is managed effectively.
2 | P a g e
The Output
It is imperative that the output of a strategic process is clear and concise and if
at all possible short. There is often a great temptation to write as much as
possible. This should be avoided.
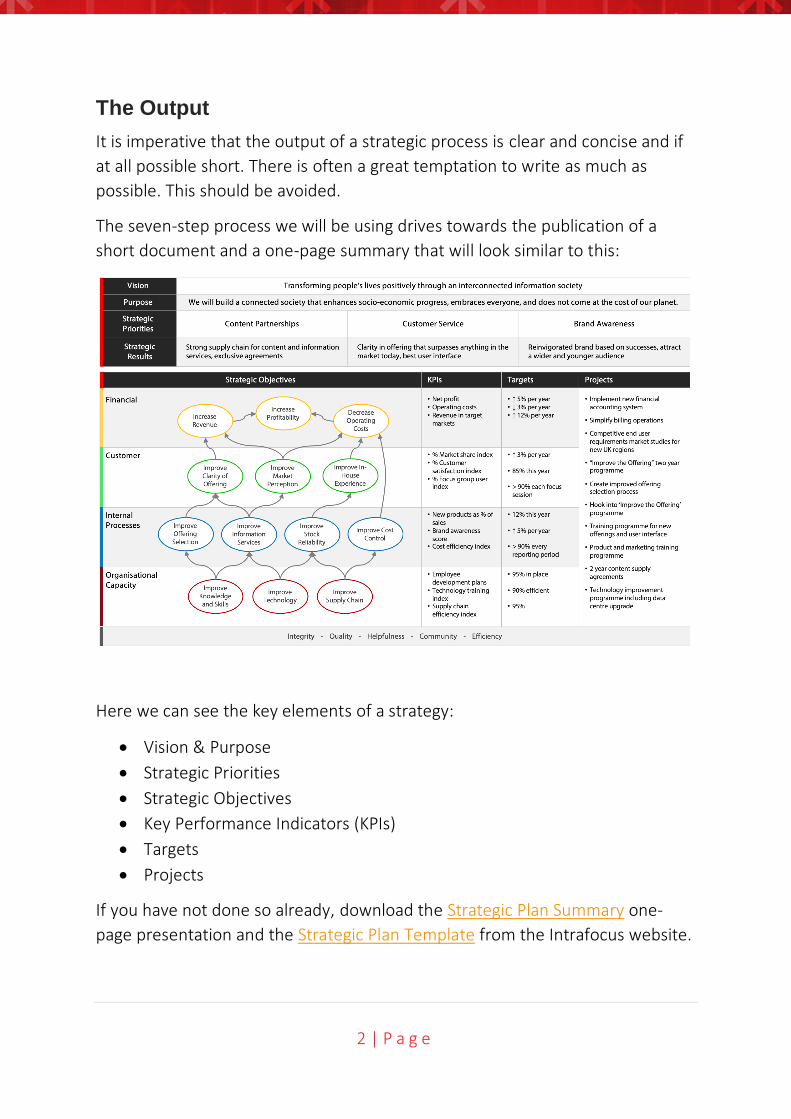
The seven-step process we will be using drives towards the publication of a
short document and a one-page summary that will look similar to this:
Here we can see the key elements of a strategy:
• Vision & Purpose
• Strategic Priorities
• Strategic Objectives
• Key Performance Indicators (KPIs)
• Targets
• Projects
If you have not done so already, download the Strategic Plan Summary one-
page presentation and the Strategic Plan Template from the Intrafocus website.

3 | P a g e
Step
On
e
4 | P a g e
Step 1 – Foundation
People: Executive leader or Strategy Director
Workshop: Not required
Time: Lots of thought and time to review, elapsed one week
In recent years organisations have been forced to think about the environment
in which they live, the people who work for them and the people they serve.
These things have become just as important as business growth or making a
profit. To that end, whereas in the past we may have looked at a Vision and
Mission, today, we tend to look at a Vision and Purpose.
The difference is we are looking at what we can give back to society, our staff,
and our customers as well as what we can earn from them.
Vision
Creating a vision is not usually a group activity. For this exercise we suggest that
one of the executive leaders or a strategy director is tasked with writing a vison
statement that will be reviewed and signed off by the executive team.
Core Values
To create a vision (and purpose) statement you need to look at core values first.
The example output in the introduction had the core values written along the
bottom of the diagram. Core values really are the foundation of a strategy. They
often include things like Customer Focus, Integrity, Quality, Helpfulness,
Community and Efficiency.
The key is to be sure you state exactly what you believe. The best core values
are the ones that already exist within an organisation. Focus on what you and
your staff believe to be true. Try not to think of strap-lines or slogans. Core
values that are held internally are always more powerful than core values that
are generated by a marketing team.
It is okay to be aspirational if you need to be. Sometimes you need to force a
culture change as part of your strategy. As long as you recognise this and
therefore include a change programme, then include the core value.
5 | P a g e
Write a long list of core values and then prioritise it. Select the top five or six.
Any less than six and you are not really thinking about the contribution your
company or organisation is making. Any more than six and the list will become
unbelievable. Write the core values into the Strategic Plan Template and the
Strategic Plan Summary.
What do you do?
This may seem pretty obvious, but it needs to be stated. Vision statements that
simply say ‘We want to be the best’ do not carry much weight. The best vision
statements are the ones that include an element that describes exactly what
you do. Remember, your vision statement might be read by people who do not
know your company or organisation.
Write what you do - take some time to write one or two sentences that
describe exactly what your company or organisation does. Then highlight the
key words in the sentence. Set this aside for use later on. Re-write the sentence
as a short statement into the Strategic Plan Template under What we do.
How are you different?
You need to differentiate yourself from your competition. Why would someone
use a product or service from you rather than your competitor?
It may be that you have been in business for decades and have a premium
brand. It may be that your ingredients are locally sourced, or your components
are responsibly sourced. In our example it is that the company can provide
ultra-high-speed wireless connectivity and information services. This is a
combination that is currently not well served in the market.
Write how you are different - This exercise may need input from other people,
and you may need to talk to your customers or users of your services. If you
cannot find anything that you do differently, then put this exercise on hold, but
it will have to be revisited after step two Strategic Priorities. Write what you do
differently in the Strategic Plan Template under How we are Different.
6 | P a g e
Target audience
Finally, consider your target audience. Many vision statements are too bold. Our
example is a good case in point. The target audience in the statement
“Transforming society through ease of access to ultra-high-speed wireless
information services” is everyone! In this instance, it is probably okay as the
example is for a multinational mobile phone and network provider. However, if
your company is a local brewery, then your target audience should be more
clearly defined.
Describe your target audience - this is an important vision statement
parameter. It can be applied to provide differentiation and add real weight to
your vision statement. Write a statement describing your target audience into
the Strategic Plan Template under Our Target Audience
Write your final vision statement
Using all of the elements above, write your vision statement. It should be short
and inspirational. A good test is to read it out loud to see if you would like to
work for a company with that vision. If you are really stuck, take some guidance
from the following real examples:
Nike: “Bring inspiration and innovation to every athlete* in the world” (*if you
have a body, you are an athlete)
Microsoft: “To empower every person and every organisation on the planet to
achieve more”
Amazon: “To be earth’s most customer-centric company; to build a place where
people can come to find and discover anything they might want to buy online”
Sainsbury’s: “To be the most trusted retailer, where people love to work and
shop”
Write your final vision statement into the Strategic Plan Template under Vision
and the Strategic Plan Summary.
7 | P a g e
Purpose
Where a vision is strategic and inspirational, purpose is cultural and aspirational.
An organisations purpose describes how it will work together as a community
and share the dream of achieving the vision.
It is much more difficult to write. Our example:
“Delivering connectivity and information services that contribute to sustainable
living while behaving ethically and responsibly”
may seem a bit over the top. However, the mobile phone industry has been
forced to publicly adopt these standards due to pressure groups exposing
previous unethical behaviour.
In this instance, it was necessary to publicly demonstrate a change in direction.
By including the statement in their strategy, this company has stated that they
will be held accountable in the future.
It may not be necessary to go so far in your statement of purpose. It should be
of a form that is aspirational and related to your vison.
Write your Purpose
This exercise will require input from various areas of the organisation. We
recommend that this is led by an executive manager and that a ‘candidate’
statement is written and distributed for comment. The statement can then be
refined and published. Write the final statement into the Strategic Plan
Template and the Strategic Plan Summary under Purpose.
Conclusion
Together with your core values, these two statements are now the basis of your
strategy. Everything from this point forward should refer back to these
statements and be aligned to them.
The next stage is to consider how to break these high-level directional
statements into strategic priorities.

8 | P a g e
Step
Tw
o
9 | P a g e
Step 2 – Assessment
People: The Executive team, 3-5 people
Workshop: Three back-to-back exercises
Time: Two hours per exercise and write up afterwards
Setting out a vision and purpose is a great first step. It provides a general
direction for the organisation and inspires people to act. However, a vison and
purpose will not provide enough detail to set an organisation on the right path
to achieve its goals. For this, a set of strategic priorities is required.
Strategic priorities force an organisation to look deeply into exactly what they
want to achieve and describe the outcomes to ensure the right paths are taken.
Assessment
Using the guidance provided by the vison and purpose, the first step in defining
a set of strategic priorities is to complete an assessment. There are many
standard business assessment tools that can be used including:
• SWOT Matrix (Strengths, Weaknesses, Opportunities, Threats)
• Pestle (Political, Economic, Socio-Cultural, Technological, Legal and
Environmental)
• Porters Five Forces
• Gap Analysis
• Strategy Canvas
• Benchmarking
All of the above are useful tools to assess a current situation and plan a future
outcome. You can find details of each here: Strategic Analysis. In this workbook
a variant of SWOT will be used.
10 | P a g e
SWOT stands for Strengths, Weaknesses, Opportunities and Threats. In its most
common use, a matrix is created like this:
Strengths Weaknesses
Opportunities Threats
The variant we use concentrates on the left-hand column, the Enablers and the
right-hand column, the Challenges. Completing the table usually requires input
from four or five people who have a good knowledge of the business or
organisation. For example, this could be a senior management team with one
subject matter expert.
Enablers and Challenges - Exercise
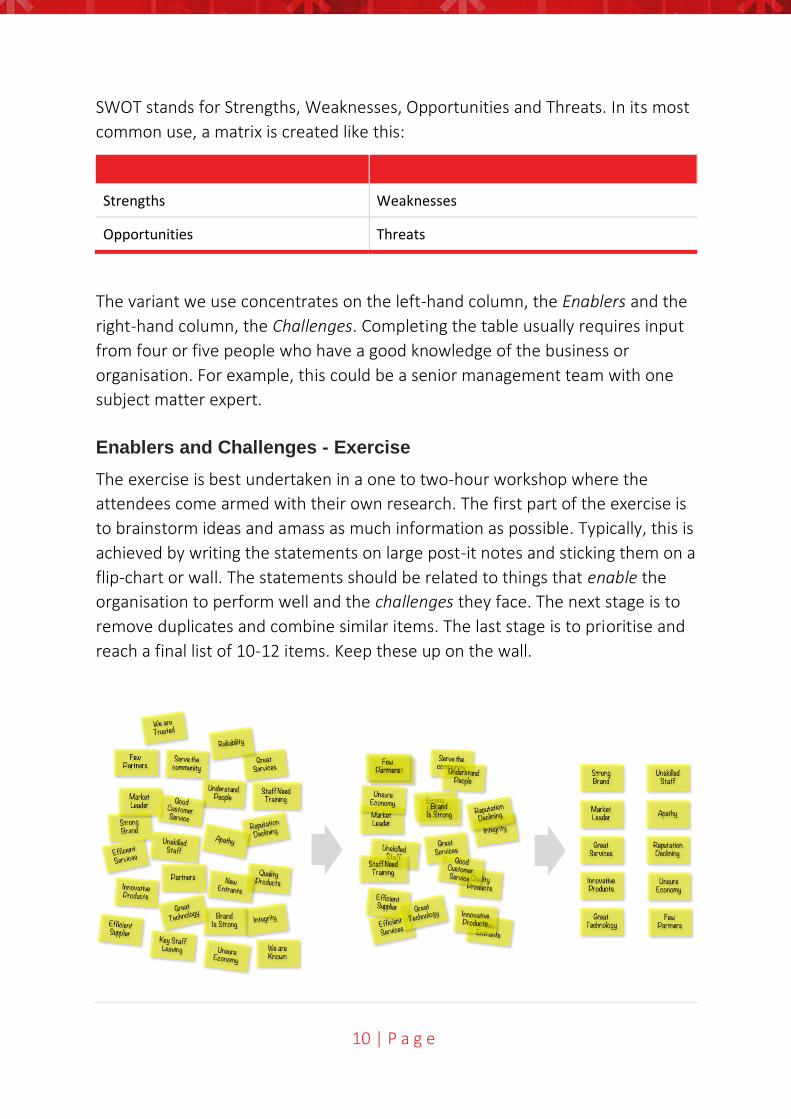
The exercise is best undertaken in a one to two-hour workshop where the
attendees come armed with their own research. The first part of the exercise is
to brainstorm ideas and amass as much information as possible. Typically, this is
achieved by writing the statements on large post-it notes and sticking them on a
flip-chart or wall. The statements should be related to things that enable the
organisation to perform well and the challenges they face. The next stage is to
remove duplicates and combine similar items. The last stage is to prioritise and
reach a final list of 10-12 items. Keep these up on the wall.
11 | P a g e
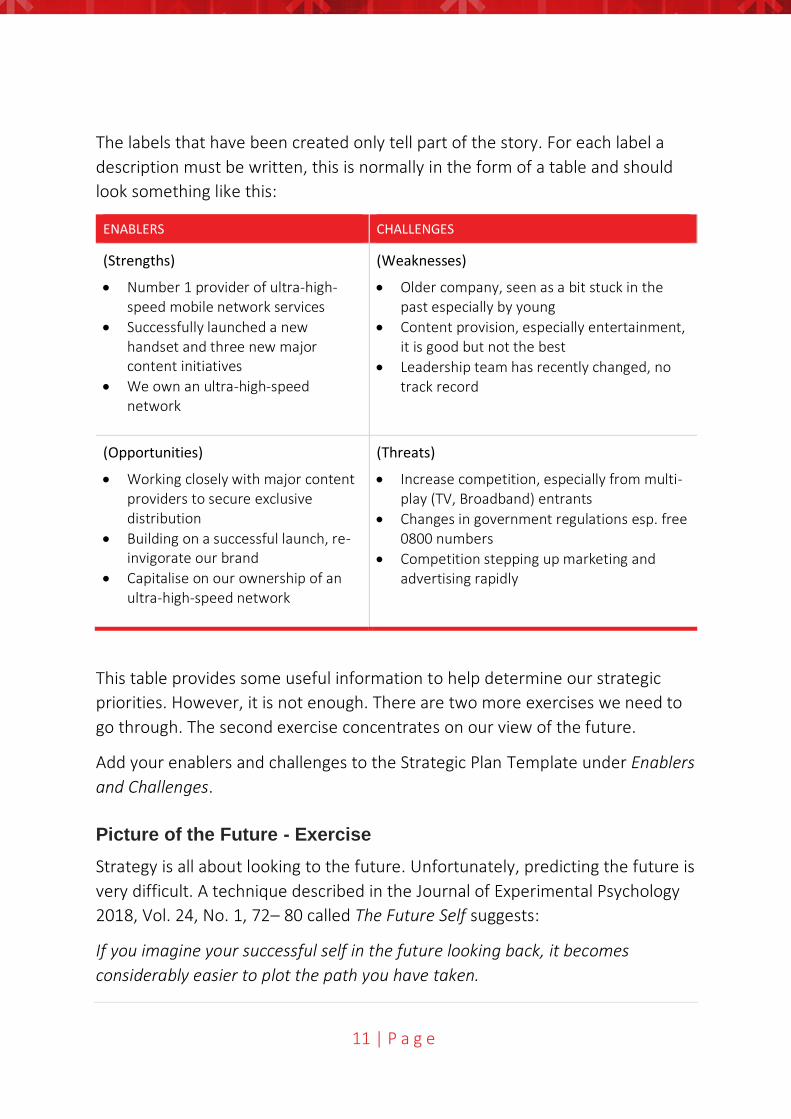
The labels that have been created only tell part of the story. For each label a
description must be written, this is normally in the form of a table and should
look something like this:
ENABLERS CHALLENGES
(Strengths)
• Number 1 provider of ultra-high-speed mobile network services
• Successfully launched a new handset and three new major content initiatives
• We own an ultra-high-speed network
(Weaknesses)
• Older company, seen as a bit stuck in the past especially by young
• Content provision, especially entertainment, it is good but not the best
• Leadership team has recently changed, no track record
(Opportunities)
• Working closely with major content providers to secure exclusive distribution
• Building on a successful launch, re-invigorate our brand
• Capitalise on our ownership of an ultra-high-speed network
(Threats)
• Increase competition, especially from multi-play (TV, Broadband) entrants
• Changes in government regulations esp. free 0800 numbers
• Competition stepping up marketing and advertising rapidly
This table provides some useful information to help determine our strategic
priorities. However, it is not enough. There are two more exercises we need to
go through. The second exercise concentrates on our view of the future.
Add your enablers and challenges to the Strategic Plan Template under Enablers
and Challenges.
Picture of the Future - Exercise
Strategy is all about looking to the future. Unfortunately, predicting the future is
very difficult. A technique described in the Journal of Experimental Psychology
2018, Vol. 24, No. 1, 72– 80 called The Future Self suggests:
If you imagine your successful self in the future looking back, it becomes
considerably easier to plot the path you have taken.
12 | P a g e
This is a one to two-hour activity and should follow on immediately from the
previous exercise to keep the momentum going. Ask the same attendees to
imagine themselves in the future where your company or organisation has been
immensely successful. Then brainstorm and write short statements on post-it
notes that explain the success. Put them up on the wall next to the enablers and
challengers. These notes might include things like; developed innovative
products, we improved the efficiency of our supply chain, the brand was
strengthened through an awareness campaign, we supported local charities.
Once a large number of statements have been added, remove any duplicates
and combine similar statements. Try to end up with 10-12 statements. Write
the final list in a table but keep the post-it notes up on the wall, they will
contribute to the next exercise.
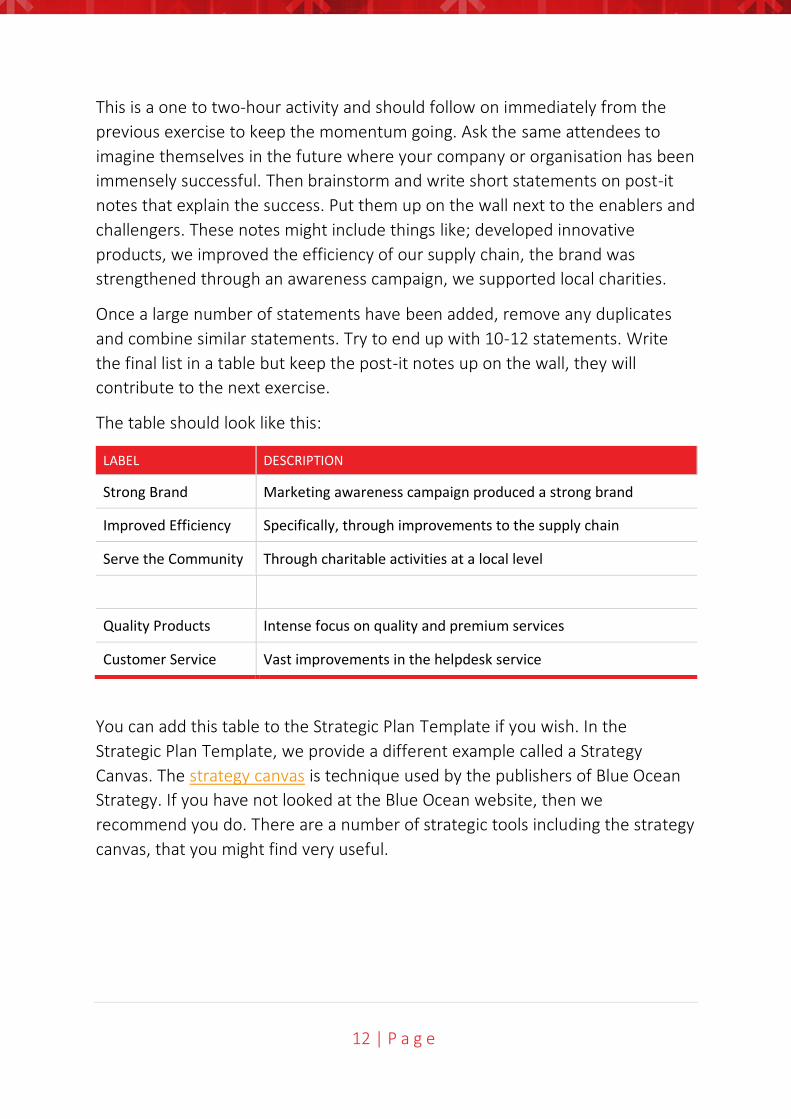
The table should look like this:
LABEL DESCRIPTION
Strong Brand Marketing awareness campaign produced a strong brand
Improved Efficiency Specifically, through improvements to the supply chain
Serve the Community Through charitable activities at a local level
Quality Products Intense focus on quality and premium services
Customer Service Vast improvements in the helpdesk service
You can add this table to the Strategic Plan Template if you wish. In the
Strategic Plan Template, we provide a different example called a Strategy
Canvas. The strategy canvas is technique used by the publishers of Blue Ocean
Strategy. If you have not looked at the Blue Ocean website, then we
recommend you do. There are a number of strategic tools including the strategy
canvas, that you might find very useful.
13 | P a g e
Value Proposition - Exercise
It is vitally important that your company or organisation is able to describe the
product or service that it offers in easy to understand terms. This description is
often referred to as a Value Proposition.
A value proposition is a collection of the most persuasive reasons why your
customers, and potential customers, should be interested in what you have to
offer. It is usually described in terms of its Attributes of the product or service
and the Relationship and Image you have with the customer.
This is a one-hour activity and should follow-on immediately from the previous
exercise. Ask the same attendees to consider what the elements are that make
up a value proposition. Do not write a value proposition yet. Each element
should be written on post-it notes and put up on a wall next to the results of the
previous two exercises. Typically, you may find elements like; error free,
premium price, convenient access, responsive, trustworthy, knowledgeable.
As with the previous exercises, remove any duplicates and combine similar
statements. Try to end up with 10-12 statements. Write the list in a table but
keep the post-it notes up on the wall, they will contribute to the final stage.
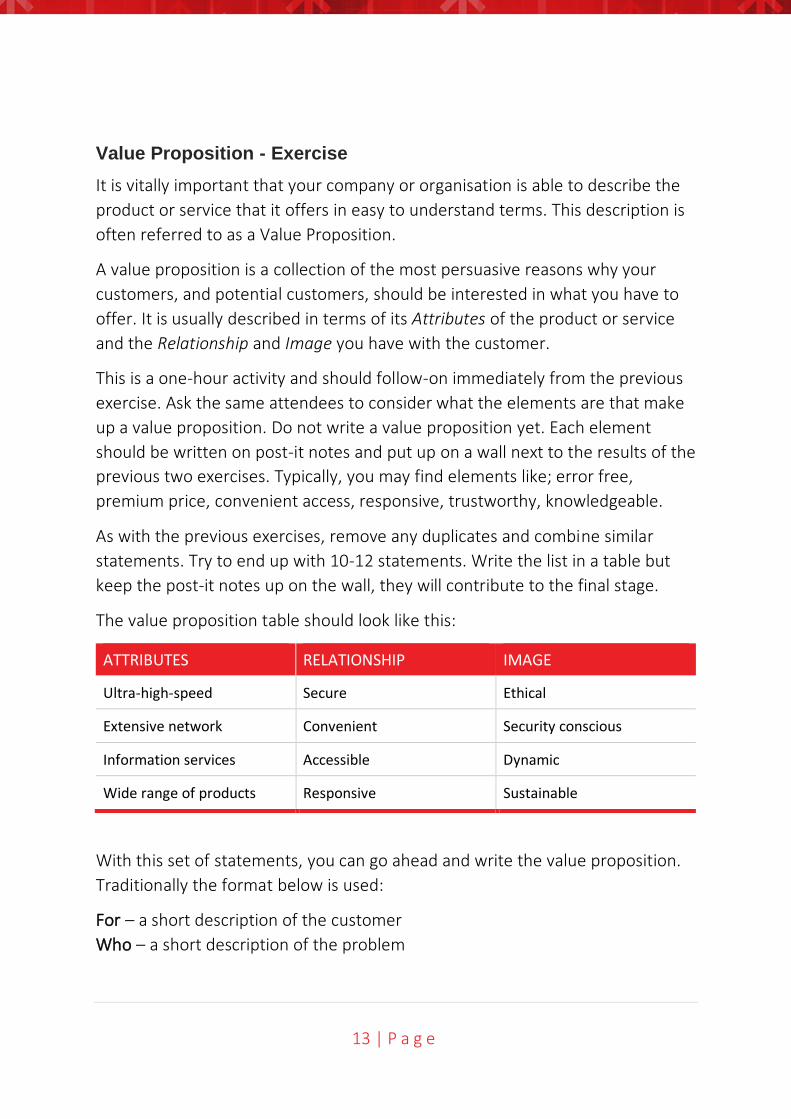
The value proposition table should look like this:
ATTRIBUTES RELATIONSHIP IMAGE
Ultra-high-speed Secure Ethical
Extensive network Convenient Security conscious
Information services Accessible Dynamic
Wide range of products Responsive Sustainable
With this set of statements, you can go ahead and write the value proposition.
Traditionally the format below is used:
For – a short description of the customer
Who – a short description of the problem
14 | P a g e
Our – a short description of the solution
So that – a short description of the benefit derived.
The value proposition should be around 30 words, for example:
For people who need secure fast communications wherever they are our
extensive networks provide ultra-high-speed wireless connections so that they
can send and receive information in any format including documents, images
and video.
Add the value proposition to the Strategic Plan Template.
Creating Strategic Priorities - Exercise
At this stage you should have a wall full of post-it notes (between 30-40 in total)
that describe your enablers, challenges, picture of the future and value
proposition. All of these elements are things that you believe are important to
the success of your strategy. They will now be used to create your strategic
priorities.
In this penultimate stage we will be using a technique called Affinity Grouping.
As the title suggests, you will be grouping all of the post-it notes into groups
that deal with a similar subject. The aim is to find:
• Three groups that will become your strategic priorities
• One group that should inform you about your core values
• One group that will contain items that are non-contributors or will be dealt
with in a different time frame
There are very good reasons why we look for only three strategic priorities. It
has been well established through countless research studies that the Law of
Diminishing Returns applies directly to prioritisation:
• If you have 2-3 priorities, you are likely to achieve 2 or 3
• If you have 4-10 priorities, you are likely to achieve 1 or 2
• If you have 10+ priorities, you are likely to achieve nothing
Ask the attendees of the workshop to stand and look at all of the post-it notes
on the wall. In the first step, remove any exact duplicates. In the second step,
start to move the post-it notes in to groups that relate directly to each other. In
the third step move the post-it notes into groups that indirectly relate to each
15 | P a g e
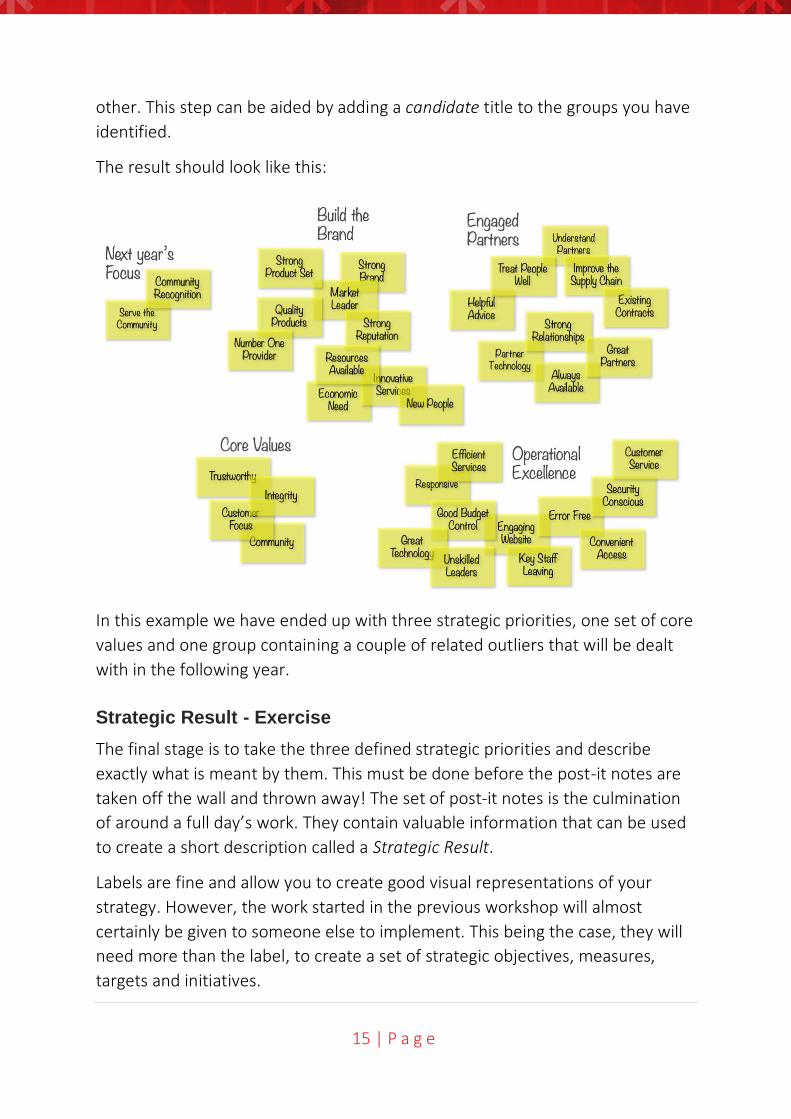
other. This step can be aided by adding a candidate title to the groups you have
identified.
The result should look like this:
In this example we have ended up with three strategic priorities, one set of core
values and one group containing a couple of related outliers that will be dealt
with in the following year.
Strategic Result - Exercise
The final stage is to take the three defined strategic priorities and describe
exactly what is meant by them. This must be done before the post-it notes are
taken off the wall and thrown away! The set of post-it notes is the culmination
of around a full day’s work. They contain valuable information that can be used
to create a short description called a Strategic Result.
Labels are fine and allow you to create good visual representations of your
strategy. However, the work started in the previous workshop will almost
certainly be given to someone else to implement. This being the case, they will
need more than the label, to create a set of strategic objectives, measures,
targets and initiatives.
16 | P a g e
Based on the labels and tables you have created above, you need to write a
strategic result for each strategic priority. The result should be written using an
‘outcome’ based language. For example, for Build the Brand you might write:
“Wherever there is a need for ultra-high-speed technology, our brand is the first
to come to mind for young people seeking quality information and
entertainment services” rather than writing “We will be the best brand for
quality information and entertainment”.
The first sentence sets the mindset that that the priority has been achieved. The
second is less directive and sets the mindset that we have a hill to climb.
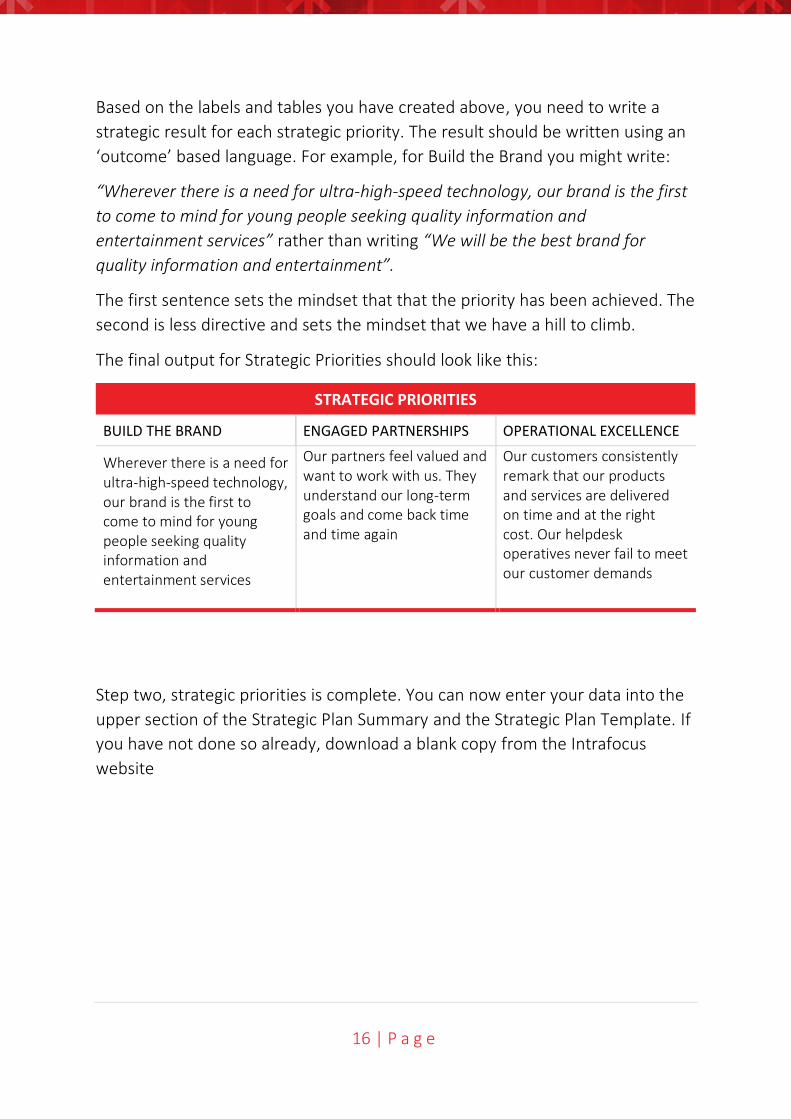
The final output for Strategic Priorities should look like this:
STRATEGIC PRIORITIES
BUILD THE BRAND ENGAGED PARTNERSHIPS OPERATIONAL EXCELLENCE
Wherever there is a need for ultra-high-speed technology, our brand is the first to come to mind for young people seeking quality information and entertainment services
Our partners feel valued and want to work with us. They understand our long-term goals and come back time and time again
Our customers consistently remark that our products and services are delivered on time and at the right cost. Our helpdesk operatives never fail to meet our customer demands
Step two, strategic priorities is complete. You can now enter your data into the
upper section of the Strategic Plan Summary and the Strategic Plan Template. If
you have not done so already, download a blank copy from the Intrafocus
website

17 | P a g e
Step
Th
ree
18 | P a g e
Step 3 – Strategic Objectives
People: One executive, three-four senior managers, one subject matter expert
Workshop: There are two back to back exercises
Time: Each session takes around two hours – the results to be written later.
What is a strategic objective?
Now that you have a vision, purpose and three strategic priorities it is time to
break the work down even further and assign ownership to individuals.
Strategic Objectives fall into four major categories:
1. Financial – These are usually the easiest to identify and always the outcome
of any other strategic objectives. Examples are Increase Revenue, Improve
Profit, Reduce Costs
2. Customer – Looking from your customers viewpoint. What is important to
your customers or the people you service. Examples include Improve
Customer satisfaction, Improve Customer Retention.
3. Internal Processes – The operational activities your organisation undertakes,
this is about speed and efficiency. Examples include Improve Information
Services, Reduce Waste, Improve Internal Communications
4. Organisational Capacity – This is often the main investment area and focuses
on people, infrastructure and knowledge. Examples include Improve
Knowledge and Skills, Improve Technology, Improve Partnerships
You may have noticed that all of the example strategic objectives above start
with the word Increase, Improve or Reduce. Strategic Objectives are generally
continuous improvement activities, they are not projects. Identifying projects
(or Initiatives) comes later. This is intentional. Until you know what you are
really trying to achieve, you should not invest in a project that may or may not
have a positive impact.
Create some strategic objectives
Bring together a small team for a two to three-hour workshop to create a set of
strategic objectives. You can use a similar brain-storming approach as in the
19 | P a g e
previous exercises, however the output here should be more focused. Every
strategic objective must contribute to one or more of your strategic priorities.
Ask the attendees to write down an objective or two that they believe will result
in an improvement in your organisation.
Here are some examples that usually come up in the early stages:
• Increase company profit
• Increase revenue by 10% next year
• Reduce sales costs
These are really good objectives and easily measurable and starting at the top is
admirable.
However, think about some objectives that can be more easily controlled to
contribute to these top-line strategic objectives, for example:
• Increase the number of projects worth £250k or more
• Improve skill level of senior consultants
• Implement a sales plan (more on this ‘objective’ later!)
At this stage it is not important to be precise, during the next stage we will crisp
up the objective definitions.
Thought should be put into how the objectives will contribute to the vision and
purpose; whether or not your organisation has any control over the objectives
(it’s best to have some level of control); that the objectives are single objectives
and not several under the guise of a single objective and finally they should be
important or related to something in need of attention.
Go back to the objectives you have written and answer these questions:
1. Do they contribute to the vison and purpose?
2. Are they important and will they make a difference?
3. Are they single objectives?
4. Do you have some level of control to influence the result?
5. Can they be measured?
If the answer to all (or most) of the questions above is yes, then move on. If the
answer to most of the questions is no, then refine the objectives. They do not
have to be perfect, but they do need to be more than halfway there.
20 | P a g e
Causal Relationships
To ensure that the right things are being looked at and that all improvement
areas are included you should look at the causal relationships between the
objectives you create. This should be done by the same people as above to
ensure continuity and to enable speedy rework if things have been left out.
Take your objectives and write them on some large post-it notes, one on each.
Place them up on a wall and arrange then into four tiers that correspond with
the categories: Financial, Customer, Internal Processes, Organisational Capacity.
You should be aiming for three or four strategic objectives in each layer. It is
permissible to have five in one layer but remember what was said earlier about
the law of diminishing returns, the same applies here.
When you are happy with the layers, draw in some arrows from the bottom to
the top. You will be creating a Strategy Map. A strategy map shows that activity
in the lower layers will have an impact on, or drive an outcome in, the upper
layers. The arrows can go to the side, but they cannot go down.
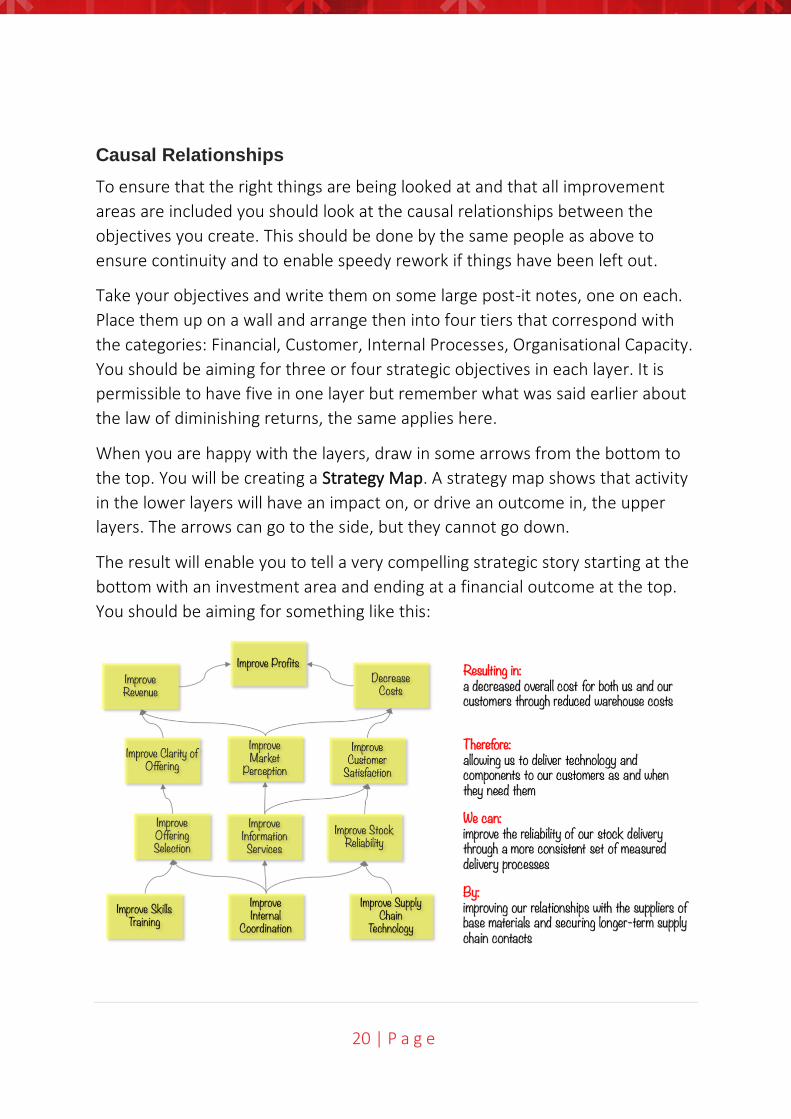
The result will enable you to tell a very compelling strategic story starting at the
bottom with an investment area and ending at a financial outcome at the top.
You should be aiming for something like this:
21 | P a g e
As can be seen each strategic objective is connected, none have been left out.
Looking at the strategic objectives on the right-hand side of the chart, the story
from the bottom to the top is clear:
By improving or relationships with suppliers of base materials and securing long-
term supply chain contracts, we can improve the reliability of our stock delivery
through a more consistent set of measured delivery processes, therefore
allowing us to deliver technology and components to our customers as and
when they need them, resulting in a decreased overall cost for both us and our
customers through reduced warehouse costs.
To get to the point where a clear strategic outcome can be written like this, we
need to look closely at the labels we have created and for each define a
Strategic Objective Result.
Strategic Objective Results
Strategic objective results are best written after the workshop by assigning
specific objectives to one or two individuals. The results can then be refined and
put out for review and comment.
It is essential to create a result for each objective using a results-oriented
language. This forces us to think more precisely about what we are actually
trying to achieve.
For example, if we look at one of the objectives given above: Implement a sales
plan, this may seem to be a very sensible thing to do but it is not a strategic
objective. It is a project that can only be measured through the time it takes to
implement the plan. It will tell us nothing about success or failure relative to the
business strategy.
[Important note: Tasks and projects are vitally important. They are the means
by which we implement change to make improvements. However, we need to
measure the improvement not the change, to demonstrate success or otherwise.
Therefore, we need results-oriented objectives]
The previous example might be more useful if it included why we want to
implement a sales plan. It may be to reduce the sales cycle. This is still a bit
vague and may be better expressed as to reduce the time taken to convert a
qualified lead into a sale. This is much better and has produced an objective
with a tangible result.
22 | P a g e
In business we have a tendency to use words and phrases like best practice,
optimised, world class, efficient, effective, productive. Although the implied
meaning is positive, the actual meaning is vague. Objectives using these words
are not results-oriented and will therefore always fall short when used in
performance improvement activities. It is always better to use words that have
common meaning and cannot be vaguely interpreted.
At this stage it is not important to go so far as including a target within the
objective. It would have been easy to express our example as reduce the
number of days to convert a qualified lead to a sale from 30 to 25.
Targets are the domain of the measure rather than the objective. When we
look at measures in the next step, we will look closely at how to set targets in
the context of viable comparators or benchmarks.
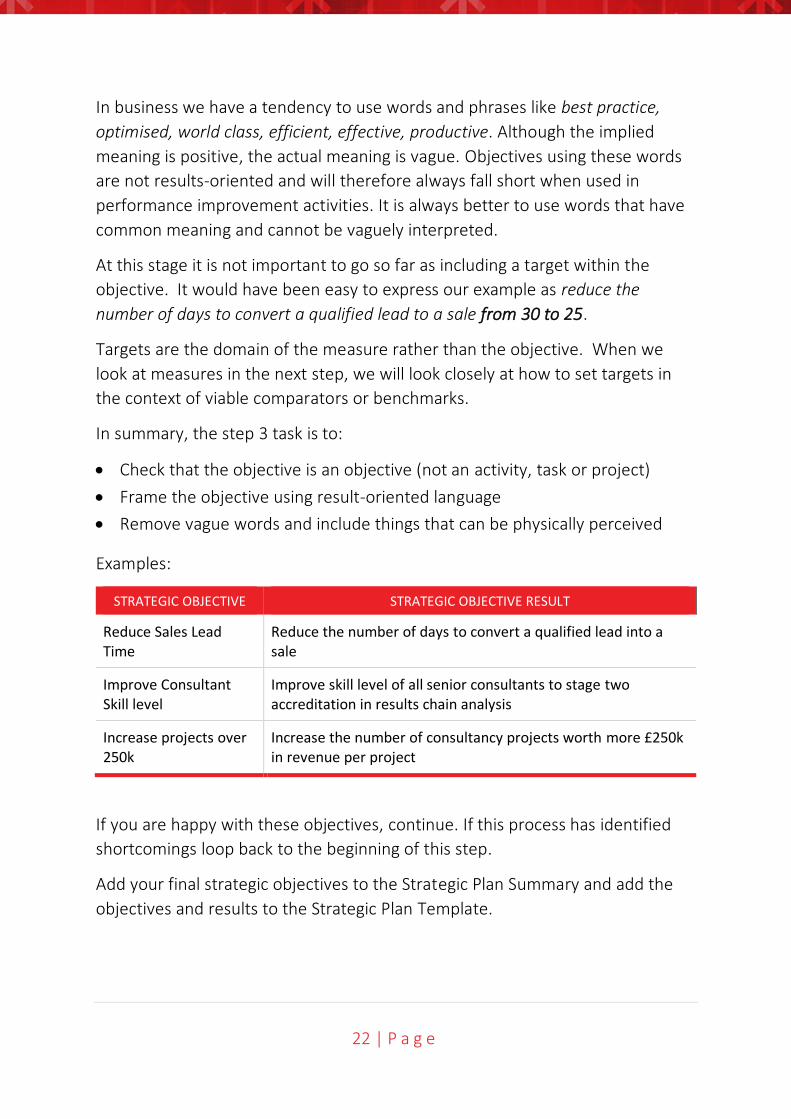
In summary, the step 3 task is to:
• Check that the objective is an objective (not an activity, task or project)
• Frame the objective using result-oriented language
• Remove vague words and include things that can be physically perceived
Examples:
STRATEGIC OBJECTIVE STRATEGIC OBJECTIVE RESULT
Reduce Sales Lead Time
Reduce the number of days to convert a qualified lead into a sale
Improve Consultant Skill level
Improve skill level of all senior consultants to stage two accreditation in results chain analysis
Increase projects over 250k
Increase the number of consultancy projects worth more £250k in revenue per project
If you are happy with these objectives, continue. If this process has identified
shortcomings loop back to the beginning of this step.
Add your final strategic objectives to the Strategic Plan Summary and add the
objectives and results to the Strategic Plan Template.

23 | P a g e
Step
Fo
ur
24 | P a g e
Step 4 – Key Performance Indicators
People: Senior Managers with contribution from the Strategy Director
Workshop: Workshop to start the activity and assign tasks
Time: Two hours for the workshop, tasks will depend on KPIs
What are Key Performance Indicators?
In business, government and non-profit organisations we measure many things.
We do this to keep on track, to make improvements and to drive our strategy.
Unfortunately, often where we think we have a decent set of key performance
indicators, in reality we have a hotchpotch of tasks, objectives and projects with
a few badly described metrics. There is a real need to understand exactly what
we mean by the phrase Key Performance Indicator.
A Key Performance Indicator (KPI) is often referred to as a Key Performance
Measure, Performance Measure, Measure or a Metric. This is perfectly valid,
the important thing is the definition not the label, if Metric is the term generally
used in your organisation, then use it. If measure is used, use measure. Most
frequently in business Key Performance Indicator or KPI is used. For the purpose
of brevity, the term KPI will be used in this document.
A KPI is something that can be counted and compared; it provides evidence of
the degree to which an objective is being attained over a specified time.
The definition above includes a set of words that need further explanation to
ensure the statement is fully understood:
Counted: This may seem a little trite, however, counted means that a quantity
can be assigned. Examples are a number, percentage or currency. ‘Counted’,
does not mean a percentage achieved. One of the most frequent mistakes in
setting KPIs is to create a project and assess its success through how much work
has been done. Just because a project has completed does not mean it has
contributed to the strategy. Success is dependent on an outcome of an
objective not the completion of an activity.
25 | P a g e
Compared: A number or value may be interesting, but it only becomes useful
when it is compared to what is optimal, acceptable or unacceptable. Every KPI
must have a comparator or benchmark. Using an industry benchmark gives an
objective quality to the comparator, objectivity is not required, but it is
desirable.
Evidence: The evidence will fall out by counting and comparing correctly. It is
important use KPIs that can be observed in the same way by all stakeholders.
The evidence should be clear and have a specific meaning.
Objective: A KPI only has significance if it is contributing to an objective. If there is
no objective, why is it being measured in the first place? This does not mean we
should ignore all operational measures; there is a difference between an operational
measure and a strategic KPI.
Specified Time: Everything is time bound; progress towards meeting an objective
must be measured over a specified period of time.
The Golden Rule: Key Performance Indicators are based on strategic objectives. If a
KPI exists and it is not based on an objective, then it is serving no useful purpose.
Let’s be clear here though. There may be many other metrics in the organisation that
provide information, for example, cost metrics as part of a profit and loss statement,
but these may not be KPIs.
The Workshop
The purpose of the workshop is to instruct the attendees as to what we mean
by ‘KPI’ and how to best describe the output. The following provides instruction
for the content of the workshop. Use it to help instruct your attendees.
The KPI needs to be clearly described
There are three key activities that need to occur when identifying a KPI:
• The KPI needs to be clearly described (and based on an objective)
• The KPI needs to be rated in terms of importance
• The KPI needs to be calculated and ownership assigned
It does not matter at the moment if you use lots of words to describe a KPI.
Later on, the short ‘label’ will be created for convenience. For now, the KPI
26 | P a g e
needs to have a very clear description and therefore will end up as a statement
or short sentence. Start with one of your objectives previously defined.
Next, focus on the physically perceived part of the objective, this will give you a
clue as to the tangible things you need to measure. In the example above
Reduce the number of days to convert a qualified lead into a sale the tangible
items are ‘days’ and ‘qualified leads’ and ‘sales.’ These are the things that can
be measured and will be included in the final KPI. At a later point we will include
descriptions for each of the tangible items.
A word of warning: don’t at this point simply go back to what you are measuring
already and say something like “got that covered, we already have a lead to
sales ratio’’. It may be that you do have it covered, however, it is more likely
that the particular KPI you are thinking of was created years ago based on a
formula that is no longer relevant. Clearly this will not be true of all KPIs, but the
check needs to be made.
It is now time to consider lead and lag KPIs. All too often our KPIs concentrate
on lag measures. That is, those measures that occur after the event. Typically,
financial measures fall into this category; revenue, gross margin, net profit and
costs are all things that we measure after an event has happened. We need to
do this as we can learn and adjust, but the act of measurement does not cause
change. Why do we concentrate on lag KPIs? Simply because they are easy to
count and provide proof of success or failure. If I stand on a set of scales, they
tell me whether or not I have lost or gained weight. If my objective is to lose
weight, getting on the scales has not helped. However, if I measure how many
times I go for a run and how much I have eaten (and plan for this) then I have
put in place two lead KPIs that should help me succeed. Lead KPIs are harder to
identify but they can be influenced and therefore make a difference.
We must not underestimate the importance of lead KPIs when identifying and
describing our KPIs. It may take a little longer to identify this type, but it is worth
the effort in the long run. Even if they are discarded, they may provide
additional insight into the way an organisation is being run.
Another quality of a typical lead KPI is that it may not hold a guarantee of
success. In the following example; The number of sales people trained in selling
our products to grade III certification we believe that this will have a positive
impact on our objective. Common sense dictates that trained people will
27 | P a g e
perform better than untrained people. However, we will only have the proof
when we see a positive change in a lag KPI.
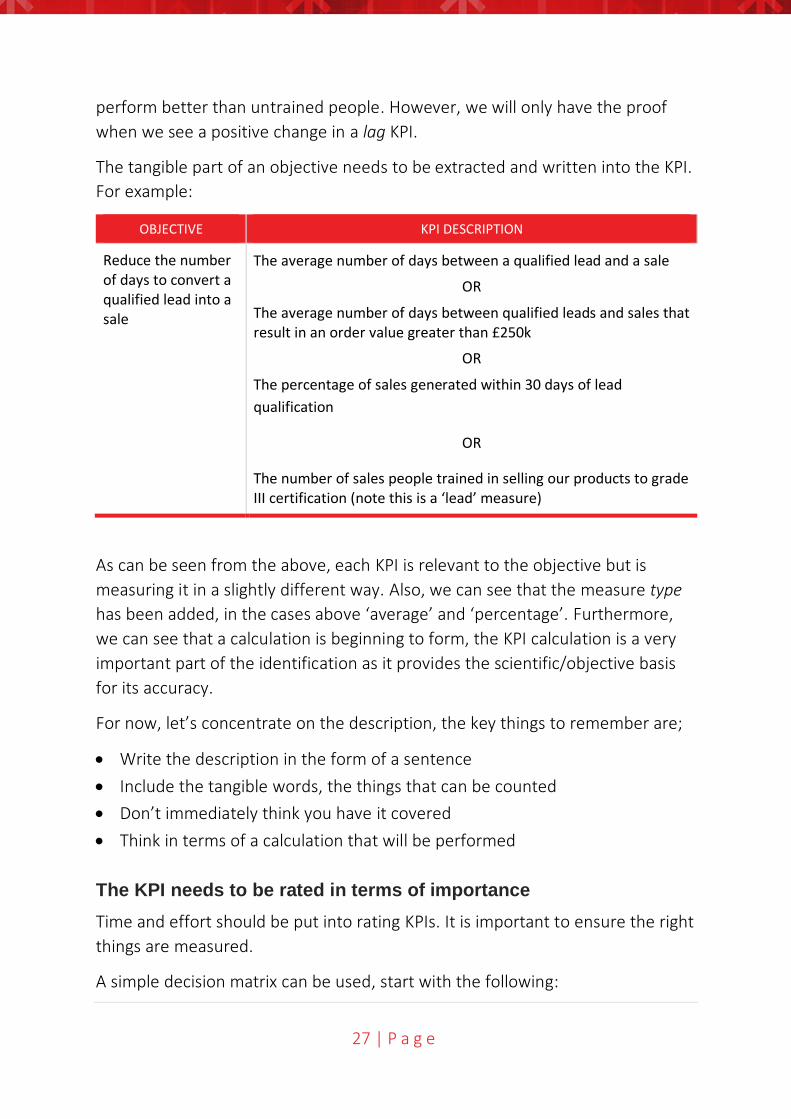
The tangible part of an objective needs to be extracted and written into the KPI.
For example:
OBJECTIVE KPI DESCRIPTION
Reduce the number of days to convert a qualified lead into a sale
The average number of days between a qualified lead and a sale
OR
The average number of days between qualified leads and sales that result in an order value greater than £250k
OR
The percentage of sales generated within 30 days of lead
qualification
OR
The number of sales people trained in selling our products to grade III certification (note this is a ‘lead’ measure)
As can be seen from the above, each KPI is relevant to the objective but is
measuring it in a slightly different way. Also, we can see that the measure type
has been added, in the cases above ‘average’ and ‘percentage’. Furthermore,
we can see that a calculation is beginning to form, the KPI calculation is a very
important part of the identification as it provides the scientific/objective basis
for its accuracy.
For now, let’s concentrate on the description, the key things to remember are;
• Write the description in the form of a sentence
• Include the tangible words, the things that can be counted
• Don’t immediately think you have it covered
• Think in terms of a calculation that will be performed
The KPI needs to be rated in terms of importance
Time and effort should be put into rating KPIs. It is important to ensure the right
things are measured.
A simple decision matrix can be used, start with the following:
28 | P a g e
• How applicable is the KPI to a related business objective?
• What is the relative worth of the KPI, do you really need to know?
• How easily can the data be found to make the measurement?
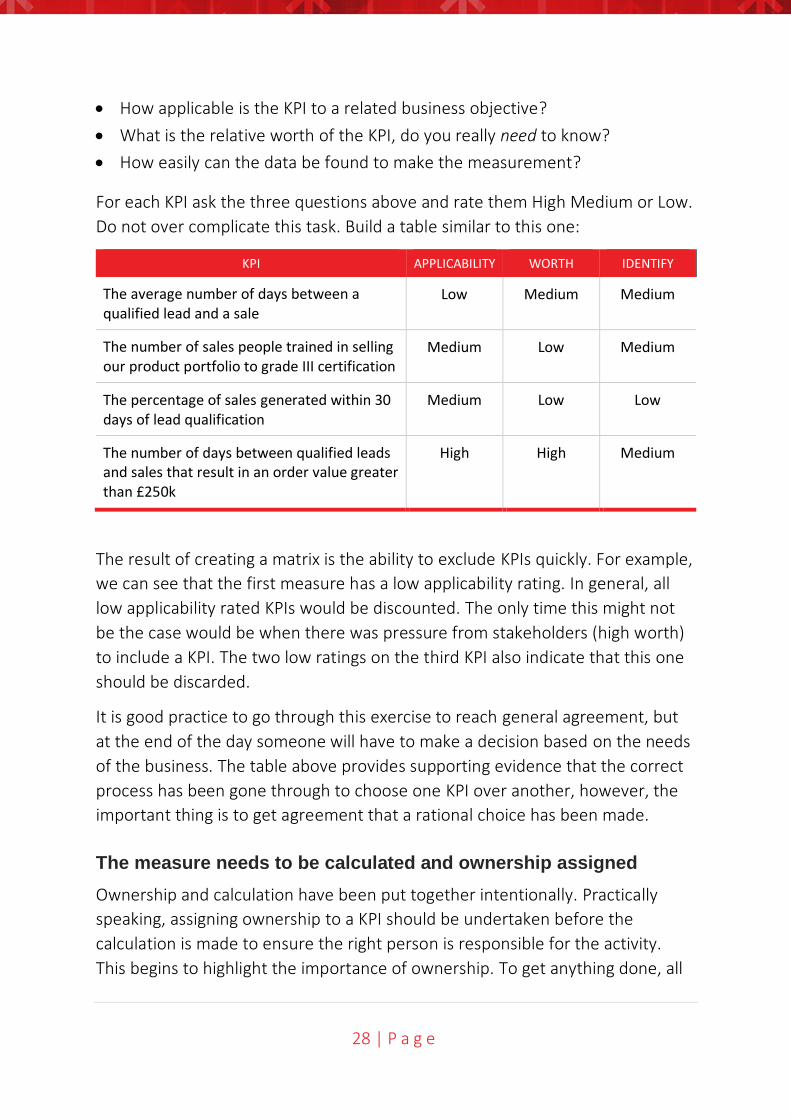
For each KPI ask the three questions above and rate them High Medium or Low.
Do not over complicate this task. Build a table similar to this one:
KPI APPLICABILITY WORTH IDENTIFY
The average number of days between a qualified lead and a sale
Low Medium Medium
The number of sales people trained in selling our product portfolio to grade III certification
Medium Low Medium
The percentage of sales generated within 30 days of lead qualification
Medium Low Low
The number of days between qualified leads and sales that result in an order value greater than £250k
High High Medium
The result of creating a matrix is the ability to exclude KPIs quickly. For example,
we can see that the first measure has a low applicability rating. In general, all
low applicability rated KPIs would be discounted. The only time this might not
be the case would be when there was pressure from stakeholders (high worth)
to include a KPI. The two low ratings on the third KPI also indicate that this one
should be discarded.
It is good practice to go through this exercise to reach general agreement, but
at the end of the day someone will have to make a decision based on the needs
of the business. The table above provides supporting evidence that the correct
process has been gone through to choose one KPI over another, however, the
important thing is to get agreement that a rational choice has been made.
The measure needs to be calculated and ownership assigned
Ownership and calculation have been put together intentionally. Practically
speaking, assigning ownership to a KPI should be undertaken before the
calculation is made to ensure the right person is responsible for the activity.
This begins to highlight the importance of ownership. To get anything done, all
29 | P a g e
objectives and KPIs must have owners and that means an individual not an
entity such as a department.
There are two types of ownership we need to concern ourselves with: owners
and updaters. An owner is the person who takes full responsibility for the KPI.
The updater (who could be the owner as well) is the person who gathers the
required data and updates the KPI when required.
An effective owner should:
• Have some level of control over the KPI
• Own or actively contribute to the KPI’s objective
• Agree to own the KPI (and not just be assigned to it)
• Know where to acquire the measurement data
• Ensure the KPI is updated on time with valid data
An owner who has the above attributes is much more likely to take the job of
managing the KPI seriously.
All too often, KPIs are foisted upon individuals who have no real control or
interest in the KPI itself (or the associated objective) and therefore update the
information begrudgingly, or worse, with incorrect information.
The first job of the owner is to ensure that the KPI is properly described, that
there is agreement on the validity (i.e. the right KPI has been chosen) and that
the KPI calculation (if there is one) can be based on available data.
The KPI description usually provides enough information to give an indication as
to where the data being measured resides. For example, in the KPI Total
revenue generated for consultancy services the data will almost certainly reside
in the company financial system.
For each KPI the following things need to be taken into consideration:
• Description: A sentence to describe the KPI as accurately as possible.
• Label: The short description, used for presentational purposes, 1-4 words.
• Owner: The individual who owns and will drive the KPI (this applies equally
to objectives; indeed, ownership of objectives is more important than
ownership of KPIs as the former drives the latter).
30 | P a g e
• Updater: The individual who is responsible for updating the KPI at pre-
defined times.
• Calculation: A mathematical formula that describes how the data elements
(tangible perceivable items) are combined to provide a number, percentage
or currency (sometimes a yes/no).
• Frequency: How often the KPI is counted and recorded.
• Scope: What should be included or discounted, often a cap or data range.
• Metrics: The data and the sources of data used in the calculation, it is
important to provide a description of the metric items individually to avoid
ambiguity.
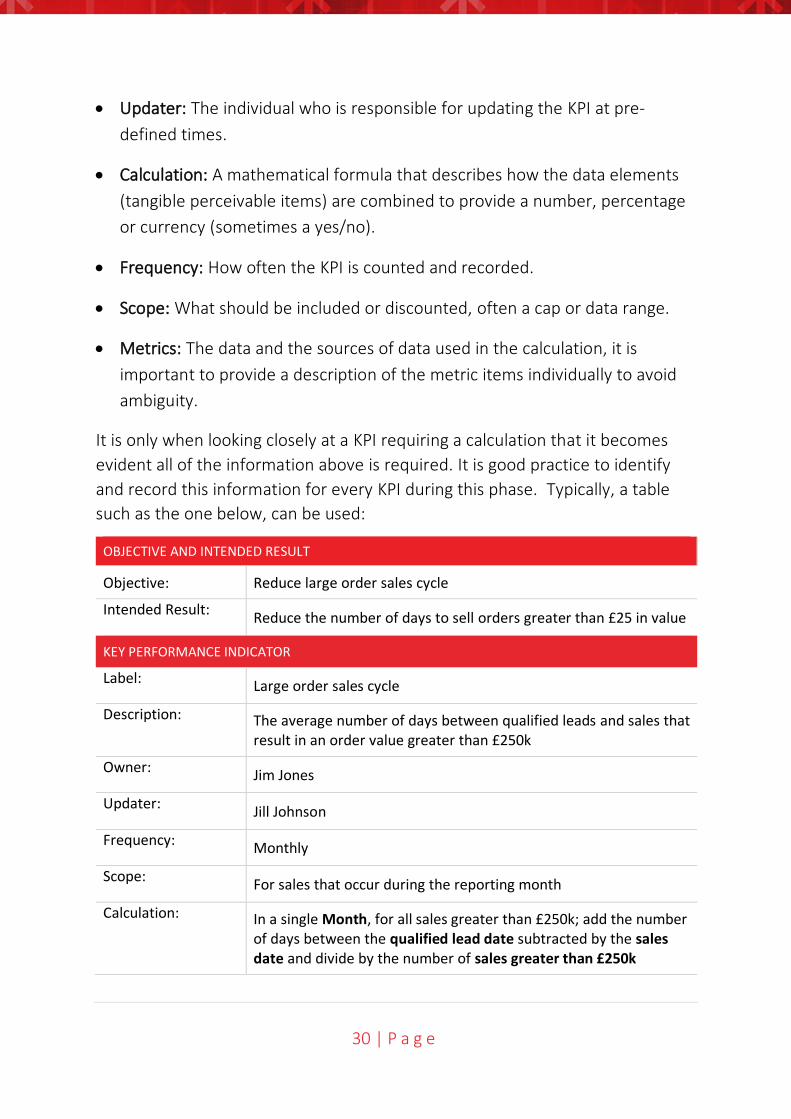
It is only when looking closely at a KPI requiring a calculation that it becomes
evident all of the information above is required. It is good practice to identify
and record this information for every KPI during this phase. Typically, a table
such as the one below, can be used:
OBJECTIVE AND INTENDED RESULT
Objective: Reduce large order sales cycle
Intended Result: Reduce the number of days to sell orders greater than £25 in value
KEY PERFORMANCE INDICATOR
Label: Large order sales cycle
Description: The average number of days between qualified leads and sales that result in an order value greater than £250k
Owner: Jim Jones
Updater: Jill Johnson
Frequency: Monthly
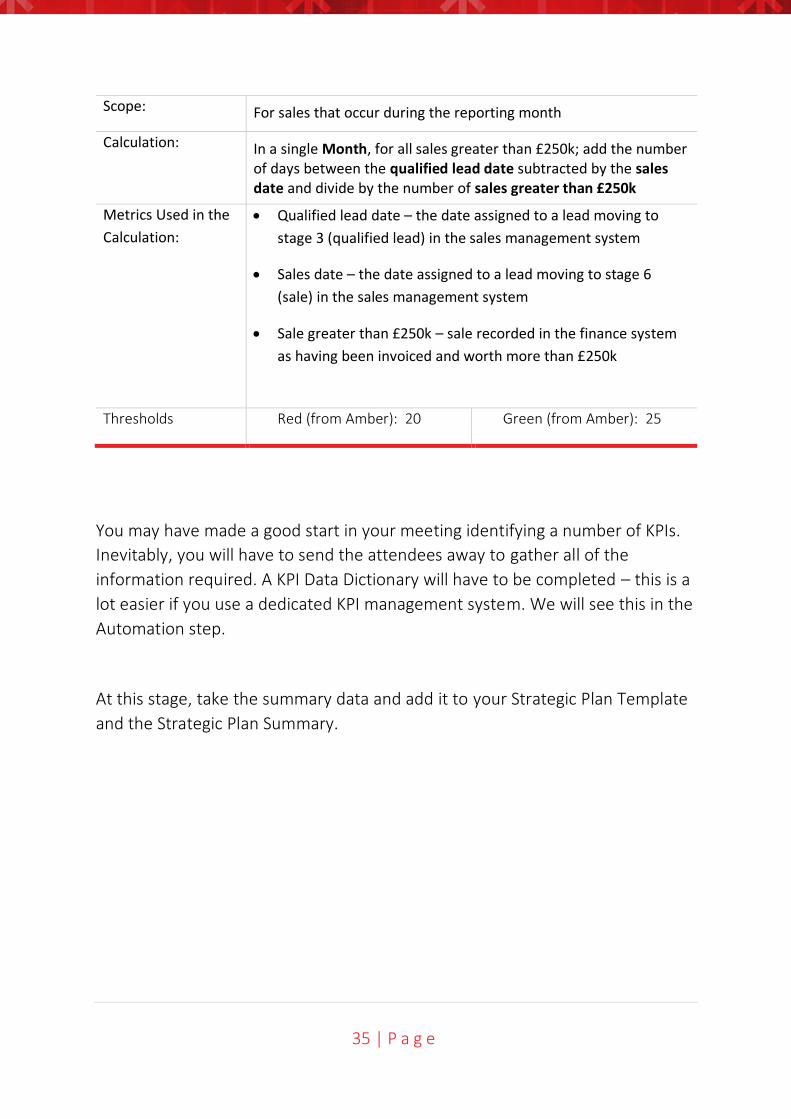
Scope: For sales that occur during the reporting month
Calculation: In a single Month, for all sales greater than £250k; add the number of days between the qualified lead date subtracted by the sales date and divide by the number of sales greater than £250k
31 | P a g e
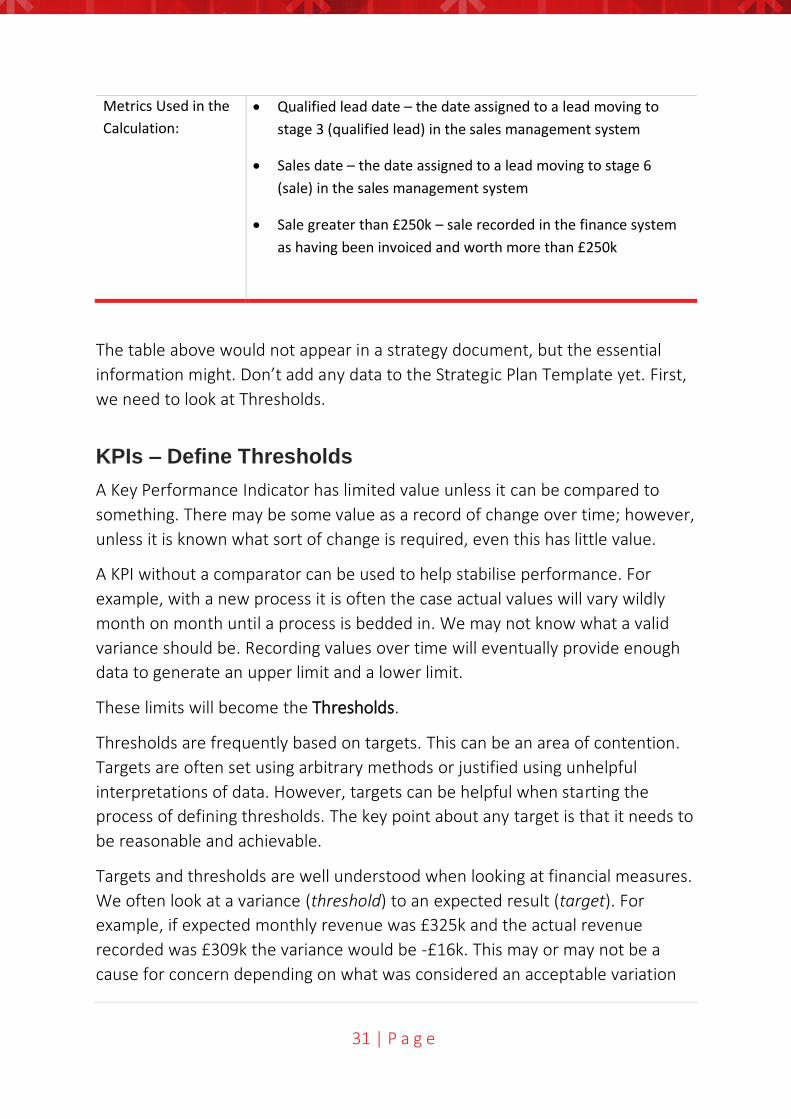
Metrics Used in the
Calculation:
• Qualified lead date – the date assigned to a lead moving to
stage 3 (qualified lead) in the sales management system
• Sales date – the date assigned to a lead moving to stage 6
(sale) in the sales management system
• Sale greater than £250k – sale recorded in the finance system
as having been invoiced and worth more than £250k
The table above would not appear in a strategy document, but the essential
information might. Don’t add any data to the Strategic Plan Template yet. First,
we need to look at Thresholds.
KPIs – Define Thresholds
A Key Performance Indicator has limited value unless it can be compared to
something. There may be some value as a record of change over time; however,
unless it is known what sort of change is required, even this has little value.
A KPI without a comparator can be used to help stabilise performance. For
example, with a new process it is often the case actual values will vary wildly
month on month until a process is bedded in. We may not know what a valid
variance should be. Recording values over time will eventually provide enough
data to generate an upper limit and a lower limit.
These limits will become the Thresholds.
Thresholds are frequently based on targets. This can be an area of contention.
Targets are often set using arbitrary methods or justified using unhelpful
interpretations of data. However, targets can be helpful when starting the
process of defining thresholds. The key point about any target is that it needs to
be reasonable and achievable.
Targets and thresholds are well understood when looking at financial measures.
We often look at a variance (threshold) to an expected result (target). For
example, if expected monthly revenue was £325k and the actual revenue
recorded was £309k the variance would be -£16k. This may or may not be a
cause for concern depending on what was considered an acceptable variation
32 | P a g e
to the target. For a KPI to be useful we need to clearly state both the acceptable
and unacceptable results, the thresholds.
There are several threshold models; for the purpose of illustration we will start
with the most common: Red, Amber, Green (RAG).
Red, Amber, Green Model
In the RAG model there are two threshold points:
• When the KPI should turn Green (from Amber)
• When the KPI should turn Red (from Amber)
There are no hard and fast rules to the meanings attributed to each of the
coloured areas but in general it is as follows:
• Green – an acceptable result, we are on target
• Amber – there may be a problem, we should investigate
• Red – an unacceptable result, there is a potential problem that needs
rectification
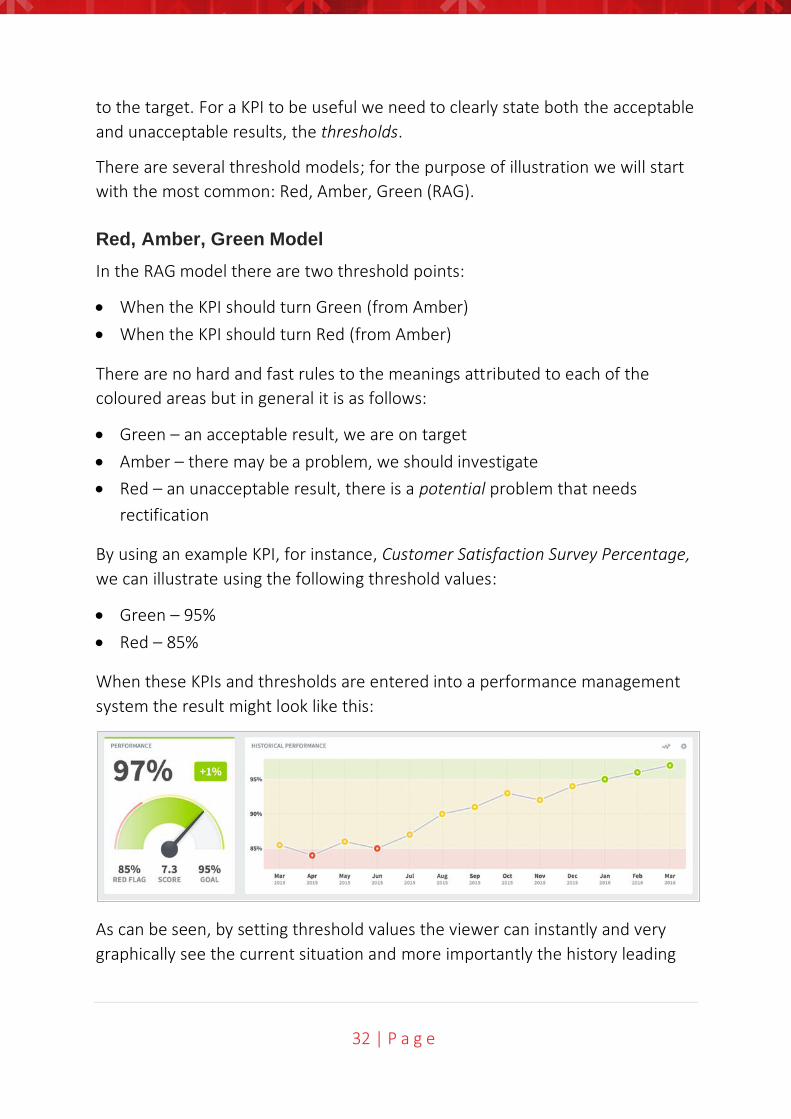
By using an example KPI, for instance, Customer Satisfaction Survey Percentage,
we can illustrate using the following threshold values:
• Green – 95%
• Red – 85%
When these KPIs and thresholds are entered into a performance management
system the result might look like this:
As can be seen, by setting threshold values the viewer can instantly and very
graphically see the current situation and more importantly the history leading
33 | P a g e
to this point. History provides a context to better understand the performance
of the KPI.
Out of the numerous threshold models there are two more that should be
looked at. The first is a simple extension of the RAG model, the second a variant
that accommodates measures that are not linear in nature.
Red, Amber, Green, Blue Model
Occasionally there is a need for a better understanding of an ‘over-achieved’
status. This is particularly true in the area of sales and client management. Sales
bonuses may be based on not only achieving a target but over-achieving it as
well. In this case an extension of the RAG model can be used; the Red, Amber,
Green, Blue variant. For RAGB it is normal to set five thresholds:
• The lowest acceptable result
• When the KPI should turn Red (from Amber)
• When the KPI should turn Green (from Amber)
• When the KPI should turn Blue (from Green)
• The highest acceptable (or capped) result
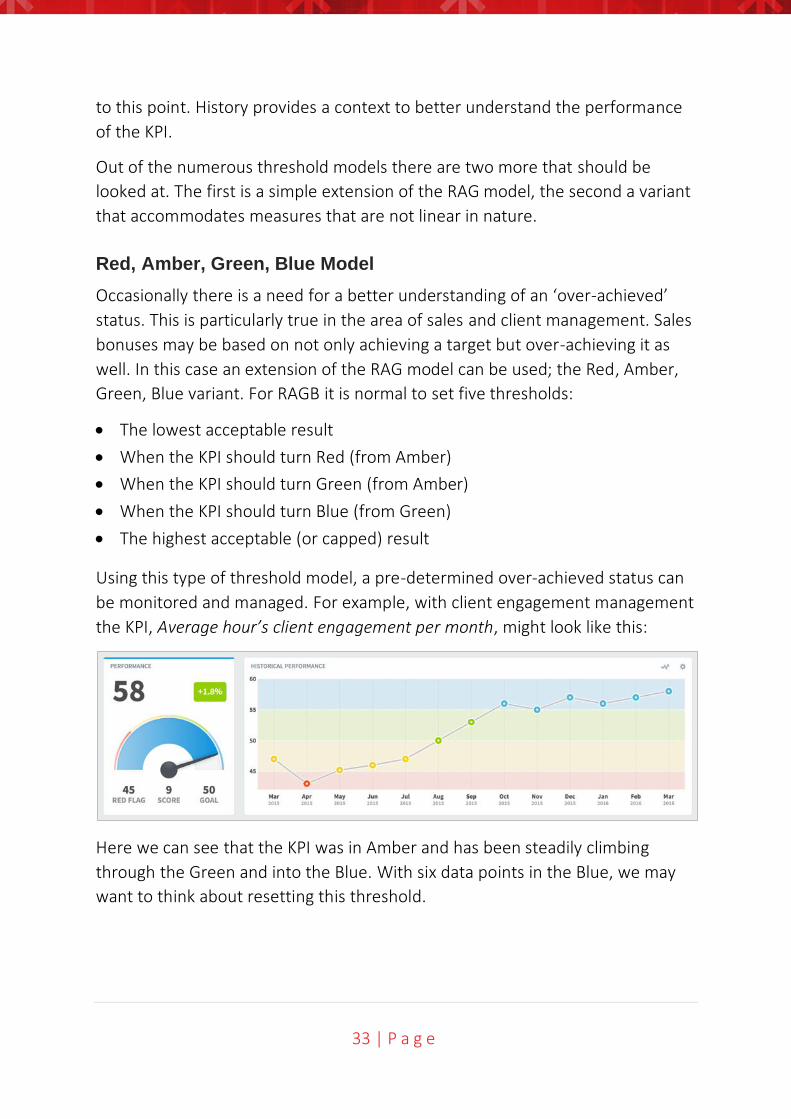
Using this type of threshold model, a pre-determined over-achieved status can
be monitored and managed. For example, with client engagement management
the KPI, Average hour’s client engagement per month, might look like this:
Here we can see that the KPI was in Amber and has been steadily climbing
through the Green and into the Blue. With six data points in the Blue, we may
want to think about resetting this threshold.
34 | P a g e
Red, Green, Red Model
The third threshold example is the stabilise KPI. Occasionally KPIs are deemed
unacceptable if the result is either too high or too low. A good example is a
training budget. In training we want to spend to the budget but not exceed or
go below the budget. In this case we define the best result and then determine
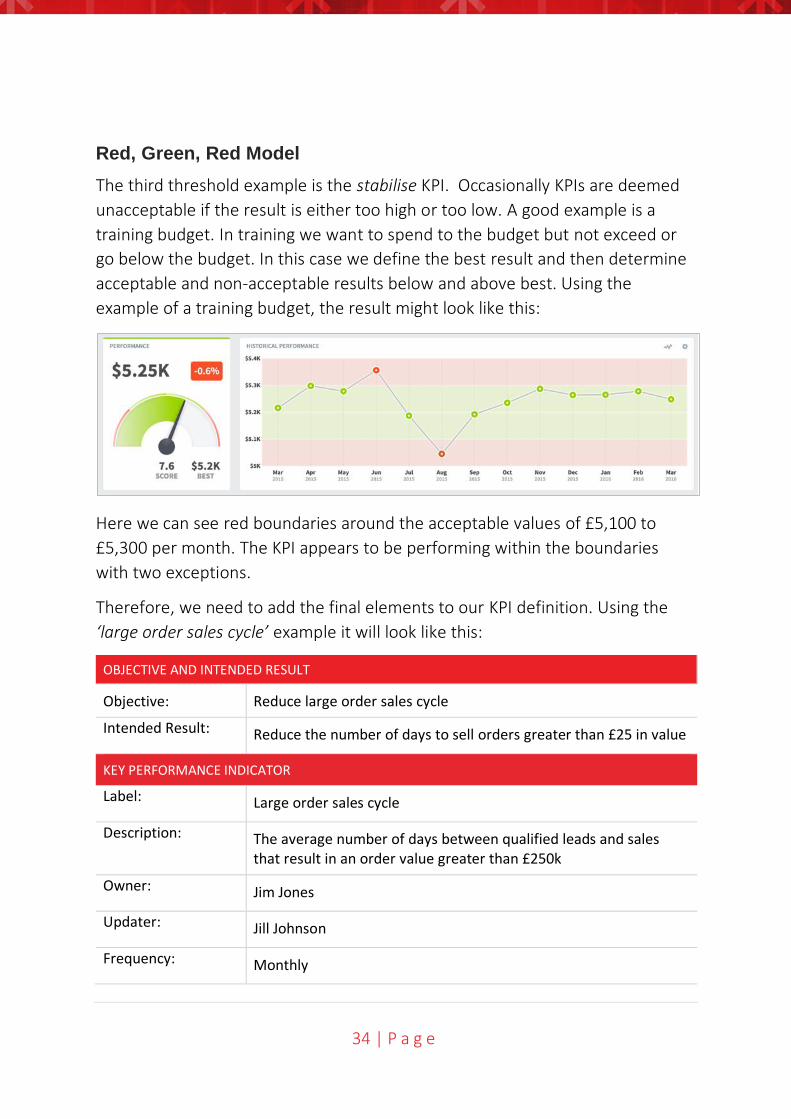
acceptable and non-acceptable results below and above best. Using the
example of a training budget, the result might look like this:
Here we can see red boundaries around the acceptable values of £5,100 to
£5,300 per month. The KPI appears to be performing within the boundaries
with two exceptions.
Therefore, we need to add the final elements to our KPI definition. Using the
‘large order sales cycle’ example it will look like this:
OBJECTIVE AND INTENDED RESULT
Objective: Reduce large order sales cycle
Intended Result: Reduce the number of days to sell orders greater than £25 in value
KEY PERFORMANCE INDICATOR
Label: Large order sales cycle
Description: The average number of days between qualified leads and sales that result in an order value greater than £250k
Owner: Jim Jones
Updater: Jill Johnson
Frequency: Monthly
35 | P a g e
Scope: For sales that occur during the reporting month
Calculation: In a single Month, for all sales greater than £250k; add the number of days between the qualified lead date subtracted by the sales date and divide by the number of sales greater than £250k
Metrics Used in the
Calculation:
• Qualified lead date – the date assigned to a lead moving to
stage 3 (qualified lead) in the sales management system
• Sales date – the date assigned to a lead moving to stage 6
(sale) in the sales management system
• Sale greater than £250k – sale recorded in the finance system
as having been invoiced and worth more than £250k
Thresholds Red (from Amber): 20 Green (from Amber): 25
You may have made a good start in your meeting identifying a number of KPIs.
Inevitably, you will have to send the attendees away to gather all of the
information required. A KPI Data Dictionary will have to be completed – this is a
lot easier if you use a dedicated KPI management system. We will see this in the
Automation step.
At this stage, take the summary data and add it to your Strategic Plan Template
and the Strategic Plan Summary.

36 | P a g e
Step
Fiv
e
37 | P a g e
Step 5 – Projects
People: Senior managers and sign off from an executive manager
Workshop: Workshop to start the activity and assign tasks
Time: Two hours for the workshop, tasks will depend on Initiatives
Taking action comes in two major forms. The first is to put in place a remedial
activity when a problem occurs; the second is to create strategic projects to
promote change.
Remedial Activity
This usually occurs during a regular monthly/quarterly review meeting.
Putting in place a remedial activity or assigning an action is a relatively simple
process and something that organisations do almost every day. The key here is
to ensure that the activity or action is well thought through and not the result of
a knee-jerk reaction due to an anomaly. There are a number of things that
should be taken into account when creating a remedial activity or action:
• It should be associated to a KPI – The only way to confirm an action has had
a positive effect is to observe a positive change in the KPI. Just because an
action has been completed does not mean the situation has been resolved.
• It should not be the result of a short-term anomaly. If a KPI goes into the red,
it does not necessarily mean there is a problem.
• Be sure to assign the action to an individual – tasked individuals feel
responsible and accountable, departments do not.
• Ensure the action is clear – in much the same way as a KPI has to be
described properly, an equal amount of attention has to be given to
describing an action. Be sure to ask the owner of the action if they
understand what is required, when it is required, and who will be involved.
• Actions tend to be short-term activities – If an action turns into a long-term
activity, then it should be more properly described as a strategic project.
38 | P a g e
Strategic Projects
Creating strategic projects will require an initial two-hour workshop. Some
activities (e.g. prioritisation) will take place outside the meeting and usually a
final sign-off meeting will be called at a later date.
Creating and managing strategic projects is a complex process. Strategic
projects cause change. When a business is stagnant or failing, setting a strategy,
building objectives, setting targets and KPIs will be to no avail unless projects
are put in place to evoke change. Strategic projects can cause significant
organisational impact. They must always be associated to one or more strategic
objective.
Generating the list of initiatives
During the process of creating Objectives and KPIs you will have undoubtedly
thought of things that need to be done to fulfil the objectives and cause
improvement in the KPIs. These things may have been parked up to this point.
If you do not have a list, then one has to be created. Go back over your
objectives and KPIs and write down all of the things that you think need to be
done to enable improvement. This should be undertaken as a group exercise
where a wide variety of projects can be identified and discussed.
It is not important at this stage to consider whether a project is valid or whether
there is funding available or resources to allocate. It is important to create a full
and complete list. You may find that buried within the list is a crucial game-
changer.
Developing the selection criteria
By developing a set of selection criteria and applying the criteria to each item
on the list, the list can be reduced dramatically and prioritised.
Consensus has to be reached on the most important criteria. This should not be
overly complex, and the criteria should be few in number, ideally around five or
six criteria items. Typical criteria might be:
• Implementation cost
• Operational cost
• Strategic benefit
• Time to implement
39 | P a g e
• Return on investment
• Objectives impacted
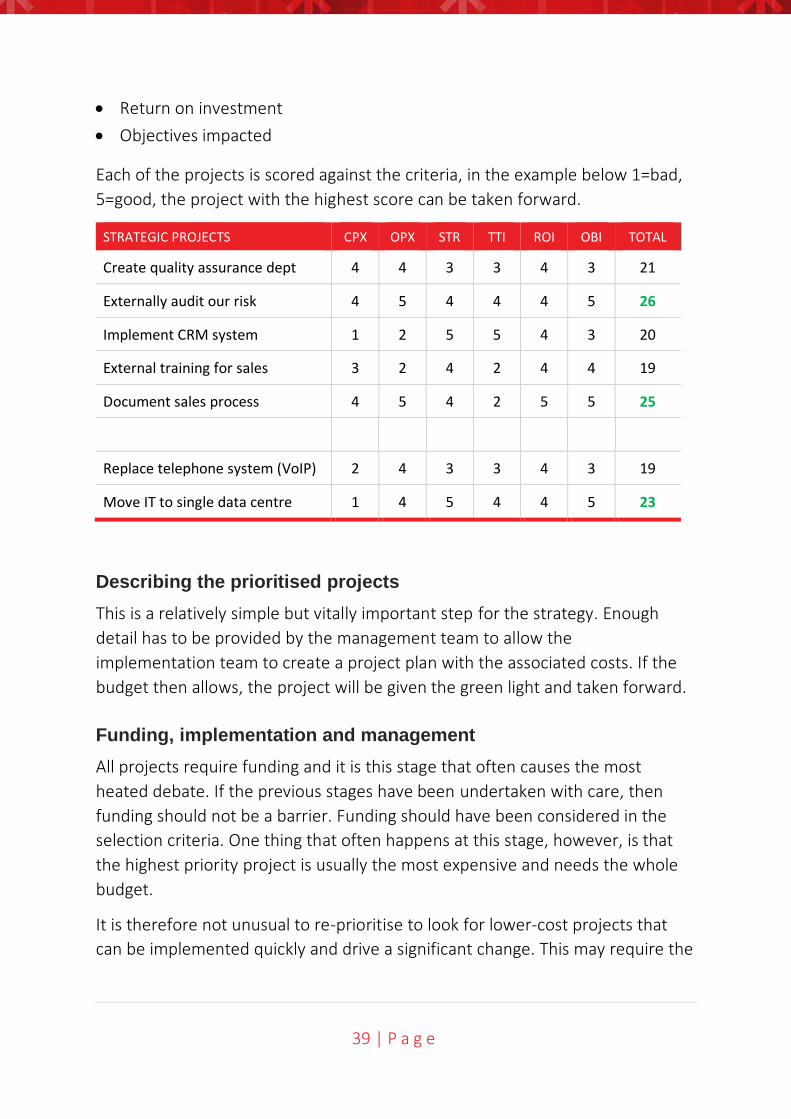
Each of the projects is scored against the criteria, in the example below 1=bad,
5=good, the project with the highest score can be taken forward.
STRATEGIC PROJECTS CPX OPX STR TTI ROI OBI TOTAL
Create quality assurance dept 4 4 3 3 4 3 21
Externally audit our risk 4 5 4 4 4 5 26
Implement CRM system 1 2 5 5 4 3 20
External training for sales 3 2 4 2 4 4 19
Document sales process 4 5 4 2 5 5 25
Replace telephone system (VoIP) 2 4 3 3 4 3 19
Move IT to single data centre 1 4 5 4 4 5 23
Describing the prioritised projects
This is a relatively simple but vitally important step for the strategy. Enough
detail has to be provided by the management team to allow the
implementation team to create a project plan with the associated costs. If the
budget then allows, the project will be given the green light and taken forward.
Funding, implementation and management
All projects require funding and it is this stage that often causes the most
heated debate. If the previous stages have been undertaken with care, then
funding should not be a barrier. Funding should have been considered in the
selection criteria. One thing that often happens at this stage, however, is that
the highest priority project is usually the most expensive and needs the whole
budget.
It is therefore not unusual to re-prioritise to look for lower-cost projects that
can be implemented quickly and drive a significant change. This may require the
40 | P a g e
team to look at ways of staging or delaying the highest priority project to
release funds for lower priority projects.
When the funding issues have been resolved, then the implementation can
begin. A project manager must be assigned, this is crucial! Then a project plan
can be created and implemented. Projects are usually managed outside the
context of the strategy but linked back through strategic objectives.
Strategic projects provide the means to achieve strategic objectives. This
connection has to be maintained. Strategic projects are useless in isolation. To
re-iterate, just because a project has been completed, does not necessarily
mean an improvement has been made, it just means the project is complete. If
a project is connected to an improvement objective, then we can measure
whether or not an impact has been made. The project becomes the engine that
drives the strategy.
The output for the strategy document should be relatively simple containing a
brief description of the projects and the associated timeframes and costs.
At this stage you can add your strategic projects to the Strategic Plan Template
and the Strategic Plan Summary.

41 | P a g e
Step
Six
42 | P a g e
Step 6 - Communication
People: Communications team, managers, executive (for kick-off)
Workshop: One kick-off, multiple meetings rather than workshops
Time: depending on organisation size. Usually one kick-off followed by several
meeting and other communication mediums
Let’s turn our attention to communication. Once your hard work has been
signed off and agreed by all stakeholders, how do you successfully
communicate your strategy?
Allocate owners
Accountability is key to strategic success. With this in mind, be sure to allocate
your strategic objectives, measures and tasks to individuals within your
organisation, rather than departments prior to any communications.
Plan your communications rollout
It's all too easy to focus perfectly on strategy creation, and then fail at the
communication rollout stage. Every individual in your organisation needs to
know:
• what you are trying to achieve
• what their role is, and;
• how their delivery performance against defined objectives will be measured
(often including details of performance-related pay).
The art of communicating strategy effectively lies in providing communications
in a timely fashion across a range of appropriate channels.
A good starting point is to let your employees and stakeholders know that the
business strategy is in development at an early stage and explain that planned
communications will be delivered in a variety of ways.
This ensures that people are kept up to date and engaged throughout, and in a
manner that suits their individual learning style and preferences. For example,
field-based operational workers may not read email newsletters, but they may
43 | P a g e
find a face-to-face team briefing more useful, with the chance to ask questions
as part of a daily huddle.
Define your channels
There are plenty of ways to do this. For example:
• Online methods - your company intranet, email newsletters and bulletins,
internal corporate social media accounts, digital TV screens, CEO blogs,
presentations.
• Offline methods - wall-boards, kick-off meetings delivered in a cascade
process, scheduled quarterly reviews, individual 1:1s, lunch-time feedback
sessions or 'town halls' where employees can ask questions, and larger
corporate events such as staff conferences, where a solid half day can be
devoted to the new strategy and include various breakout and focus
sessions.
Identify your audience
Each business will have different audiences who need different messages. For
example, there will be senior managers, junior managers, employees,
stakeholders, partners and so forth. Each will have different degrees of interest
and involvement, so target their messages accordingly.
Think about your content
Use the support of your internal communications resource to craft key
messages that can be shared across all employee groups. It is important to
create engaging content that is framed around key messages, with a prepared
FAQ to share and add to as new questions arise. Create a mix of content, with
positioning text and figures, and create resources that employees can use to
find out more. These might include regular performance dashboards.
Use your people
The organisation's senior team must take a lead and visible role in
communicating strategy. Storytelling helps to bring it to life, and senior figures
will be best placed to give ready answers on their areas of functional
responsibility. Make sure your senior leaders are ready to engage on a face-to-
44 | P a g e
face basis with employees as they communicate the strategy. They'll need to
share this sense of purpose, passion and excitement in person to bring it to life.
Similarly, train and support your team leaders and functional managers in their
communication responsibilities, which could include team briefings and the
delivery of structured presentations as part of a communications cascade.
Use your tools
Complex modern organisations deal with vast reams of data - often from myriad
sources. It's vital to use a software product such as QuickScore to monitor your
strategic objectives and KPIs, and to make the production of strategic data as
automated, seamless and intelligent as possible. Strategic planning software can
produce rich and intuitive dashboards and presentations, which your managers
and employees can easily read and understand. This makes it far easier to
create communications packs and resources which will hit the mark!
By using a dedicated software system, you can create reports for all levels and
departments in your organisation that show the strategy's progress, and which
flag up focus areas. These add weight and substance to your communications
activities and help to focus hearts and minds.
Be consistent with your communication and deliver on it. If you promise a
Friday afternoon update or Q&A with the CEO, make sure it happens.
• Seek feedback from your audience and look for ways to improve.
• Don't always be formal or 'stuck on numbers'; the strategy needs to get
emotional buy-in to capture hearts and minds.
• Be ready to tweak your approach as you learn from your feedback.
• Encourage natural storytellers to come forward and get involved in
communications within their teams. For example, local 'champions' could
give structured team briefs (with resources provided centrally) as part of
their own development and personal objectives. Think creatively!

45 | P a g e
Step
Sev
en
46 | P a g e
Step 7 – Automation
People: Administrator to set up, occasionally IT group if required
Workshop: Might be needed if software selection is required
Time: Dedicated software is usually easy to set up and use, but will require
some familiarisation effort, maybe a day or two for the administrator
Setting up a system
If you are serious about implementing your strategy effectively, then you need
to build your vision, purpose, priorities, objectives, KPIs, targets and projects
into a software system. Do not be fooled into thinking this can be achieved with
spreadsheets and presentations. If that is what you intend to do, then you need
a strategic objective called ‘Improve our Strategic Process!”
Keeping control of your strategy can be a daunting task so you need to use a
tool that will maintain the relationships between every element of your work. If
you have not done so already, then select an appropriate software package. We
recommend QuickScore. If you need help in selecting a package then look at our
Strategy Management Software Guide which provides some useful selection
criteria and a template Request for Proposal (RFP).
Using a System
Once you have set up a software system and added your strategic elements,
you can then monitor progress by updating your KPIs and strategic projects.
Over time you will have enough historical data to interpret the results. There
are two phases to this activity, first to create a set of dashboards and reports
from the data and second to interpret the results.
The purpose of reporting is to provide enough detail to enable an organisation
to be managed effectively. The advantage of using an automated system is the
reports are updated when any KPI value is changed. Care needs to be taken
when designing a dashboard or report, the key question to be asked is:
• Who is the audience for the dashboard or report?
47 | P a g e
Dashboards
All data visualisation has to start with the audience in mind. A chief executive
will want a very different view of a business as compared to an operations
manager or a financial director. One-size will never fit all in dashboard creation.
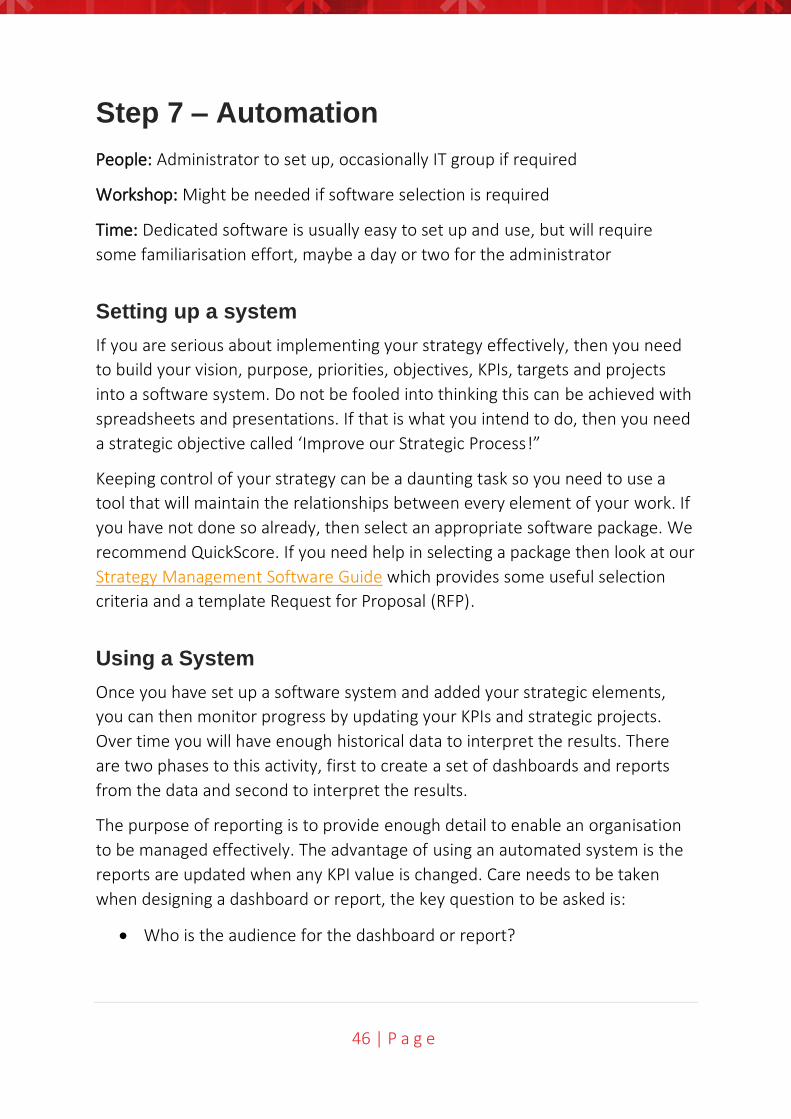
Typically, a top-level dashboard will provide an overview or at-a-glance view of
the business like the one below:
48 | P a g e
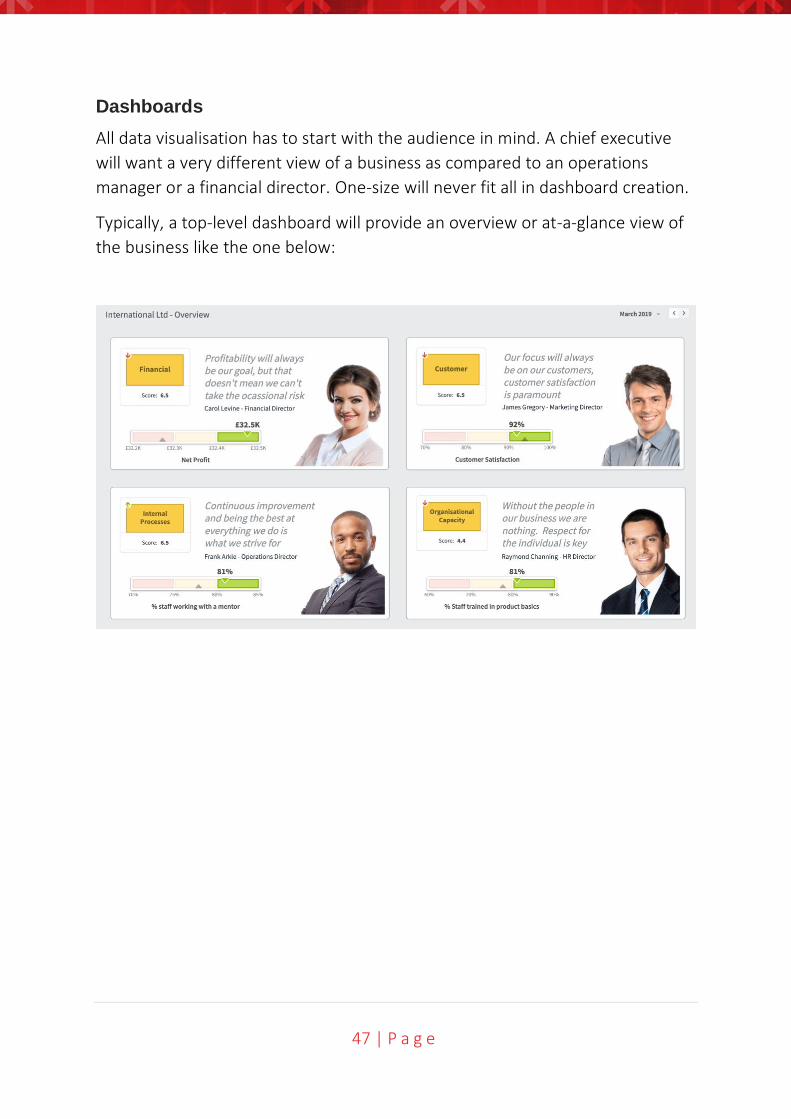
The example below is a strategy map using the balanced scorecard approach:
We can immediately see through the ‘RAG’ colours the current status. The
elements can be clicked on to drill-down into lower level objectives and KPIs.
Please note: a chart like this should never be used in isolation!
49 | P a g e
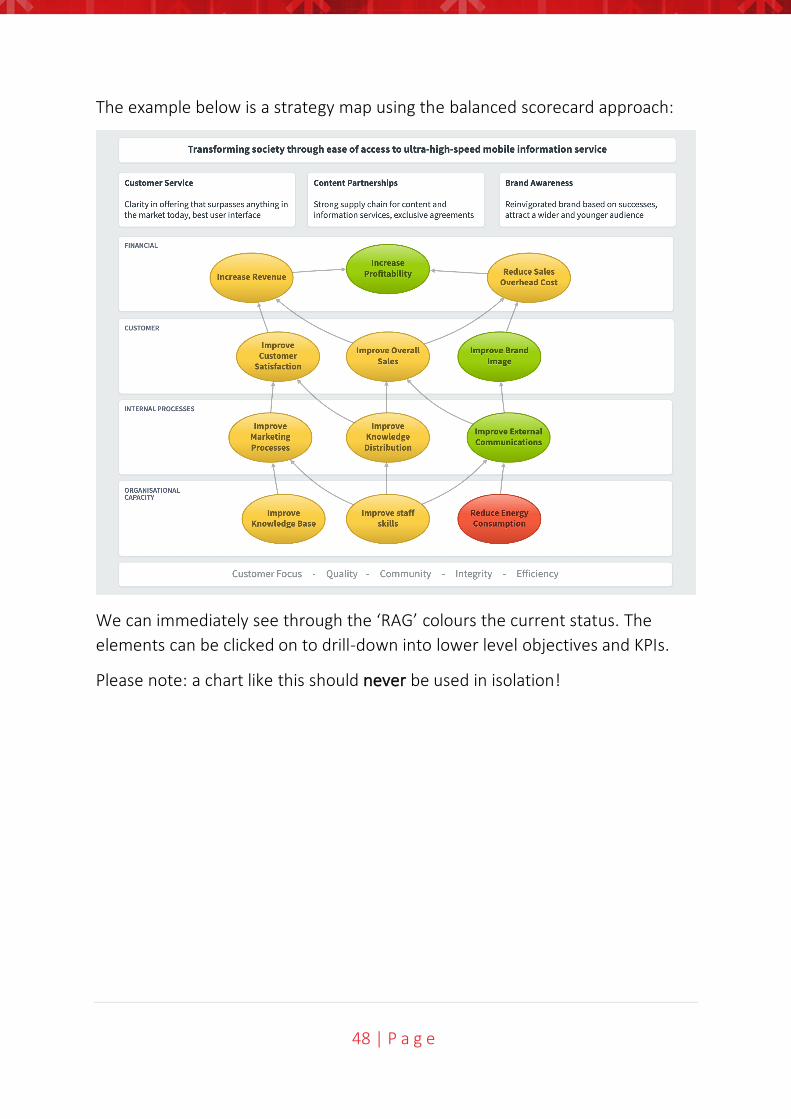
A dashboard might be aimed at a sales and marketing community like this:
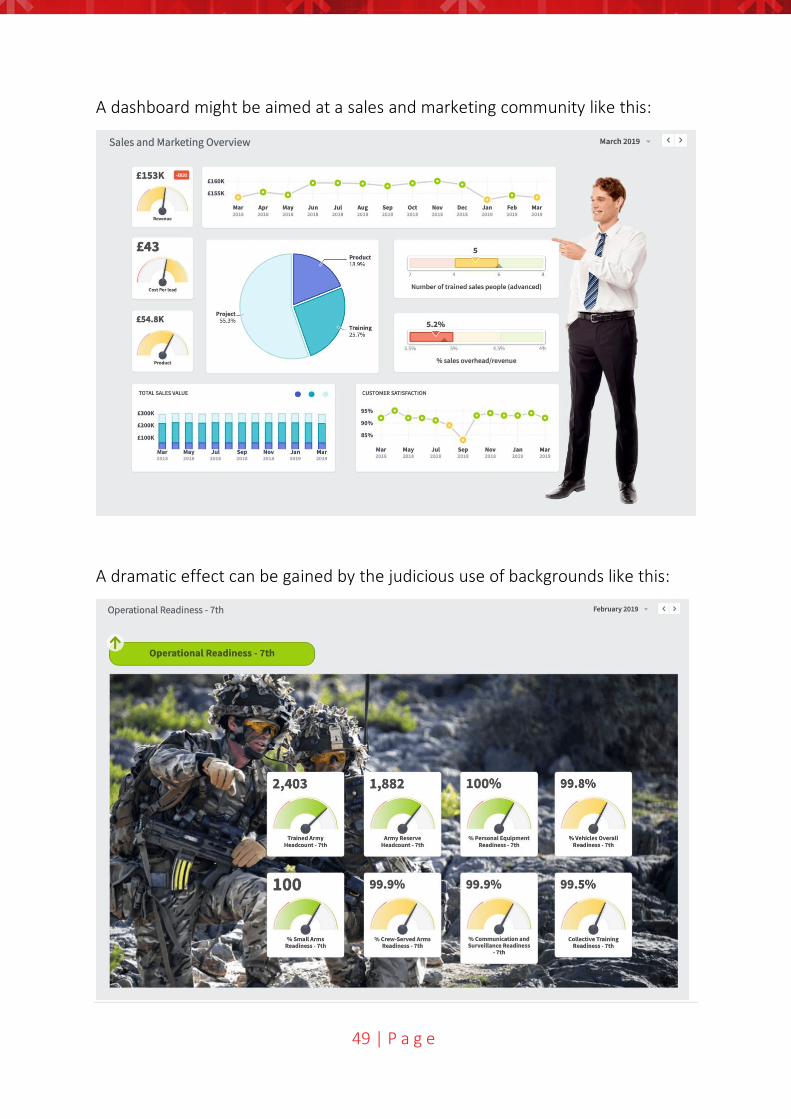
A dramatic effect can be gained by the judicious use of backgrounds like this:
50 | P a g e
Whoever or whatever a dashboard is to be used for, consider the following
questions during the creation phase:
• Is the dashboard suited to the audience it is being built for?
• Does the dashboard have an intuitive user interface and navigation?
• When providing drill-down, does it provide enough additional information?
• Have the right access permissions been set up?
• Is the balance between current and historical data correct?
• Visually, do the important items stand out?
Finally, for dashboard creation; don’t get carried away with the technology or a
colourful chart, simplicity is the best way to get over a complex message.
Reports
To clarify, for the purpose of this document, reports are classified specifically as
row and column representations of data.
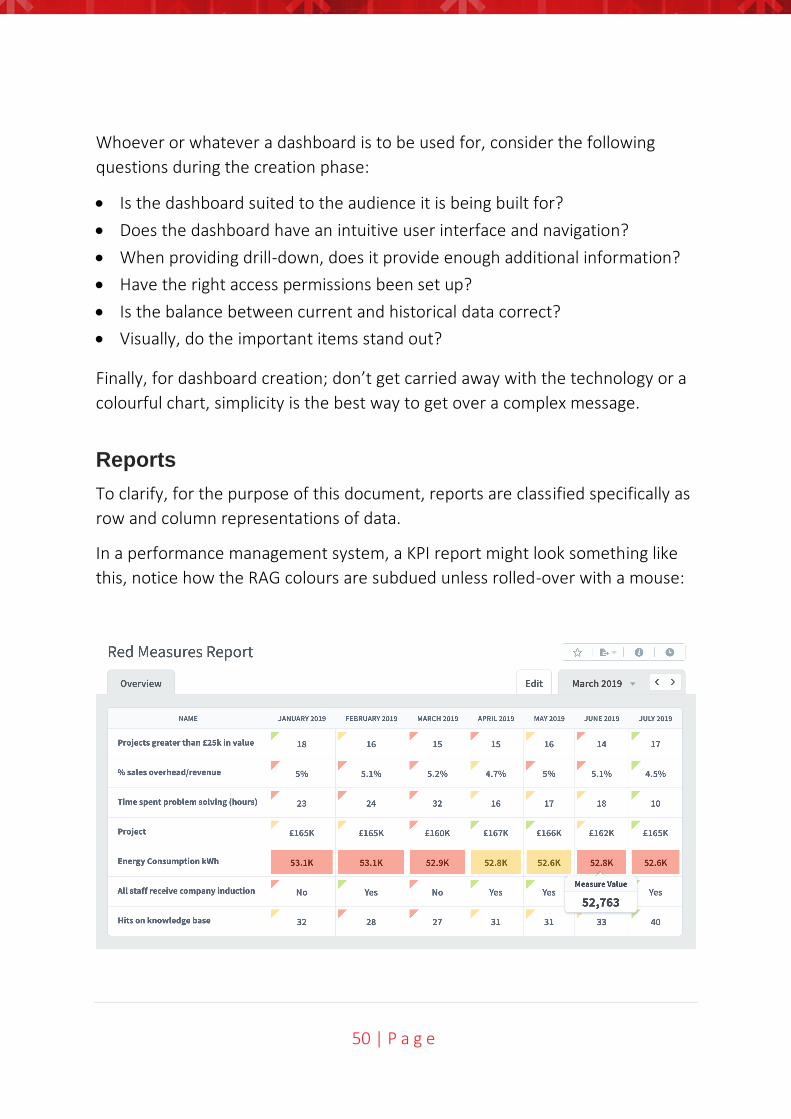
In a performance management system, a KPI report might look something like
this, notice how the RAG colours are subdued unless rolled-over with a mouse:
51 | P a g e
This is very similar to a spreadsheet view. Typically, this type of report will be
used during a drill-down activity when more information on a KPI is required.
Interpreting Results
Earlier we spent time looking at thresholds. One of the unfortunate by-products
of defining thresholds is to reinforce a knee-jerk reaction when interpreting
data. For example, when applying colour coding, as in the report above, the eye
is immediately drawn to the red values. Where it might be worthwhile exploring
strings of red instances, it is rarely worthwhile spending time on single red
instance; it will never provide the whole story. We may have taken a step
forward but cannot simply rely on a RAG status to enable decision making.
Why? Because businesses are complex entities, no single or identifiable cause
can hold the key to a solution. Just because a KPI is 5% down on last month’s
performance or is different to last year’s performance or has gone below an
artificially imposed threshold, does not automatically mean there is a problem.
Using thresholds only gives us what we need to undertake a point analysis of a
KPI. Simply put, if the KPI moves from an acceptable position (green) towards
an unacceptable position (red) then we might need to start a line of enquiry.
You may consider the first line of enquiry is to ask the owner of the measure for
an explanation. This does seem a reasonable course of action to take. However,
asking an owner will almost certainly, at best, result in a defensive response
and, at worst, cause tampering with the KPI in an attempt to remove the
problem. Tampering is an issue in business where focus is placed on individual
performance rather than on business performance. A much better course of
action is to look at patterns in the data and not at the individuals responsible for
the data.
Clearly there will be times when the owners of the data need to be approached,
especially when exploring anomalies. This should be done with care and
sensitivity, focusing on the data. Again, another good reason to look at patterns,
at least that way a conversation will be more objective.
In business it is rare that poor performance in one area will be isolated; there
are usually multiple contributing factors. Therefore, a pattern will emerge from
the data. When poor performance is identified in one KPI, it is important to look
for patterns across related KPIs.
52 | P a g e
All situations will be different; here is some guidance to be used when
interpreting the results provided by your KPIs:
• Do not rely on point analysis, business is too complex for that
• Check that the KPI is stable and predictable
• Always look at related KPIs
• Train yourself to look at patterns within KPIs and across multiple KPIs
• Be prepared for more questions rather than answers
• Drill down into source data for more information
• Look at long-term and short-term trends (short = 6 months, not less)
• Talk to the owner of the KPI (using data, not emotion)
• The key is to see the difference between normal variation and abnormal
• Look for ways to change and not control outcomes
The last item on the list loops back to tasks and projects. When it is clear a KPI
(or and objective) is moving in the wrong direction then action needs to be
taken. The action needs to be linked to the KPI (or objective) and progress
monitored and managed over time to correct or improve the situation.

53 | P a g e
An
d F
inal
ly
54 | P a g e
And Finally
Strategy is an on-going activity. It is not something that happens once a year at
an executive off-site meeting and then forgotten. To ensure any strategy
succeeds it needs to be embedded into day to day, week to week, month to
month business processes. The seven steps above will ensure this happens.
Here are a few tips to consider:
• Take some time to reflect on the strategy you have created in steps one to
five before you communicate it. Steps one to five can be completed in a
week or two and will generate a lot of enthusiasm. This needs to be
tempered with business reality.
• Look at how you can integrate your strategic output into your operational
business processes. Taking 10 minutes in a monthly management review to
look at two or three dashboards is an easy thing to implement.
• Use your Strategic Plan Summary as a major part of your communication.
We have seen organisations print them as posters to display in offices and
canteens. At least add a strategy section to your intranet.
• Seriously consider investing in a dedicated strategy management tool like
QuickScore. Spreadsheets and presentations will not cut it in todays
connected world.
• You should be measuring your strategic outputs (KPIs and Projects) every
month, but you should review the strategic objectives every six months to
ensure they are still valid. We recommend an annual full review and a six-
monthly check-up review.
We wish you the very best with your strategy. If you have enjoyed reading this
document and think that Intrafocus may be able to help you, then please get in
touch. We run various strategic classes and workshops and we are always
willing to help if you have any questions.

55 | P a g e