Embed Size (px)
Citation preview

Intrahousehold Power: the Role of Women’s Share of Asset and Social Capital on Household Food and Nonfood Expenditures
Evita Hanie Pangaribowo *)
Department of Economic and Technological Change
Center for Development Research University of Bonn
Paper prepared for presentation at the Shorter Papers Session of 86th Annual Conference of the Agricultural Economics Society, University of
Warwick, United Kingdom 16 - 18 April 2012
Copyright 2012 by [Evita Hanie Pangaribowo]. All rights reserved. Readers may make verbatim copies of this document for non-commercial purposes by any means, provided that this copyright notice appears on all such copies.
*Walter-Flex Strasse 3 Bonn D-53113, Germany, email: [email protected] The author would like to acknowledge the travel grant from Southeast Asian Regional Center for Graduate Study and Research in Agriculture (SEARCA) that has made the presentation at the 86th AES Annual Conference possible.

2
Intrahousehold Power: the Role of Women’s Share of Asset and Social Capital on Household Food and Nonfood Expenditures
Abstract
Using the Indonesian setting with its cultural heterogeneity, this paper examines women’s bargaining power in the distribution of household expenditures. Women’s share of assets and participation in community-based organizations and development in the village is used to approach bargaining power. This study employs the Indonesian longitudinal dataset from the Indonesia Family Life Survey (IFLS). The results show that women’s share of assets has negative effect on adult goods expenditure. This finding confirms that women’s share of asset explicitly increase women autonomy not to allocate the budget share on adult goods expenditure which is identical to male domination. Women’s share of assets also has positive and substantial effect on richer nutrients expenditure such as meat and fish and dairy products. It is also found that women participation in the community-based organization in the village has negative and significant effect on budget share of staple food and adult goods expenditure. This finding embraces the importance of women’s power in the household particularly in terms of distribution of household expenditures to the spending that increase the welfare of the household.
Keywords intrahousehold power, women’s asset, social capital, expenditures JEL Code D13
3
1. Introduction
Gender considerations must play a role in development and poverty reduction agendas. Gender disparities are the result of social constructions regarding the relationships between men and women (Oakley 1972). In many cases traditional social constructs attach certain stigmas and expectations on women that lead to social inequality based on gender (Tresemer 1975). The 1995 UN Conference in Beijing raised awareness of the need to eliminate gender-based inequality (El-Bushra 2000), which is also one of Millennium Development Goals (Kabeer 2005, Fukuda-Parr 2010). Reducing the gender gap and promoting maternal health are among the main global objectives. Accordingly, a growing amount of literature has explored the role and contribution of women in promoting social welfare and it is recognized that women’s preferences and responsibility for decision making within households influence economic outcomes (Doss 2005).
In economics, intra-household relationships have been modeled and examined in a great number of empirical studies. Previously, a household was treated as a single decision making unit (unitary model). Current debates on intra-household resource allocation highlight how the distribution of resources within a household affects household welfare. The collective model embraces the concept that individuals within a household have different preferences. This issue is an important consideration for public policy purposes. For instance, if a government wants a social welfare program to target specific individuals based on age or gender rather than entire households, the outcome of the program will depend on how well it is designed to reach those individuals. Without considering the intra-household distributional issues such as resource allocation, policies might not achieve the desired effects. To make policies more effective at reaching the target beneficiaries, understanding the factors that determine resource allocation is important.
In the case of Indonesia, gender issues are associated with a multitude of cultural aspects and institutional contexts. Culture determines the proper conduct or actions in a person's social life. Thus, traditional law and local customs influence living arrangements and patterns of intra-household decision making. Some ethnic groups in Indonesia, such as the Batak in North Sumatra, the Javanese in Java, and the Bugis in South Sulawesi, have patriarchal cultures, whereas the Minangkabau in West Sumatra has a matriarchal culture. In modern Indonesia, traditional laws and customs are less relevant compared to previous decades, due to inter-cultural mixing and intra-ethnic relationships (Schefold 1998). Using the Indonesian setting with its cultural heterogeneity, this paper examines women’s roles in the distribution of household expenditures. To describe the importance of women in the household, two proxies were used: women’s shares of household assets and women’s social capital. This study contributes to the growing literature of the resource allocation model, particularly in the use of women’s social capital as a measure of women’s importance in the household.
2. Method
2. 1 Data and Variables
This study analyzed data from a longitudinal dataset provided by the Indonesia Family Life Survey (IFLS). Three rounds of the IFLS (1997, 2000, and 2007) were used for these analyses. Most of the recent literature on intra-household resource allocation has used either men’s or women’s nonlabor income as a proxy of authority to evaluate whether these

4
measures are associated with household expenditure choices (Thomas, 1993; Thomas et al., 1999). To gauge the status of women in the household, asset shares and participation in community activities were used in these analyses. IFLS datasets include information on various types of assets that are associated with family homes and businesses. The data on nonbusiness assets are part of a separate IFLS module. The dataset covers a wide range of assets including; savings, loans, jewelry, household durables, and semi-durables (Frankenberg et al., 2003; Strauss et al. 2009). These assets were classified into two groups: liquid assets and nonliquid assets. We defined liquid assets as financial assets that may be easily transformed into cash such as livestock, household appliances, savings, and jewelry. Nonliquid assets included the house occupied by each household and land parcels (Haveman 2005, Dercon and Christiansen 2010).
This study uses the concept of social capital from Bourdieu (1977) and Coleman (1988) to measure women’s social capital. Those efforts defined social capital as the ability of an actor to gain benefits from participation or membership in social networks or other social organizations. Fortunately, the IFLS dataset provides thorough information on citizen participation in community-based organizations and social development efforts. This information is compiled in a citizen-participation module that includes data on household members aged 15 years and older. Respondents were asked about their knowledge of, and participation in, a list of organizations during the preceding 12 months. Participation in some organizations is limited to women, such as the PKK (Pemberdayaan Kesejahteraan Keluarga [Family Welfare Empowerment Movement]) and the POSYANDU (Pos Pelayanan Terpadu [Integrated Community Health Post]). The longitudinal nature of the dataset allowed us to observe long-term characteristics of respondents who have actively participated in community organizations.
The dependent variables examined in this analysis were food and nonfood expenditures. Food expenditures were divided into six groups: staple foods, vegetables and fruit, meat and fish, dairy products, oils, and adult goods. Food expenditure responses were based on one-week recall prior to interviews. Nonfood expenditures consisted of other purchased goods and services such as clothing, medical needs, housing, taxes, and education. All expenditures are presented in terms of budget share of total expenditures along with descriptive statistics in the appendix.
2.2 Operational Definition of Other Control Variables
The main independent variable investigated in this analysis was women’s role in decision-making. Other control variables included household characteristics such as education, household size, and geographical aspects. Since the unit of this analysis effort was at the household-level, only households including both a husband and wife were included in the analysis. Households described as having female heads were not included in the sample, since they were likely to be single mothers or else situations that would not have contributed to our effort to reveal intra-household power dynamics. The education of both the household head and spouse were measured in years of education. Household size was broken down into the number of household members below 6 years of age, school age children (6-14 years), male and female household members aged 15-59, and all household members aged 60 years and over. Households were described as either rural or urban. The main activity of the household head and income levels were also included in the model.

5
2.3 Empirical Model Specification
To examine women’s control over selected food and nonfood expenditure decisions in the demand function, this study expands the method used by Doss (2005) and conceptualizes as follows:
where: wit is food and nonfood expenditures, Afit is the share of women’s household assets Edfit is the women’s level of education, Z is a set of household characteristics, εit is the error term.
A household’s outcome is measured by food and nonfood expenditures. This study focuses on assets as important and quantifiable resources of women. Assets are used instead of labor income in order to avoid the problem of income endogeneity. Since household expenditures are affected by other factors, socio-economic variables are included in the model to account for household preferences (Doss, 2005). Those variables include the number of household members, the level of education of the household head and their spouse, dummy variables indicating the type of the household (farm or nonfarm), the household head’s main activity (working or not working), as well as the location (urban or rural). To examine the influence of women’s social capital on the distribution of household expenditures, similar equations were utilized. The model was used to examine the effect of women’s participation in three types of village activities: village meetings, the family welfare movement, and the integrated community health post. Because each type of activity has a different nature of organization and differing objectives their effects may be diverse. The model was estimated using seemingly unrelated regression (Zellner, 1962).
3. Women’s Share of Asset and Participation in Community Organizations
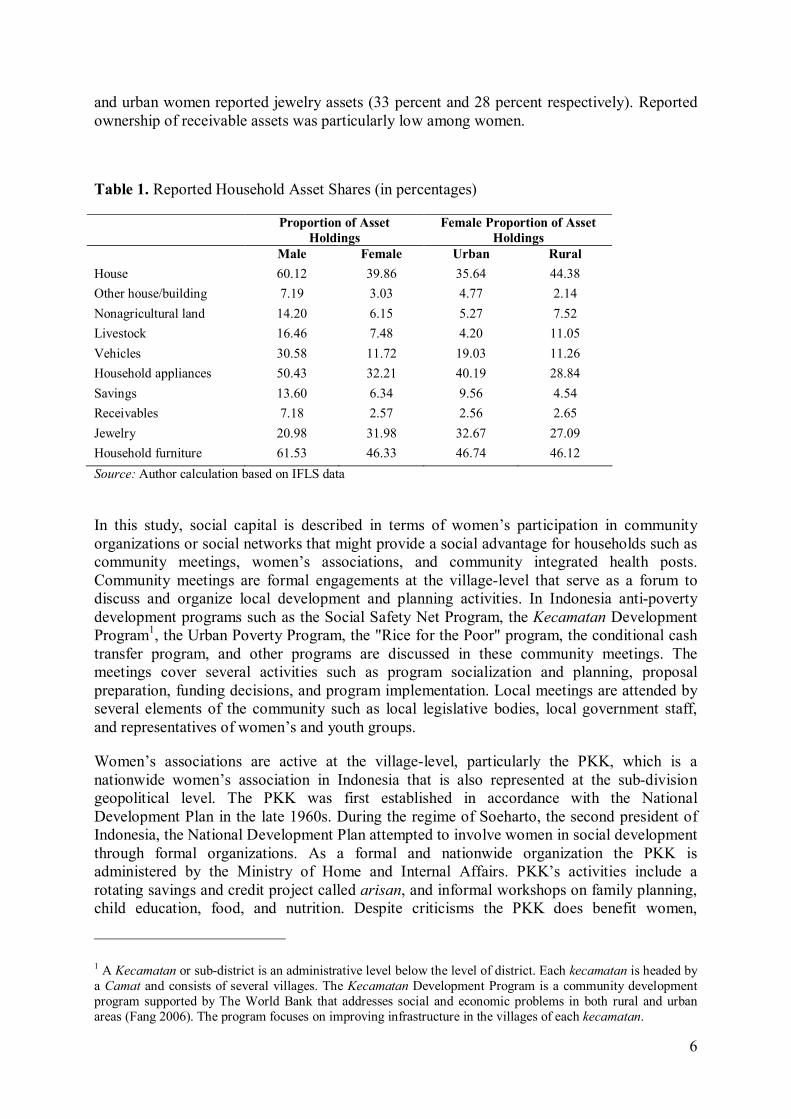
As mentioned earlier the IFLS dataset includes extensive information on both household (nonbusiness holdings) and individual assets. The assets reported were not only those owned by the head of household and the spouse, but also included assets of other household individuals. Table 1 reports the distribution of assets within households. Asset ownership was male dominant for every category except for jewelry. The gap of asset shares between men and women in the household was almost 2:1, which clearly indicates male dominancy in asset holding. Comparing rural and urban households, women’s asset shares in rural areas were higher than their urban counterparts for residence ownership, nonagricultural land holdings, and livestock. Urban women had relatively higher asset shares of vehicles, household appliances, savings, receivables, jewelry, and household furniture than rural counterparts. The house is often considered the most important household asset, and home ownership by women is considered an asset brought into marriage and may reflect the social status of married women. Ownership by male household heads was reported by 61 percent of households that owned their residence. In both rural and urban areas the house, household appliances, and household furniture were most often considered joint assets. More than a quarter of both rural
6
and urban women reported jewelry assets (33 percent and 28 percent respectively). Reported ownership of receivable assets was particularly low among women.
Table 1. Reported Household Asset Shares (in percentages)
Proportion of Asset Holdings
Female Proportion of Asset Holdings
Male Female Urban Rural
House 60.12 39.86 35.64 44.38
Other house/building 7.19 3.03 4.77 2.14
Nonagricultural land 14.20 6.15 5.27 7.52
Livestock 16.46 7.48 4.20 11.05
Vehicles 30.58 11.72 19.03 11.26
Household appliances 50.43 32.21 40.19 28.84
Savings 13.60 6.34 9.56 4.54
Receivables 7.18 2.57 2.56 2.65
Jewelry 20.98 31.98 32.67 27.09
Household furniture 61.53 46.33 46.74 46.12
Source: Author calculation based on IFLS data
In this study, social capital is described in terms of women’s participation in community organizations or social networks that might provide a social advantage for households such as community meetings, women’s associations, and community integrated health posts. Community meetings are formal engagements at the village-level that serve as a forum to discuss and organize local development and planning activities. In Indonesia anti-poverty development programs such as the Social Safety Net Program, the Kecamatan Development Program1, the Urban Poverty Program, the "Rice for the Poor" program, the conditional cash transfer program, and other programs are discussed in these community meetings. The meetings cover several activities such as program socialization and planning, proposal preparation, funding decisions, and program implementation. Local meetings are attended by several elements of the community such as local legislative bodies, local government staff, and representatives of women’s and youth groups.
Women’s associations are active at the village-level, particularly the PKK, which is a nationwide women’s association in Indonesia that is also represented at the sub-division geopolitical level. The PKK was first established in accordance with the National Development Plan in the late 1960s. During the regime of Soeharto, the second president of Indonesia, the National Development Plan attempted to involve women in social development through formal organizations. As a formal and nationwide organization the PKK is administered by the Ministry of Home and Internal Affairs. PKK’s activities include a rotating savings and credit project called arisan, and informal workshops on family planning, child education, food, and nutrition. Despite criticisms the PKK does benefit women,
1 A Kecamatan or sub-district is an administrative level below the level of district. Each kecamatan is headed by a Camat and consists of several villages. The Kecamatan Development Program is a community development program supported by The World Bank that addresses social and economic problems in both rural and urban areas (Fang 2006). The program focuses on improving infrastructure in the villages of each kecamatan.

7
particularly in terms of acquiring information and knowledge that can enhance household welfare. The PKK also operates "money-go-around" activities that provide additional monetary benefits and may perform as informal savings.
The third women’s social activity used in this analysis is participation in POSYANDU, a public health system established in the 1980s that is funded by the national government. POSYANDU offers several primary health services for women and children including: prenatal services, child registration, family planning counseling, and the distribution of supplementary food, vitamins, contraceptives, and information on nutrition and other community health issues. These services are provided on a regular monthly basis in collaboration with local midwives and community health centers.
Table 2. Women’s Participation in Community Organizations
Pooled 1997 2000 2007 Urban Rural
Community meeting
0.162 (0.369)
0.195 (0.396)
0.128 (0.334)
0.164 (0.370)
0.196 (0.397)
0.133 (0.340)
PKK 0.160 (0.367)
0.174 (0.379)
0.150 (0.357)
0.156 (0.363)
0.199 (0.399)
0.127 (0.419)
Posyandu 0.223 (0.416)
0.276 (0.447)
0.190 (0.392)
0.202 (0.402)
0.218 (0.413)
0.227 (0.333)
Source: Author calculation based on IFLS data Note: Standard deviations are shown in parentheses
Table 2 presents a breakdown of women’s participation in community meetings, PKK, and POSYANDU. Among these three categories women were most likely to participate in POSYANDU activities. Over time women’s participation decreased slightly in 2000 and increased again in 2007 for all three groups. There are several underlying reasons for this phenomenon, including the considerable growth of development programs at the local level. Various programs available to communities, such as conditional and unconditional cash transfer efforts and the POSYANDU revitalization program were launched in 2003 and 2004 respectively. These programs might have provided incentives for women to participate more in communal activities, although this explanation remains to be tested. Urban women were more likely to participate in community meetings and the PKK, whereas rural women were a little more likely to participate in POSYANDU. This implies that rural women are optimizing the health services provided by POSYANDU, presumably for children and women, whereas fewer households participated in POSYANDU in urban areas where alternative healthcare facilities are more available relative to rural areas.
4. Estimation Results
4.1 Characteristics of Households by Asset Type
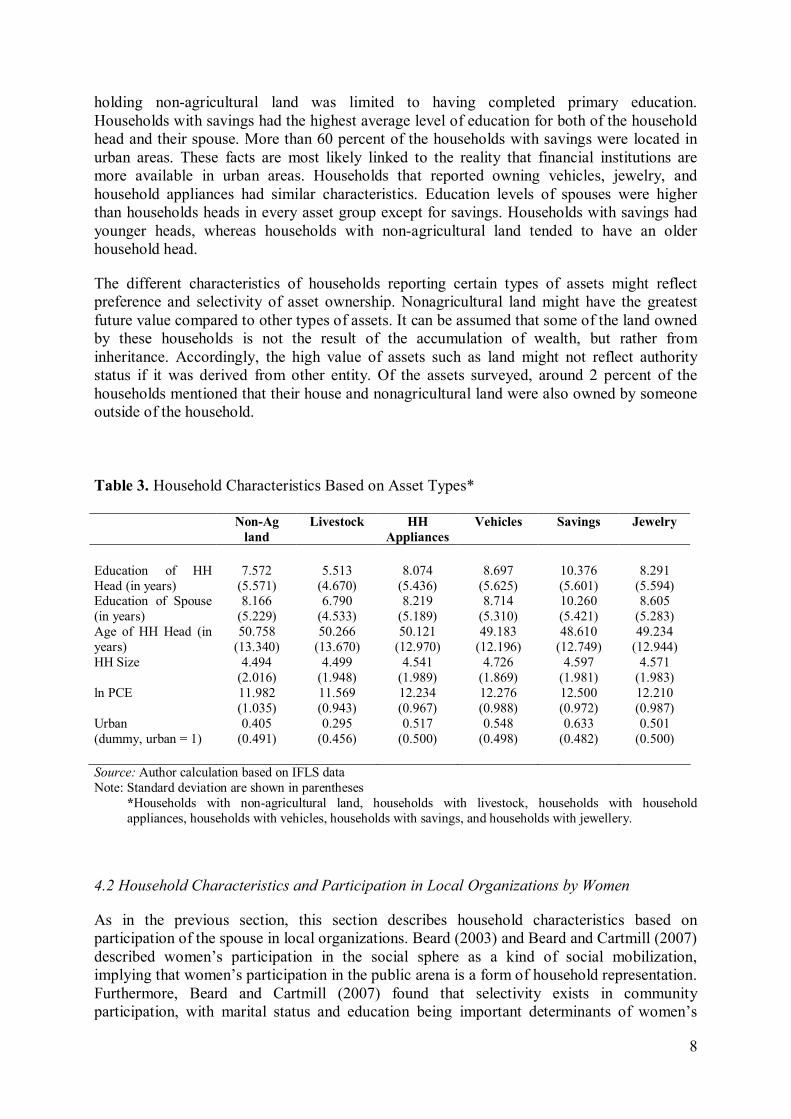
Table 3 reports household characteristics based on asset types. Households with livestock were more likely to be rural with a low level of education (below completion of primary school), and low per-capita expenditures. The average level of education of a household head
8
holding non-agricultural land was limited to having completed primary education. Households with savings had the highest average level of education for both of the household head and their spouse. More than 60 percent of the households with savings were located in urban areas. These facts are most likely linked to the reality that financial institutions are more available in urban areas. Households that reported owning vehicles, jewelry, and household appliances had similar characteristics. Education levels of spouses were higher than households heads in every asset group except for savings. Households with savings had younger heads, whereas households with non-agricultural land tended to have an older household head.
The different characteristics of households reporting certain types of assets might reflect preference and selectivity of asset ownership. Nonagricultural land might have the greatest future value compared to other types of assets. It can be assumed that some of the land owned by these households is not the result of the accumulation of wealth, but rather from inheritance. Accordingly, the high value of assets such as land might not reflect authority status if it was derived from other entity. Of the assets surveyed, around 2 percent of the households mentioned that their house and nonagricultural land were also owned by someone outside of the household.
Table 3. Household Characteristics Based on Asset Types*
Non-Ag
land Livestock HH
Appliances Vehicles Savings Jewelry
Education of HH Head (in years)
7.572 (5.571)
5.513 (4.670)
8.074 (5.436)
8.697 (5.625)
10.376 (5.601)
8.291 (5.594)
Education of Spouse (in years)
8.166 (5.229)
6.790 (4.533)
8.219 (5.189)
8.714 (5.310)
10.260 (5.421)
8.605 (5.283)
Age of HH Head (in years)
50.758 (13.340)
50.266 (13.670)
50.121 (12.970)
49.183 (12.196)
48.610 (12.749)
49.234 (12.944)
HH Size 4.494 (2.016)
4.499 (1.948)
4.541 (1.989)
4.726 (1.869)
4.597 (1.981)
4.571 (1.983)
ln PCE 11.982 (1.035)
11.569 (0.943)
12.234 (0.967)
12.276 (0.988)
12.500 (0.972)
12.210 (0.987)
Urban (dummy, urban = 1)
0.405 (0.491)
0.295 (0.456)
0.517 (0.500)
0.548 (0.498)
0.633 (0.482)
0.501 (0.500)
Source: Author calculation based on IFLS data Note: Standard deviation are shown in parentheses
*Households with non-agricultural land, households with livestock, households with household appliances, households with vehicles, households with savings, and households with jewellery.
4.2 Household Characteristics and Participation in Local Organizations by Women
As in the previous section, this section describes household characteristics based on participation of the spouse in local organizations. Beard (2003) and Beard and Cartmill (2007) described women’s participation in the social sphere as a kind of social mobilization, implying that women’s participation in the public arena is a form of household representation. Furthermore, Beard and Cartmill (2007) found that selectivity exists in community participation, with marital status and education being important determinants of women’s
9
participation in local organizations. Because of the burden of domestic responsibilities associated with marriage it would be expected that single women would be more likely to participate in social organizations. However, in the case of Indonesia, Beard and Cartmill (2007) found that being married had a positive and significant effect on participation.
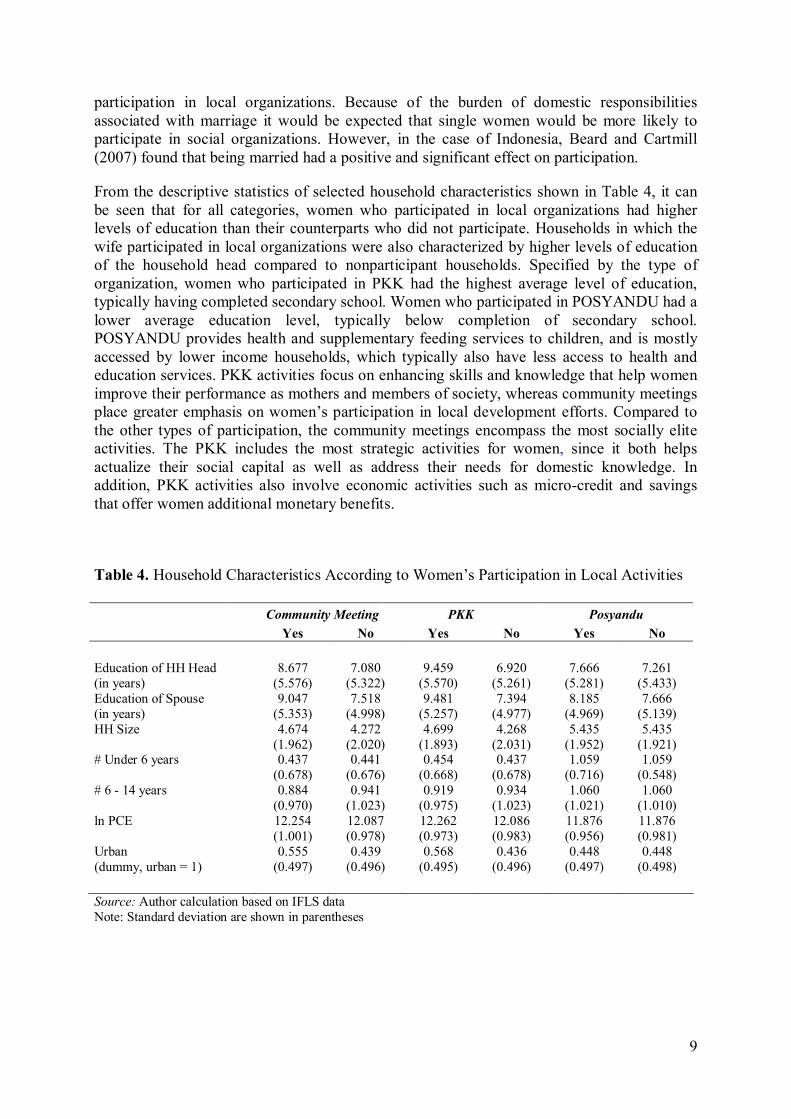
From the descriptive statistics of selected household characteristics shown in Table 4, it can be seen that for all categories, women who participated in local organizations had higher levels of education than their counterparts who did not participate. Households in which the wife participated in local organizations were also characterized by higher levels of education of the household head compared to nonparticipant households. Specified by the type of organization, women who participated in PKK had the highest average level of education, typically having completed secondary school. Women who participated in POSYANDU had a lower average education level, typically below completion of secondary school. POSYANDU provides health and supplementary feeding services to children, and is mostly accessed by lower income households, which typically also have less access to health and education services. PKK activities focus on enhancing skills and knowledge that help women improve their performance as mothers and members of society, whereas community meetings place greater emphasis on women’s participation in local development efforts. Compared to the other types of participation, the community meetings encompass the most socially elite activities. The PKK includes the most strategic activities for women, since it both helps actualize their social capital as well as address their needs for domestic knowledge. In addition, PKK activities also involve economic activities such as micro-credit and savings that offer women additional monetary benefits.
Table 4. Household Characteristics According to Women’s Participation in Local Activities
Community Meeting PKK Posyandu
Yes No Yes No Yes No
Education of HH Head (in years)
8.677 (5.576)
7.080 (5.322)
9.459 (5.570)
6.920 (5.261)
7.666 (5.281)
7.261 (5.433)
Education of Spouse (in years)
9.047 (5.353)
7.518 (4.998)
9.481 (5.257)
7.394 (4.977)
8.185 (4.969)
7.666 (5.139)
HH Size 4.674 (1.962)
4.272 (2.020)
4.699 (1.893)
4.268 (2.031)
5.435 (1.952)
5.435 (1.921)
# Under 6 years 0.437 (0.678)
0.441 (0.676)
0.454 (0.668)
0.437 (0.678)
1.059 (0.716)
1.059 (0.548)
# 6 - 14 years 0.884 (0.970)
0.941 (1.023)
0.919 (0.975)
0.934 (1.023)
1.060 (1.021)
1.060 (1.010)
ln PCE 12.254 (1.001)
12.087 (0.978)
12.262 (0.973)
12.086 (0.983)
11.876 (0.956)
11.876 (0.981)
Urban (dummy, urban = 1)
0.555 (0.497)
0.439 (0.496)
0.568 (0.495)
0.436 (0.496)
0.448 (0.497)
0.448 (0.498)
Source: Author calculation based on IFLS data Note: Standard deviation are shown in parentheses

10
4.3 The Effects of Women’s Assets and Social Capital on Household Expenditures
This section presents the results of the analysis of the effects of women’s domestic authority as measured by two proxies, their share of household assets and their social capital, on household food and nonfood expenditures. Controlling for household characteristics such as education, household size, and rural versus urban location, the effects of women’s assets share on selected food and non-food expenditures were varied. In general, women’s asset shares were positively and significantly associated with expenditures on meat-fish and negatively with expenditures on staple foods. Though less conclusive, women’s asset shares had a positive effect on dairy product expenditures. Interestingly, women’s asset shares of all types had negative and significant effects on adult goods expenditures such as tobacco and alcohol. Hence, women’s asset shares appear to be associated with a women’s authority over the household budget with regard to adult goods expenditures. Furthermore, women’s asset shares were positively and significantly associated with total nonfood expenditures and also positively associated with education expenditures. Overall, wives with a greater asset share appear to have greater domestic authority than those who had fewer household assets. These results support existing empirical evidence indicating the positive effects of women’s assets on human capital development through greater consumption of nutrient-rich foods and investment in education (Quisumbing and de la Breire, 2000; Doss, 2005).
It has been claimed that women are more likely to allocate resources on expenditures that improve the human capital outcome of household members, such as for higher nutrient foods, health care, and education (Quisumbing and McClafferty, 2006). Expenditures on nutrient-rich food such as meat-fish and dairy products are positively correlated with household member nutritional status, particularly children. Despite the positive association of women's domestic authority to education expenditures, there might be social norms and expectations that govern this pattern. It might also be true that the association of women’s assets to household outcomes are related to women’s investment in the future. The results of this analysis support previous empirical findings associating women’s control over household resource with expenditures on goods that have positive effects on household well-being.
The effects of demographic variables such as the number of children under age 5, the number of males and females of working age, the number of elderly, and the level of education of both the household head and their spouse were consistent with the findings of previous research efforts (Quisumbing and Mallucio, 2003; Quisumbing and McClafferty 2003, Doss 2005). Holding other variables constant, the budget share of staple foods increased with the number of household members. The number of household members under age 5 had a positive and significant association with the budget share of dairy products, which are one of the main sources of calories and other nutrients that promote physical development. The number of adult household members had the opposite effect on dairy expenditures. The number of adult males in the household had a positive association with the share of adult goods expenditures. The effects of women’s education levels were greater than those of household heads for all budget shares. Urban households tended to spend more on dairy products and nonfood expenditures, whereas rural households tended to have larger expenditure shares on staple foods, vegetables, meat and fish, and adult goods.

11
Table 5. The Effects of Women’s Assets on Budget Share of Vegetables, Meat and Fish, Dairy Products, and Alcohol and Tobacco Goods Expenditures
Vegetables Dairy Products Meat and Fish Alcohol and
Tobacco Goods
Farm Household (dummy, farm = 1)
0.2783*** (0.1062)
-0.0769 (0.0819)
0.5304*** (0.1548)
-0.4911*** (0.1430)
Urban Household (dummy, urban = 1)
-0.2632** (0.1060)
0.1872** (0.0817)
-0.8183*** (0.1545)
-0.4795*** (0.1428)
Age of HH Head (in years) -0.0059 (0.0053)
0.0079* (0.0041)
0.0118 (0.0078)
-0.0606*** (0.0072)
Educ of HH Head (in years) -0.0121 (0.0117)
0.0397*** (0.0090)
0.0432** (0.0171)
-0.0878*** (0.0158)
Educ of Spouse (in years) -0.0110 (0.0119)
0.0593*** (0.0091)
-0.0327* (0.0173)
-0.0841*** (0.0160)
HH Head Employment (dummy, working = 1)
0.2324* (0.1399)
0.0689 (0.1079)
-0.3274 (0.2040)
0.3897*** (0.1885)
Under 6 years 0.0377 (0.0648)
0.6698*** (0.0500)
0.2238** (0.0945)
0.1845** (0.0873)
6 - 14 years -0.0768* (0.0447)
-0.1934*** (0.0345)
0.1220* (0.0652)
-0.1447** (0.0603)
15 - 59 years (male) -0.0049 (0.0392)
-0.0909*** (0.0302)
0.0473 (0.0572)
0.3929*** (0.0528)
15 - 59 years (female) -0.0049 (0.0412)
-0.0823*** (0.0317)
0.0195 (0.0600)
-0.2152*** (0.0554)
60 years and over (male) 0.3707*** (0.1423)
0.0159 (0.1097)
0.2992 (0.2075)
0.2668 (0.1917)
60 years and over (female) -0.0387 (0.1119)
-0.0169 (0.0863)
-0.0559 (0.1631)
-0.2199 (0.1507)
Ln Expenditure -0.5587*** (0.0723)
0.2140*** (0.0558)
-0.1422 (0.1055)*
-0.6744*** (0.0974)
Dummy 2000 -0.1169 (0.1131)
0.2993*** (0.0872)
0.2982 (0.1649)
1.4848*** (0.1523)
Dummy 2007 -1.3505*** (0.1248)
-0.0864 (0.0962)
-1.2013*** (0.1819)
2.1907*** (0.1680)
Share of Asset 0.0157* (0.0092)
0.0102 (0.0071)
0.0732*** (0.0134)
-0.0656*** (0.0124)
Constant 14.6900*** (0.9732)
-1.1617 (0.7503)
10.5703*** (1.4188)
18.7770*** (1.3108)
R-square 0.0417 0.0470 0.0198 0.0595
F 30.44 34.51 14.17 44.26
P N
0.0000 11221
0.0000 11221
0.0000 11221
0.0000 11221
Source: Author calculation based on IFLS data Note: Standard errors are shown in parentheses. * Denotes statistical significance at 10% level. ** Denotes statistical significance at 5% level. *** Denotes statistical significance at 1% level.

12
Table 6. The Effects of Women’s Assets on Budget Share of Education, Medical, and Nonfood Expenditures
Medical Education Nonfood
Farm Household (dummy, farm = 1)
-0.1482 (0.1137)
0.2248 (0.2638)
-2.2499*** (0.3447)
Urban Household (dummy, urban = 1)
-0.1233 (0.1139)
0.7812*** (0.2642)
4.1432*** (0.3452)
Age of HH Head (in years) 0.0163*** (0.0057)
0.0935*** (0.0133)
0.0392** (0.0174)
Educ of HH Head (in years) 0.0094 (0.0123)
0.2382*** (0.0284)
0.1164*** (0.0371)
Educ of Spouse (in years) 0.0109 (0.0127)
0.1452*** (0.0295)
0.2695*** (0.0385)
HH Head Employment (dummy, working = 1)
-0.9458*** (0.1504)
2.1861*** (0.3488)
-1.4128*** (0.4557)
Under 6 years 0.2281*** (0.0695)
-2.2806*** (0.1611)
-2.1881*** (0.2105)
6 - 14 years -0.2553*** (0.0480)
1.1725*** (0.1113)
-0.4778*** (0.1455)
15 - 59 years (male) -0.1180*** (0.0412)
0.3377*** (0.0955)
-0.8109*** (0.1248)
15 - 59 years (female) -0.1018*** (0.0433)
0.5267*** (0.1005)
0.0661*** (0.1313)
60 years and over (male) 0.2924** (0.1526)
-3.9309*** (0.3540)
-2.0063*** (0.4625)
60 years and over (female) 0.1680 (0.1198)
-0.4567 (0.2779)
-0.0432 (0.3631)
Ln Expenditure 0.6132*** (0.0754)
-0.1841 (0.1749)
7.6216*** (0.2285)
Dummy 2000 0.0327 (0.1216)
-0.6825*** (0.2821)
-2.6676*** (0.3670)
Dummy 2007 -0.2581* (0.1342)
-0.4984 (0.3112)
-4.0926*** (0.4048)
Share of Assets -0.0164 (0.0097)
0.0494*** (0.0225)
0.0478*** (0.0294)
Constant -6.5737*** (1.0466)
-0.4391 (2.4279)
-67.9058*** (3.1580)
R-square 0.0237 0.0804 0.2391
F 16.99 61.24 220.06
P 0.0000 0.0000 0.0000
N 11221 11221 11221
Source: Author calculation based on IFLS data Note: Standard errors are shown in parentheses. * Denotes statistical significance at 10% level. ** Denotes statistical significance at 5% level. *** Denotes statistical significance at 1% level.
13
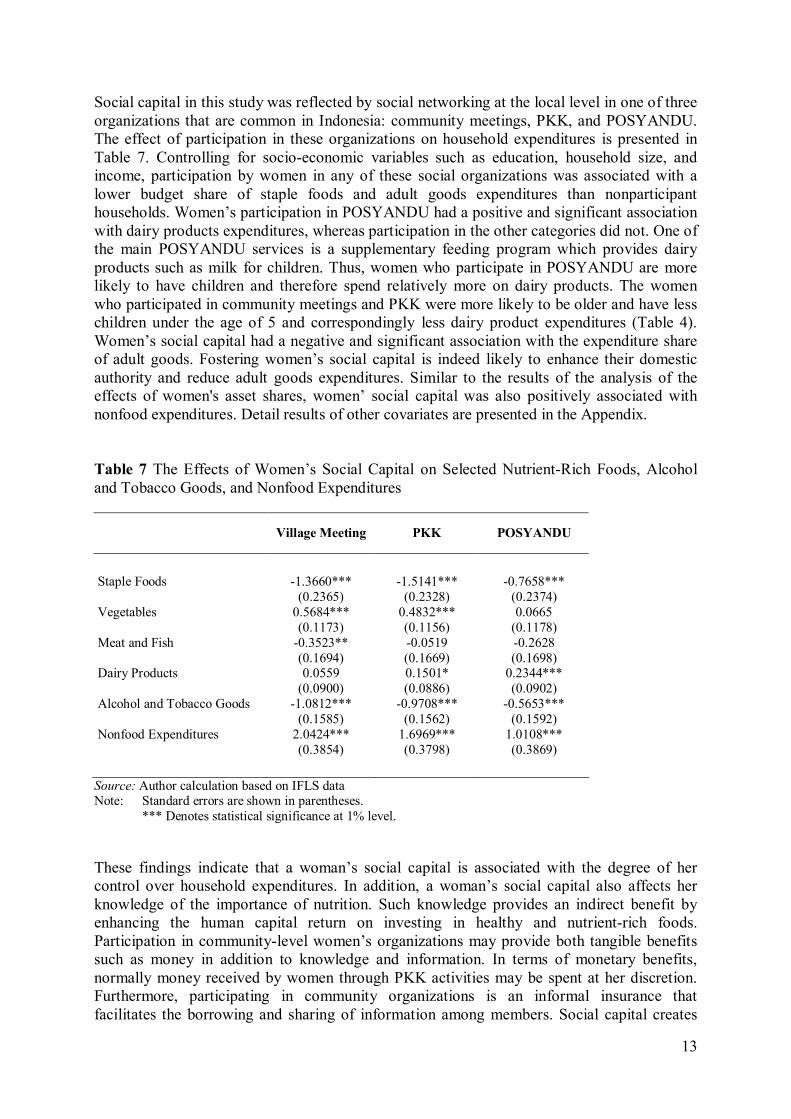
Social capital in this study was reflected by social networking at the local level in one of three organizations that are common in Indonesia: community meetings, PKK, and POSYANDU. The effect of participation in these organizations on household expenditures is presented in Table 7. Controlling for socio-economic variables such as education, household size, and income, participation by women in any of these social organizations was associated with a lower budget share of staple foods and adult goods expenditures than nonparticipant households. Women’s participation in POSYANDU had a positive and significant association with dairy products expenditures, whereas participation in the other categories did not. One of the main POSYANDU services is a supplementary feeding program which provides dairy products such as milk for children. Thus, women who participate in POSYANDU are more likely to have children and therefore spend relatively more on dairy products. The women who participated in community meetings and PKK were more likely to be older and have less children under the age of 5 and correspondingly less dairy product expenditures (Table 4). Women’s social capital had a negative and significant association with the expenditure share of adult goods. Fostering women’s social capital is indeed likely to enhance their domestic authority and reduce adult goods expenditures. Similar to the results of the analysis of the effects of women's asset shares, women’ social capital was also positively associated with nonfood expenditures. Detail results of other covariates are presented in the Appendix. Table 7 The Effects of Women’s Social Capital on Selected Nutrient-Rich Foods, Alcohol and Tobacco Goods, and Nonfood Expenditures
Village Meeting PKK POSYANDU
Staple Foods -1.3660*** (0.2365)
-1.5141*** (0.2328)
-0.7658*** (0.2374)
Vegetables 0.5684*** (0.1173)
0.4832*** (0.1156)
0.0665 (0.1178)
Meat and Fish -0.3523** (0.1694)
-0.0519 (0.1669)
-0.2628 (0.1698)
Dairy Products 0.0559 (0.0900)
0.1501* (0.0886)
0.2344*** (0.0902)
Alcohol and Tobacco Goods -1.0812*** (0.1585)
-0.9708*** (0.1562)
-0.5653*** (0.1592)
Nonfood Expenditures 2.0424*** (0.3854)
1.6969*** (0.3798)
1.0108*** (0.3869)
Source: Author calculation based on IFLS data Note: Standard errors are shown in parentheses. *** Denotes statistical significance at 1% level.
These findings indicate that a woman’s social capital is associated with the degree of her control over household expenditures. In addition, a woman’s social capital also affects her knowledge of the importance of nutrition. Such knowledge provides an indirect benefit by enhancing the human capital return on investing in healthy and nutrient-rich foods. Participation in community-level women’s organizations may provide both tangible benefits such as money in addition to knowledge and information. In terms of monetary benefits, normally money received by women through PKK activities may be spent at her discretion. Furthermore, participating in community organizations is an informal insurance that facilitates the borrowing and sharing of information among members. Social capital creates
14
spillover benefits through improved access to both financial and nonfinancial resources. In the case of Indonesia, a previous study found that participation at the community-level increased the likelihood of receiving government aid during economic crises and the probability of employment of the household head (Perdana, 2006).
Participation by women in local activities such as community meetings, the PKK, and POSYANDU translates into social capital that had positive effects on the outcomes of intra-household power relations. More importantly, women’s social capital enhances awareness of their role in the development process. Women’s participation in the community is also a means of empowerment by helping women to challenge the gender norms embedded in household and kinship hierarchies. In particular, it enables women to be more aware of and promote household welfare. An effective way to promote social welfare is to spread knowledge regarding nutritional issues through women-based organizations.
5. Conclusion
Intra-household resource allocation issues have important implications for public policy design. Consideration of resource distribution and power relations within households are important for determining the outcome of policy interventions, particularly in terms of program targeting. This study examined women’s domestic authority over the distribution of household expenditures. Although measures of women’s status in the household using non-labour income such as assets has been widely used, this study extended the intra-household power relation by using women’s social capital in addition to household asset shares as proxies of women’s status in the household. Women’s social capital is assumed to have greater pay-offs than income because it also has a multiplier effect in terms of empowerment.
The results show that a women’s share of household assets was related to the distribution of household expenditures. Holding other factors constant a women’s share of assets had a negative effect on adult goods expenditures regardless of asset type. This supports the claim that a women’s asset share reflects her domestic authority over the allocation of household budgets. Controlling for education levels, household size, and income, it was found that women’s participation in local organizations had negative and significant associations with the budget share of staple foods and adult goods expenditures. Participating in community-based activities is expected to improve women’s understanding of household welfare and enable them to allocate the household budget according to their concerns, such as reducing expenditures on entertainment for adult male household members. This finding confirms the importance of women’s authority over household expenditures on goods and services that increase the welfare of the household.
Control over resources is an important component of intra-household power relations. It was shown that variables that reflect women’s authority in the household were associated with human-capital enhancing expenditures such as dairy products, meat and fish, and nonfood expenditures. Women’s social capital is closely related to women’s authority within the household and may be developed through appropriate policy to strengthen women’s status in intra-household power relations. Hence, promoting control over household resources by women should improve public welfare outcomes.
15
References
Beard, V. A. ‘Learning Radical Planning: the power of collective action’, Planning Theory, Vol. 2, (2003) pp. 13-35.
Beard, V. A., and Cartmill, R. S. ‘Gender, Collective Action and Participatory Development in Indonesia’, International Development Planning Review, Vol. 29, (2007) pp. 185-213.
Bourdieu, P. Outline of a Theory of Practice, (Cambridge: Cambridge University Press, 1977).
Coleman, J. S. ‘Social Capital in the Creation of Human Capital’, American Journal of Sociology, Vol. 94, (1988) pp. 95-121.
Doss, C. ‘The Effects of Intrahousehold Property Ownership on Expenditure Patterns in Ghana’, Journal of African Economies, Vol. 15, (2005) pp. 149-180.
El-Bushra, J. ‘Rethinking Gender and Development Practice for the Twenty-First Century’, Gender and Development, Vol. 8, (2000) pp. 55-62.
Fang, K. ‘Designing and Implementing a Community-Driven Development Program in Indonesia’, Development in Practice, Vol. 16, (2006) pp. 74-79.
Frankenberg, E., Smith, J. P., and Thomas, D. ‘Economic Shocks, Wealth, and Welfare’, Journal of Human Resources, Vol. 38, (2003) pp. 280-321.
Fukuda-Parr, S. ‘Reducing Inequality – The Missing MDG: a content review of PRSPs and Bilateral Donor Policy Statements’, IDS Bulletin, Vol. 41, (2010) pp. 26-35.
Kabeer, N. ‘Gender Equality and Women’s Empowerment: a critical analysis of the third millennium development goal’, Gender and Development, Vol. 13, (2005) pp. 13-24.
Oakley, A. Gender, Sex and Society, (London: Maurice Temple Smith, 1972). Perdana, A. A. ‘Better Together or Not? Community Participation, Consumption Smoothing
and Household Head Employment in Indonesia’, Development Economics Working Paper Number 777, East Asian Bureau Economic Research (2006).
Quisumbing, A. R., and Mallucio, J. A. ‘Resources at Marriage and Intrahousehild Allocation: evidence from Bangladesh, Ethiopia, Indonesia, and South Africa’, Oxford Bulletin of Economics and Statistics, Vol. 65, (2003) pp. 0305-9049.
Quisumbing, A. R., and McClafferty, B. Food Security in Practice: using gender research in development, (Washington D. C.: International Food Policy Research Institute, 2006).
Quisumbing, A. R., and de la Briere, B. Women’s Assets and Intrahousehold Allocation in Rural Bangladesh: Testing Measures of Bargaining Power, FCND DP Number 86 (Washington D. C.: International Food Policy Research Institute, 2000).
Schefold, R. The domestication of culture: nation building and ethnic diversity in Indonesia, (Leiden: KITLV, 1998).
Strauss, J., Witoelar, F., Sikoki, B., and Wattie, A. M. User’s Guide for the Indonesia Family Life Survey Wave 4, WR-657/2-NIA/NICHD (Santa Monica: RAND Corporation, 2009).
Thomas, D. ‘The Distribution of Income and Expenditure within the Household’, Annales d'Économie et de Statistique, Vol. 29, (1993) pp. 109-135.
Thomas, D., Contreras, D., and Frankenberg, E. ‘Distribution of Power within the Household and Child Health’, (1999) Available at http://www.rand.org/labor/FLS/IFLS/distpow.pdf, [Accessed March 28, 2008].
Tresemer, D. ‘Assumptions Made about Gender Roles’, Sociological Inquiry, Vol. 45, (1975) pp. 308-339.
Zellner, A. ‘An Efficient Method of Estimating Seemingly Unrelated Regression and Tests for Aggregation Bias’, Journal of the American Statistical Association, Vol. 57, (1962) pp. 348-368.

16
Table A1. The Effects of Women’s Participation in Community Meetings on Budget Share of Vegetables, Dairy Products, Alcohol and Tobacco Goods, and Nonfood Expenditures
Vegetables Dairy Products Alcohol and
Tobacco Goods Nonfood
Farm Household (dummy, farm = 1)
0.2229 (0.1092)
-0.0836 (0.0838)
-0.2566* (0.1476)
-2.7582*** (0.3588)
Urban Household (dummy, urban = 1)
-0.1885* (0.1103)
0.1741** (0.0846)
-0.5927*** (0.1490)
3.7674*** (0.3624)
Age of HH Head ( in years) -0.0072 (0.0055)
0.0076* (0.0042)
-0.0673*** (0.0075)
0.0654*** (0.0182)
Educ of HH Head (in years) -0.0030 (0.0120)
0.0471*** (0.0092)
-0.0695*** (0.0163)
0.1114*** (0.0396)
Educ of Spouse (in years) -0.0180 (0.0123)
0.0619*** (0.0094)
-0.1048*** (0.0163)
0.3404*** (0.0403)
HH Head Employment (dummy, working = 1)
0.1761 (0.1490)
0.0161 (0.1143)
0.3103 (0.2013)
-0.9528* (0.4895)
Under 6 years 0.0917 (0.0679)
0.6612*** (0.0521)
0.0855 (0.0917)
-2.0012*** (0.2230)
6 - 14 years -0.0370 (0.0463)
-0.1793*** (0.0356)
-0.2191*** (0.0626)
-0.2555* (0.1523)
15 - 59 years (male) -0.0930** (0.0405)
-0.0950*** (0.0311)
0.4985*** (0.0548)
-0.9576*** (0.1332)
15 - 59 years (female) -0.0381 (0.0427)
-0.0700** (0.0328)
-0.1056* (0.0577)
-0.0225 (0.3812)
60 years and over (male) 0.3411** (0.1465)
0.0176 (0.1124)
0.5130*** (0.1979)
-2.7116*** (0.4814)
60 years and over (female) -0.1154 (0.1160)
-0.0576 (0.0890)
0.1979 (0.1568)
-0.2010 (0.3812)
Ln Expenditure -0.7023*** (0.0610)
0.1390*** (0.0468)
-0.0245 (0.0824)
4.9820*** (0.2005)
Village Meeting 0.5684*** (0.1173)
0.0559 (0.0900)
-1.0812*** (0.1585)
2.0424*** (0.3854)
Constant 16.2416*** (0.7985)
0.1412 (0.6126)
10.1299*** (1.0790)
-27.9433*** (2.6238)
R-square 0.0337 0.0459 0.0423 0.1951
F 26.13 36.04 33.05 181.57
P 0.0000 0.0000 0.0000 0.0000
N 10503 10503 10503 10503
Source: Author calculation based on IFLS data Note: Standard errors are shown in parentheses. * Denotes statistical significance at 10% level. ** Denotes statistical significance at 5% level. *** Denotes statistical significance at 1% level.

17
Table A2. The Effects of Women’s Participation in the PKK on Budget Share of Vegetables, Dairy Products, Alcohol and Tobacco Goods, and Nonfood Expenditures
Vegetables Dairy Products Alcohol and
Tobacco Goods Nonfood
Farm Household (dummy, farm = 1)
0.2376** (0.1091)
-0.0847 (0.0837)
-0.2833*** (0.1475)
-2.7045*** (0.3587)
Urban Household (dummy, urban = 1)
-0.1823 (0.1103)
0.1712** (0.0846)
0.0779*** (0.0918)
3.7912*** (0.3624)
Age of HH Head ( in years) -0.0065 (0.0055)
0.0075* (0.0042)
-0.0684*** (0.0075)
0.0678*** (0.0182)
Educ of HH Head (in years) -0.0056 (0.0121)
0.0462*** (0.0093)
-0.0642*** (0.0163)
0.1023*** (0.0397)
Educ of Spouse (in years) -0.0173 (0.0123)
0.0611*** (0.0094)
-0.1055*** (0.0166)
0.3429*** (0.0403)
HH Head Employment (dummy, working = 1)
0.1848 (0.1490)
0.0147 (0.1143)
0.2950 (0.2013)
-0.9209* (0.4896)
Under 6 years 0.0952 (0.0679)
0.6631*** (0.0521)
0.0779 (0.0918)
-1.9889*** (0.2231)
6 - 14 years -0.0404 (0.0463)
-0.1790*** (0.0355)
-0.2130*** (0.0626)
-0.2679* (0.1523)
15 - 59 years (male) -0.0953** (0.0405)
-0.0950*** (0.0311)
0.5028*** (0.0548)
-0.9661*** (0.1332)
15 - 59 years (female) -0.0312 (0.0427)
-0.0691** (0.0328)
-0.1188** (0.0577)
0.0021 (0.1404)
60 years and over (male) 0.3414** (0.1465)
0.0209 (0.1124)
0.5108*** (0.1980)
-2.7118*** (0.4816)
60 years and over (female) -0.1222 (0.1161)
-0.0592 (0.0890)
-0.0178 (0.1568)
-0.2252 (0.3814)
Ln Expenditure -0.6972*** (0.0610)
0.1391*** (0.0468)
-0.0339 (0.0824)
5.0003*** (0.2005)
PKK 0.4832*** (0.1156)
0.1501* (0.0886)
-0.9708*** (0.1562)
1.6969 (0.3798)
Constant 16.1477*** (0.7984)
0.1385 (0.6123)
10.3053*** (1.0789)
-28.2832*** (2.6236)
R-square 0.0331 0.0461 0.0415 0.1945
F 25.68 36.22 32.46 180.85
P 0.0000 0.0000 0.0000 0.0000
N 10503 10503 10503 10503
Source: Author calculation based on IFLS data Note: Standard errors are shown in parentheses. * Denotes statistical significance at 10% level. ** Denotes statistical significance at 5% level. *** Denotes statistical significance at 1% level.

18
Table A3. The Effects of Women’s Participation in POSYANDU on Budget Share of Vegetables, Dairy Products, Alcohol and Tobacco Goods, and Nonfood Expenditures
Vegetables Dairy Products Alcohol and
Tobacco Goods Nonfood
Farm Household (dummy, farm = 1)
0.2481** (0.1092)
-0.0859 (0.0837)
-0.2953** (0.1477)
-2.6840*** (0.3588)
Urban Household (dummy, urban = 1)
-0.1653 (0.1103)
0.1776** (0.0845)
-0.6393*** (0.1491)
3.8552*** (0.3624)
Age of HH Head ( in years) -0.0056 (0.0055)
0.0083** (0.0042)
-0.0714*** (0.0075)
0.0729*** (0.0182)
Educ of HH Head (in years) -0.0024 (0.0121)
0.0473*** (0.0092)
-0.0710*** (0.0163)
0.1142*** (0.0396)
Educ of Spouse (in years) -0.0137 (0.0122)
0.0617*** (0.0094)
-0.1117*** (0.0166)
0.3537*** (0.0402)
HH Head Employment (dummy, working = 1)
0.1953 (0.1491)
0.0166 (0.1142)
0.2766 (0.2015)
-0.8889* (0.4898)
Under 6 years 0.0689 (0.0758)
0.5937*** (0.0581)
0.2545** (0.1025)
-2.3041*** (0.2492)
6 - 14 years -0.0422 (0.0464)
-0.1762*** (0.0356)
-0.2162*** (0.0627)
-0.2619* (0.1525)
15 - 59 years (male) -0.0967** (0.0406)
-0.0949*** (0.0311)
0.5044*** (0.0549)
-0.9689*** (0.1333)
15 - 59 years (female) -0.0324 (0.0428)
-0.0687** (0.0328)
-0.1180** (0.0578)
0.0007 (0.1405)
60 years and over (male) 0.3259** (0.1466)
0.0153 (0.1123)
0.5438*** (0.1982)
-2.7695*** (0.4817)
60 years and over (female) -0.1188 (0.1162)
-0.0618 (0.0890)
-0.0173 (0.1570)
-0.2265 (0.3816)
Ln Expenditure -0.6946*** (0.0611)
0.1419*** (0.0468)
-0.0432 (0.0826)
5.0168*** (0.2006)
POSYANDU 0.0665 (0.1178)
0.2344*** (0.0902)
-0.5653*** (0.1592)
1.0108*** (0.3869)
Constant 16.0929*** (0.8002)
0.0434 (0.6130)
10.5731*** (1.0817)
-28.7597 (2.6289)
R-square 0.0316 0.0465 0.0392 0.1935
F 24.42 36.51 30.53 179.69
P 0.0000 0.0000 0.0000 0.0000
N 10503 10503 10503 10503
Source: Author calculation based on IFLS data Note: Standard errors are shown in parentheses. * Denotes statistical significance at 10% level. ** Denotes statistical significance at 5% level. *** Denotes statistical significance at 1% level.