Embed Size (px)
Citation preview

VOLUME 115, NUMBER 16 AUGUST 11, 1993 0 CoDvrkht 1993 bv the TOURNAL
OF THE w ~ - _ I American Chemical Society
AMERICAN CHEMICAL SOCIETY
Intramolecular Elect ron-Tr ans fer Rates in Ferrocene-Derivatized Glucose Oxidase
Antonella Badia, Rina Carlini, Arthur Fernandez, Fernando Battaglini, Susan R. Mikkelsen,' and Ann M. English'
Contribution from the Department of Chemistry and Biochemistry, Concordia University, 1455 de Maisonneuve Boulevard, West Montreal, Quebec, Canada H3G lM8
Received September 18, 1992
Abstract: Glucose oxidase (GOx) was covalently modified at pH 7.2 with ferrocenecarboxylic acid (FCA), ferrocenedicarboxylic acid (FDA), and ferroceneacetic acid (FAA) using 1-ethyl-3-( 3-(dimethy1amino)propyl)- carbodiimide hydrochloride (EDC) and N-hydroxysulfosuccinimide to promote selective coupling to surface lysines. Reagent ratios were varied to obtain derivatives with 5-12 ferrocene groups per GOx dimer and 260% activity. For comparison, GOx was derivatized with FCA in the presence of 3 M urea using only EDC as a promoter. Varying reagent ratios yielded derivatives with 4-39 FCA groups per GOx and 530% activity; linear sweep voltammetry results showed a slow but readily detectable release of FCA upon storage of these derivatives. Tryptophan fluorescence quenching in two media, 0.1 M phosphate buffer (pH 7.0) and 8 M urea, confirmed that GOx was covalently modified and not merely associated with ferrocene. In all cases, the GOx derivatives exhibited significantly greater quenching than controls containing native GOx with free ferrocenes. The results of voltammetric dilution experiments (performed in oxygen-free solutions in the presence of excess glucose) were consistent with rate-limiting intramolecular electron transfer from the reduced flavin centers to bound ferricinium. Using an expression derived here, values between 0.16 and 0.90 s-1 were obtained for intramolecular electron transfer in the FCA derivatives, suggesting that the location (rather than the number) of bound ferrocene groups is rate-determining. Approximately lo3-fold slower intramolecular electron transfer was measured in an FDA derivative, consistent with fluorescence quenching data which indicated that bound FDA is more solvent-exposed than bound FCA. The results of lysine-targeted modification of GOx are interpreted in light of the recently published 3-D structure of GOx; since the critical flavin-lysine separations are all >23 A, an alternative approach is necessary to obtain GOx derivatives for use in a practical, reagentless glucose sensor.
Introduction immunoassays. Native GOx from Aspergillus niger is a 160-kD dimeric glycoprotein containing - 30% carbohydrate' and two
are essential for activity.8 The amino acid sequence has been
The covalent derivatization of glucose oxidase (GOx) with low
(Fc) derivatives, has received considerable attention in recent molecular weight electron-transfer mediators, such as ferrocene flavin adenine (FAD) cofactors that
years.'" Interest in these species exists because of their applications in reagentless biosensors or electrochemical enzyme (5) Bartlett, P. N.; Whitaker, R. G.;Grcen, M. J.; Frew, J. J . Chem. Soc.,
(6) Bartlett, P. N.; Bradford, V. Q.; Whitaker, R. G. Talanta 1991, 38,
(7) Kalisz, H. M.; Hecht, H.-J.; Schomburg, D.; Schmidt, R. D. Biochim.
(8) Pazur, J. H.; Kleppe, K.; Cepure, A. Arch. Biochem. Biophys. 1965,
Chem. Commun. 1987, 1603.
57.
Biophys. Acta 1991, 1080, 138.
111, 351.
* Authors to whom correspondence should be addressed. (1) Degani, Y.; Heller, A. J . Phys. Chem. 1987, 91, 1285. (2) Degani, Y . ; Heller, A. J . Am. Chem. SOC. 1988, 110, 2615. (3) Heller, A. Acc. Chem. Res. 1990, 23, 128. (4) Schuhmann, W.; 0hara.T. J.; Schmidt, H. L.; Heller, A. J . Am. Chem.
0002-7863/93/1515-7053$04.00/0
SOC. 1991, 113, 1394.
0 1993 American Chemical Society

1054 J. Am. Chem. Soc., Vol. I I S , No. Ib, I993
determined from the cloned A. niger gene,9 and the crystal structure of the deglycosylated enzyme has been resolved to 2.3 A.10
In GOx-catalyzed oxidation of glucose, FAD is reduced to FADHz and reoxidized by 02:
@-D-glucose + FAD-GOX - D-glucono-&lactone + FADH,-GOx (1)
F A D H y G O x + 0 2 - FAD-GOX + H20, (2)
Oxygen can be replaced (eq 2) by redox reagents such as ferricinium derivatives, and ferrocene/ferricinium (FC/FC+) couples have also been used for hetereogeneous mediation of electron transfer between GOx and amperometric electrodes.'' Since FAD is buried > 13 A below the surface of GOx,l0 direct electron transfer between the enzyme and an electrode surface is not observed, although free FAD transfers electrons with a variety of electrodes12 according to
FAD + 2H' + 2e-+ FADH,
Eo' = -219 mV (vs N H E , pH 7.0)13 (3) Degani and Heller first reported that GOx can be made
electroactive (wired) with only 40% loss of activity by covalently binding ferrocenemonocarboxylic acid (FCA) to lysine residues.' In their scheme, a glucose-sensitive electrocatalytic current results from oxidation of FCA a t the electrode surface and its reduction by FADHz by intramolecular electron transfer:
Badia et al.
electrode FADH,-GOx-(FCA), + FADH,-GOx-(FCA'), + ne-
(4)
FADH,-GOx-( FCA'), - FAD-GOX-(FCA)~(FCA'),, + 2H' ( 5 )
Carbodiimides are effective agents for promoting amide bond formation between carboxylicacids and primary amines.14 Native GOx possesses 32 reactive amino groups,15 and l-ethyl-3-(3- (dimethy1amino)propyl)carbcdiimide hydrochloride (EDC) has been used to target FC mediators to these groups. Reproducible derivatization with FCA required the presence of urea, and it was concluded that the protein partially unfolds in 3 M urea to expose primary amino groups.' Using this procedure, 12 f 1 molecules of FCA and 13 f 1 molecules of FAA were attached to GOx,, while Bartlett and co-workers5 reported average attachments of 13 FCA, 20 ferroceneacetic acid (FAA), and 27 ferrocenebutanoic acid (FBA) groups per GOx. Although mediation is thermodynamically very favorable in each case, FAA- modified GOx exhibited the highest biochemical and electro- chemical activities.5
(9) (a) Kriechbaum, M.; Heilmann, H. J.; Wientjes, F. J.; Hahn, M.; Jany, K.-D.; Gassen, H. G.; Sharif, F.; Alaeddinoglu, G. FEBS Lett. 1989,255,63. (b) Frederick. K. R.; Tuna, J.; Emerick, R. S.; Masiarz. F. R.; Chamberlain, S.H.;Vasavada, A.; Rmel;berg,S.;Chakraborty, S.;Schopter, L. M.; Massey, V. J. Biol. Chem. 1990, 265, 3793.
(10) Hecht, H.-J.; Kalisz, H. M.; Hendle, J.; Schmid, R. D.; Schomburg, D. J. Mol. Biol. 1993, 229, 153.
(1 1) Cass, A. E.; Davis, G.; Francis, G. D.; Hill, H. A. 0.; Aston, W. J.; Higgins. I. J.; Plotkin, E. V.; Scott, L. D. L.; Turner, A. P. F. Anal. Chem. 1984, 56, 667.
(12) Bowers, M. L.; Yenser, B. A. Anal. Chim. Acta 1991, 243, 43. (13) This Eo' value is for free FAD (Handbook of Biochemistry and
Molecular Biology, Physical and Chemical Data, 3rd ed.; CRC Press: Cleveland, OH, 1976; Vol. 1, p 127). E1/2valueS for the twoelectron transfers to GOx-bound FAD have been measured (Stankovich, M. T.; Schopfer, L. M.; Massey, V. J. Biol. Chem. 1978,253,4971). The reported values are -63 and -65 mV for addition of the first and second electrons, respectively, at pH 5.3, and -200 and -240 mV at pH 9.3.
(14) (a) Hoare, D.; Koshland, D. E. J. Am. Chem. Soc. 1966,88,2057. (b) Hoare, D.; Koshland, D. E. J. B i d . Chem. 1967, 242, 2447.
(15) Wolowacz, S. E.; Yon Hin, B. F. Y.; Lowe, C. R. Anal. Chem. 1992, 64,1541. Each GOx monomer possesses 15 lysine residues and one N-terminal primary amino group.
Scheme I. EDC-Promoted Amide Bond Formation between FCA and GOx in the Absence (Pathway a) and Presence of N H S (Pathway b)d
XH is any nucleophilic species such as tyrosine -OH, cysteine -SH, or lysine and N-terminal -NH2 groups.
The Oacylisourea intermediate (Scheme Ia), formed between EDC and the -COOH groups of the FC derivatives, is expected to show reactivity toward nucleophiles other than primary amino groups. In addition to undergoing hydrolysis, which yields the original carboxylic acid and a substituted urea, 0-acylisoureas are known to react with alcohols and thiols to form esters and thioesters.16J7 0-Acylisoureas can also rearrange to form stable N-acylureas.18
Succinimide esters, formed from the corresponding 0-acyl- isourea intermediates in the presence of N-hydroxysulfosuccin- imide (NHS, Scheme Ib), are resistant to hydrolysis19 and require a stronger nucleophile for acylation than the parent species. Furthermore, N H S esters have demonstrated high selectivity for lysine residues.Z0 Thus, the two intermediates are predicted to yield different products, and FCA-derivatized GOx species from both modification schemes are examined here.
Other FCs used to target lysine residues of GOx in the present study include FAA and ferrocenedicarboxylic acid (FDA). Experimental evidence for covalent modification of GOx was sought by examining protein tryptophan fluorescence, and a detailed investigation of the homogeneous (02-mediated) and heterogeneous (electrochemical) activities was carried out to determine kinetic parameters for the modified enzymes. Since FC groups undergo rapid electron-transfer kinetics at glassy carbon electrodes (ks > 0.5 cm/s for FCAZ1), voltammetry was used to determine intramolecular electron-transfer rates between FADH2 and FC+. The 3-D structure of GOx,Io which was published following completion of this study, is used to rationalize the results obtained to date.
Experimental Section
Mnterinls. Glucuseoxidase(G0x) fromAspergfZZicsniger(EC 1.1.3.4.) was obtained from Boehringer Mannheim (Grade 11) or from Sigma (Type X-S). Horseradish peroxidase (HRP, EC 1.1 1.1.7, 10 mg/mL suspension in 3.2 M ammonium sulfate, -250 units/mg), 4-(2- hydroxyethy1)- 1-piperazineethanesulfonic acid (HEPES), 1 -ethyl-3-(3- (dimethy1amino)propyl)carbodiimide hydrochloride (EDC), and Odi- anisidine dihydrochloride were obtained from Sigma; ferrocenemono- carboxylic acid (FCA), ferrocenedicarboxylic acid (FDA), ferroceneacetic
(16) Khorana, H. G. Chem. Reu. 1953, 53, 145. (17) DeLos, F.; DeTar, R. S.; Fulton, F. R. J . Am. Chem. Soc. 1966,88,
1024. (18) Lundblad, R. L. Chemical Reagents for Protein Modification, 2nd
ed.; CRC Press: Boca Raton, FL, 1991; pp 271-272. (19) Staros, J. V.; Wright, R. W.; Swingle, D. M. Anal. Biochem. 1986,
156, 220. (20) Brinkley, M. Bioconjugate Chem. 1992, 3, 2. (21) Matsue, T.; Evans, D. H.; Osa, T.; Kobayashi, N. J. Am. Chem. SOC.
1985, 107, 341 1.

Electron Transfer in Glucose Oxidase
Table I. Glucose Oxidase Modification Reactions’
J. Am. Chem. SOC., Vol. 115, No. 16, 1993 7055
reagent ratios product characterization
FC (mM) (mM) (mM) (M) FC:GOx activity(%) ~
none 0 0 0 0 0 0 0 0 3 0 0 40 0 3 0 0 40 0 0 0 0 40 50 0 0
FCA 32 36 0 3 3.6 63 100 0 3 8.5 80 200 0 3 13
100 140 0 3 2 9 f 3 50 100 75 0 5 i 1
100 200 75 0 12 FDA 50 50 75 0 7.5 FAA 50 50 75 0 10
100 92 24 60 73 30 22 29 11 61 64 69 60
a Solutions contained 100 pM GOx and the given concentrations of EDC, NHS, and urea in HEPES (pH 7.2) and were left standing at 4 OC for 15 h. acid (FAA), and a-D-glucose from Aldrich; N-hydroxysulfosuccinimide (NHS) from Pierce; 3-(2-pyridyl)-5,6-bis(4-phenylsulfonic acid)- 1,2,4- triazine (ferrozine) from ICN Biochemicals; Coomassie Brilliant Blue G-250 protein assay dye reagent from Bio-Rad; urea, mono- and dibasic sodium phosphate, and mono- and dibasic potassium phosphate from Fisher. All other chemicals were of the best available quality and were used as received. Other suppliers were as follows: Sephadex G-15 (I 1500 MW fractionationrange) gel filtrationresin (Pharmacia);YM 30(30 000 MWcutoff) ultrafiltrationmembranes andultrafiltrationcells (Amicon); Acrodiscsyringe filters (0.2- and 1.2-pm pore) (Gelman Sciences); glassy carbon working and Ag/AgCl reference electrodes (Bioanalytical Systems); and Pt wire (Fisher). All solutions were prepared using nanopure water.
Instrumentation. Absorption and fluorescence spectra were recorded on Hewlett-Packard (Model 8451A), Varian (Cary I) , and Shimadzu (Model RF-5000) instruments. Electrochemical experiments were performed on a BAS- lOOA electrochemical analyzer (Bioanalytical Systems).
Methods. COX Modification Procedures. Table I summarizes the reagent concentrations used for covalent modification reactions and controls. The ferrocene derivative was dissolved, aided by sonication, in 0.15MNa-HEPES(pH9.6),thepHwasadjustedto7.3 f 0 . 1 withHC1, and the solution was cooled to 0 OC. EDC (and NHS for the EDC-NHS procedure) was added, and after 30 minof activation (20 min of activation followed by the addition of 0.18 g/mL urea for the EDC-urea procedure) the pH was readjusted to 7.3 and GOx (15 mg/mL) was added. The reaction mixture was left standing at 4 OC for 15 h; if turbid, the resulting orange solution was centrifuged, filtered, and concentrated to -2 mL by ultrafiltration. GOx-(FC), was separated from excess reagents by gel filtration on a 1.5- X 43-cm G-15 column and stored at 4 OC for -20 h before being subjected to a second gel filtration. The samples were sterilized by filtration through 0.2-pm pore filters and stored in 0.085 M NaPi buffer (pH 7.0) in sterile glass vials at 4 OC. Derivatization of GOx with FAA and FDA was performed using the EDC-NHS procedure only.
Total Protein and Iron Quantitation. Protein concentrations were determined spectrophotometrically using Coomassie Blue22 following the standard procedure supplied by Bio-Rad. The iron content of the GOx- (FC), samples was determined as previously des~ribed.~) The procedure involves the demetalation of the ferrocene with concomitant protein precipitation by trichloroacetic acid, followed by complexation of the free iron with ferrozine, a colorimetric reagent for iron. The detection limit for iron using this procedure is 0.01 ppm, corresponding to -0.2 pM FC.23
Relative Enzyme Activities. The activities of GOx-(FC). relative to native GOx were measured using the coupled peroxidase-0-dianisidine assay p r o c e d ~ r e ~ ~ , ~ ~ in 02-saturated KPi buffer (0.1 M, pH 7.0) at 23 OC.
(22) Bradford, M. M. Anal. Biochem. 1976, 72, 248. (23) Badia,A.;Thai,N.H.H.;English,A.M.;Mikkelsen,S.R.;Patterson,
(24) ~OrthingtonEnsymeManual; Worthington Biochemical Corp.: New R. T. Anal. Chim. Acra 1992,262, 87.
Jersey, 1972; p 19.
Biochemicals: Indianapolis, IN, 1987; p 27. (25) Keesey, J. Biochemical Information; Boehringer Mannheim
aoo 400 100 000
Wavrlanglh, nm
Figure 1. Absorption spectra following gel filtration of (A) 25 pM GOx and samples that have been exposed to (B) urea, (C) EDC and NHS, (D) EDC, (E) EDC and urea. Concentrations of the reagents used are given in Table I. Spectra were recorded in 0.1 M KPi buffer, pH 7.0.
Protein Fluorescence Studies. Emission spectra between 290 and 500 nm of 0.36 pM native GOx and GOx-(FC), were obtained on excitation at 280 nm with excitation and emission slits of 5.0 nm. All spectra were corrected for inner-filter effects26a using Fc = Fo antilog[(& + Ac,)/2], where Fc and Fo are the corrected and observed emission intensities and A,, and A,, are the absorbances at the excitation and emission wavelengths, respectively. GOx and GOx-(FC), samples were incubated in 8 M urea overnight at 4 OC before the emission of the unfolded proteins wasrecorded. Emissionspectraof theGOx-(FC),samples werecompared to those of noncovalent mixtures containing identical FC:GOx ratios.
Average distances between the bound FC groups and tryptophan residues of GOx were calculated using Farster theory of resonance energy transfer.2’ Theefficiency of energy transfer (E) is related to the separation ( r ) between the donor (Trp) and acceptor (FC):
E = rd/(rd + Rod) where & is the distance at which E = 0.5 and is defined by
Ro = 9.19 X lo’ (K2n4QaJ)”6 (7) where ~2 = 2 / 3 , assuming random orientation between donor and acceptor;26b n = 1.33, the refractive index of the protein solution; Qa = 0.2, the quantum yield for tryptophan fluorescence in the absence of acceptor;28 and Jisthe spectral overlap integral. Jvalues were determined graphi~ally2~ over the spectral region from 290 to 450 nm for each FC.
Voltammetry. A conventional three-electrode cell was used with a glassy carbon working electrode of 0.075-cm2 area (which was polished with alumina and sonicated prior to each run) and a Ag/AgCl reference and Pt auxiliary electrodes. Immediately following gel filtration, 1 mL of GOx or GOx-(FC), solutions was added to the cell and deoxygenated, and electrochemical measurements were performed under a continuous Nz purge. Deoxygenated, mutarotated glucose solutions were transferred by gas-tight syringe to the cell, and voltammograms were recorded from 0.0 to 0.5 V (vs Ag/AgCI) at a scan rate of 2 mV/s, unless otherwise noted.
Results
Activity of COX-(FC),, Derivatives. The results obtained for the coupling reactions are summarized in Table I. The first five entries list the activities of the GOx controls, and their visible absorption spectra are shown in Figure 1. GOx incubated with 3 M urea retains 92% activity and exhibits high FAD absorption (Figure lB), whereas incubation with both urea and EDC yields a species that has only 24% activity and low FAD absorption (Figure 1E). Incubation of GOx with EDC and NHS in the absence of urea gives a GOx species with 73% activity and intermediate FAD absorption (Figure IC). In the presence of
(26) Lakowicz, J. R. Principles of Fluorescence Spectroscopy; Plenum Press: New York, 1983; (a) pp 303-316; (b) pp 354-363.
(27) Campbell, I. D.; Dwek, R. A. Biological Spectroscopy; Benjamin Cummings: Menlo Park, CA, 1984; pp 113-1 18.
(28) Weber, G.; Teale, F. W. J. Discuss. Faraday Soc. 1959, 134.

1056 J. Am. Chem. Soc.. Vol. 115, No. 16, 1993 Badia et al.
- I 60 1
2 0 ' ' ' ' ' ' ' ' " 0 1 2 3 4 5 6 7 8 9
[Urea], M
Figure 2. Fluorescence intensity at 350 nmof 0.36pM GOx as a function of urea concentration; hx = 280 nm; slit widths = 5 nm.
Table 11. Fluorescence Maxima (A,) and Relative Fluorescence Intensities (%F) for GOx and GOx-(FC), in Pi Buffer and in 8 M Ureaa
buffer
protein GOx GOxC GOxc GOx-(FCA)l$ GOx-(FCA)ao GOx-(FCA)12 GOx-( FAA) 10 GOx-(FDA)12
reaction
EDC-urea
EDC-urea EDC-urea
ED C - N H S
EDC-NHS EDC-NHS EDC-NHS
L x (nm) 334 338 336 338 338 336 336 336
%F 100 113 101
-
56 32 65 58 76
r(FC-Trp),e 8 M ureab (4 %F
100 85
104 17 70 15 28 18 86 17 71 24 88
0 All samples contained 0.36 pM GOx in 0.1 M NaPi, pH 7.0; X, = 280 nm. Samples were left standing overnight in 8 M urea to ensure protein unfolding; A, = 350 nm in each case. Samples exposed to EDC and 3 M urea and EDC and NHS in the absence of FC. GOx- (FCA)l2 etc. represent GOx derivatized with 12 FCA groups, etc. FC- Trp distances were calculated using eq 6 with & = 16.2, 16.7, and 17.1 A for FCA, FAA, and FDA, respectively.
FC similar results were obtained; for example, the activity of GOx-(FCA)12from theEDC-NHS reaction (64%) is significantly greater than that for GOx-(FCA)13 from the EDC-urea reaction (29%). Thus, the low activity (630%) of the EDC-urea-exposed GOx-(FCA), is due mainly to urea-promoted inactivation of GOx by EDC, leading to FAD loss. Figure 2 shows the dependence of GOx fluorescence on urea concentration. The increased emission intensity observed upon unfolding in urea is typical of proteins containing chromophores such as FAD that quench fluorescence by resonance energy transfer. From Figure 2, it is clear that >5 M urea is required for unfolding of GOx, but partial unfolding may allow EDC to access buried carboxylates such as the side chain of Glu50 which forms a strong hydrogen bond with the ribose moiety of FAD.10
Degani and Hellerl.2 used 1000- and 1400-fold excesses of FCA and EDC over GOx in 3 M urea and report GOx derivatives with 12 i 1 FCA groups and 60% activity. Under their conditions we isolated GOx derivatives with 29 i 3 FCA groups and - 1 1% activity. On changing the FCA and EDC concentrations used for the coupling reactions in 3 M urea, GOx-(FC), derivatives with 2 I n I 39 and 130% activity were obtained. Because of the low activity of all GOx-(FCA), prepared in 3 M urea, the EDC-NHS procedure was used exclusively in our further studies. Substitution of FAAor FDA for FCA in the EDC-NHS coupling reaction yielded GOx-(FC),derivatives with n values and activities similar to those of the FCA derivatives (Table I). This suggests that the same subset of GOx lysines may be modified in each case.
Protein Fluorescence of COX and COX-(FC),. Table I1 lists the fluorescence maxima and their intensities for the various GOx derivatives relative to noncovalent mixtures of GOx with free
+0.500 1 1 = *- ____--*- _c___-----
--- +o.wo
/ E[VoLT1 Figure 3. Linear sweep voltammetry of 3OpM GOx-(FCA)l3 in oxygen- free 0.085 M phosphate buffer, pH 7.2. (A) No glucose present. (B) l0mM glucose. Voltammetry was performed at a glassy carbon electrode (0.075 cm2) at 0.002 V/s.
FCs. The 2-4-nm red shift in the emission maxima of the GOx- (FC), samples is also observed for the controls, so FC deriva- tization alone does not appear to cause any global perturbation of the tertiary structure of GOx. Extensive quenching of tryptophan fluorescence was observed for GOx-(FC), but not for noncovalent mixtures containing FC:GOx ratios up to 40. Thus, diffusional quenching is not efficient a t these quencher concen- trations.
The fluorescence maxima of all samples shift to -350 nm in 8 M urea, consistent with polypeptide unfolding and exposure of tryptophan residues to the aqueous environment.26b A comparison of the fluorescence in 8 M urea of GOx-(FC), and noncovalent mixtures of GOx and nFC shows that unfolding does not relieve quenching. Therefore, tryptophanfluorescence quenching must be due to covalently-bound FC in the unfolded states of GOx, confirming that the FC groups are not just trapped in the folded polypeptide matrix.
5.79 X 10⁻¹⁶, and 6.96 X cm3 M-I and & values of 16.2, 16.7, and 17.1 A were
obtained for FCA, FAA, and FDA, respectively, assuming FBrster resonance energy transfer (eq 7). From the observed quenching and the calculated & values, average FC-to-Trp separations (r, Table 11) were calculated for the different derivatives (eq 6). Interestingly, the GOx-(FDA)12 derivative is significantly more fluorescent in buffer than either the GOx-(FCA)12 or GOx- (FAA)loderivativesdespite similar nvalues, yielding anestimated FDA-Trp separation that is 7 A greater than either the FCA- Trp or FAA-Trp distances.
Electrochemical Titration of COX-(FC),. Voltammetry in an oxygen-free environment was used to characterize the electro- chemical properties of the covalently-bound FC groups a t the surface of a glassy carbon electrode. In the absence of glucose, voltammograms of GOx-(FC),, obtained immediately after gel filtration resembled control voltammograms of solutions con- taining the same concentration of native GOx (Figure 3A). However, voltammetric responses characteristic of the reversible one-electron FCA/FCA+ couple appeared after a few days of storage a t 4 O C of GOx-(FCA), prepared by the EDC-urea method (but were not observed for derivatives prepared by the EDC-NHS method). The effect of storage time on voltammetric peak currents was studied using GOx-(FCA)39 prepared by the EDC-urea method. Anodic peak currents (iPJ obtained for this sample in the absence of glucose and 0 2 were recorded as a function of scan rate (v) over the 2-200 mV/s range, and plots of ip,p against v l f2 were linear with slopes of 1.30, 1.88, 2.40, and 3.17 pA(V/s)l/Zon days 6,9,22, and 39, respectively. Since the slope is proportional to the square root of the apparent diffusion coefficient of the electroactive species, and since the diffusion coefficient of free FCA is -10-fold higher than that of bound FCA, the increasing slope indicates an increase in the concen- tration of free FCA in the GOx-(FCA)a9 sample with storage time. Iron analysis of aliquots of this sample following gel
Overlap intergrals of 4.87 X

Electron Transfer in Glucose Oxidase J . Am. Chem. SOC., Vol. 115, No. 16, 1993 7057
2o i 0 ' I
0 2 4 6 8 10
[Qlucose], mM
Figure 4. Voltammetric glucose titration curve for 50 pM GOx-(FCA)u prepared using the EDC-urea procedure. Potential was scanned at 2 mV/sin0.085 M phosphate buffer, pH 7.2. Anodiccurrent was measured at +400 mV vs Ag/AgCl. Eadie-Hofstee analysis of these data yields an apparent Km value of 0.3 mM.
Table III. Limiting Anodic Currents (i-) for GOx-(FC), and GOx with Free FCa
GOx-(FCA)8,5 0.042 GOx-(FAA) 10 0.61 GOx-( FDA) 12 0.029
2.8 1.1 1 .o
a The concentration of GOx-(FC). was 25 pM, and the GOx and free FC concentrations were also taken to be 25 pM for the i, calculations. This corresponds to an active-site concentration of 50 pM. i, values were calculated using eq 12 (see text). filtration showed a constant n = 39 f 1 over 40 days, underscoring the sensitivity of the electrochemical measurements to traces of free FCA and the necessity of carrying out voltammetric measurements immediately following gel filtration. This was done routinely for all experiments discussed below.
Electrochemical titrations of GOx-(FC), with glucose in the absence of 0 2 were performed by measuring the electrocatalytic current at +400 mV vs Ag/AgCl. The voltammogram obtained for GOx-(FCA)13, prepared according to the EDC-NHS pro- cedureand purified by gel filtration immediately prior to titration with glucose, is shown in Figure 3B. Figure 4 shows a typical plot of anodic current against glucose concentration. For all derivatives studied, apparent Km values below 0.3 mM were obtained. Observed limiting anodic currents at saturating glucose (i,,) for selected GOx-(FC), are listed in Table 111. Also listed in Table I11 are i,, values calculated using the kinetic model described below for 1:l solutions of GOx and free FC.
Voltammetric Determination of FADH*/FADH to FC+ Elec- tron-Transfer Rates. The current generated by the electrochem- ical oxidation of free FC to FC+, followed by bimolecular reduction of FC+ by FADHz/FADH'-GOx, can be described by the catalytic reaction scheme, E R C ( . ~ ~ ~ ~ ~ This scheme consists of a reversible electrochemical reaction followed by rate-limiting, irreversible, bimolecular chemical reactions that regenerate the electrochemical reactant, thus:
electrode
ki
F C F C + + e - (8)
FC+ + FADH2-GOx - F C + FADH'-GOx + H+ (9)
FC+ + FADH'-GOx - F C + FAD-GOx + H+ (1 0) ki
k3 FAD-GOX 4 FADH2-GOx (1 1)
where k3 = kat/(l + K,/[glucose]). With a saturating glucose (29) Hill, H. A. 0.; Sanghera, G. S. Biosensors: A Practical Approach;
IRL Press: Oxford, 1990; pp 19-23. (30) Bard, A. J.; Faulkner, L. R. Electrochemical Methods; Wiley: New
York, 1980; (a) pp 455-461; (b) pp 133-134; (c) pp 420487.
concentration, FAD is instantaneously reduced by glucose to FADH2, so the limiting anodic current, i,,, is independent of voltage scan rate and is given by29
i,,, = FA(2D,ckoa[GOx])"2[FC] (12) WhereFistheFaradayconstant (96 487 C/mol), A is theelectrode area (0.075 cm2), DFC is the diffusion coefficient of FC (3 X 10⁻⁶ cm2/s for FCA at 25 kob = klkz/(kl + k2), and [GOx] is the active-site concentration. Values of kob are obtained from the slopes of plots of i,,,/ [FC] vs [GOx] ll2. The calculated i,, values in Table I11 assume equimolar solutions of GOx and FC and use previously determined kob values [2.01 X lo5 (FCA"), 0.26 X 10⁵ (FDA"), and 0.29 X 10⁵ M-l s-1 (FAA, this work)].
For intramolecular electron transfer from FADHz/FADH' to FC+ groups on the same GOx molecule, we consider an electron- proton-electron-proton type of mechanism:
electrode FADH,-GOx-(FC), +
FADH2-GOx-(FC),,(FC+) + e- (13)
FADH,-GOx-(FC),,(FC+) - FADH'-GOx-(FC), + H+ ki
(14) electrode
FADH'-GOx-(FC), +
FADH'-GOx-(FC),,(FC+) + e- (15) ki
FADH'-GOx-(FC),,(FC+) - FAD-GOx-(FC), + H+ (16)
ki FAD-GOx-(FC), -+ FADHyGOx-(FC), (17)
where k3 is again equal to kat/( 1 + Km/ [glucose]). In this scheme, electron-hopping from FC to FC+ is not considered (see Dis- cussion), and i,,, is given by
i,,, = 2FA(D,,,k,,)'/Z[GOx-(FC),] (18) where kobis now equal to klk2/(k11/2 + k2lI2), (the full derivation is given in the Appendix). In this case, the normalized limiting anodic current is independent of protein concentration, and kob can be obtained from the plot of i,,/[GOx-(FC),] vs [GOx- (FC),]1/2, since the limiting y-value at high enzyme dilution is
Voltammetric dilution experiments were performed to deter- mine electron-transfer rates from FADHz/FADH' to covalently- bound and freely-diffusing FC+. Figure 5A shows these plots for GOx-(FCA)8.5 andGOx-(FCA)ls obtained by successive dilutions with 10 mM glucose. The i,,,/[GOx-(FC),] and the corre- sponding kob values, calculated from eq 18 (Dm, = 4.1 X 10⁻⁷ cm2/s)2 after correcting for activity loss due to FAD loss, are listed in Table IV. The decrease in normalized current with increasing concentration in Figure 5A is attributed to aggregation of modified GOx. For comparison, Figure 5B shows the results of a similar voltammetric dilution experiment performed on a solution of native GOx spiked with free FCA (eq 12). The slope of the line in Figure 5B is FA(2D~ck,b)l/~ (eq 12), and using the values given above for DFC and A, the observed bimolecular rate constant is 1.3 X 10⁵ M-l s-l, in good agreement with that published
An intramolecular rate constant was not determined for GOx- (FAA)lo since cyclic voltammograms of this derivative showed the presence of free FAA even after repeated gel filtrations, and dilution experiments did not yield normalized anodic currents that were independent of protein concentration, revealing non- covalent association.
2FA(Dcjo,.k0b) 1/2.
(2.01 x 10⁵ M-I ~-1).11
Discussion
Tryptophan fluorescence quenching provides experimental confirmation that covalent FCA and FDA derivatives of GOx
1058 J. Am. Chem. SOC., Vol. 115, No. 16, 1993 Badia et al.
25 r 1
I A 2 E 2 0 }
b b b e
e n i l 3
0 1 1 0.0 1 .o 2.0 3.0 4.0
[GOx-(FCA)J'", M"'x10'
60 I I ,,,' j I B
1 E
< g 20 4 I .-
0 1 . 0.0 2.0 4.0 6.0 8.0
[QOxl'", M"'x10'
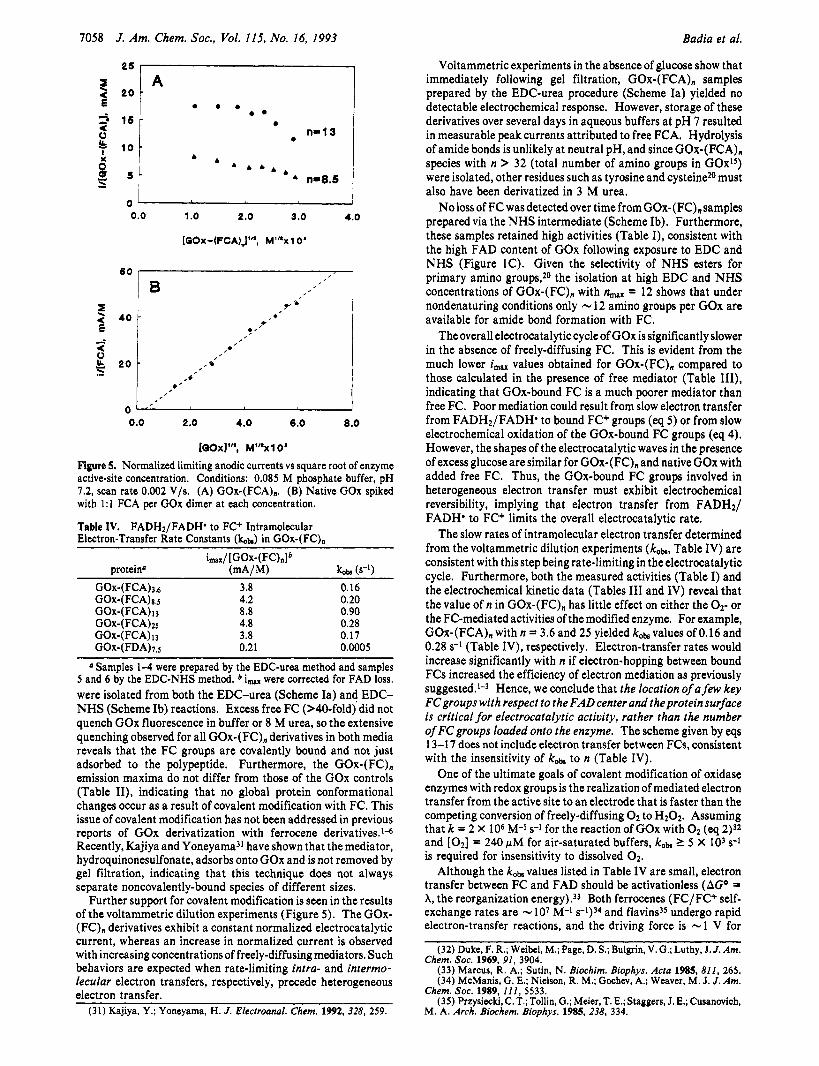
Figure 5. Normalized limiting anodic currents vs square root of enzyme active-site concentration. Conditions: 0.085 M phosphate buffer, pH 7.2, scan rate 0.002 V/s. (A) GOx-(FCA),. (B) Native GOx spiked with 1:l FCA per GOx dimer at each concentration.
Table IV. FADHz/FADH* to FC+ Intramolecular Electron-Transfer Rate Constants (bb) in GOx-(FC),
La/ [G0x-(FC),lb protein" (mA/M) kotd (s-9
GOx-(FCA)3.6 3.8 0.16
GOx-(FCA)13 8.8 0.90 GOx-(FCA)25 4.8 0.28 GOx-(FCA)13 3.8 0.17 GOX-(FDA)~,J 0.21 0.0005
0 Samples 1-4 were prepared by the EDC-urea method and samples 5 and 6 by the EDC-NHS method. * i,, were corrected for FAD loss. were isolated from both the EDC-urea (Scheme Ia) and EDC- NHS (Scheme Ib) reactions. Excess free FC (>40-fold) did not quench GOx fluorescence in buffer or 8 M urea, so the extensive quenching observed for all GOx-(FC), derivatives in both media reveals that the FC groups are covalently bound and not just adsorbed to the polypeptide. Furthermore, the GOx-(FC), emission maxima do not differ from those of the GOx controls (Table 11), indicating that no global protein conformational changes occur as a result of covalent modification with FC. This issue of covalent modification has not been addressed in previous reports of GOx derivatization with ferrocene derivatives.1-6 Recently, Kajiya and Yoneyama31 have shown that the mediator, hydroquinonesulfonate, adsorbs onto GOx and is not removed by gel filtration, indicating that this technique does not always separate noncovalently-bound species of different sizes.
Further support for covalent modification is seen in the results of the voltammetric dilution experiments (Figure 5 ) . The GOx- (FC), derivatives exhibit a constant normalized electrocatalytic current, whereas an increase in normalized current is observed with increasing concentrations of freely-diffusing mediators. Such behaviors are expected when rate-limiting intra- and intermo- lecular electron transfers, respectively, precede heterogeneous electron transfer.
(31) Kajiya, Y.; Yoneyama, H. J . Electroanal. Chem. 1992, 328, 259.
GOx-(FCA)s,5 4.2 0.20
Voltammetric experiments in the absence of glucose show that immediately following gel filtration, GOx-(FCA), samples prepared by the EDC-urea procedure (Scheme Ia) yielded no detectable electrochemical response. However, storage of these derivatives over several days in aqueous buffers a t pH 7 resulted in measurable peak currents attributed to free FCA. Hydrolysis of amide bonds is unlikely at neutral pH, and since GOx-(FCA), species with n > 32 (total number of amino groups in GOxlS) were isolated, other residues such as tyrosine and cysteinez0 must also have been derivatized in 3 M urea.
N o loss of FC was detected over time from GOx-(FC), samples prepared via the N H S intermediate (Scheme Ib). Furthermore, these samples retained high activities (Table I), consistent with the high FAD content of GOx following exposure to EDC and NHS (Figure IC). Given the selectivity of N H S esters for primary amino groups,2O the isolation at high EDC and NHS concentrations of GOx-(FC), with nmx = 12 shows that under nondenaturing conditions only - 12 amino groups per GOx are available for amide bond formation with FC.
The overall electrocatalytic cycle of GOx is significantly slower in the absence of freely-diffusing FC. This is evident from the much lower i,, values obtained for GOx-(FC), compared to those calculated in the presence of free mediator (Table 111), indicating that GOx-bound FC is a much poorer mediator than free FC. Poor mediation could result from slow electron transfer from FADHz/FADH' to bound FC+ groups (eq 5 ) or from slow electrochemical oxidation of the GOx-bound FC groups (eq 4). However, the shapes of the electrocatalytic waves in the presence of excess glucose are similar for GOx-(FC), and native GOx with added free FC. Thus, the GOx-bound FC groups involved in heterogeneous electron transfer must exhibit electrochemical reversibility, implying that electron transfer from FADH2/ FADH' to FC+ limits the overall electrocatalytic rate.
The slow rates of intramolecular electron transfer determined from the voltammetric dilution experiments (kob, Table IV) are consistent with this step being rate-limiting in the electrocatalytic cycle. Furthermore, both the measured activities (Table I) and the electrochemical kinetic data (Tables I11 and IV) reveal that the value of n in GOx-(FC), has little effect on either the 02- or the FC-mediated activities of the modified enzyme. For example, GOx-(FCA), with n = 3.6 and 25 yielded kob values of 0.16 and 0.28 s-l (Table IV), respectively. Electron-transfer rates would increase significantly with n if electron-hopping between bound FCs increased the efficiency of electron mediation as previously
Hence, we conclude that the location of a few key FCgroups with respect to the FAD center and the protein surface is critical for electrocatalytic activity, rather than the number of FC groups loaded onto the enzyme. The scheme given by eqs 13-1 7 does not include electron transfer between FCs, consistent with the insensitivity of kob to n (Table IV).
One of the ultimate goals of covalent modification of oxidase enzymes with redox groups is the realization of mediated electron transfer from the active site to an electrode that is faster than the competing conversion of freely-diffusing 0 2 to HzOz. Assuming that k = 2 X 10⁶ M-1 s-1 for the reaction of GOx with O2 (eq 2)32 and [Oz] = 240 pM for air-saturated buffers, kob 1 5 X IO3 s-1
is required for insensitivity to dissolved 0 2 .
Although the kob values listed in Table IV are small, electron transfer between FC and FAD should be activationless (AGO = A, the reorganization energy).33 Both ferrocenes (FC/FC+ self- exchange rates are - 107 M-1 s-1)34 and flavins35 undergo rapid electron-transfer reactions, and the driving force is -1 V for
(32) Duke, F. R.; Weibel, M.; Page, D. S.; Bulgrin, V. G.; Luthy, J. J . Am. Chem. SOC. 1969, 91, 3904.
(33) Marcus, R. A.; Sutin, N. Biochim. Biophys. Acta 1985, 811, 265. (34) McManis, G. E.; Nielson, R. M.; Gochev, A.; Weaver, M. J. J . Am.
Chem. SOC. 1989, 1 1 1 , 5533. (35) Przysiecki, C. T.; Tollin, G.; Meier, T. E.; Staggers, J. E.; Cusanovich,
M. A. Arch. Biochem. Biophys. 1985, 238, 334.

Electron Transfer in Glucose Oxidase J. Am. Chem. SOC., Vol. 115, No. 16, 1993 7059
NZ(l87 LYSl
Figure 6. Computer graphics display of the C, backbone of the GOx monomer, showing the location of the FAD group and the lysine residues (bold lines). This molecular graphics image was produced using the MidasPlus software system from the Computer Graphics Laboratory, University of California, San Francisco.39
electron transfer from FADH2/FADH' (EO' = -219 mV)13 to amide-linked FC+ (EO' = 773 mV).36 Activationless intraprotein electron-transfer rates have been fitted to ket (s-l) = l O I 3 exp- (-1.4d), where d is the edge-to-edge separation (A) of the redox sites.37 Substituting kob from Table 1V into this expression for kn, average redox-site separations of 21 and 26 A were determined for GOx-(FCA), and GOx-(FDA),,s.
Figure 6 shows the location of the 15 lysine residues in the GOx monomer relative to the FAD center. The shortest through- space distance between the N5 atom of the redox-active isoalloxazine ring and a lysine Nc atom is 23.6 A (Lysl52). Seven lysines are >30 from the FAD center, but six fall within 25 f 1 8, of the FAD N5 atom, which is remarkably close to the redox-site separation estimated from k,, for GOx-(FDA),,s but larger than that for GOx-(FCA),. Both FDA-modified and -unmodified lysine residues have charged side chains, whereas FCA-modified lysines are neutral, which should increase the affinity of the latter for the hydrophobic interior of GOx. This is consistent with the smaller FCA-Trp relative to FDA-Trp distances estimated from the fluorescence quenching experiments (Table II), given that the tryptophan residues of GOx are mainly buried.1°
Assuming edge-to-edge exponential decay, intramolecular electron-transfer rates of 1 5 X lo3 s-l should be obtainable by locating bound FCs within 16 A of the FAD centers. Computer graphics analysis shows that two glutamate and eight aspartate residues are within this distance from the FAD N5 atom, and targeting these residues should yield enhanced electron-transfer rates. Using the X-ray coordinates of GOx,lO a search for efficient electron tunneling pathways38 in the protein is currently underway to serve as a guide in the design of GOx derivatives for use in reagentless glucose sensors.
(36) The amide of FCA has Eo' = 773 mV vs NHE: Little, W. F.; Reilley,
(37) Moser, C. C.; Keske, J. M.; Warncke, K.; Farid, R. S.; Dutton, P. L.
(38) Beratan, D. N.; Betts, J. N.; Onuchic, J. N. Science 1991,252, 1285. (39) Ferrin, T. E.; Huang, C. C.; Jarvis, L. E.; Langridge, R. J. Mol.
C. N.; Johnson, J. D.; Sanders, A. P. J . Am. Chem. SOC. 1964, 86, 1382.
Nature 1992, 355, 796.
Graphics 1988, 6, 13.
Acknowledgment. Financial support from the Natural Sciences and Engineering Research Council of Canada is gratefully acknowledged. Professor Oswald S. Tee is thanked for many helpful discussions, and Tim Gadosy is thanked for preparing Scheme I.
Appendix Derivation of the Limiting Catalytic Current (i-) for Enzyme-
Bound Mediators. This derivation assumes the mechanism shown in e q s 13-1 7, in addition to reversible and diffusion-controlled ferrocene/ferricinium electrochemistry and glucose saturation. All enzyme species are assumed to possess an identical diffusion coefficient of DGO~. Enzyme concentrations represent the concentrations of active sites. The variable x represents distance from the electrode surface, and t is time following application of a potential in excess of the Eo' of the covalently-bound FCs. At all times and distances the total active-site concentration is [GOx- (FC),], and this is defined by
[GOx-(FC),] = [FADH,-GOx-(FC),] + [FADHZ-GOX-
(FC),,(FC')] + [FADH'-GOx-(FC),] + [FADHO-GOX-
(FC),, (FC')] + [ FAD-GOx-( FC),] (A 1)
The initial and boundary conditions30b are defined as follows:
t = 0, all x
[GOx-(FC),] = [FADH,-GOx-(FC),] (A2)
t > 0, x = 0, E >> Eo'
[ GOx-( FC),] = [ FADH~-GOX-(FC),, (FC')] + [ FADH'-GOX-(FC>,,(FC')] (A3)
DGox(a[FADH2-GOx-(FC),] /ax),,, = -&,,(a [ FADH,-GOx-( FC),, (FC')] /ax),,,,
DGox(a[FADH'-GOx-(FC),] /ax),,, = -DGO,(a[ FADH'-GOx-( FC),, (FC')] /d~),,o (A4)
t > O , x + a, E >> Eo'
[GOx-(FC),] = [FADH,-GOx-(FC),] (A5)
Under steady-state conditions, all five GOx-(FC), species have unchanging concentration gradients,3& and
a[ FADH,-GOx-( FC),] dZ[FADH2-GOx-(FC),] + ax2 at = DGOx
k-,[FAD-GOx-(FC),] 0 (A6)
- - 8 [ FADH,-GOx-( FC),, (FC')] a t
a'[ FADH~-GOX-(FC),~(FC')] - k , [FADHZ-GOX-
ax2 DGOx
a [ FADH'-GOx-(FC),] a2[FADH'-GOx-(FC),] + ax2 a t DGOx
kl[FADH,-GOx-(FC),l(FC')] = 0 (A8)
- a[ FADH'-GOx-( FC),, (FC')] - a t
a'[FADH'-GOx-(FC),, (FC')] - k,[ FADHO-GOx-
ax2 DGOx

7060 J. Am. Chem. SOC., Vol. 115, No. 16, 1993 Badia et al.
d[FAD-GOx-(FC),] d2 [ FAD-GOx-( FC),] + ax2 a t = D,,
k2[ FADH'-GOx-( FC),, (FC')] - k,[FAD-GOx-(FC),] = 0 (A10)
From eqs 13 and 15 in the text, the total electrocatalytic current is given by
i,, = FAD,,{(~[FADH~-GOX-(FC),] /ax),,, + (a[FADH*-GOx-(FC),] / ~ x ) , = O ) (A1 1)
To solve for the concentration gradient terms in eq A l l , the diffusional term in eq A10 is first neglected because the enzyme is saturated with glucose, to yield
k2[FADH'-GOx-(FC),,(FC+)] = k,[FAD-GOx-(FC),] (A121
Integrating eq A9 using the boundary conditions given in eqs A3 and A5 yields
[ FADW-GOx-( FC),, (FC')] = [F ADW-GOX-
(FC),,(FC+>l,=o exP{-x(k2/D,,)1/21 (A131 Similarily, for eq A7,
[FADH~-GOX-(FC),,(FC+)] = [FADHyGOx-
(FC),, (FC+)lx-O exp(-x( k, /DGOx)1/2) (A1 4, Taking the derivatives of A13 and A14, solving for x = 0, and using condition A4 yields
In the steady state, the consumption of electrons per unit time is the same for eq 13 and 15 (in the text), so the anodic currents and the fluxes of the two species are the same:
[FADH'-GOx-(FC),,(FC+)],,o(k2D~)1~2 = [FADH2-GOx-(FC),,(FC~)]x~o(klDGox)1~2 (A17)
Therefore, combining eqs A1 1 and A17 yields
i,,, = 2FA [ FADH2-GOx-(FC),, (FC+)lxiO(klDGOx) 'I2 (A181
Using eqs A3 and A17,
\FADH~-GOX-(FC),,(FC+)]~-~ = \GOx-(FC),]/ [ 1 + (kl/k2)1/21 (A1 9)
Substitution of eq A19 into eq A1 8 yields the final expression for the limiting voltammetric electrocatalytic current from the one- electron intramolecular regeneration of reduced mediator: