Embed Size (px)
Citation preview
Intraspecific differences in relative isotopic niche areaand overlap of co-occurring sharks
David Samuel Shiffman . Les Kaufman . Michael Heithaus . Neil Hammerschlag
Received: 11 September 2018 / Accepted: 8 March 2019
� Springer Nature B.V. 2019
Abstract Few studies have assessed whether pat-
terns of resource partitioning among sympatric marine
predators vary between different habitats. This type of
data is important for understanding food web func-
tioning as well as for supporting an ecosystem-based
fisheries management plan. In this study, we used d13Cand d15N stable isotope analysis to assess the relative
isotopic niche area (i.e., which species has the largest
and smallest isotopic niche area within a study site)
and core isotopic niche overlap between 299 sharks of
11 co-occurring shark species that vary in size, diet
and behavior in three coastal study areas in South
Florida. Overall, results show that the relative isotopic
niche area and patterns of core isotopic niche overlap
between some sympatric shark species varied between
sites, suggesting plasticity in resource use and com-
petitive interactions between shark species (e.g., 85%
of blacktip shark Carcharhinus limbatus standard
ellipse area overlapped with the blacknose shark C.
acronotus ellipse in Biscayne Bay, but there was no
overlap between these species’ ellipses in nearby
Florida Bay). Therefore, patterns of resource use and
trophic interactions documented among species from
one site may not be applicable to a neighboring
location. These findings may have implications for
food web models that incorporate trophic data from
Handling Editor: Telesphore Sime-Ngando.
Electronic supplementary material The online version ofthis article (https://doi.org/10.1007/s10452-019-09685-5) con-tains supplementary material, which is available to authorizedusers.
D. S. Shiffman (&) � N. Hammerschlag
Shark Research and Conservation Program, University of
Miami, 4600 Rickenbacker Causeway, Miami, FL 33149,
USA
e-mail: [email protected]
D. S. Shiffman � N. Hammerschlag
Leonard and Jayne Abess Center for Ecosystem Science
and Policy, University of Miami, 1365 Memorial Drive,
Coral Gables, FL 33146, USA
L. Kaufman
Department of Biology, Boston University Marine
Program, 1 Silber Way, Boston, MA 02215, USA
M. Heithaus
School of Environment, Arts, and Society, Florida
International University, North Miami, FL 33181, USA
N. Hammerschlag
Rosenstiel School for Marine and Atmospheric Science,
University of Miami, 4600 Rickenbacker Causeway,
Miami, FL 33149, USA
Present Address:
D. S. Shiffman
Earth to Oceans Group, Department of Biological Sciences,
Simon Fraser University, 8888 University Drive, Vancouver,
BC, Canada
123
Aquat Ecol
https://doi.org/10.1007/s10452-019-09685-5(0123456789().,-volV)( 0123456789().,-volV)
different areas for a species when local data are
unavailable.
Keywords Stable isotope analysis � Food web
ecology � Predator prey interactions � Sharks � Florida �Everglades
Introduction
The study of predator–prey interactions is complicated
by interspecific and intraspecific variation in the
resource use of predators and in their competitive
interactions with other species (Polis and Holt 1992).
In some cases, co-occurring predator species may
compete with one another for the same prey resources,
but in other cases they may minimize competition by
partitioning available resources (Schoener 1974).
Determination of the diet and associated trophic
relationships of sharks has been identified as research
priorities for the conservation and management of
shark species (Simpfendorfer et al. 2011), many of
which are threatened (Dulvy et al. 2014).
The assessment of shark diets and trophic interac-
tions is complex, because sharks are an ecologically
diverse group with considerable variation in size, diet
and trophic level both within and between species
(Cortes 1999; Hussey et al. 2015; Frisch et al. 2016). In
general, relatively few studies to date have compared
the spatiotemporal variation in diet breadth and
overlap of multiple co-occurring predators (Sanford
et al. 2003; Wieters et al. 2008). Both resource
partitioning (e.g., Papastamatiou et al. 2006) and
competition for resources (e.g., Bethea et al. 2004)
have been documented in communities of co-occur-
ring elasmobranch fishes. Spatiotemporal variation in
diets is common, but it is important to understand the
degree of variation in diet and dietary overlap within
and among shark species, and across habitats in order
to create ecosystem-based fisheries management plans
(Pikitch et al. 2004) and/or for generating ecological
risk assessments of threatened species (Gallagher et al.
2012).
Stable isotope analysis provides a non-lethal means
of studying aspects of elasmobranch resource use and
trophic dynamics (see Shiffman et al. 2012 for a
review). While there have been numerous diet and
stable isotope studies involving marine predators,
many focus on a single species or a single location, and
there has been a relative lack of research which has
considered how diet and trophic relationships among
an assemblage of sympatric marine predators could
vary intraspecifically across the range of those species
(Sanford et al. 2003; Wieters et al. 2008). Stable iso-
topic signatures of consumers may vary spatially,
temporally or by consumer body size, but few studies
have examined all of these variables simultaneously
(but see Davenport and Bax 2002; Heithaus et al.
2013; Matich and Heithaus 2014).
It is important to consider the possible effects of
temporal variation in baseline isotopic signature (i.e.,
not distinct patterns of resource consumption among
consumers) on the interpretation of consumer isotopic
signatures (e.g., Goering et al. 1990; Harvey et al.
2002). Baseline isotopic signature may vary season-
ally because of changing environmental conditions
that influence the growth of primary producers (e.g.,
Goering et al. 1990), or there may be interannual
variation (e.g., Anderson and Fourqurean 2003).
Additionally, the size of an individual consumer may
also influence its isotopic signature (more so than just
variation in diet between different-sized consumers),
and it is important to test for the effects of size
(reviewed in Martınez del Rio et al. 2009).
The coastal waters of South Florida provide an
opportunity to evaluate potential intraspecific (defined
here as between populations of a species located in
different habitats) differences in the trophic ecology of
sympatric sharks across distinct nearby habitats. South
Florida is home to a diverse community of sharks in
several distinct habitats which differ in depth, bottom
type, biodiversity and fishing pressure (Trent et al.
1997; Torres et al. 2006; Heithaus et al. 2007; Graham
et al. 2016). While these habitats are geographically
proximate and isotopically similar (described in the
study sites section of methods) and some shark species
regularly migrate much greater distances than the
distance between study sites used here, these study
sites are ecologically (in terms of relative biodiversity
and biomass of prey and possible competitive inter-
actions) and environmentally (in terms of bottom type
and depth) distinct enough to be considered separate
habitats. The present study used d13C and d15Nstable isotope analysis to investigate patterns of
relative isotopic niche area and core isotopic niche
overlap among 11 species of co-occurring sharks
within three distinct coastal areas of South Florida.
123
Aquat Ecol

Specifically, this study investigated the following
research question: Do patterns of relative isotopic
niche area, core isotopic niche overlap and other
standard isotopic metrics between sympatric shark
species vary across different habitats? We hypothe-
sized that since prey availability is generally similar
throughout South Florida and study species’ ranges
overlap, co-occurring species patterns of relative
isotopic niche area, core isotopic niche overlap and
other trophic interactions would remain constant
across different habitats.
Methods
Study sites
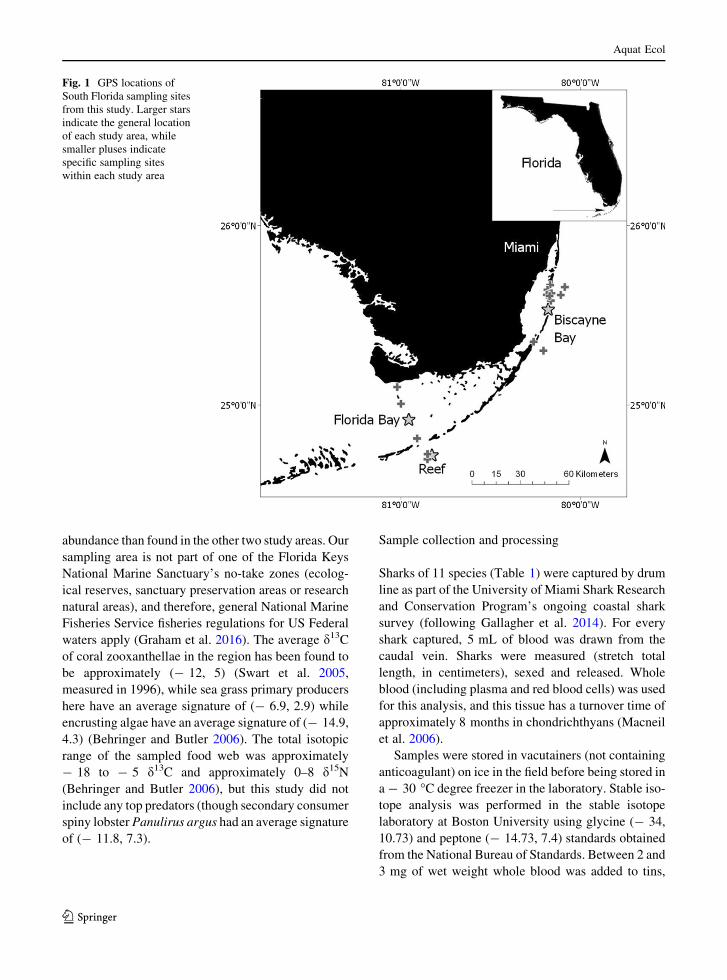
Sampling occurred year round (see supplementary
materials for N by month and year) in three geograph-
ically proximate, isotopically similar, but ecologically
and environmentally distinct coastal habitat in South
Florida: Biscayne Bay, Florida Bay and the Florida
Keys Reef, locations that vary in depth, bottom type,
prey biodiversity and biomass, and fishing pressure
(Fig. 1). These sites also vary slightly (but are
generally similar) in isotopic signature of primary
producers and prey species (see Kieckbusch et al. 2004
for Biscayne Bay; Chasar et al. 2005 for Florida Bay;
and both Swart et al. 2005; Behringer and Butler 2006
for the Reef, with differences described briefly below).
In the Biscayne Bay study area, sampling occurred
year round from 2011 to 2013 on the sand, sponge flat
and sea grass habitats within Biscayne National Park.
Depth ranged from 5 to 20 m. The mean temperature
in this area is 26 �C, with a range from 19 to 33 �C,while salinity is typically 30–40% but can occasion-
ally decrease rapidly with freshwater pulses (Lirman
and Cropper 2003). Twenty-three families of fishes
reside within Biscayne Bay, and the most common are
planktivores like Clupeidae, low-level predators like
Gerridae and Cyprinodontidae, and small mesopreda-
tors like Lutjanidae and Haemulidae (Serafy et al.
2003). Although it is administered by the Federal
National Parks Service, fishing within Biscayne
National Park is governed by Florida’s state fishing
regulations, with commercial and recreational fishing
generally permitted except in seasonally closed areas
(Graham et al. 2016). The average d13C values of
primary producers in this habitat have been found to
range from - 27 (mangroves) to - 6.8 (epiphytic
algae), though Kieckbusch et al. (2004) noted that
79% of all values were in the narrower range of- 21.9
to- 11.9 and that mangroves were not a major carbon
source for the fish community. Low-level predatory
teleosts such as pinfish (Lagodon rhomboides) have an
average signature of (- 12.5, 9.5), and mesopredatory
jacks (Caranx ruber) have an average signature of
(- 10.5, 10.2), with a total isotopic range of the
sample food web of approximately - 32 to - 7 d13Cand approximately 1–12 d15N.
In the Florida Bay study area, sampling primarily
occured in the shallow (3–5 m) and turbid waters of
Everglades National Park, year round from 2009 to
2012. Due to pulses of freshwater input from the
nearby Everglades, salinity in this location can vary
from* 9 to* 35% (Fourqurean and Schrlau 2003),
though measurements in this location taken by our
laboratory were almost all over 28% (Hammerschlag,
unpublished data). Mean temperature is 24.5 �C(range 20–28 �C) (Fourqurean and Robblee 1999).
The benthos is primarily carbonate mud with some sea
grass beds (Chasar et al. 2005). This region has high
biomass of prey fishes (including planktivorous and
low-level predatory fishes like Engraulidae, Blen-
niodei, Gobiidae and Clupeidae, and mesopredatory
fishes from the family Sciaenidae, Thayer and Powell
1999), but these prey fishes are mostly relatively
small, and there is relatively low fish biodiversity
compared to coral reefs. Commercial fishing is
prohibited within the waters of Everglades National
Park (Graham et al. 2016), but recreational fishing is
permitted with some restrictions on gear and bag limit.
This habitat has been found to have a distinct isotopic
range from Biscayne Bay, approximately - 18 to
- 10 d13C and approximately 1–14 d15N, with pinfishhaving an average signature of (- 14.07, 9.77) and
mesopredatory crevalle jacks (Caranx hippos) mea-
sured at (- 13.65, 11.45) (Chasar et al. 2005).
Lastly, for the Reef study area, sampling occurred
on and around a 30-m-deep coral reef near Islamorada,
Florida, year round from 2010 to 2013. Salinity in this
region is a nearly constant 35% (Vaslet et al. 2012),
and water temperature ranges from 21 to 29 �C(NOAA National Centers for Environmental Informa-
tion). The Florida Keys coral reef system has hundreds
of species of fish of all trophic levels (Ault and
Johnson 1998), including non-elasmobranch meso-
predators like grouper and barracuda in higher
123
Aquat Ecol
abundance than found in the other two study areas. Our
sampling area is not part of one of the Florida Keys
National Marine Sanctuary’s no-take zones (ecolog-
ical reserves, sanctuary preservation areas or research
natural areas), and therefore, general National Marine
Fisheries Service fisheries regulations for US Federal
waters apply (Graham et al. 2016). The average d13Cof coral zooxanthellae in the region has been found to
be approximately (- 12, 5) (Swart et al. 2005,
measured in 1996), while sea grass primary producers
here have an average signature of (- 6.9, 2.9) while
encrusting algae have an average signature of (- 14.9,
4.3) (Behringer and Butler 2006). The total isotopic
range of the sampled food web was approximately
- 18 to - 5 d13C and approximately 0–8 d15N(Behringer and Butler 2006), but this study did not
include any top predators (though secondary consumer
spiny lobster Panulirus argus had an average signature
of (- 11.8, 7.3).
Sample collection and processing
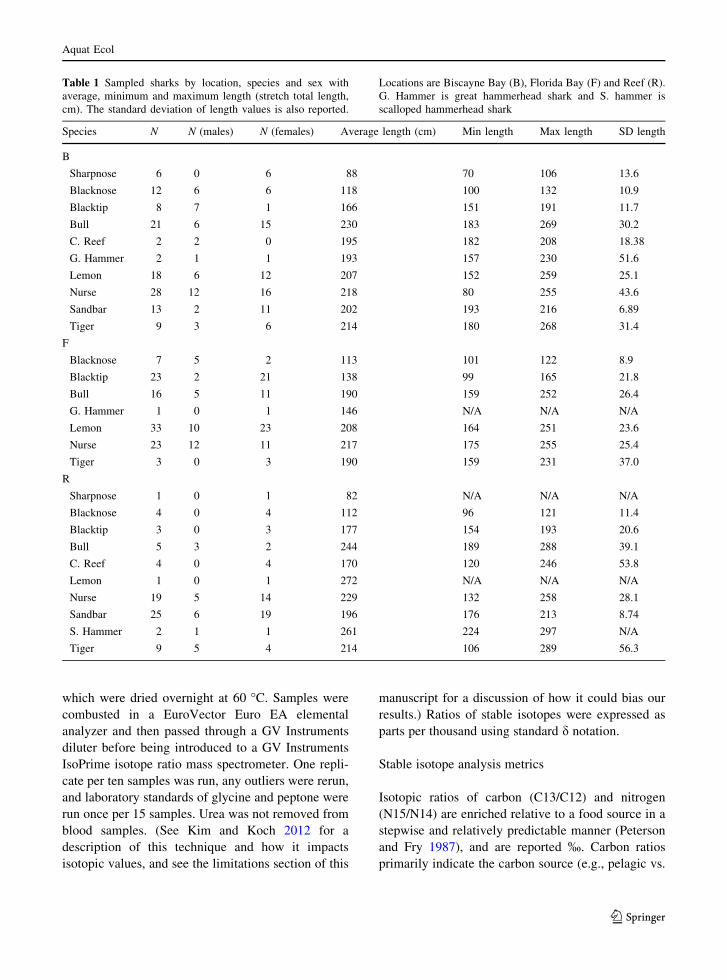
Sharks of 11 species (Table 1) were captured by drum
line as part of the University of Miami Shark Research
and Conservation Program’s ongoing coastal shark
survey (following Gallagher et al. 2014). For every
shark captured, 5 mL of blood was drawn from the
caudal vein. Sharks were measured (stretch total
length, in centimeters), sexed and released. Whole
blood (including plasma and red blood cells) was used
for this analysis, and this tissue has a turnover time of
approximately 8 months in chondrichthyans (Macneil
et al. 2006).
Samples were stored in vacutainers (not containing
anticoagulant) on ice in the field before being stored in
a- 30 �C degree freezer in the laboratory. Stable iso-
tope analysis was performed in the stable isotope
laboratory at Boston University using glycine (- 34,
10.73) and peptone (- 14.73, 7.4) standards obtained
from the National Bureau of Standards. Between 2 and
3 mg of wet weight whole blood was added to tins,
Fig. 1 GPS locations of
South Florida sampling sites
from this study. Larger stars
indicate the general location
of each study area, while
smaller pluses indicate
specific sampling sites
within each study area
123
Aquat Ecol
which were dried overnight at 60 �C. Samples were
combusted in a EuroVector Euro EA elemental
analyzer and then passed through a GV Instruments
diluter before being introduced to a GV Instruments
IsoPrime isotope ratio mass spectrometer. One repli-
cate per ten samples was run, any outliers were rerun,
and laboratory standards of glycine and peptone were
run once per 15 samples. Urea was not removed from
blood samples. (See Kim and Koch 2012 for a
description of this technique and how it impacts
isotopic values, and see the limitations section of this
manuscript for a discussion of how it could bias our
results.) Ratios of stable isotopes were expressed as
parts per thousand using standard d notation.
Stable isotope analysis metrics
Isotopic ratios of carbon (C13/C12) and nitrogen
(N15/N14) are enriched relative to a food source in a
stepwise and relatively predictable manner (Peterson
and Fry 1987), and are reported %. Carbon ratios
primarily indicate the carbon source (e.g., pelagic vs.
Table 1 Sampled sharks by location, species and sex with
average, minimum and maximum length (stretch total length,
cm). The standard deviation of length values is also reported.
Locations are Biscayne Bay (B), Florida Bay (F) and Reef (R).
G. Hammer is great hammerhead shark and S. hammer is
scalloped hammerhead shark
Species N N (males) N (females) Average length (cm) Min length Max length SD length
B
Sharpnose 6 0 6 88 70 106 13.6
Blacknose 12 6 6 118 100 132 10.9
Blacktip 8 7 1 166 151 191 11.7
Bull 21 6 15 230 183 269 30.2
C. Reef 2 2 0 195 182 208 18.38
G. Hammer 2 1 1 193 157 230 51.6
Lemon 18 6 12 207 152 259 25.1
Nurse 28 12 16 218 80 255 43.6
Sandbar 13 2 11 202 193 216 6.89
Tiger 9 3 6 214 180 268 31.4
F
Blacknose 7 5 2 113 101 122 8.9
Blacktip 23 2 21 138 99 165 21.8
Bull 16 5 11 190 159 252 26.4
G. Hammer 1 0 1 146 N/A N/A N/A
Lemon 33 10 23 208 164 251 23.6
Nurse 23 12 11 217 175 255 25.4
Tiger 3 0 3 190 159 231 37.0
R
Sharpnose 1 0 1 82 N/A N/A N/A
Blacknose 4 0 4 112 96 121 11.4
Blacktip 3 0 3 177 154 193 20.6
Bull 5 3 2 244 189 288 39.1
C. Reef 4 0 4 170 120 246 53.8
Lemon 1 0 1 272 N/A N/A N/A
Nurse 19 5 14 229 132 258 28.1
Sandbar 25 6 19 196 176 213 8.74
S. Hammer 2 1 1 261 224 297 N/A
Tiger 9 5 4 214 106 289 56.3
123
Aquat Ecol
benthic, coastal vs. offshore, Minagawa and Wada
1984) and nitrogen ratios suggesting trophic level (i.e.,
those with higher N15/N14 ratios are feeding rela-
tively higher in the food web, Post 2002). Analysis of
these isotopic ratios can provide measurements of a
species’ isotopic niche, as well as whether the isotopic
niches of co-occurring species overlap. Although an
isotopic niche provides insights into the combination
of basal resources supporting a consumer’s diet and
relative trophic level, isotopic niches are distinct from
ecological or dietary niches because they do not
provide direct insights into particular food sources
(reviewed in Layman et al. 2012). While caution is
needed in interpreting isotopic data relative to spa-
tiotemporal variation in isotopic values at the base of
food webs and dynamics of isotopic discrimination
among species, isotopic niche overlap can provide
insights into whether dietary overlap might occur.
Five metrics of relative isotopic niche breadth (i.e.,
comparisons between co-occurring species within the
same study site) and area were calculated for each
species in each study site with a sample size of greater
than five individuals. This included calculations of (1)
d13C range, (2) d15N range, (3) total occupied niche
area, (4) standard ellipse area (SEAc) and (5) the mean
distance to the centroid (CD), which are defined
below. Both d13C range and d15N range are the
differences between the smallest and largest d13C and
d15N values within a sample, respectively (Layman
et al. 2007). The total occupied niche area is the area of
the convex hull surrounding the outermost points in a
sample when those points are plotted on a d13C vs.
d15N biplot, and this measures the total isotopic niche
area of sampled individuals (Jackson et al. 2011). The
small sample size-corrected standard ellipse area
(SEAc) represents the core isotopic niche area of
sampled individuals after factoring in maximum
likelihood and is similar to a two-dimensional mea-
surement of standard deviation (Jackson et al. 2011).
Mean distance to the centroid (CD) measures trophic
diversity within a sample (Layman et al. 2007). SEAc
is used for overlap calculations and discussed in more
detail because it is more suitable for the smaller
sample sizes found for some species in this study than
total occupied niche area (Jackson et al. 2011;
Syvaranta et al. 2013).
For d13C range, d15N range, total occupied niche
area and standard ellipse area, larger values indicate
relatively broader isotopic niches, likely suggesting a
relatively generalist diet. A larger mean distance to the
centroid indicates more isotopic dispersion (two-
dimensional spread from the mean) within a group
of individuals, likely suggesting more individual
variation in diet among a population. Non-overlapping
ellipses between sympatric species suggest the pres-
ence of resource partitioning between those species
either in basal resources supporting diets, foraging
locations or specific prey (e.g., Heithaus et al. 2013).
However, the presence of overlapping ellipses does
not necessarily suggest shared patterns of resource use
between species. In the case of complex habitats with
multiple carbon sources and many available prey
resources, multiple distinct patterns of resource con-
sumption can result in similar stable isotope signatures
(reviewed in Layman et al. 2012).
Data analysis
All statistical analysis was performed using R version
3.1.2 (R Core Team 2013), including the SIAR and
SIBER packages. For each habitat, the mean d13C and
d15N values ± one standard deviation for each species
were plotted (following Davenport and Bax 2002).
SEAc and convex hull area was only calculated for
species with an N greater than or equal to five within a
study site.
Model selection
Following Tamburello et al. (2015), we used a model
selection approach assessing the support of multiple
GLMs to explore the influence of capture month,
capture year and individual size (total length) on mean
isotopic signature for species which had sufficient
sample size across these variables. A species was
considered to have sufficient sample size for the
capture month variable if at least three sharks were
sampled in at least three non-consecutive months, for
the year variable if at least five sharks were captured in
at least two different years (which sometimes meant
comparing species caught in different months between
years) and for the length variable if the range of
sampled shark length was greater than 1 m. The
relative support for each model was assessed using the
Akaike information criterion (AIC), with lower AIC
scores indicating a better-supported model. The log
likelihood of each model was also calculated and
reported, with higher values indicating a better-fitting
123
Aquat Ecol
model coefficient. The number of estimated model
parameters, K, was also reported.
Results
Blood samples from 299 sharks of 11 species were
analyzed, ranging in size from a 70 cm Atlantic
sharpnose shark (Rhizoprionodon terranovae) to a
297 cm scalloped hammerhead shark (Sphyrna lewini)
(Table 1). Species sampled also included blacknose
(Carcharhinus acronotus), blacktip (C. limbatus), bull
(C. leucas), Caribbean reef (C. perezi), great ham-
merhead (S. mokarran), lemon (Negaprion brevi-
rostris), nurse (Ginglymostoma cirratum), sandbar (C.
plumbeus) and tiger (Galeocerdo cuvier) sharks. Ten
species were captured at both Biscayne Bay and the
Reef, and seven species were captured at Florida Bay
(Table 1). See supplementary materials for N by
month and year for each species.
Biscayne Bay
Nurse sharks had the highest values for standard
ellipse area (3.36), convex hull area (9.82) and d15Nrange (4.63, Table 2) of any shark species captured at
Biscayne Bay. Lemon, bull and sandbar sharks also
had relatively high isotopic niche areas. Atlantic
sharpnose sharks had the smallest isotopic niche,
indicated by their standard ellipse area (1.05) and
convex hull area (1.06). Lemon, great hammerhead,
bull and sandbar sharks had the highest mean d15Nvalues of any species captured at Biscayne Bay,
followed by blacktip and blacknose sharks (Fig. 2a,
Table 2). The highest overlap between ellipses of
sharks captured in Biscayne Bay was observed
between blacknose and blacktip sharks, between
sharpnose and tiger sharks, and between tiger sharks
and nurse sharks (Fig. 3a, Table 3) The ellipses of the
three species with the highest d15N values (bull, lemon
and tiger sharks) did not overlap at all (Fig. 3a). Nurse
sharks had the largest CD (1.42, Table 2), and Atlantic
sharpnose sharks had the smallest CD (0.69). Mean
d13C isotopic values ranged from - 14.9 % (sandbar
shark) to- 12.6 (lemon shark), and mean d15N values
ranged from 11.23 % (Atlantic sharpnose shark) to
13.24 % (sandbar shark).
Florida Bay
Bull and lemon sharks had the highest convex hull area
(12.89 and 13.98, respectively) and standard ellipse
area (5.51 and 4.96, respectively), demonstrating that
these species have the largest isotopic niche area of
any species captured in Florida Bay. Bull sharks had
the highest d15N values (Fig. 2b, Table 2). The most
overlap between standard ellipses of sharks captured
at the Florida Bay study area occurred between
ellipses of lemon and blacktip sharks, lemon and bull
sharks, blacktip and nurse sharks, and lemon and nurse
sharks (Fig. 3b, Table 3). In Florida Bay, the ellipses
of shark species with the highest d15N values (bull
shark, blacktip shark and lemon sharks) overlapped
extensively with each other (Fig. 3b). Bull sharks had
the largest CD (1.99, Table 2), and blacknose sharks
had the smallest (0.66). Mean d13C isotopic values
ranged from - 17.38 % (great hammerhead shark) to
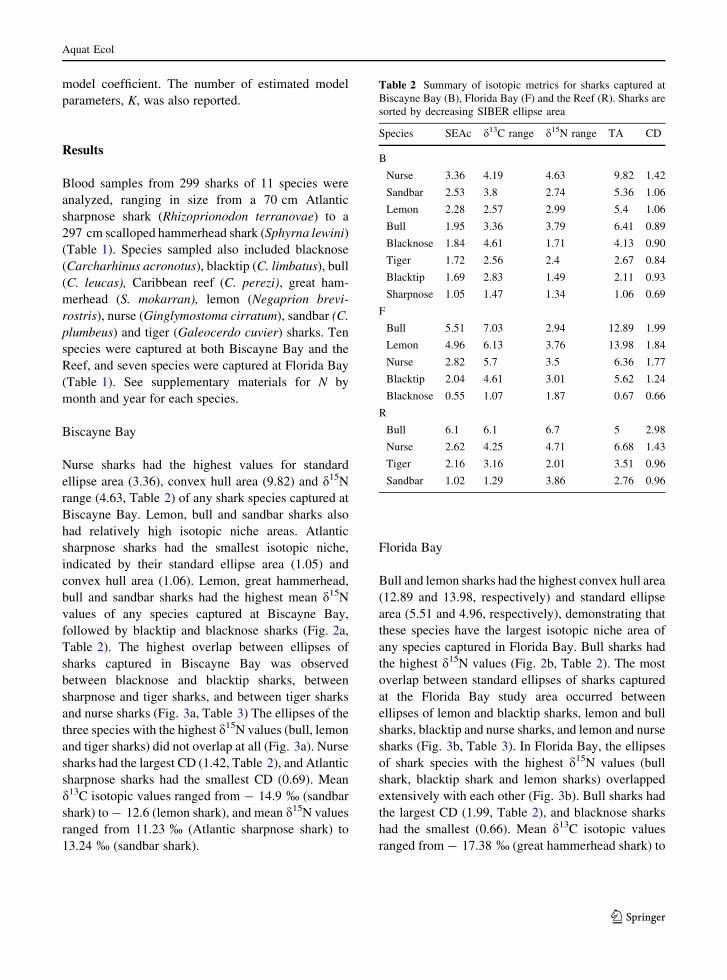
Table 2 Summary of isotopic metrics for sharks captured at
Biscayne Bay (B), Florida Bay (F) and the Reef (R). Sharks are
sorted by decreasing SIBER ellipse area
Species SEAc d13C range d15N range TA CD
B
Nurse 3.36 4.19 4.63 9.82 1.42
Sandbar 2.53 3.8 2.74 5.36 1.06
Lemon 2.28 2.57 2.99 5.4 1.06
Bull 1.95 3.36 3.79 6.41 0.89
Blacknose 1.84 4.61 1.71 4.13 0.90
Tiger 1.72 2.56 2.4 2.67 0.84
Blacktip 1.69 2.83 1.49 2.11 0.93
Sharpnose 1.05 1.47 1.34 1.06 0.69
F
Bull 5.51 7.03 2.94 12.89 1.99
Lemon 4.96 6.13 3.76 13.98 1.84
Nurse 2.82 5.7 3.5 6.36 1.77
Blacktip 2.04 4.61 3.01 5.62 1.24
Blacknose 0.55 1.07 1.87 0.67 0.66
R
Bull 6.1 6.1 6.7 5 2.98
Nurse 2.62 4.25 4.71 6.68 1.43
Tiger 2.16 3.16 2.01 3.51 0.96
Sandbar 1.02 1.29 3.86 2.76 0.96
123
Aquat Ecol

- 13.41 % (nurse shark), and mean d15N values
ranged from 10.51 % (tiger shark) to 12.44 % (bull
shark).
Fig. 2 aAverage stable isotope ratios of shark species sampled
in the Biscayne Bay study area ± 1 standard deviation.
b Average stable isotope ratios of sharks species sampled in
the Florida Bay study area ± 1 standard deviation. c Average
stable isotope ratios of sharks species sampled in the Reef study
area ± 1 standard deviation
123
Aquat Ecol
Reef
Bull and nurse sharks had the largest isotopic niche
areas of any species captured in the Reef study area.
Bull sharks had the highest standard ellipse area (6.1),
d13C range (6.1) and d15N range (Table 2). Nurse
sharks had the highest convex hull area (6.68), and the
second-highest standard ellipse area (2.62), d13Crange (4.25) and d15N range (4.71). Sandbar sharks
had the smallest isotopic niche area of any species
captured in the Reef study area, demonstrated by the
comparatively low standard ellipse area (1.02) and
convex hull area (2.76) of this species. Sandbar,
scalloped hammerhead and bull sharks had the highest
d15N values of any species captured in the Reef study
area (Fig. 2c). The highest overlap between standard
ellipses of species captured in the Reef study area
occurred between nurse and bull sharks, and between
two of the species with the highest d15N values
(sandbar and bull sharks, Fig. 3c, Table 3). There was
no overlap between the ellipses of sandbar sharks and
tiger sharks, or between the ellipses of sandbar and
nurse sharks (Fig. 3c, Table 3). Bull sharks had the
largest CD (2.98, Table 2), and tiger and sandbar
sharks had the smallest CD of 0.96. Mean d13Cisotopic values ranged from - 15.82 % (scalloped
hammerhead sharks) to - 10.41 % (lemon shark),
and mean d15N values ranged from 9.7 % (Atlantic
sharpnose shark) to 14.43 % (sandbar shark).
Comparisons of isotopic niche patterns
between study areas
Bull, sandbar and hammerhead sharks had among the
highest d15N levels in each of the three study areas
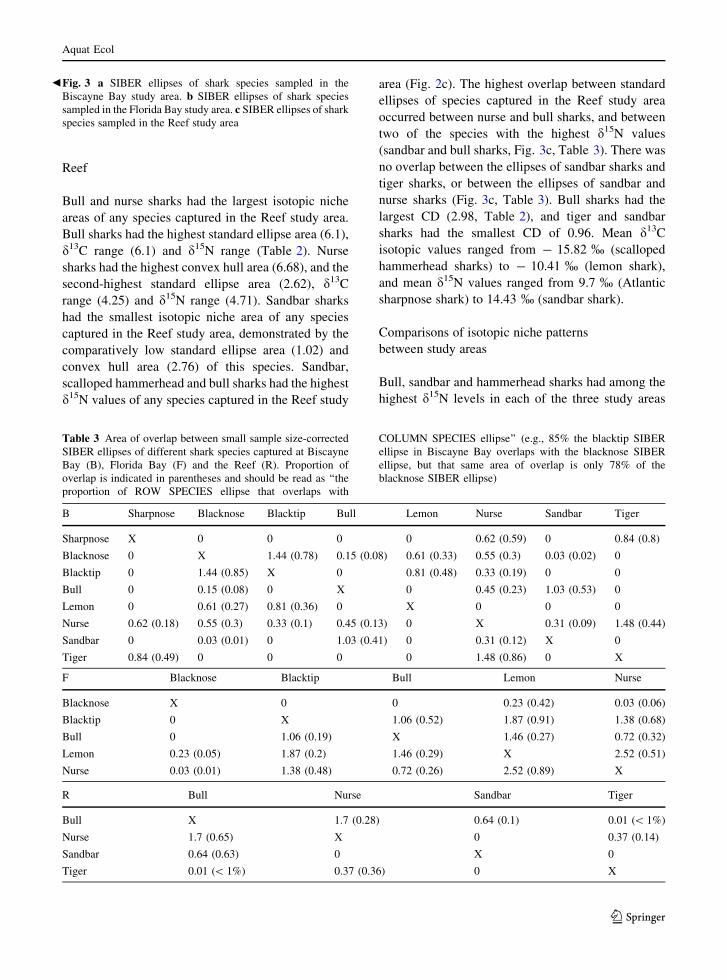
bFig. 3 a SIBER ellipses of shark species sampled in the
Biscayne Bay study area. b SIBER ellipses of shark species
sampled in the Florida Bay study area. c SIBER ellipses of shark
species sampled in the Reef study area
Table 3 Area of overlap between small sample size-corrected
SIBER ellipses of different shark species captured at Biscayne
Bay (B), Florida Bay (F) and the Reef (R). Proportion of
overlap is indicated in parentheses and should be read as ‘‘the
proportion of ROW SPECIES ellipse that overlaps with
COLUMN SPECIES ellipse’’ (e.g., 85% the blacktip SIBER
ellipse in Biscayne Bay overlaps with the blacknose SIBER
ellipse, but that same area of overlap is only 78% of the
blacknose SIBER ellipse)
B Sharpnose Blacknose Blacktip Bull Lemon Nurse Sandbar Tiger
Sharpnose X 0 0 0 0 0.62 (0.59) 0 0.84 (0.8)
Blacknose 0 X 1.44 (0.78) 0.15 (0.08) 0.61 (0.33) 0.55 (0.3) 0.03 (0.02) 0
Blacktip 0 1.44 (0.85) X 0 0.81 (0.48) 0.33 (0.19) 0 0
Bull 0 0.15 (0.08) 0 X 0 0.45 (0.23) 1.03 (0.53) 0
Lemon 0 0.61 (0.27) 0.81 (0.36) 0 X 0 0 0
Nurse 0.62 (0.18) 0.55 (0.3) 0.33 (0.1) 0.45 (0.13) 0 X 0.31 (0.09) 1.48 (0.44)
Sandbar 0 0.03 (0.01) 0 1.03 (0.41) 0 0.31 (0.12) X 0
Tiger 0.84 (0.49) 0 0 0 0 1.48 (0.86) 0 X
F Blacknose Blacktip Bull Lemon Nurse
Blacknose X 0 0 0.23 (0.42) 0.03 (0.06)
Blacktip 0 X 1.06 (0.52) 1.87 (0.91) 1.38 (0.68)
Bull 0 1.06 (0.19) X 1.46 (0.27) 0.72 (0.32)
Lemon 0.23 (0.05) 1.87 (0.2) 1.46 (0.29) X 2.52 (0.51)
Nurse 0.03 (0.01) 1.38 (0.48) 0.72 (0.26) 2.52 (0.89) X
R Bull Nurse Sandbar Tiger
Bull X 1.7 (0.28) 0.64 (0.1) 0.01 (\ 1%)
Nurse 1.7 (0.65) X 0 0.37 (0.14)
Sandbar 0.64 (0.63) 0 X 0
Tiger 0.01 (\ 1%) 0.37 (0.36) 0 X
123
Aquat Ecol
where they were caught (Fig. 2). Atlantic sharpnose
sharks, the smallest species caught during this study,
consistently had among the lowest d15N levels in both
habitats where they were found (Fig. 2a, c). Nurse
sharks and blacknose sharks had consistently inter-
mediate d15N signatures relative to co-occurring
species, and the d15N of blacktip sharks varied from
relatively high to intermediate (Fig. 2). The d15Nlevels of lemon and tiger sharks were the fourth
highest of co-occurring species in some study areas,
but the eighth highest in others, demonstrating the
most variability in relative d15N of any species.
(Although raw tiger shark d15N value was similar
between sample sites, how it compared with the d15Nvalues of co-occurring species varied).
Some pairs of species had consistent patterns of
core isotopic niche overlap across different study
areas. The ellipses of sandbar sharks and nurse sharks
captured in the Reef study area did not overlap at all,
and there was only a small area of overlap between the
ellipses of these species captured in the Biscayne Bay
study area. There was no standard ellipse overlap
between blacknose and bull sharks captured in the
Florida Bay study area, and there was only a very
small area of overlap between the ellipses of these
species captured in the Biscayne Bay study area. Tiger
shark and bull shark ellipses did not overlap at all in
either the Biscayne Bay or Reef study areas. In
Biscayne Bay, only species with high d15N values
such as sandbar, bull and lemon sharks had
notable unique isotopic niche space, the niches for
the other species overlapped almost entirely with those
of another species. In the Florida Bay area and at the
Reef, only bull sharks had a notable amount of unique
isotopic niche space.
Other pairs of species had widely variable patterns
of core isotopic niche overlap between different study
areas. Eighty-six percent of the standard ellipse of tiger
sharks captured in Biscayne Bay overlapped with that
of nurse sharks captured in Biscayne Bay. In contrast,
among sharks captured in the Reef study area, only
17%of the tiger shark ellipse overlappedwith the nurse
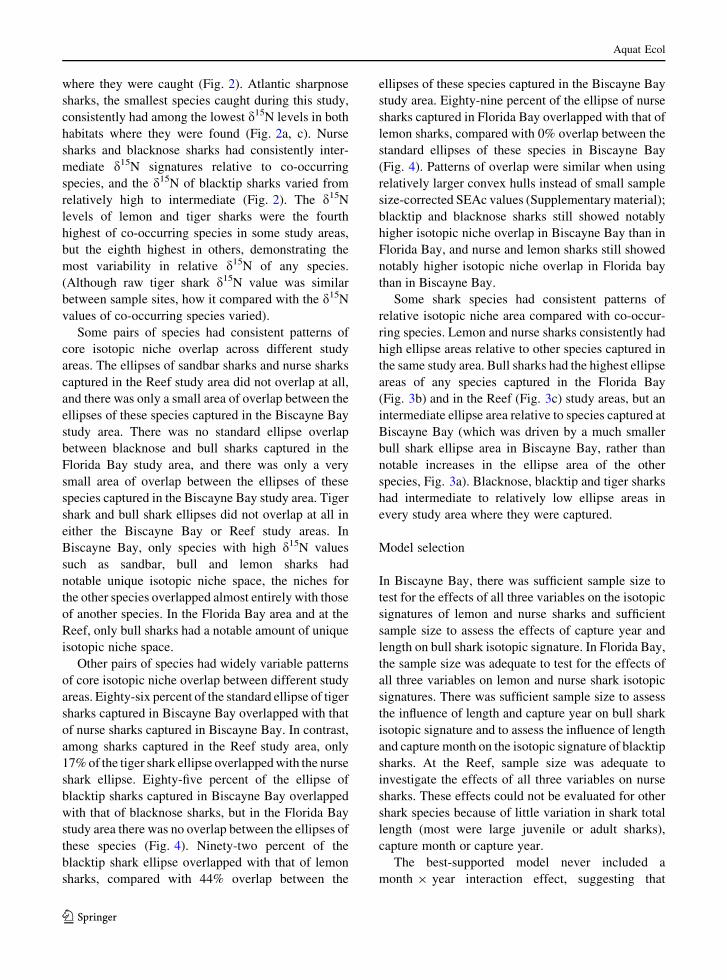
shark ellipse. Eighty-five percent of the ellipse of
blacktip sharks captured in Biscayne Bay overlapped
with that of blacknose sharks, but in the Florida Bay
study area there was no overlap between the ellipses of
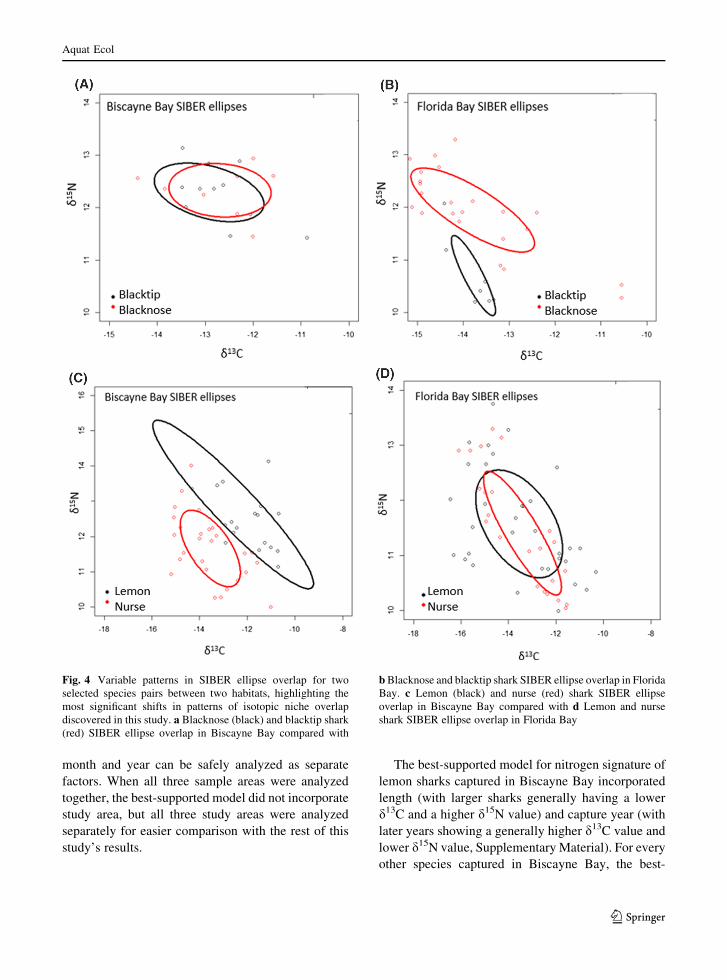
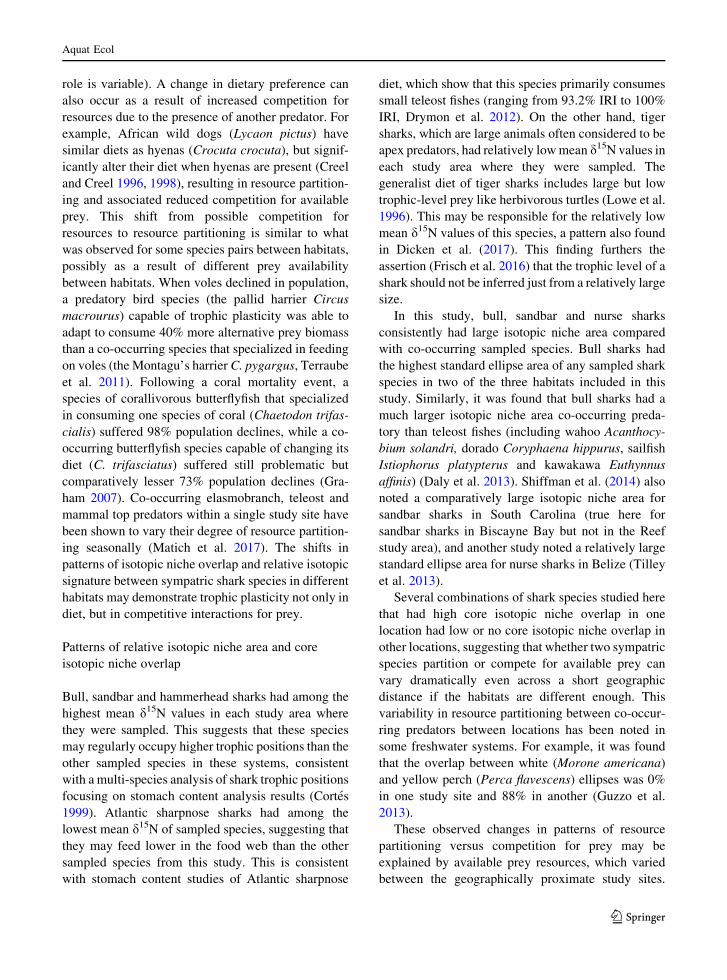
these species (Fig. 4). Ninety-two percent of the
blacktip shark ellipse overlapped with that of lemon
sharks, compared with 44% overlap between the
ellipses of these species captured in the Biscayne Bay
study area. Eighty-nine percent of the ellipse of nurse
sharks captured in Florida Bay overlapped with that of
lemon sharks, compared with 0% overlap between the
standard ellipses of these species in Biscayne Bay
(Fig. 4). Patterns of overlap were similar when using
relatively larger convex hulls instead of small sample
size-corrected SEAc values (Supplementarymaterial);
blacktip and blacknose sharks still showed notably
higher isotopic niche overlap in Biscayne Bay than in
Florida Bay, and nurse and lemon sharks still showed
notably higher isotopic niche overlap in Florida bay
than in Biscayne Bay.
Some shark species had consistent patterns of
relative isotopic niche area compared with co-occur-
ring species. Lemon and nurse sharks consistently had
high ellipse areas relative to other species captured in
the same study area. Bull sharks had the highest ellipse
areas of any species captured in the Florida Bay
(Fig. 3b) and in the Reef (Fig. 3c) study areas, but an
intermediate ellipse area relative to species captured at
Biscayne Bay (which was driven by a much smaller
bull shark ellipse area in Biscayne Bay, rather than
notable increases in the ellipse area of the other
species, Fig. 3a). Blacknose, blacktip and tiger sharks
had intermediate to relatively low ellipse areas in
every study area where they were captured.
Model selection
In Biscayne Bay, there was sufficient sample size to
test for the effects of all three variables on the isotopic
signatures of lemon and nurse sharks and sufficient
sample size to assess the effects of capture year and
length on bull shark isotopic signature. In Florida Bay,
the sample size was adequate to test for the effects of
all three variables on lemon and nurse shark isotopic
signatures. There was sufficient sample size to assess
the influence of length and capture year on bull shark
isotopic signature and to assess the influence of length
and capture month on the isotopic signature of blacktip
sharks. At the Reef, sample size was adequate to
investigate the effects of all three variables on nurse
sharks. These effects could not be evaluated for other
shark species because of little variation in shark total
length (most were large juvenile or adult sharks),
capture month or capture year.
The best-supported model never included a
month 9 year interaction effect, suggesting that
123
Aquat Ecol
month and year can be safely analyzed as separate
factors. When all three sample areas were analyzed
together, the best-supported model did not incorporate
study area, but all three study areas were analyzed
separately for easier comparison with the rest of this
study’s results.
The best-supported model for nitrogen signature of
lemon sharks captured in Biscayne Bay incorporated
length (with larger sharks generally having a lower
d13C and a higher d15N value) and capture year (with
later years showing a generally higher d13C value and
lower d15N value, Supplementary Material). For every
other species captured in Biscayne Bay, the best-
Fig. 4 Variable patterns in SIBER ellipse overlap for two
selected species pairs between two habitats, highlighting the
most significant shifts in patterns of isotopic niche overlap
discovered in this study. a Blacknose (black) and blacktip shark(red) SIBER ellipse overlap in Biscayne Bay compared with
bBlacknose and blacktip shark SIBER ellipse overlap in Florida
Bay. c Lemon (black) and nurse (red) shark SIBER ellipse
overlap in Biscayne Bay compared with d Lemon and nurse
shark SIBER ellipse overlap in Florida Bay
123
Aquat Ecol

supported models incorporated only length (with
larger sharks generally having a lower d13C and a
higher d15N value). The best-supported models for the
carbon and nitrogen signatures of species sampled in
Florida Bay all incorporated a temporal factor, either
month, year or both, with inconsistent patterns
between species (Supplementary material). The best-
supported models for the nitrogen signatures of bull,
lemon and nurse sharks captured in Florida Bay also
incorporated length, with larger individuals having a
generally higher d15N value. The best-supported
model for the isotopic signatures of nurse sharks
captured at the Reef incorporated capture month only
(Supplementary material).
Discussion
Though studies of the diet of a single predator species
or studies of dietary overlap between predators in a
single location are relatively common, comparatively
few prior studies have compared how patterns of
resource use between multiple co-occurring marine
top predators may vary among different locations
within their range (Sanford et al. 2003; Wieters et al.
2008). The results of this study demonstrate that for
some shark species in coastal South Florida, there
appears to exist spatial variation in the relative size of
core isotopic niches between sympatric species, as
well as variation in patterns of core isotopic niche
overlap between sympatric species. This leads us to
reject our null hypothesis that these isotopic relation-
ships would remain consistent across neighboring
study areas where these species co-occur, and given
that the isotopic signatures of food webs are similar
between these study sites, it suggests that some
patterns of resource use and competition among co-
occurring shark species may differ between nearby
habitats. Accordingly, ecological interactions between
sympatric shark species may vary across their ranges,
which should be considered when applying ecological
data from one location to another location.
Similar patterns of spatial variation in isotopic and
trophic interactions between sympatric predators have
occasionally been noted in both freshwater and marine
systems. A study of trophic interactions between
communities of co-occurring freshwater teleost preda-
tors noted that the species with the relatively largest
isotopic niche varied between nearby lakes (Hayden
et al. 2013). For example, in Lake Roppi, SEAc values
were 2.4 for whitefish (Coregonus lavaretus) and 4.7
for ruffe (Gymnocephalus cernuus), but in lake Oiko,
whitefish had a larger standard ellipse area than ruffe
(2.1 vs. 1.7, Hayden et al. 2013), which was attributed
to different resource use patterns of the same species
between these lakes despite similar prey availability
and total system isotopic range in both lakes. A similar
pattern was discovered in a marine system, where
stomach content analysis showed that gray reef sharks
(Carcharhinus amblyrhynchos) and sandbar sharks
(Carcharhinus plumbeus) both primarily consume
teleosts (found in 85.2% of gray reef shark stomachs
and 70.5% of sandbar shark stomachs) and cephalo-
pods (found in 29.5% of gray reef shark stomachs and
26.5% of sandbar shark stomachs) when either is the
only shark species present in a location (Papastama-
tiou et al. 2006). However, at study sites with large
numbers of both gray reef sharks and sandbar sharks,
dietary overlap between these species was very low,
suggesting resource partitioning (Papastamatiou et al.
2006).
Studies focusing on the diet of a single elasmo-
branch species across their range have shown that
several species have geographic plasticity in their diet.
It was found that the diet of the bonnethead sharks
(Sphyrna tiburo) is approximately 50% crabs and 5%
other crustaceans in Tampa Bay, Florida, but approx-
imately 10% crabs and 30% other crustaceans in
Florida Bay, despite similar prey availability in both
locations (Bethea et al. 2007). Isotopic mixing model
results suggest that the diet of Australian sharpnose
sharks was split evenly between benthic and pelagic
sources in one study site, but was almost entirely
composed of benthic sources in another site (Munroe
et al. 2015), which was attributed primarily to these
dietary generalists taking advantage of distinct prey
availability in different study sites. Our results are
consistent with these past studies and build upon them
by incorporating multiple co-occurring predators.
By demonstrating that some of these shark species
can vary their trophic interactions relative to co-
occurring species, our results suggest the potential for
trophic plasticity in these animals. Trophic plasticity is
believed to benefit predators by making them more
resilient to changing environmental conditions, such
as declines in the availability of certain prey species
(Munroe et al. 2014), while also further complicating
any analysis of that species’ ecological role (since that
123
Aquat Ecol
role is variable). A change in dietary preference can
also occur as a result of increased competition for
resources due to the presence of another predator. For
example, African wild dogs (Lycaon pictus) have
similar diets as hyenas (Crocuta crocuta), but signif-
icantly alter their diet when hyenas are present (Creel
and Creel 1996, 1998), resulting in resource partition-
ing and associated reduced competition for available
prey. This shift from possible competition for
resources to resource partitioning is similar to what
was observed for some species pairs between habitats,
possibly as a result of different prey availability
between habitats. When voles declined in population,
a predatory bird species (the pallid harrier Circus
macrourus) capable of trophic plasticity was able to
adapt to consume 40% more alternative prey biomass
than a co-occurring species that specialized in feeding
on voles (the Montagu’s harrier C. pygargus, Terraube
et al. 2011). Following a coral mortality event, a
species of corallivorous butterflyfish that specialized
in consuming one species of coral (Chaetodon trifas-
cialis) suffered 98% population declines, while a co-
occurring butterflyfish species capable of changing its
diet (C. trifasciatus) suffered still problematic but
comparatively lesser 73% population declines (Gra-
ham 2007). Co-occurring elasmobranch, teleost and
mammal top predators within a single study site have
been shown to vary their degree of resource partition-
ing seasonally (Matich et al. 2017). The shifts in
patterns of isotopic niche overlap and relative isotopic
signature between sympatric shark species in different
habitats may demonstrate trophic plasticity not only in
diet, but in competitive interactions for prey.
Patterns of relative isotopic niche area and core
isotopic niche overlap
Bull, sandbar and hammerhead sharks had among the
highest mean d15N values in each study area where
they were sampled. This suggests that these species
may regularly occupy higher trophic positions than the
other sampled species in these systems, consistent
with a multi-species analysis of shark trophic positions
focusing on stomach content analysis results (Cortes
1999). Atlantic sharpnose sharks had among the
lowest mean d15N of sampled species, suggesting that
they may feed lower in the food web than the other
sampled species from this study. This is consistent
with stomach content studies of Atlantic sharpnose
diet, which show that this species primarily consumes
small teleost fishes (ranging from 93.2% IRI to 100%
IRI, Drymon et al. 2012). On the other hand, tiger
sharks, which are large animals often considered to be
apex predators, had relatively lowmean d15N values in
each study area where they were sampled. The
generalist diet of tiger sharks includes large but low
trophic-level prey like herbivorous turtles (Lowe et al.
1996). This may be responsible for the relatively low
mean d15N values of this species, a pattern also found
in Dicken et al. (2017). This finding furthers the
assertion (Frisch et al. 2016) that the trophic level of a
shark should not be inferred just from a relatively large
size.
In this study, bull, sandbar and nurse sharks
consistently had large isotopic niche area compared
with co-occurring sampled species. Bull sharks had
the highest standard ellipse area of any sampled shark
species in two of the three habitats included in this
study. Similarly, it was found that bull sharks had a
much larger isotopic niche area co-occurring preda-
tory than teleost fishes (including wahoo Acanthocy-
bium solandri, dorado Coryphaena hippurus, sailfish
Istiophorus platypterus and kawakawa Euthynnus
affinis) (Daly et al. 2013). Shiffman et al. (2014) also
noted a comparatively large isotopic niche area for
sandbar sharks in South Carolina (true here for
sandbar sharks in Biscayne Bay but not in the Reef
study area), and another study noted a relatively large
standard ellipse area for nurse sharks in Belize (Tilley
et al. 2013).
Several combinations of shark species studied here
that had high core isotopic niche overlap in one
location had low or no core isotopic niche overlap in
other locations, suggesting that whether two sympatric
species partition or compete for available prey can
vary dramatically even across a short geographic
distance if the habitats are different enough. This
variability in resource partitioning between co-occur-
ring predators between locations has been noted in
some freshwater systems. For example, it was found
that the overlap between white (Morone americana)
and yellow perch (Perca flavescens) ellipses was 0%
in one study site and 88% in another (Guzzo et al.
2013).
These observed changes in patterns of resource
partitioning versus competition for prey may be
explained by available prey resources, which varied
between the geographically proximate study sites.
123
Aquat Ecol
When a variety of prey resources suitable for both
species is available, the predators may partition
resources, but when fewer prey types are available,
competition may occur. In this study, blacknose and
blacktip sharks had 85% core isotopic niche overlap in
Biscayne Bay, but 0% overlap in Florida Bay,
suggesting a possible shift from consuming similar
resources to resource partitioning. Stomach content
analysis of these species has revealed that blacktip
sharks in the Northwestern Atlantic primarily eat
filter-feeding menhaden (Brevoortia tyrannus, Castro
2000), while blacknose sharks eat primarily small
piscivorous sciaenids (Ford 2012). However, some
teleost, mollusk and crustacean species are consumed
by both shark species, and if these prey species are the
primary resources available in a location, it may lead
to these shark species competing for prey when they
would otherwise partition available resources. Simi-
larly, lemon and nurse sharks in this study exhibited
high core isotopic niche overlap in one study area, but
no overlap in another. Stomach content analysis has
shown that both lemon sharks (Cortes and Gruber
1990; Newman et al. 2010) and nurse sharks (Castro
2000) are primarily piscivorous, but also eat benthic
invertebrates. When both small invertebrates and
fishes are abundant, lemon and nurse sharks may
partition available resources between them, but com-
petition may result if a more limited selection of prey
is available.
The total isotopic range of the shark community
from the Reef study area was highest, likely because of
high diversity of prey species in that habitat resulting
in complex trophodynamics. With the exception of the
lone highly migratory great hammerhead shark in
Florida Bay, the total isotopic range of the shark
community in Florida Bay was the narrowest, possibly
reflecting the comparatively low prey biodiversity in
this habitat. These results largely fit into past trophic
analyses of these habitats that used stable isotope
analysis. The isotopic range of sharks sampled in this
study in Biscayne Bay is notably narrower than that
reported for the entire food web by Kieckbusch et al.
(2004), but comparable to what that study found for
the teleost predator community in Biscayne Bay. The
relatively enriched d13C values of sharks in this study
further the findings of Kieckbusch et al. (2004) that
mangroves are unlikely to be a major carbon source of
predators in this habitat. The average isotopic signa-
ture of nurse sharks in Florida Bay was very similar to
those reported for mesopredatory teleosts in Chasar
et al. (2005), with the average N15 signature of the
apex predatory bull shark in this study being higher
than anything found in Chasar et al. (2005). The lemon
sharks analyzed in this study, however, had a slightly
lower d15N signature than those analyzed in Chasar
et al. (2005), but those were from a museum collection
originally sampled in the 1950s. At the Reef study area
sharks appear to be feeding in a food web supported
more by algae and coral than the more enriched sea
grass-supported food web, and this study’s nurse
sharks, a known predator of spiny lobster, have an
average isotopic signature approximately one trophic
level higher than what Behringer and Butler (2006)
found for local spiny lobster.
Model selection
While it is still important to test for the effects of
seasonal variation on the isotopic signatures of
elasmobranch predators, those effects were expected
to be comparatively small. This is because the effects
of temporal variation on baseline isotopic signatures
on upper-level consumers are comparatively low
(Harvey et al. 2002), and few past studies have
documented significant seasonal or interannual vari-
ation in elasmobranch isotopic signatures (but see
Matich and Heithaus 2014 for an analysis of seasonal
prey pulses in a similar system). Additionally, Florida
waters have less dramatic seasonal changes in envi-
ronmental conditions than those of Alaska (Goering
et al. 1990) or the Mediterranean (Vizzini and
Mazzola 2003), and therefore, a less dramatic seasonal
change in baseline isotopic signature would be
expected for this study than in those previous studies.
Additionally, while it is important to test for the effects
of size-based variation in the isotopic signature of
consumers, this study was not expected to detect
ontogenetic shifts in diet or length-based variation in
isotopic routing. This is because most of the individ-
uals captured in this study are at or near adult sizes.
Assumptions and limitations
Interpretation of stable isotope analysis results
requires making several assumptions that could affect
our conclusions if not met (Hussey et al. 2012;
Layman et al. 2012). It is possible that two species can
have distinct diets but very similar isotopic signatures
123
Aquat Ecol
(for example, if one consumer species’ isotopic
signature represents the average of two isotopically
extreme resource bases), which would influence our
interpretation of overlapping ellipses between species
(reviewed in Layman et al. 2012).
Similarly, we are assuming that sharks are con-
suming resources primarily in the food web associated
with the study area where they were captured, but the
distances between study sites are below known
migration distances of many species included in this
study. These annual migrations, when combined with
the long isotopic turnover time of elasmobranch blood
(see MacNeil et al. 2006; Matich and Heithaus 2014),
may mean that few of these sharks ever came into total
isotopic equilibrium with the food web where they
were captured. This likely means that the isotopic
signatures of many or all sharks in this study represent
a mix of feeding in their current capture location and
elsewhere, an important consideration when interpret-
ing results. However, the fact that we noted such
distinct differences in isotopic niche area and overlap
between the same species in different study areas
suggests that this is not a major concern; if all sampled
sharks were all feeding on a shared pool of resources
regardless of capture location, these different patterns
would not have been observed.
The relatively low sample size of some species
included in this study may have underestimated the
true isotopic niche variability of these species (e.g., an
N of 25–40 captures a population’s isotopic variability
well, Vaudo and Heithaus 2011), and all sample sizes
were below 25 except for Biscayne Bay nurse sharks,
Florida Bay lemon sharks and Reef sandbar sharks
(though several other species were close to anN of 25).
Similarly, the low sample size of some species in some
habitats may have contributed to observed patterns in
SEAc overlap—while SEAc is better suited than total
occupied niche area for comparing isotopic niche
width between small populations (Syvaranta et al.
2013), it is certainly possible that a higher sample size
would have resulted in more consistent patterns of
isotopic niche overlap between study sites as a result
of capturing more of the total range in resource use
among populations (i.e., our small sample size may
have captured outliers in both populations).
While several species of sharks have been known to
exhibit ontogenetic shifts in diet (reviewed in Grubbs
2010), this study focused mostly on large juvenile or
adult individuals who had likely already undergone
their dietary shift. [In many but not all species this shift
occurs between small and large juveniles during a
transition out of a nursery area, not between large
juveniles and adults (Grubbs 2010)]. However, some
species do shift habitats and associated diets later in
their life history which could cause issues in our
interpretation of the data, though our statistical
analysis shows that it was likely not a major factor.
In this study, we used only a single tissue type for
stable isotope analysis, and this tissue has a relatively
long turnover time. Comparing isotopic signatures
between tissue types with different turnover rates can
reveal whether or not observed patterns in isotopic
niche overlap are temporally consistent (e.g., Gal-
lagher et al. 2017, which found that for one of the study
sites included in this study, patterns of overlap
between species are consistent temporally by compar-
ing isotopic signatures from two distinct tissue types).
Also, most of the study species used here have never
had their isotopic discrimination factors explicitly
measured in laboratory conditions (few elasmo-
branchs have to date), and different discrimination
between species may cause bias in our results (i.e.,
showing different isotopic signatures even for species
with very similar diets because these species may have
distinct patterns of isotopic incorporation from their
diets).
Not removing urea from samples may result in
artificially depleted d15N values due to nitrogen
(Hussey et al. 2012; Carlisle et al. 2016), but this is
expected to be more of an issue when comparing
elasmobranch isotopic signatures to co-occurring
teleosts and invertebrates, and less of an issue when
only comparing results between elasmobranchs (Kim
and Koch 2012). While this study showed that there
were intraspecific differences between animals in
different habitats, those habitats were too varied (in
terms of bottom type, depth and prey availability) to
reliably assess a single cause for observed differences
in isotopic niche area between study areas.
Conclusions
This study provides evidence of intraspecific variabil-
ity in the relative isotopic niche area and patterns of
core isotopic niche overlap in several species of co-
occurring marine predators, showing that within
different habitats the resource usage and trophic
123
Aquat Ecol
interactions of sympatric species may vary. Overall,
this suggests that the ecological roles of shark species
are quite complex and varied. Therefore, results from a
dietary overlap study in one habitat cannot necessarily
be extrapolated to a separate habitat, even if that
separate habitat is nearby. Our results suggest the need
to generate empirical assessments of resource use and
trophic interactions among sympatric predators speci-
fic to a particular area when trying to understand and
model trophodynamics for that area.
Acknowledgments The authors would like to thank the other
members of author D.S.’s dissertation committee: Dr. Nicholas
K Dulvy, Dr. Andrew R Binder and Gina Maranto. We would
like to thank Robert Michener, the manager of author L. K.’s
stable isotope laboratory, for his assistance with sample
preparation and analysis and his detailed description of
laboratory methods. We would like to thank Dr. Catherine
Macdonald, Christian Pankow, Rachel Skubel, Emily Nelson
and Jacob Jerome for their assistance with sample management
and retrieval, and Lindsay Jennings for her assistance with the
UM Shark Research and Conservation Program’s sample
database. Sample processing fees were provided by more than
100 unique crowdfunding donors through the SciFund
Challenge. The American Elasmobranch Society provided a
student travel grant for author D.S. to present this research at the
2016 AES conference, and we thank the scientists who attended
that presentation for their helpful feedback. Figure 1 was
created by author NH’s masters student Abby Tinari, and we
thank her for her assistance. This research was carried out under
the following permits: University of Miami Institutional Animal
Care and Use Committee 15-238, Florida Fish and Wildlife
Conservation Commission SAL 15-0957-SR, Florida Keys
National Marine Sanctuary 2015-168, National Oceanographic
and Atmospheric Administration Highly Migratory Species
SHK-EFP-16-02, Biscayne National Park 2015-SCI-0012 and
Everglades National Park 2015-SCI-0011. The authors have no
conflict of interest to declare.
Author Contributions This work represents Ph.D. dissertation
research by author D.S., who performed data analysis and
writing. Authors M.H. and N.H. served on D.S.’s dissertation
committee and provided guidance on the planning of this project
as well as provided guidance on analysis and write-up. Author
L.K. assisted with data analysis and write-up.
References
Anderson WT, Fourqurean JW (2003) Intra-and interannual
variability in seagrass carbon and nitrogen stable isotopes
from south Florida, a preliminary study. Org Geochem
34(2):185–194
Ault TR, Johnson CR (1998) Spatially and temporally pre-
dictable fish communities on coral reefs. Ecol Monogr
68(1):25–50
Behringer DC, Butler MJ (2006) Stable isotope analysis of
production and trophic relationships in a tropical marine
hard-bottom community. Oecologia 148(2):334–341
Bethea DM, Buckel JA, Carlson JK (2004) Foraging ecology of
the early life stages of four sympatric shark species. Mar
Ecol Prog Ser 268:245–264
Bethea DM, Hale L, Carlson JK, Cortes E, Manire CA, Gel-
sleichter J (2007) Geographic and ontogenetic variation in
the diet and daily ration of the bonnethead shark, Sphyrna
tiburo, from the eastern Gulf of Mexico. Mar Biol
152(5):1009–1020
Carlisle AB, Litvin SY, Madigan DJ, Lyons K, Bigman JS,
Ibarra M, Bizzarro J (2016) Interactive effects of urea and
lipid content confound stable isotope analysis in elasmo-
branch fishes. Can J Fish Aquat Sci 74(3):419–428
Castro JI (2000) The biology of the nurse shark,Ginglymostoma
cirratum, off the Florida east coast and the Bahama Islands.
Environ Biol Fishes 58(1):1–22
Chasar LC, Chanton JP, Koenig CC, Coleman F (2005) Eval-
uating the effect of environmental disturbance on the
trophic structure of Florid Bay using multiple stable iso-
tope analyses of contemporary and historical specimens.
Limnol Ocean 50(4):1059–1072
Cortes E (1999) Standardized diet compositions and trophic
levels of sharks. ICES J Mar Sci 56(5):707–717
Cortes E, Gruber SH (1990) Diet, feeding habits and estimates
of daily ration of young lemon sharks, Negaprion brevi-
rostris (Poey). Copeia 1990:204–218
Creel S, Creel NM (1996) Limitation of African wild dogs by
competition with larger carnivores. Conserv Biol
10(2):526–538
Creel S, Creel NM (1998) Six ecological factors that may limit
African wild dogs, Lycaon pictus. Anim Conserv 1:1–9
Daly R, Froneman PW, Smale MJ (2013) Comparative feeding
ecology of bull sharks (Carcharhinus leucas) in the coastal
waters of the southwest Indian Ocean inferred from
stable isotope analysis. PLoS ONE 8(10):e78229
Davenport SR, Bax NJ (2002) A trophic study of a marine
ecosystem off southeastern Australia using stable isotopes
of carbon and nitrogen. Can J Fish Aquat Sci
59(3):514–530
Dicken ML, Hussey NE, Christiansen HM, Smale MJ, Nkabi N,
Cliff G, Winter SP (2017) Diet and trophic ecology of the
tiger shark from South African waters. PLoS ONE
12(6):e0177897
Drymon JM, Powers SP, Carmichael RH (2012) Trophic plas-
ticity in the Atlantic sharpnose shark (Rhizoprionodon
terraenovae) from the north central Gulf of Mexico.
Environ Biol Fishes 95(1):21–35
Dulvy NK, Fowler SL, Musick JA, Cavanaugh RD, Kyne PM,
Harrison LR, Carlson JK, Davidson LNK, Fordham SV,
Francis MP, Pollock CM, Simpfendorfer CA, Burgess GH,
Carpenter KE, Compagno LJV, Ebert DA, Gibson C,
Heupel MR, Livingstone SR, Sanciangco JC, Stevens JD,
Valenti S, White WT (2014) Extinction risk and conser-
vation of the world’s sharks and rays. eLife 3:ee590
Ford RM (2012) Diet and Reproductive Biology of the Blac-
knose Shark (Carcharhinus acronotus) from the South-
western Atlantic Ocean. Thesis, University of North
Florida
123
Aquat Ecol
Fourqurean JW, Robblee MB (1999) Florida Bay: a history of
recent ecological changes. Estuaries 22(2):345–357
Fourqurean JW, Schrlau JE (2003) Changes in nutrient content
and stable isotope ratios of C and N during decomposition
of seagrasses and mangrove leaves along a nutrient avail-
ability gradient in Florida Bay, USA. Chem Ecol
19(5):373–390
Frisch AJ, Ireland M, Rizzari JR, Lonnstedt OM,Magnenat KA,
Mirbach CE, Hobbs JPA (2016) Reassessing the trophic
role of reef sharks as apex predators on coral reefs. Coral
Reefs 35:1–14
Gallagher AJ, Kyne PM, Hammerschlag N (2012) Ecological
risk assessment and its application to elasmobranch con-
servation and management. J Fish Biol 85(5):1727–1748
Gallagher AJ, Serafy JE, Cooke SJ, Hammerschlag N (2014)
Physiological stress response, reflex impairment, and sur-
vival of five sympatric shark species following experi-
mental capture and release. Mar Ecol Prog Ser
496:207–218
Gallagher AJ, Shiffman DS, Byrnes EE, Hammerschlag-Peyer
CM, Hammerschlag N (2017) Patterns of resource use and
isotopic niche overlap among three species of sharks
occurring within a protected subtropical estuary. Aquat
Ecol 51(3):435–448
Goering J, Alexander V, Haubenstock N (1990) Seasonal vari-
ability of stable carbon and nitrogen isotope ratios of
organisms in a North Pacific bay. Estuar Coast Shelf Sci
30(3):239–260
Graham NA (2007) Ecological versatility and the decline of
coral feeding fishes following climate driven coral mor-
tality. Mar Biol 153(2):119–127
Graham F, Rynne P, Estevanez M, Luo J, Ault JS, Hammer-
schlag N (2016) Use of marine protected areas and exclu-
sive economic zones in the subtropical western North
Atlantic Ocean by large highly mobile sharks. Divers
Distrib 22(5):534–546
Grubbs RD (2010) Ontogenetic shifts in movements and habitat
use. Sharks and their relatives II: Biodiversity, adaptive
physiology, and conservation. CRC Press, Boca Raton,
pp 319–350
Guzzo MM, Haffner GD, Legler ND, Rush SA, Fisk AT (2013)
Fifty years later: trophic ecology and niche overlap of a
native and non-indigenous fish species in the western basin
of Lake Erie. Biol Invasions 15(8):1695–1711
Harvey CJ, Hanson PC, Essington TE, Brown PB, Kitchell JF
(2002) Using bioenergetics models to predict stable isotope
ratios in fishes. Can J Fish Aquat Sci 59(1):115–124
Hayden B, Holopainen T, Amundsen PA, Eloranta AP, Knudsen
R, Praebel K, Kahilainen K (2013) Interactions between
invading benthivorous fish and native whitefish in subarctic
lakes. Freshw Biol 58(6):1234–1250
Heithaus MR, Burkholder D, Hueter R, Heithaus L, Pratt W,
Carrier JC (2007) Spatial and temporal variation in shark
communities of the lower Florida Keys and evidence for
historical population declines. Can J Fish Aquat Sci
64:1302–1313
Heithaus MR, Vaudo JJ, Kreicker S, Layman CA, Krutzen M,
Burkholder DA, Gastrich K, Bessey C, Sarabia R, Cameron
K, Wirsing A, Thomson JA, Dunphy-Daly MM (2013)
Apparent resource partitioning and trophic structure of
large-bodied marine predators in a relatively pristine sea-
grass ecosystem. Mar Ecol Prog Ser 481:225–237
Hussey NE, MacNeil MA, Olin JA, McMeans BC, Kinney MJ,
Chapman DD, Fisk AT (2012) Stable isotopes and elas-
mobranchs: tissue types, methods, applications and
assumptions. J Fish Biol 80(5):1449–1484
Hussey NE, MacNeil MA, Siple MC, Popp BN, Dudley SF, Fisk
AT (2015) Expanded trophic complexity among large
sharks. Food Webs 4:1–7
Jackson AL, Inger R, Parnell AC, Bearhop S (2011) Comparing
isotopic niche widths among and within communities:
SIBER—Stable Isotope Bayesian Ellipses in R. J Anim
Ecol 80(3):595–602
Kieckbusch DK, Koch MS, Serafy JE, Anderson WT (2004)
Trophic linkages among primary producers and consumers
in fringing mangroves of subtropical lagoons. Bull Mar Sci
74(2):271–285
Kim SL, Koch PL (2012) Methods to collect, preserve, and
prepare elasmobranch tissues for stable isotope analysis.
Environ Biol Fish 95(1):53–63
Layman CA, Arrington DA, Montana CG, Post DM (2007) Can
stable isotope ratios provide for community-wide measures
of trophic structure? Ecology 88(1):42–48
Layman CA, Araujo MS, Boucek R, Hammerschlag-Peyer CM,
Harrison E, Jud ZR, Matich PM, Rosenblatt AE, Vaudo JJ,
Yeager LA, Post DM, Bearhop S (2012) Applying
stable isotopes to examine food-web structure: an overview
of analytical tools. Biol Rev 87(3):545–562
Lirman D, Cropper WP (2003) The influence of salinity on
seagrass growth, survivorship, and distribution within
Biscayne Bay, Florida: field, experimental, and modeling
studies. Estuaries 26(1):131–141
Lowe CG, Wetherbee BM, Crow GL, Tester AL (1996) Onto-
genetic dietary shifts and feeding behavior of the tiger
shark, Galeocerdo cuvier, Hawaiian waters. Environ Biol
Fishes 47(2):203–211
MacNeil MA, Drouillard KG, Fisk AT (2006) Variable uptake
and elimination of stable nitrogen isotopes between tissues
in fish. Can J Fish Aquat Sci 63(2):345–353
Martınez del Rio C, Wolf N, Carleton SA, Gannes L (2009)
Isotopic ecology ten years after a call for more laboratory
experiments. Biol Rev 84(1):91–111
Matich P, Heithaus MR (2014) Multi-tissue stable isotope
analysis and acoustic telemetry reveal seasonal variability
in the trophic interactions of juvenile bull sharks in a
coastal estuary. J Anim Ecol 83(1):199–213
Matich P, Ault JS, Boucek RE, Bryan DR, Gastrich KR, Harvey
CL, Heithaus M, Rosenblatt A (2017) Ecological niche
partitioning within a large predator guild in a nutrient-
limited estuary. Limnol Ocean 62(3):934–953
Minagawa M, Wada E (1984) Stepwise enrichment of 15N
along food chains: further evidence and the relation
between d15N and animal age. Geochim Cosmochim Acta
48(5):1135–1140
Munroe SEM, Simpfendorfer CA, Heupel MR (2014) Defining
shark ecological specialisation: concepts, context, and
examples. Rev Fish Biol Fish 24(1):317–331
Munroe SEM, HeupelMR, Fisk A, LoganM, Simpfendorfer CA
(2015) Regional movement patterns of a small-bodied
shark revealed by stable-isotope analysis. J Fish Biol
86(5):1567–1586
123
Aquat Ecol
Newman SP, Handy RD, Gruber SH (2010) Diet and prey
preference of juvenile lemon sharks Negaprion brevi-
rostris. Mar Ecol Prog Ser 398:221–234
Papastamatiou YP, Wetherbee BM, Lowe CG, Crow GL (2006)
Distribution and diet of four species of carcharhinid shark
in the Hawaiian Islands: evidence for resource partitioning
and competitive exclusion. Mar Ecol Prog Ser
320:239–251
Peterson BJ, Fry B (1987) Stable isotopes in ecosystem studies.
Annu Rev Ecol Syst 18:293–320
Pikitch E, Santora C, Babcock EA, Bakun A, Bonfil R, Conover
DO, Dayton P, Doukakis P, Fluharty D, Heneman B,
Houde ED, Link J, Livingston PA, Mangel M, McAllister
M, Pope J, Sainsbury KJ (2004) Ecosystem-based fishery
management. Science 305(5682):346–347
Polis GA, Holt RD (1992) Intraguild predation: the dynamics of
complex trophic interactions. Trends Ecol Evol
7(5):151–154
Post DM (2002) Using stable isotopes to estimate trophic
position: models, methods, and assumptions. Ecology
83(3):703–718
R Core Team (2013) R: a language and environment for sta-
tistical computing. R Foundation for Statistical Comput-
ing. Vienna, Austria. http://www.R-project.org/
Sanford E, Roth MS, Johns GC, Wares JP, Somero GN (2003)
Local selection and latitudinal variation in a marine
predator-prey interaction. Science 300(5622):1135–1137
Schoener TW (1974) Resource partitioning in ecological com-
munities. Science 185(4145):27–39
Serafy JE, Faunce CH, Lorenz JJ (2003) Mangrove shoreline
fishes of Biscayne Bay, Florida. Bull Mar Sci
72(1):161–180
Shiffman DS, Gallagher AJ, Boyle MD, Hammerschlag-Peyer
CM, Hammerschlag N (2012) Stable isotope analysis as a
tool for elasmobranch conservation research: a primer for
non-specialists. Mar Fresh Res 63(7):635–643
Shiffman DS, Frazier BS, Kucklick JR, Abel D, Brandes J,
Sancho G (2014) Feeding ecology of the sandbar shark in
South Carolina estuaries revealed through d13C and d15 N
stable isotope analysis. Mar Coast Fish 6(1):156–169
Simpfendorfer CA, Heupel MR, White W, Dulvy NK (2011)
The importance of research and public opinion to conser-
vation management of sharks and rays: a synthesis. Mar
Fresh Res 62:518–527
Swart PK, Saier A, Lamb K (2005) Temporal and spatial vari-
ation in the d15N and d13C of coral tissue and zooxanthellae
in Montastraea faveolata collected from the Florida reef
tract. Limnol Ocean 50(4):1049–1058
Syvaranta J, Lensu A, Marjomaki TJ, Oksanen S, Jones RI
(2013) An empirical evaluation of the utility of convex hull
and standard ellipse areas for assessing population niche
widths from stable isotope data. PLoS ONE 8(2):e56094
Tamburello N, Cote IM, Dulvy NK (2015) Energy and the
scaling of animal space use. Am Nat 186(2):196–211
Terraube J, Arroyo B, Madders M, Mougeot F (2011) Diet
specialisation and foraging efficiency underfluctuating
vole abundance: a comparison between generalist and
specialist avian predators. Oikos 120(2):234–244
Thayer GW, Powell AB, Hoss DE (1999) Composition of larval,
juvenile, and small adult fishes relative to changes in
environmental conditions in Florida Bay. Estuaries
22(2):518–533
Tilley A, Lopez-Angarita J, Turner JR (2013) Diet reconstruc-
tion and resource partitioning of a Caribbean marine
mesopredator using stable isotope Bayesian modelling.
PLoS ONE 8(11):e79560
Torres LG, Heithaus MR, Delius B (2006) Influence of teleost
abundance on the distribution and abundance of sharks in
Florida Bay, USA. Hydrobiologia 569:449–455
Trent L, Parshley DE, Carlson JK (1997) Catch and bycatch in
the shark drift gillnet fishery off Georgia and east Florida.
Mar Fish Rev 59(1):19–28
Vaslet A, Phillips DL, France C, Feller IC, Baldwin CC (2012)
The relative importance of mangroves and seagrass beds as
feeding areas for resident and transient fishes among dif-
ferent mangrove habitats in Florida and Belize: evidence
from dietary and stable-isotope analyses. J Exp Mar Biol
Ecol 434:81–93
Vaudo JJ, Heithaus MR (2011) Dietary niche overlap in a
nearshore elasmobranch mesopredator community. Mar
Ecol Prog Ser 425:247–260
Vizzini S, Mazzola A (2003) Seasonal variations in the
stable carbon and nitrogen isotope ratios (13C/12C and
15 N/14 N) of primary producers and consumers in a
western Mediterranean coasal lagoon. Mar Biol
142(5):1009–1018
Wieters EA, Gaines SD, Navarrete SA, Blanchette CA, Menge
BA (2008) Scales of dispersal and the biogeography of
marine predator–prey interactions. Am Nat
171(3):405–417
Publisher’s Note Springer Nature remains neutral with
regard to jurisdictional claims in published maps and
institutional affiliations.
123
Aquat Ecol