Embed Size (px)
Citation preview

1
Intratumoral MAPK and PI3K signaling pathway heterogeneity in glioblastoma tissue
correlates with selective CREB signaling and specific functional gene signatures
Paul M. Daniel, PhD,1, Gulay Filiz, BSc,1, Martin J. Tymms, PhD,1, Robert G. Ramsay, PhD,1,2,
Andrew H. Kaye, MD,3,4, Stanley S. Stylli, PhD,3,4, Theo Mantamadiotis, PhD1,3,5
1 Department of Pathology, School of Biomedical Sciences, The University of Melbourne,
Parkville VIC 3010, Victoria, Australia
2 Peter MacCallum Cancer Centre and The Sir Peter MacCallum Department of Oncology,
University of Melbourne, Melbourne, Melbourne 3000, Victoria, Australia.
3 Department of Surgery (RMH), The University of Melbourne, Parkville VIC 3010, Victoria,
Australia
4 Department of Neurosurgery, The Royal Melbourne Hospital, Parkville, Victoria 3050,
Australia
5 Department of Microbiology & Immunology, School of Biomedical Sciences, The University
of Melbourne, Parkville VIC 3010, Victoria, Australia
Corresponding author: Theo Mantamadiotis, The University of Melbourne
Corresponding author email: [email protected]
Keywords: Glioblastoma, cell signaling, heterogeneity, MAPK, PI3K, CREB
Running Title: Intratumoral signaling heterogeneity in GBM
1 2 3 4 5 6 7 8 9 10 11 12 13 14 15 16 17 18 19 20 21 22 23 24 25 26 27 28 29 30 31 32 33 34 35 36 37 38 39 40 41 42 43 44 45 46 47 48 49 50 51 52 53 54 55 56 57 58 59 60 61 62 63 64 65
.CC-BY-NC-ND 4.0 International licensepeer-reviewed) is the author/funder. It is made available under aThe copyright holder for this preprint (which was not. http://dx.doi.org/10.1101/305052doi: bioRxiv preprint first posted online Apr. 20, 2018;

2
Abstract
Limitations in discovering useful tumor biomarkers and drug targets is not only due to patient-to-
patient differences but also due to intratumoral heterogeneity. Heterogeneity arises due to the
genetic and epigenetic variation of tumor cells in response to microenvironmental interactions
and cytotoxic therapy. We explored specific signaling pathway activation in glioblastoma
(GBM) by investigating the intratumoral activation of the MAPK and PI3K pathways. We
present data demonstrating a striking preponderance for mutual exclusivity of MAPK and PI3K
activation in GBM tissue, where MAPK activation correlates with proliferation and transcription
factor CREB activation and PI3K activation correlates with CD44 expression. Bioinformatic
analysis of signaling and CREB-regulated target genes supports the immunohistochemical data,
showing that the MAPK-CREB activation correlates with proliferative regions. In-silico analysis
suggests that MAPK-CREB signaling activates a pro-inflammatory molecular signature and
correlates with a mesenchymal GBM subtype profile, while PI3K-CREB activation correlates
with the proneural GBM subtype and a tumor cell invasive gene signature. Overall, the data
suggests the existence of intratumoral subtype heterogeneity in GBM and that using
combinations of both MAPK and PI3K drug inhibitors is necessary for effective targeted
therapy.
Introduction
Problems associated with the treatment of recurrent glioblastoma (GBM) are thought to be
due to variations in tumor cell drug sensitivity, as well as the development of tumor cell drug
resistance, underpinned by the heterogeneous molecular and genetic nature of GBM. Unravelling
the molecular mechanisms underlying the development of the most common and deadly
malignant brain cancer, GBM, is necessary to define novel biomarkers and specific druggable
targets. The biological and clinical differences of GBM are underpinned by the diverse
underlying genetic and molecular landscape. The molecular heterogeneity in GBM is reflected
by the varied phenotypic and functional features between GBM subtypes [29, 43]. There is
significant difference in response to intensive treatment, which includes chemotherapy with
temozolomide or concurrent chemotherapy and radiotherapy, among GBM subtypes. Proneural
GBM is least responsive to intensive treatment while classical and mesenchymal subtypes
respond relatively well [43]. Underlying differences in therapeutic response between each
1 2 3 4 5 6 7 8 9 10 11 12 13 14 15 16 17 18 19 20 21 22 23 24 25 26 27 28 29 30 31 32 33 34 35 36 37 38 39 40 41 42 43 44 45 46 47 48 49 50 51 52 53 54 55 56 57 58 59 60 61 62 63 64 65
.CC-BY-NC-ND 4.0 International licensepeer-reviewed) is the author/funder. It is made available under aThe copyright holder for this preprint (which was not. http://dx.doi.org/10.1101/305052doi: bioRxiv preprint first posted online Apr. 20, 2018;

3
subtype may be due to the distinct regulatory networks driving the pathology, since each subtype
has a unique regulatory network established by epigenomic, genomic and transcriptomic changes
[4, 8]. As such, the divergent biological attributes of GBM subtypes make characterization not
only important for prognosis but also relevant to identification of subtype-specific therapeutic
targets.
Genomic analysis of the mutational spectra of GBM shows that mutations often occur in
multiple components of key signaling pathways which lead to deregulation of downstream
kinase cascades and drive tumorigenesis [6]. Hyperactivation of the MAPK pathway is common
to many cancers including GBM and has been implicated in multiple tumorigenic processes such
as proliferation [1], survival [18] and migration [14]. The core role of MAPK in promoting
malignancy is highlighted by the correlation of hyperactivation of this pathway to poor prognosis
in multiple cancer types including breast [27], colon [36], ovarian [32] and GBM [30, 31].
Signaling through this pathway begins at membrane bound growth factor receptors, typically the
epidermal growth factor receptor (EGFR), which is activated by epidermal growth factor (EGF).
Upon ligand binding, the cytoplasmic domain of the receptor becomes phosphorylated and
recruits the downstream MAPK pathway signaling adapter proteins.
Clusters of mutations in multiple MAPK pathway components drive aberrant hyperactivation.
In GBM, five of the top twenty-five mutated genes belong to the MAPK pathway and 83% of all
GBM cases possess a mutation in at least one of these factors [13]. Of the mutations in the
MAPK signaling pathway, the EGFR is one of the most common (50%) found in GBM. This is
typified by the EGFRvIII activating mutation, a missense mutation which promotes ligand-
independent activation of the receptor [19], resulting in the ligand-independent, constitutive
activation of EGFR leading to hyperactivation of MAPK pathway. MAPK regulates various
cellular processes via the activation of downstream transcription factors, which in turn regulate
the expression of numerous target genes. A key transcription factors which MAPK regulates
includes the cAMP Response Element Binding Protein (CREB) [46]. We previously showed that
in GBM cells, CREB, a key regulator of cyclin-D1 expression cell and cell proliferation, is co-
activated by MAPK and PI3K signaling [16].
Like the MAPK pathway, the PI3K pathway is aberrantly hyperactivated in multiple cancers,
with 60-90% of GBM cases exhibiting an activating mutation in at least one of the core PI3K
pathway genes [12, 20]. Activation of the PI3K pathway is associated with reduced survival in
1 2 3 4 5 6 7 8 9 10 11 12 13 14 15 16 17 18 19 20 21 22 23 24 25 26 27 28 29 30 31 32 33 34 35 36 37 38 39 40 41 42 43 44 45 46 47 48 49 50 51 52 53 54 55 56 57 58 59 60 61 62 63 64 65
.CC-BY-NC-ND 4.0 International licensepeer-reviewed) is the author/funder. It is made available under aThe copyright holder for this preprint (which was not. http://dx.doi.org/10.1101/305052doi: bioRxiv preprint first posted online Apr. 20, 2018;

4
GBM patients [31] and regulates several characteristics of tumor cell biology including survival
[11] and invasion [21]. Upon growth factor ligand-receptor interaction, the PI3K catalytic
subunit, p110α, converts phosphatidylinositol 4,5-bisphosphate (PIP2) to phosphatidylinositol
3,4,5-triphosphate (PIP3), which then activates AKT [15]. AKT is the terminal kinase which has
a host of target genes together with other kinases, including mTOR [23], pro-survival factor
BCL2 [5] and transcription factors such as FOXO3 [38] and CREB [17]. Notably, many of the
targets for the MAPK pathway are shared by the PI3K pathway, indicative of their overlapping
roles in regulating tumor cell functions.
Mutations of activator or inhibitor proteins along the PI3K pathway create the net effect of
PI3K pathway hyperactivation. For example, mutation of tumor suppressor and PI3K pathway
negative regulator, phosphatase and tensin homologue (PTEN), is reported in 30-40% of GBM
cases [12, 43]. Compared to the MAPK pathway, PI3K signaling activation correlates more
weakly with prognosis in GBM [28, 31]. However, experimental evidence shows that PI3K
pathway mutations are drivers / initiating events in glioma [41]. Several mouse models have also
demonstrated that PTEN loss is necessary for initiating GBM when combined with other
oncogenic mutations [2, 45].
The MAPK and PI3K cell signaling pathways were originally modelled as linear signaling
intracellular conduits activated by distinct stimuli, but studies have since demonstrated that the
pathways converge to regulate each other and co-regulate downstream functions (reviewed in
[26]). However, each pathway also responds to and implements distinct molecular and cellular
functions. With the view that targeting specific factors regulating specific pathways will disrupt
key tumor cell behaviors, including survival and proliferation, we present data showing that in
GBM tissue, there is regional variation with respect to MAPK and PI3K activation and that there
is a striking preponderance for mutual exclusivity in the activation of the pathways. In situ co-
expression analysis and computational analysis suggests that there are specific roles that each
pathway plays in alliance with the CREB transcription factor. The intratumoral signaling
pathway heterogeneity we identify, has implications on tumor cell behavior and likely has
clinical implications on targeted therapy rationale and GBM subtype determination. Importantly,
the data also supports the view that inhibiting both major cell signaling pathways is always
necessary to effect tumor cell inhibition in GBM.
1 2 3 4 5 6 7 8 9 10 11 12 13 14 15 16 17 18 19 20 21 22 23 24 25 26 27 28 29 30 31 32 33 34 35 36 37 38 39 40 41 42 43 44 45 46 47 48 49 50 51 52 53 54 55 56 57 58 59 60 61 62 63 64 65
.CC-BY-NC-ND 4.0 International licensepeer-reviewed) is the author/funder. It is made available under aThe copyright holder for this preprint (which was not. http://dx.doi.org/10.1101/305052doi: bioRxiv preprint first posted online Apr. 20, 2018;

5
Methods
Ethics Statement
Experiments using fixed GBM tissue were carried out with the approval of The University of
Melbourne Office for Research Ethics and Integrity, Human Research Ethics Committee, project
ID 1339751.
Immunostaining
Three different patient tissues, diagnosed as WHO Grade IV/GBM by pathologists at the
Royal Melbourne Hospital, were used. Paraffin sections were cut at a thickness of 7μm, cleared
of paraffin and rehydrated through an ethanol to water series. All staining and
immunohistochemical analysis for each specimen was performed on consecutive serial sections.
Hematoxylin and eosin staining was performed. Primary antibodies were incubated overnight at
4oC, washed in PBS and incubated with secondary antibody for 1h at ambient temperature,
washed in PBS then developed for chromogenic or fluorescence visualization, as described in the
following text. Immunohistochemical detection was performed using a Vectastain ABC kit
(Vector Laboratories, Burlingame, CA) and diaminobenzidine (DAB; Merck, Darmstadt,
Germany). Immunofluorescence staining was performed using secondary antibodies, Alexa-fluor
488 (green) or 594 (red), at 1:10000 dilution. Primary antibodies were: pAKT(S473) (#9271,
Cell Signaling Technology, Danvers, MA), pMAPK pMAPK (#4370, Cell Signaling
Technology, Danvers, MA), pCREB (#9198, Cell Signaling Technology, Danvers, MA), PCNA
(#2686, Cell Signaling Technology, Danvers, MA), CD44 (#04-1123, Abcam, Australia), MMP-
9 (#29579, Anaspec, Fremont, CA). Primary antibody dilutions were at 1:1000 for
immunohistochemistry and 1:200 for immunofluorescence. For immunofluorescence staining,
coverslips were mounted using Fluoroshield Mounting Medium with DAPI (Abcam, Australia).
Pathway-specific CREB target gene analysis
The level 3 TCGA Agilent GBM dataset was utilized for the analysis
(https://portal.gdc.cancer.gov/projects/TCGA-GBM) . Gene sets (MSigDB) containing KEGG
annotations for the MAPK and the PI3K pathways were used to perform single sample Gene Set
Enrichment Analysis (ssGSEA) to define the level of pathway enrichment within individual
patients in the GBM dataset. DEseq was used to test for differentially expressed genes between
samples with high (z>1) and low (z<-1) enrichment of each KEGG pathway [3]. A false
discovery rate corrected p-value of <0.1 was used as a cut-off for differentially expressed genes.
1 2 3 4 5 6 7 8 9 10 11 12 13 14 15 16 17 18 19 20 21 22 23 24 25 26 27 28 29 30 31 32 33 34 35 36 37 38 39 40 41 42 43 44 45 46 47 48 49 50 51 52 53 54 55 56 57 58 59 60 61 62 63 64 65
.CC-BY-NC-ND 4.0 International licensepeer-reviewed) is the author/funder. It is made available under aThe copyright holder for this preprint (which was not. http://dx.doi.org/10.1101/305052doi: bioRxiv preprint first posted online Apr. 20, 2018;

6
Pathway specific differentially expressed genes were then compared to each other to identify
uniquely expressed genes specific to each pathway. To define CREB target genes, pathway
specific genes were interrogated for the presence of a full CRE (cAMP response element) site in
the promoter region, -1000bp to +100bp from the transcription start site (TSS), regions
representing high confidence CREB target gene promoters [47]. The resulting genes were
grouped as PI3K-CREB and MAPK-CREB gene modules for downstream analysis.
Results
Preponderance for intratumoral mutual exclusivity of MAPK and PI3K activation in GBM
Immunohistochemical analysis of consecutive formalin-fixed paraffin-embedded (FFPE)
tissue sections from three independent GBM (WHO Grade IV) patient tissues showed that in
regions enriched in pMAPK expression, pAKT expression was low/undetectable and vice versa
(Fig 1A, B). pMAPK positive regions exhibited overlapping expression with proliferating cell
nuclear antigen (PCNA), matrix metallopeptidase-9 (MMP-9) and pCREB, while regions high in
pAKT expression overlapped with CD44 expression but not the other biomarkers. Olig-2
expression also closely correlated with pMAPK expression (not shown). Tissue
immunofluorescence staining showed that the same cells expressing pMAPK also expressed
pCREB (Fig 2A), confirming the immunohistochemical data, while pAKT positive cells were
mostly pCREB negative (Fig 2B), although there was co-expression of pAKT and pCREB in the
same cells in the bordering regions.
Distinct pathway-specific activation of CREB target gene expression in GBM
To investigate specific cell-associated functions of the MAPK and PI3K pathways in GBM
and how these pathways differentially regulate common transcriptional targets, we used the
TCGA GBM Agilent microarray RNA expression datasets and developed an in-silico analysis
pipeline (Fig 3A), to identify CREB target genes expressed under the control of the PI3K
pathway or MAPK pathway. The expression of 132 CREB target genes were specifically
expressed when the MAPK pathway was activated (MAPK-CREB gene module) while 114
CREB target genes were expressed, only when the PI3K pathway was activated (PI3K-CREB
gene module) (Table 1).
Gene clustering analysis showed that PI3K-CREB signaling regulates target genes identified
by the GO (Gene Ontology) term ‘metastasis’, suggesting that these genes are involved in
1 2 3 4 5 6 7 8 9 10 11 12 13 14 15 16 17 18 19 20 21 22 23 24 25 26 27 28 29 30 31 32 33 34 35 36 37 38 39 40 41 42 43 44 45 46 47 48 49 50 51 52 53 54 55 56 57 58 59 60 61 62 63 64 65
.CC-BY-NC-ND 4.0 International licensepeer-reviewed) is the author/funder. It is made available under aThe copyright holder for this preprint (which was not. http://dx.doi.org/10.1101/305052doi: bioRxiv preprint first posted online Apr. 20, 2018;

7
regulating tumor cell migration / invasion, while MAPK-CREB regulated genes are categorized
as genes regulating ‘proliferation’ and ‘inflammation’ (Fig 3B). Further interrogation of genes
showed that MAPK-CREB genes were enriched for GO terms, ‘Positive Regulation of
Biological Process’, ‘Signal Transduction’ and ‘Positive Regulation of Cellular Process’,
whereas PI3K-CREB genes were enriched for GO terms ‘Cellular Macromolecule Metabolic
Process’, ‘Biopolymer Metabolic Process’ and ‘Cellular Protein Metabolic Process’. Further
curation of gene function using Genecards (http://www.genecards.org/) [34], identified specific
cellular and molecular functions of the target genes and identified genes which may be involved
in cross-pathway regulation (Table 3). PI3K-CREB regulated, DUSP8, negatively regulates
MAPKs, while the MAPK-CREB regulated protein PML inhibits AKT1, a key kinase of the
PI3K pathway[34]. Overall, PI3K-CREB regulated genes were themselves regulators of multiple
signal transduction pathways, including the PI3K, WNT, JNK, PKC and MAPK pathways and
regulators of transcription, illustrating the broad involvement of the PI3K-CREB in regulating
complex molecular and cellular functions. The MAPK-CREB target genes identified also fell
into broad categories but also identified inflammation and angiogenesis as key, more specific
functions (Table 3).
MAPK-CREB signaling correlates with proliferation and inflammation
For patient tumors highly enriched for MAPK-CREB gene expression, there was a strong
correlation with proliferation and pro-inflammatory functions (Fig 3). The 115 gene PI3K-CREB
module, showed an enrichment of genes involved in metastasis but no association with
proliferation or pro-inflammation genes. VEGFA, FLT1 and FGD5 were amongst the genes
identified which regulate proliferation and angiogenesis, while three genes involved in the NFκB
pro-inflammatory pathway, TNFS14, TNFAIP3 and TICAM1, were also identified as MAPK-
CREB regulated genes (Table 3).
MAPK-CREB target genes but not PI3K-CREB target genes are associated with poorer
survival in GBM
To determine whether the difference in gene targets regulated by the MAPK-CREB and
PI3K-CREB modules was reflected in patient prognosis, clinical parameters from the TCGA
GBM dataset were analyzed (Fig 3-5A, B). Patient tumors which were enriched for MAPK-
CREB target genes had a poorer prognosis than those which were not enriched for this gene
module (372 days vs 502 days, p=6.21x10⁻⁴; Fig 4A). By contrast, PI3K-CREB target gene
1 2 3 4 5 6 7 8 9 10 11 12 13 14 15 16 17 18 19 20 21 22 23 24 25 26 27 28 29 30 31 32 33 34 35 36 37 38 39 40 41 42 43 44 45 46 47 48 49 50 51 52 53 54 55 56 57 58 59 60 61 62 63 64 65
.CC-BY-NC-ND 4.0 International licensepeer-reviewed) is the author/funder. It is made available under aThe copyright holder for this preprint (which was not. http://dx.doi.org/10.1101/305052doi: bioRxiv preprint first posted online Apr. 20, 2018;
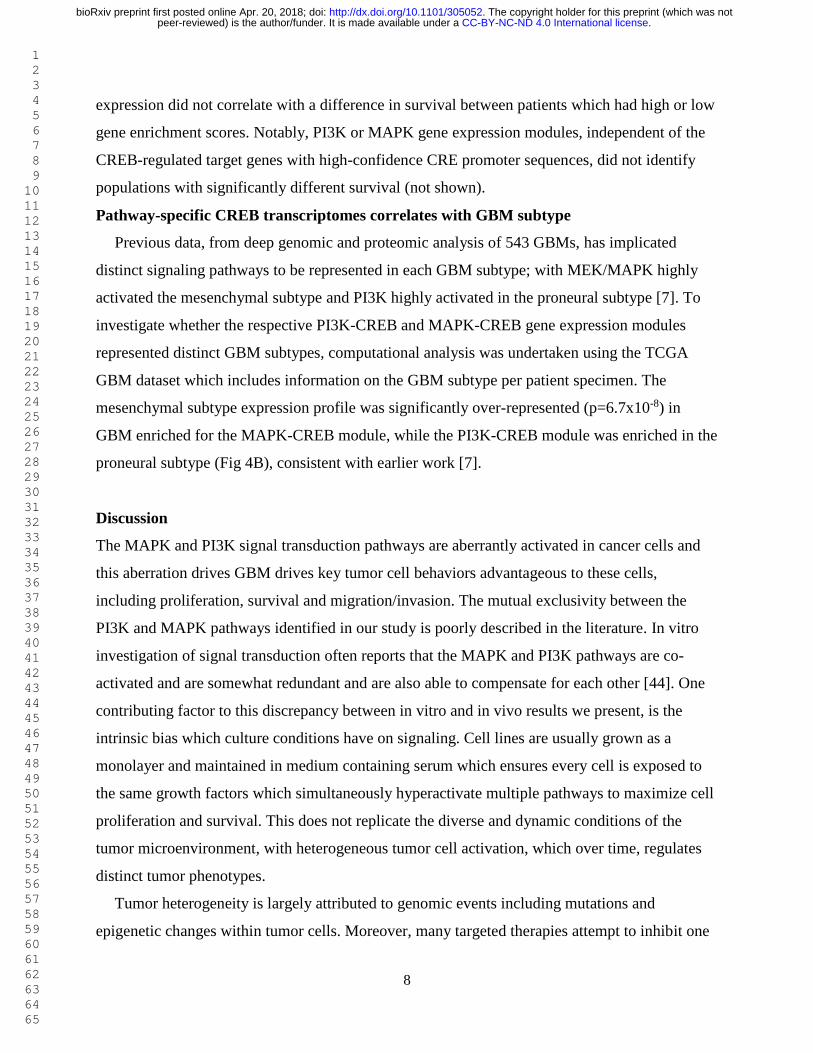
8
expression did not correlate with a difference in survival between patients which had high or low
gene enrichment scores. Notably, PI3K or MAPK gene expression modules, independent of the
CREB-regulated target genes with high-confidence CRE promoter sequences, did not identify
populations with significantly different survival (not shown).
Pathway-specific CREB transcriptomes correlates with GBM subtype
Previous data, from deep genomic and proteomic analysis of 543 GBMs, has implicated
distinct signaling pathways to be represented in each GBM subtype; with MEK/MAPK highly
activated the mesenchymal subtype and PI3K highly activated in the proneural subtype [7]. To
investigate whether the respective PI3K-CREB and MAPK-CREB gene expression modules
represented distinct GBM subtypes, computational analysis was undertaken using the TCGA
GBM dataset which includes information on the GBM subtype per patient specimen. The
mesenchymal subtype expression profile was significantly over-represented (p=6.7x10⁻⁸) in
GBM enriched for the MAPK-CREB module, while the PI3K-CREB module was enriched in the
proneural subtype (Fig 4B), consistent with earlier work [7].
Discussion
The MAPK and PI3K signal transduction pathways are aberrantly activated in cancer cells and
this aberration drives GBM drives key tumor cell behaviors advantageous to these cells,
including proliferation, survival and migration/invasion. The mutual exclusivity between the
PI3K and MAPK pathways identified in our study is poorly described in the literature. In vitro
investigation of signal transduction often reports that the MAPK and PI3K pathways are co-
activated and are somewhat redundant and are also able to compensate for each other [44]. One
contributing factor to this discrepancy between in vitro and in vivo results we present, is the
intrinsic bias which culture conditions have on signaling. Cell lines are usually grown as a
monolayer and maintained in medium containing serum which ensures every cell is exposed to
the same growth factors which simultaneously hyperactivate multiple pathways to maximize cell
proliferation and survival. This does not replicate the diverse and dynamic conditions of the
tumor microenvironment, with heterogeneous tumor cell activation, which over time, regulates
distinct tumor phenotypes.
Tumor heterogeneity is largely attributed to genomic events including mutations and
epigenetic changes within tumor cells. Moreover, many targeted therapies attempt to inhibit one
1 2 3 4 5 6 7 8 9 10 11 12 13 14 15 16 17 18 19 20 21 22 23 24 25 26 27 28 29 30 31 32 33 34 35 36 37 38 39 40 41 42 43 44 45 46 47 48 49 50 51 52 53 54 55 56 57 58 59 60 61 62 63 64 65
.CC-BY-NC-ND 4.0 International licensepeer-reviewed) is the author/funder. It is made available under aThe copyright holder for this preprint (which was not. http://dx.doi.org/10.1101/305052doi: bioRxiv preprint first posted online Apr. 20, 2018;

9
of these two key pathways using drugs targeting one of more pivotal molecules within the
pathway. One of the difficulties in the analysis of tumor biology is a whole-tumor molecular
view of intracellular events. Various experimental techniques can determine tumor gene
sequence, mRNA and/or protein expression levels [12, 25, 43]. Examination of large numbers of
patient GBM tissue biopsies using tissue microarrays have yielded important data on the
expression of hundreds of proteins [42]. Despite the importance of these large-scale “omic”
studies, the samples are lysates from a mixed cell population, devoid of the regional
heterogeneity in tumors, in situ. High-throughput single cell analysis techniques can bypass some
of the issues, but it remains to be seen how representative individual isolated cell experiments
are, compared to in situ cell behaviors. One approach to interrogate the molecular events in
GBM is to examine large tissue sections and multiple biomarkers which represent specific
biological functions and/or therapeutic targets. A recent study demonstrates the value of this
approach and analyzed tumor biomarkers using an integrated multiplexed tissue imaging
platform on FFPE breast tumor tissue and correlated biomarker expression and MAPK and PI3K
pathway activation with specific oncogenic mutations and histopathological diagnosis and
demonstrated regional intra-tumoral pathway and biomarker expression heterogeneity [35]. We
previously showed that proliferative and invasive GBM tumor regions, characterized by high
olig-2 and CD44 expression, respectively, are regionally separated [9, 10] and that this
expression is also associated with distinct GBM subtypes and that GBM heterogeneity can at
least, in part, be attributed to intrinsic properties of the tumor cells. However, the status of the
MAPK and PI3K pathways was not investigated.
In the present study, we showed that in GBM there was a mutual exclusivity of MAPK active
tissue regions and PI3K active regions, in the same tissue biopsy. The activation status of MAPK
active regions correlated with expression of the proliferation biomarker, PCNA [39], tumor cell
invasion biomarker MMP-9 [22], pCREB expression, a pro-oncogenic transcription factor
regulating genes involved in proliferation and survival [16, 24, 37] but little or no expression of
CD44, a biomarker of tumor stem cells and cell invasion [33]. PI3K pathway active regions
exhibited high levels of CD44 expression but little or no expression of PCNA, pCREB or MMP-
9. The regionally distinct expression of MMP-9 and CD44 is interesting, since both genes are
associated with tumor cell invasion/migration but in this case, it appears that these proteins may
have distinct tumor promoting functions.
1 2 3 4 5 6 7 8 9 10 11 12 13 14 15 16 17 18 19 20 21 22 23 24 25 26 27 28 29 30 31 32 33 34 35 36 37 38 39 40 41 42 43 44 45 46 47 48 49 50 51 52 53 54 55 56 57 58 59 60 61 62 63 64 65
.CC-BY-NC-ND 4.0 International licensepeer-reviewed) is the author/funder. It is made available under aThe copyright holder for this preprint (which was not. http://dx.doi.org/10.1101/305052doi: bioRxiv preprint first posted online Apr. 20, 2018;

10
In-silico analysis showed that CREB sits at signaling convergence point downstream of both
the MAPK and PI3K pathways with target genes activated common to both pathways but also
distinct target genes, specific for each of the upstream pathways. Highly expressed PI3K-CREB
target genes are prominent in ‘metastasis’ functions, suggesting that PI3K-CREB signals may be
important for regulating the invasive behaviors of GBM cells. MAPK-CREB target genes are
clearly associated with proliferation and inflammation. The clinical relevance of the analysis was
highlighted by the finding that MAPK-CREB target genes but not PI3K-CREB target genes are
associated with poorer survival in GBM and that the mesenchymal GBM subtype was over-
represented in patient tissue showing high MAPK-CREB target genes expression, whereas PI3K-
CREB target gene expression correlated with the proneural GBM subtype. It is important to note
that the distinct mesenchymal and proneural subtypes discussed in our study coexist in the same
tumor tissue, while the literature has generally inferred that GBM subtypes are patient-specific.
Our findings support a less prevalent view that single GBM tumors harbor more than one
subtype signature, as proposed by Sotoriva and colleagues [40]. This also raises the question of,
why the distinct signaling-CREB gene modules show differences in patient survival? We
propose that when MAPK-CREB target gene expression across the whole GBM tumor is high,
this drives a more malignant phenotype and shorter survival, compared with tumors with higher
PI3K-CREB regulated gene expression.
Overall, the data presented here suggests that distinct MAPK and PI3K pathway activation
and the downstream consequences lead to specific tumor cell responses. These regional
variations may be caused by transient or long-term microenvironmental differences across the
tissue. Regional signaling responses in the tumor tissue may also account for setting up
topographically defined tumor tissue domains, similar to morphogenetic field responses in
embryonic tissue. It is possible that neighboring cells within GBM tissue exhibit transient
dynamic signaling events but how dynamic these regional differences are, remains to be
determined and would require a means to monitor pathway activity, in situ. Another important
issue raised by the data, is that GBM tumor cells do not require the simultaneous activation of
both the MAPK and PI3K pathways. The clinical significance of the study is that it supports the
view that for effective targeted GBM therapy, inhibiting both pathways, in combination with
standard therapy, is necessary. If combined targeting proves to be too toxic, an alternative
strategy may be that pharmacologically manipulating tumor cell signaling and dependence, from
1 2 3 4 5 6 7 8 9 10 11 12 13 14 15 16 17 18 19 20 21 22 23 24 25 26 27 28 29 30 31 32 33 34 35 36 37 38 39 40 41 42 43 44 45 46 47 48 49 50 51 52 53 54 55 56 57 58 59 60 61 62 63 64 65
.CC-BY-NC-ND 4.0 International licensepeer-reviewed) is the author/funder. It is made available under aThe copyright holder for this preprint (which was not. http://dx.doi.org/10.1101/305052doi: bioRxiv preprint first posted online Apr. 20, 2018;

11
MAPK to PI3K, may shift GBM cells to a less malignant state, extending he therapeutic window
and overall survival.
Acknowledgments
Parts of this work were funded by a CASS Foundation Grant (7941) and Brain Foundation
Award.
References
1 Albeck JG, Mills GB, Brugge JS (2013) Frequency-modulated pulses of ERK activity transmit
quantitative proliferation signals. Molecular cell 49: 249-261 Doi 10.1016/j.molcel.2012.11.002
2 Alcantara Llaguno S, Chen J, Kwon CH, Jackson EL, Li Y, Burns DK, Alvarez-Buylla A, Parada
LF (2009) Malignant astrocytomas originate from neural stem/progenitor cells in a somatic tumor
suppressor mouse model. Cancer Cell 15: 45-56 Doi 10.1016/j.ccr.2008.12.006
3 Anders S, Huber W (2010) Differential expression analysis for sequence count data. Genome
biology 11: R106 Doi 10.1186/gb-2010-11-10-r106
4 Bozdag S, Li A, Baysan M, Fine HA (2014) Master regulators, regulatory networks, and
pathways of glioblastoma subtypes. Cancer informatics 13: 33-44 Doi 10.4137/CIN.S14027
5 Bratton MR, Duong BN, Elliott S, Weldon CB, Beckman BS, McLachlan JA, Burow ME (2010)
Regulation of ERalpha-mediated transcription of Bcl-2 by PI3K-AKT crosstalk: implications for
breast cancer cell survival. International journal of oncology 37: 541-550
6 Brennan C, Momota H, Hambardzumyan D, Ozawa T, Tandon A, Pedraza A, Holland E (2009)
Glioblastoma subclasses can be defined by activity among signal transduction pathways and
associated genomic alterations. PLoS One 4: e7752 Doi 10.1371/journal.pone.0007752
7 Brennan CW, Verhaak RG, McKenna A, Campos B, Noushmehr H, Salama SR, Zheng S,
Chakravarty D, Sanborn JZ, Berman SHet al (2013) The somatic genomic landscape of
glioblastoma. Cell 155: 462-477 Doi 10.1016/j.cell.2013.09.034
8 Brown DV, Daniel PM, D'Abaco GM, Gogos A, Ng W, Morokoff AP, Mantamadiotis T (2015)
Coexpression analysis of CD133 and CD44 identifies Proneural and Mesenchymal subtypes of
glioblastoma multiforme. Oncotarget 6: 6267-6280
9 Brown DV, Daniel PM, D’Abaco GM, Gogos A, Ng W, Morokoff AP, Mantamadiotis T (2015)
Coexpression analysis of CD133 and CD44 identifies Proneural and Mesenchymal subtypes of
glioblastoma multiforme. Oncotarget:
10 Brown DV, Filiz G, Daniel PM, Hollande F, Dworkin S, Amiridis S, Kountouri N, Ng W,
Morokoff AP, Mantamadiotis T (2017) Expression of CD133 and CD44 in glioblastoma stem
cells correlates with cell proliferation, phenotype stability and intra-tumor heterogeneity. PLoS
One 12: e0172791 Doi 10.1371/journal.pone.0172791
11 Brunet A, Bonni A, Zigmond MJ, Lin MZ, Juo P, Hu LS, Anderson MJ, Arden KC, Blenis J,
Greenberg ME (1999) Akt promotes cell survival by phosphorylating and inhibiting a Forkhead
transcription factor. Cell 96: 857-868
12 Cancer Genome Atlas Research N (2008) Comprehensive genomic characterization defines
human glioblastoma genes and core pathways. Nature 455: 1061-1068 Doi 10.1038/nature07385
13 Cerami E, Gao J, Dogrusoz U, Gross BE, Sumer SO, Aksoy BA, Jacobsen A, Byrne CJ, Heuer
ML, Larsson Eet al (2012) The cBio cancer genomics portal: an open platform for exploring
multidimensional cancer genomics data. Cancer discovery 2: 401-404 Doi 10.1158/2159-
8290.CD-12-0095
1 2 3 4 5 6 7 8 9 10 11 12 13 14 15 16 17 18 19 20 21 22 23 24 25 26 27 28 29 30 31 32 33 34 35 36 37 38 39 40 41 42 43 44 45 46 47 48 49 50 51 52 53 54 55 56 57 58 59 60 61 62 63 64 65
.CC-BY-NC-ND 4.0 International licensepeer-reviewed) is the author/funder. It is made available under aThe copyright holder for this preprint (which was not. http://dx.doi.org/10.1101/305052doi: bioRxiv preprint first posted online Apr. 20, 2018;

12
14 Chen H, Zhu G, Li Y, Padia RN, Dong Z, Pan ZK, Liu K, Huang S (2009) Extracellular signal-
regulated kinase signaling pathway regulates breast cancer cell migration by maintaining slug
expression. Cancer research 69: 9228-9235 Doi 10.1158/0008-5472.CAN-09-1950
15 Czech MP (2000) PIP2 and PIP3: complex roles at the cell surface. Cell 100: 603-606
16 Daniel P, Filiz G, Brown DV, Hollande F, Gonzales M, D'Abaco G, Papalexis N, Phillips WA,
Malaterre J, Ramsay RGet al (2014) Selective CREB-dependent cyclin expression mediated by
the PI3K and MAPK pathways supports glioma cell proliferation. Oncogenesis 3: e108 Doi
10.1038/oncsis.2014.21
17 Du K, Montminy M (1998) CREB is a regulatory target for the protein kinase Akt/PKB. J Biol
Chem 273: 32377-32379
18 Failly M, Korur S, Egler V, Boulay JL, Lino MM, Imber R, Merlo A (2007) Combination of
sublethal concentrations of epidermal growth factor receptor inhibitor and microtubule stabilizer
induces apoptosis of glioblastoma cells. Molecular cancer therapeutics 6: 773-781 Doi
10.1158/1535-7163.MCT-06-0566
19 Guo G, Gong K, Wohlfeld B, Hatanpaa KJ, Zhao D, Habib AA (2015) Ligand-Independent
EGFR Signaling. Cancer research: Doi 10.1158/0008-5472.CAN-15-0989
20 Kita D, Yonekawa Y, Weller M, Ohgaki H (2007) PIK3CA alterations in primary (de novo) and
secondary glioblastomas. Acta Neuropathol 113: 295-302 Doi 10.1007/s00401-006-0186-1
21 Kleber S, Sancho-Martinez I, Wiestler B, Beisel A, Gieffers C, Hill O, Thiemann M, Mueller W,
Sykora J, Kuhn Aet al (2008) Yes and PI3K bind CD95 to signal invasion of glioblastoma.
Cancer cell 13: 235-248 Doi 10.1016/j.ccr.2008.02.003
22 Kondraganti S, Mohanam S, Chintala SK, Kin Y, Jasti SL, Nirmala C, Lakka SS, Adachi Y,
Kyritsis AP, Ali-Osman Fet al (2000) Selective suppression of matrix metalloproteinase-9 in
human glioblastoma cells by antisense gene transfer impairs glioblastoma cell invasion. Cancer
Res 60: 6851-6855
23 Laplante M, Sabatini DM (2012) mTOR signaling in growth control and disease. Cell 149: 274-
293 Doi 10.1016/j.cell.2012.03.017
24 Mantamadiotis T, Papalexis N, Dworkin S (2012) CREB signalling in neural stem/progenitor
cells: recent developments and the implications for brain tumour biology. Bioessays 34: 293-300
Doi 10.1002/bies.201100133
25 Marziali G, Signore M, Buccarelli M, Grande S, Palma A, Biffoni M, Rosi A, D'Alessandris QG,
Martini M, Larocca LMet al (2016) Metabolic/Proteomic Signature Defines Two Glioblastoma
Subtypes With Different Clinical Outcome. Sci Rep 6: 21557 Doi 10.1038/srep21557
26 Mendoza MC, Er EE, Blenis J (2011) The Ras-ERK and PI3K-mTOR pathways: cross-talk and
compensation. Trends Biochem Sci 36: 320-328 Doi 10.1016/j.tibs.2011.03.006
27 Mittal S, Sharma A, Balaji SA, Gowda MC, Dighe RR, Kumar RV, Rangarajan A (2014)
Coordinate hyperactivation of Notch1 and Ras/MAPK pathways correlates with poor patient
survival: novel therapeutic strategy for aggressive breast cancers. Molecular cancer therapeutics
13: 3198-3209 Doi 10.1158/1535-7163.MCT-14-0280
28 Mizoguchi M, Betensky RA, Batchelor TT, Bernay DC, Louis DN, Nutt CL (2006) Activation of
STAT3, MAPK, and AKT in malignant astrocytic gliomas: correlation with EGFR status, tumor
grade, and survival. J Neuropathol Exp Neurol 65: 1181-1188 Doi
10.1097/01.jnen.0000248549.14962.b2
29 Patel AP, Tirosh I, Trombetta JJ, Shalek AK, Gillespie SM, Wakimoto H, Cahill DP, Nahed BV,
Curry WT, Martuza RLet al (2014) Single-cell RNA-seq highlights intratumoral heterogeneity in
primary glioblastoma. Science 344: 1396-1401 Doi 10.1126/science.1254257
30 Patil CG, Nuno M, Elramsisy A, Mukherjee D, Carico C, Dantis J, Hu J, Yu JS, Fan X, Black
KLet al (2013) High levels of phosphorylated MAP kinase are associated with poor survival
among patients with glioblastoma during the temozolomide era. Neuro-oncology 15: 104-111 Doi
10.1093/neuonc/nos272
1 2 3 4 5 6 7 8 9 10 11 12 13 14 15 16 17 18 19 20 21 22 23 24 25 26 27 28 29 30 31 32 33 34 35 36 37 38 39 40 41 42 43 44 45 46 47 48 49 50 51 52 53 54 55 56 57 58 59 60 61 62 63 64 65
.CC-BY-NC-ND 4.0 International licensepeer-reviewed) is the author/funder. It is made available under aThe copyright holder for this preprint (which was not. http://dx.doi.org/10.1101/305052doi: bioRxiv preprint first posted online Apr. 20, 2018;

13
31 Pelloski CE, Lin E, Zhang L, Yung WK, Colman H, Liu JL, Woo SY, Heimberger AB, Suki D,
Prados Met al (2006) Prognostic associations of activated mitogen-activated protein kinase and
Akt pathways in glioblastoma. Clin Cancer Res 12: 3935-3941 Doi 12/13/3935 [pii]
10.1158/1078-0432.CCR-05-2202
32 Penzvalto Z, Lanczky A, Lenart J, Meggyeshazi N, Krenacs T, Szoboszlai N, Denkert C, Pete I,
Gyorffy B (2014) MEK1 is associated with carboplatin resistance and is a prognostic biomarker
in epithelial ovarian cancer. BMC cancer 14: 837 Doi 10.1186/1471-2407-14-837
33 Radotra B, McCormick D (1997) Glioma invasion in vitro is mediated by CD44-hyaluronan
interactions. J Pathol 181: 434-438 Doi 10.1002/(SICI)1096-9896(199704)181:4<434::AID-
PATH797>3.0.CO;2-S
34 Rebhan M, Chalifa-Caspi V, Prilusky J, Lancet D (1997) GeneCards: integrating information
about genes, proteins and diseases. Trends Genet 13: 163
35 Roberts E, Jacob T, Garsha K, Ramunno-Johnson D, Ventura F, Korkola J, Ashworth-Sharpe J,
Johnson D, Corless C, Troxell Met al (2016) Mapping cancer signaling networks by an integrated
multiplexed tissue imaging platform. Technology 4: Doi
https://doi.org/10.1142/S2339547816500060
36 Samowitz WS, Sweeney C, Herrick J, Albertsen H, Levin TR, Murtaugh MA, Wolff RK, Slattery
ML (2005) Poor survival associated with the BRAF V600E mutation in microsatellite-stable
colon cancers. Cancer research 65: 6063-6069 Doi 10.1158/0008-5472.CAN-05-0404
37 Sampurno S, Bijenhof A, Cheasley D, Xu H, Robine S, Hilton D, Alexander WS, Pereira L,
Mantamadiotis T, Malaterre Jet al (2013) The Myb-p300-CREB axis modulates intestine
homeostasis, radiosensitivity and tumorigenesis. Cell Death Dis 4: e605 Doi
10.1038/cddis.2013.119
38 Santo EE, Stroeken P, Sluis PV, Koster J, Versteeg R, Westerhout EM (2013) FOXO3a is a
major target of inactivation by PI3K/AKT signaling in aggressive neuroblastoma. Cancer
research 73: 2189-2198 Doi 10.1158/0008-5472.CAN-12-3767
39 Sasaki A, Naganuma H, Kimura R, Isoe S, Nakano S, Nukui H, Suzuki K, Kawaoi A (1992)
Proliferating cell nuclear antigen (PCNA) immunostaining as an alternative to
bromodeoxyuridine (BrdU) immunostaining for brain tumours in paraffin embedded sections.
Acta Neurochir (Wien) 117: 178-181
40 Sottoriva A, Spiteri I, Piccirillo SG, Touloumis A, Collins VP, Marioni JC, Curtis C, Watts C,
Tavare S (2013) Intratumor heterogeneity in human glioblastoma reflects cancer evolutionary
dynamics. Proc Natl Acad Sci U S A 110: 4009-4014 Doi 10.1073/pnas.1219747110
41 Tamborero D, Gonzalez-Perez A, Perez-Llamas C, Deu-Pons J, Kandoth C, Reimand J, Lawrence
MS, Getz G, Bader GD, Ding L et al (2013) Comprehensive identification of mutational cancer
driver genes across 12 tumor types. Sci Rep 3: 2650 Doi 10.1038/srep02650
42 Uhlen M, Fagerberg L, Hallstrom BM, Lindskog C, Oksvold P, Mardinoglu A, Sivertsson A,
Kampf C, Sjostedt E, Asplund A et al (2015) Proteomics. Tissue-based map of the human
proteome. Science 347: 1260419 Doi 10.1126/science.1260419
43 Verhaak RG, Hoadley KA, Purdom E, Wang V, Qi Y, Wilkerson MD, Miller CR, Ding L, Golub
T, Mesirov JP et al (2010) Integrated genomic analysis identifies clinically relevant subtypes of
glioblastoma characterized by abnormalities in PDGFRA, IDH1, EGFR, and NF1. Cancer Cell
17: 98-110 Doi 10.1016/j.ccr.2009.12.020
44 Vitucci M, Karpinich NO, Bash RE, Werneke AM, Schmid RS, White KK, McNeill RS, Huff B,
Wang S, Van Dyke T et al (2013) Cooperativity between MAPK and PI3K signaling activation is
required for glioblastoma pathogenesis. Neuro Oncol 15: 1317-1329 Doi 10.1093/neuonc/not084
45 Xiao A, Wu H, Pandolfi PP, Louis DN, Van Dyke T (2002) Astrocyte inactivation of the pRb
pathway predisposes mice to malignant astrocytoma development that is accelerated by PTEN
mutation. Cancer cell 1: 157-168
1 2 3 4 5 6 7 8 9 10 11 12 13 14 15 16 17 18 19 20 21 22 23 24 25 26 27 28 29 30 31 32 33 34 35 36 37 38 39 40 41 42 43 44 45 46 47 48 49 50 51 52 53 54 55 56 57 58 59 60 61 62 63 64 65
.CC-BY-NC-ND 4.0 International licensepeer-reviewed) is the author/funder. It is made available under aThe copyright holder for this preprint (which was not. http://dx.doi.org/10.1101/305052doi: bioRxiv preprint first posted online Apr. 20, 2018;

14
46 Xing J, Ginty DD, Greenberg ME (1996) Coupling of the RAS-MAPK pathway to gene
activation by RSK2, a growth factor-regulated CREB kinase. Science 273: 959-963
47 Zhang X, Odom DT, Koo SH, Conkright MD, Canettieri G, Best J, Chen H, Jenner R,
Herbolsheimer E, Jacobsen E et al (2005) Genome-wide analysis of cAMP-response element
binding protein occupancy, phosphorylation, and target gene activation in human tissues.
Proceedings of the National Academy of Sciences of the United States of America 102: 4459-
4464 Doi 0501076102 [pii] 10.1073/pnas.0501076102
1 2 3 4 5 6 7 8 9 10 11 12 13 14 15 16 17 18 19 20 21 22 23 24 25 26 27 28 29 30 31 32 33 34 35 36 37 38 39 40 41 42 43 44 45 46 47 48 49 50 51 52 53 54 55 56 57 58 59 60 61 62 63 64 65
.CC-BY-NC-ND 4.0 International licensepeer-reviewed) is the author/funder. It is made available under aThe copyright holder for this preprint (which was not. http://dx.doi.org/10.1101/305052doi: bioRxiv preprint first posted online Apr. 20, 2018;

15
Figure Legends
Fig. 1. Distinct expression of activated MAPK and PI3K pathways and GBM tumor
biomarkers in GBM tissue. (A) IHC analysis of groups of consecutive slides from three
GBM patient specimens, showing distinct patterns of co-localization of pCREB with
pERK1/2, pAKT(S473), PCNA and CD44. Scale bar = 5mm. (B) Biomarker expression in
different regions of the same tumor (tumor 2). Scale bar = 200µm.
Fig. 2. Co-expression of the MAPK and PI3K pathways with activated CREB in GBM
tissue. Immunofluorescence of GBM patient specimens were co-stained with pAKT(S473) and
pCREB antibodies or pMAPK and pCREB antibodies to investigate co-localization in GBM
cells, showing the co-expression of these proteins in GBM tissue. Sections were also stained
with DAPI to highlight the cell nuclei. Scale bar = 100µm.
Fig.3. Pathway-specific CREB target genes are functionally distinct in GBM. A) Schematic
showing the flow of single-sample Gene Set Enrichment Analysis (ssGSEA) used to analyze the
TCGA GBM gene expression data set to enrich for MAPK and PI3K signature genes which are
putative CREB target genes. See Methods for details. (B) GSEA analysis of 543 GBM patient
expression and clinical data for signal pathway and CREB target gene enrichment demonstrating
enrichment of MAPK-CREB genes and PI3K-CREB genes and associated tumor functions;
colored bars represent individual patients from the TCGA cohort.
Fig. 4. Pathway-specific CREB target gene expression correlates with survival and GBM
subtype. A) Survival analysis of patients defined by enrichment of MAPK-CREB and PI3K-
CREB target genes. B) The MAPK‐ CREB signaling-transcription module associates with
Mesenchymal (MES) subtype GBM and PI3K‐ CREB module associates with Proneural (PN)
GBM. “All samples” refers to the GBM subtype distribution of the 543 patient samples in
TCGA. NL – Neural; CL – Classical.
1 2 3 4 5 6 7 8 9 10 11 12 13 14 15 16 17 18 19 20 21 22 23 24 25 26 27 28 29 30 31 32 33 34 35 36 37 38 39 40 41 42 43 44 45 46 47 48 49 50 51 52 53 54 55 56 57 58 59 60 61 62 63 64 65
.CC-BY-NC-ND 4.0 International licensepeer-reviewed) is the author/funder. It is made available under aThe copyright holder for this preprint (which was not. http://dx.doi.org/10.1101/305052doi: bioRxiv preprint first posted online Apr. 20, 2018;

Table 1. CREB targets regulated by the MAPK and PI3K pathways. The number of
genes differentially expressed in GBM (TCGA-GBM dataset), compared to normal brain
tissue. Genes were divided into those associated with either the MAPK or PI3K pathways,
using the Kyoto Encyclopedia of Genes and Genomes (KEGG) gene function annotations.
From these genes, overexpressed genes were selected and CREB target genes identified. The
last column indicates the number of CREB target genes unique to each pathway.
Pathway (KEGG) Differentially
Expressed
Genes
Overexpressed
Genes
Total CREB
target genes
CREB Target
Genes Unique
to Pathway
MAPK Pathway 2846 930 161 132
PI3K Pathway 2546 1068 203 114
Table 1
.CC-BY-NC-ND 4.0 International licensepeer-reviewed) is the author/funder. It is made available under aThe copyright holder for this preprint (which was not. http://dx.doi.org/10.1101/305052doi: bioRxiv preprint first posted online Apr. 20, 2018;
Table 2. Gene ontology for PI3K-CREB and MAPK-CREB target gene modules. Listing
of the most significant genes identified using the pipeline analysis described in Material and
Methods and Fig 3A. (FDR = False-Discovery Rate).
Gene module Gene Ontology
Descriptor
Gene Symbol p-value FDR
PI3K-CREB Cellular
Macromolecule
Metabolic Process
PICK1, PDPK1, CDC42BPB,
GAL3ST1, DUSP8, CSNK1E,
TUFM, B3GALT2, UBE4A2,
PYGM, MAPT, EIF4A2,
MGEA5
4.49x10⁻⁶ 6.53x10⁻³
Biopolymer
Metabolic Process
PICK1, PDPK1, CDC42BPB,
GAL3ST1, DUSP8, CSNK1E,
TUFM, B3GALT2, UBE4A2,
ARID1A, HDAC5, SNR,
HTATSF1, KLF13
1.69x10⁻⁵ 6.59x10⁻³
Cellular Protein
Metabolic Process
PICK1, PDPK1, CDC42BPB,
GAL3ST1, DUSP8, CSNK1E,
TUFM, B3GALT2, UBE4A2,
MAPT, EIF4A2, MGEA5
2.08x10⁻⁵ 6.59x10⁻³
MAPK-CREB Positive Regulation
of Biological Process
SCG2, NLRC4, TNFSF14, PML,
ECL1, DAPK3, TICAM1,
RHOG, VEGFA, MAP2K3,
HSP90AA1, TPP1, FLT1, C2
1.98x10⁻⁸ 2.85x10⁻⁵
Signal Transduction SCG2, NLRC4, TNFSF14, PML,
ECL1, DAPK3, TICAM1,
RHOG, VEGFA, MAP2K3,
ARHGAP27, GADD45B,
TNFAIP3, FGD5, HOMER3,
TRH, ZYX, CSNK1G2, IL7R,
RCAN1
4.86x10⁻⁸ 3.54x10⁻⁵
Positive Regulation
of Cellular Process
SCG2, NLRC4, TNFSF14, PML,
ECL1, DAPK3, TICAM1,
RHOG, VEGFA, MAP2K3,
HSP90AA1, TPP1, FLT1,
7.64x10⁻⁸ 3.7x10⁻⁵
Table 2
.CC-BY-NC-ND 4.0 International licensepeer-reviewed) is the author/funder. It is made available under aThe copyright holder for this preprint (which was not. http://dx.doi.org/10.1101/305052doi: bioRxiv preprint first posted online Apr. 20, 2018;
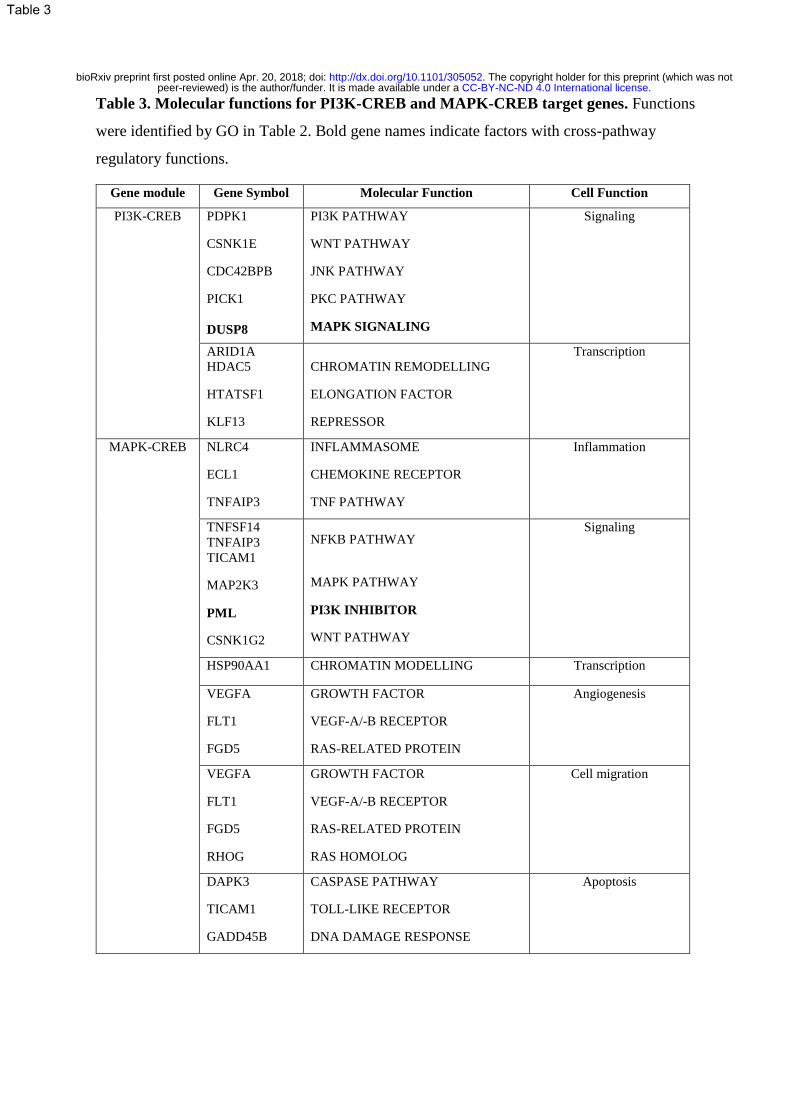
Table 3. Molecular functions for PI3K-CREB and MAPK-CREB target genes. Functions
were identified by GO in Table 2. Bold gene names indicate factors with cross-pathway
regulatory functions.
Gene module Gene Symbol Molecular Function Cell Function
PI3K-CREB PDPK1
CSNK1E
CDC42BPB
PICK1
DUSP8
PI3K PATHWAY
WNT PATHWAY
JNK PATHWAY
PKC PATHWAY
MAPK SIGNALING
Signaling
ARID1A
HDAC5
HTATSF1
KLF13
CHROMATIN REMODELLING
ELONGATION FACTOR
REPRESSOR
Transcription
MAPK-CREB NLRC4
ECL1
TNFAIP3
INFLAMMASOME
CHEMOKINE RECEPTOR
TNF PATHWAY
Inflammation
TNFSF14
TNFAIP3
TICAM1
MAP2K3
PML
CSNK1G2
NFKB PATHWAY
MAPK PATHWAY
PI3K INHIBITOR
WNT PATHWAY
Signaling
HSP90AA1 CHROMATIN MODELLING Transcription
VEGFA
FLT1
FGD5
GROWTH FACTOR
VEGF-A/-B RECEPTOR
RAS-RELATED PROTEIN
Angiogenesis
VEGFA
FLT1
FGD5
RHOG
GROWTH FACTOR
VEGF-A/-B RECEPTOR
RAS-RELATED PROTEIN
RAS HOMOLOG
Cell migration
DAPK3
TICAM1
GADD45B
CASPASE PATHWAY
TOLL-LIKE RECEPTOR
DNA DAMAGE RESPONSE
Apoptosis
Table 3
.CC-BY-NC-ND 4.0 International licensepeer-reviewed) is the author/funder. It is made available under aThe copyright holder for this preprint (which was not. http://dx.doi.org/10.1101/305052doi: bioRxiv preprint first posted online Apr. 20, 2018;

.CC-BY-NC-ND 4.0 International licensepeer-reviewed) is the author/funder. It is made available under aThe copyright holder for this preprint (which was not. http://dx.doi.org/10.1101/305052doi: bioRxiv preprint first posted online Apr. 20, 2018;

.CC-BY-NC-ND 4.0 International licensepeer-reviewed) is the author/funder. It is made available under aThe copyright holder for this preprint (which was not. http://dx.doi.org/10.1101/305052doi: bioRxiv preprint first posted online Apr. 20, 2018;

.CC-BY-NC-ND 4.0 International licensepeer-reviewed) is the author/funder. It is made available under aThe copyright holder for this preprint (which was not. http://dx.doi.org/10.1101/305052doi: bioRxiv preprint first posted online Apr. 20, 2018;

.CC-BY-NC-ND 4.0 International licensepeer-reviewed) is the author/funder. It is made available under aThe copyright holder for this preprint (which was not. http://dx.doi.org/10.1101/305052doi: bioRxiv preprint first posted online Apr. 20, 2018;


![Targeting of PI3K/AKT/mTOR pathway to inhibit T cell activation … · 2017. 8. 25. · AKT/mammalian target of rapamycin (PI3K/AKT/ mTOR) [1]. This pathway controls numerous cellular](https://img.pdfslide.net/doc/110x75/60af5eaa6ab71f4bc15363aa/targeting-of-pi3kaktmtor-pathway-to-inhibit-t-cell-activation-2017-8-25-aktmammalian.jpg)