Embed Size (px)
Citation preview
rjofutures.com 800-441-1616A division of R.J. O’Brien
All About Chart Patterns, Candlesticks and Technical Studies
Introduction to Technical Analysis
Important Information About Trading Futures and Options on Futures
This communication is intended as a solicitation. Futures trading involves the substantial risk of loss
and is not suitable for all investors. Trading advice is based on information taken from trades and
statistical services and other sources which RJ O’Brien believes are reliable. We do not guarantee
that such information is accurate or complete and it should be relied upon as such. Trading advice
reflects our good faith judgment at a specific time and is subject to change without notice. There
is no guarantee that the advice we give will result in profitable trades. All trading decisions will be
made by the account holder. Past performance is not necessarily indicative of future trading results.
When analyzing option strategies, it is important to take into account the commission and
fees associated with making a trade. Similar to trading futures, each contract executed
in an option strategy is charged commission and fees. Commissions and fees from
brokerage firms can be up to $99 per round turn with the vast majority of people paying
significantly less. Your actual charges may vary based on the service level you choose.
The two primary factors investors tend to overlook when trading options include:
• Each contract traded is charged a commission. This is often misinterpreted as
each spread or strategy that is charged a commission. If you trade one bull call
spread, your account would be charged for 2 contracts rather than 1 spread.
• Customers often try to sell or collect premium on options that are far out of the
money with the belief that they are collecting “easy money.” The further away an
option strike price is from the current market price, the lower the value of the option.
Make sure that you are not paying more in commission and fees than what you are
collecting. Keep in mind that until an option expires, you do hold risk in the positions.
Is the net premium collected after paying commission and fees worth the risk?
Table of Contents
Getting Started ......................................................................................................................................................4
The W’s of Technical Analysis Who uses technical analysis?.......................................................................................................................5
Why is technical analysis important? .........................................................................................................5
What are charts? .............................................................................................................................................6
When do you use charts? ..............................................................................................................................6
Where can you find charts? ..........................................................................................................................6
Chart Patterns Trendlines ........................................................................................................................................................8
Continuation Patterns .................................................................................................................................11
Reversal Patterns ..........................................................................................................................................16
Candlesticks ..........................................................................................................................................................21
Using and Applying Studies
Bollinger Bands ............................................................................................................................................30
Commitments of Traders (COT) .................................................................................................................30
Momentum ....................................................................................................................................................30
Moving Average .............................................................................................................................................32
Moving Average Convergence/Divergence (MACD)................................................................................32
Relative Strength Index (RSI) ......................................................................................................................32
Stochastics ....................................................................................................................................................32
Volume and Open Interest .........................................................................................................................35
Williams %R ...................................................................................................................................................35
Aditional Resources ............................................................................................................................................36
4
Technical analysis can be a useful, customizable
tool to help give you an edge, helping you
recognize when trends might be changing.
This guide will give novice traders a solid start
to understanding technical analysis and how
to apply it to their trading. Yet, even more
experienced traders will benefit from the tips
as a refresher course. Written by RJO Futures’
trading strategists, this guide captures many
years of industry knowledge and experience.
RJO Futures, the premier brokerage firm for
futures traders, has specialized in serving
futures traders for more than 100 years.
Everyone on our team is devoted to
providing the service you need to
become a successful futures trader.
A list of guides from RJO Futures covering
more specific futures trading topics—as
well as additional resources for learning the
basics—is at the end of this document.
Please feel free to contact us to answer any
questions you have about technical analysis.
Any of our experienced team can explain
the information in this guide, and help you
understand how best you might be able to
incorporate technical analysis in your trading.
Trading futures has the potential to be very rewarding. However, it can take hard
work and a lot of time to keep up with changing markets and trends.
Getting Started
ADDITIONAL RESOURCES
Click for your RJO Futures guide, Introduction to Options Trading for more detailed examination of options trading.
Or, call 800-441-1616 to request your free copy.

5
The W’s of Technical Analysis
WHO uses technical analysis?
To trade successfully, you try to make an
educated decision to buy and sell in a
timely fashion. These decisions are based
on one of three categories—technicals,
fundamentals or a combination of the two.
Technical traders rely solely on historical
chart patterns and data to predict future
price movements. Fundamental traders rely
on real-life events that may drive a market
such as the increasing demand for corn to
produce ethanol. And, many people rely
on both because even if the fundamental
information is bullish or bearish, how do you
know that the timing to make the trade is right
to initiate or liquidate a position? Studying and
executing good technical analysis practices
can help you improve your odds of success.
Once you figure out if you want to use
technicals, fundamentals or a combination
of the two, you should decide if you are a
short-term, intermediate-term (swing) or
long-term position trader. Be sure to consider
your personal temperament and lifestyle
when making that decision. Short-term
traders typically hold positions for one to
three days, while intermediate-term traders
typically hold positions for three days to three
weeks. Long-term traders hold positions for
more than three weeks. (Be aware that the
longer you hold positions, the more money
you should be willing to risk on a trade to
withstand day-to-day market volatility.)
Trading orders are identified by brokerage
firms as coming from small speculators,
large speculators (i.e., managed funds) and
commercial hedgers. Then, on a weekly basis,
each exchange submits the total long and short
positions for each group to the Commodity
Futures Trading Commission (CFTC). The
government agency produces the Commitment
of Traders report, which can be useful in
conjunction with technical analysis to improve
your timing of entering and exiting the market.
WHY is technical analysis important?
Technical analysis is important because it
chronicles both market action and price trends
as well as provides historical perspective.
Many factors can quickly change a market’s
direction, for example a surprise interest
rate change or political turmoil in a major
energy producing country. By being aware
of key price and technical study areas in the
market, you can be prepared for reacting to
these changes and managing your risk.
Seasoned traders are fond of saying that “the
trend is your friend.” Understanding technical
analysis can help you identify the trend as well
as time your trade. When you are successful
with timing the trade, you will likely become
more psychologically disciplined as a trader.
WHAT are charts?
Charts are a graphical display of historical
market data. It is common to look at charts
on both a short- and long-term basis. Charts
are available as intraday, daily, weekly, and
monthly. Typically, shorter-term traders
use shorter-term time intervals on charts to
analyze market data. Longer-term traders
tend to use longer-term time intervals on
charts to analyze data. However, all traders
may gain perspective on the market’s overall
position by using a variety of time frames.
The most common types of charts—bar,
line and candlestick—are all available
in the RJO Futures PRO platform.
WHEN do you use charts?
Technical analysis is largely used to identify
when to enter and exit a trade. For example,
you could place a buy stop above a market’s
resistance lines to enter the market and
place a sell stop below support lines to exit.
With a deeper understanding of technical
analysis, you likely will be able to make better
decisions to hold or liquidate trades as well.
WHERE can you find charts?
Charts are available from RJO Futures on
our website as well as within our web-
based and downloadable trading platforms.
You also can find charts online from news
and trading information providers
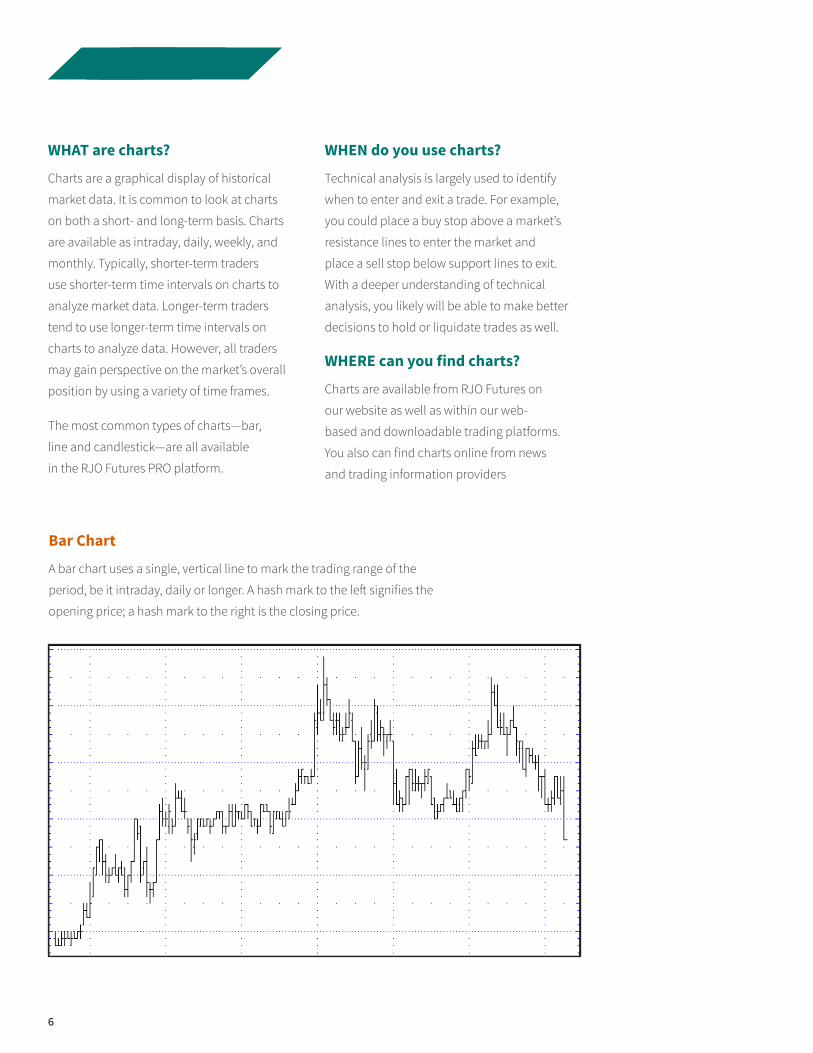
Bar Chart
A bar chart uses a single, vertical line to mark the trading range of the
period, be it intraday, daily or longer. A hash mark to the left signifies the
opening price; a hash mark to the right is the closing price.
6
7
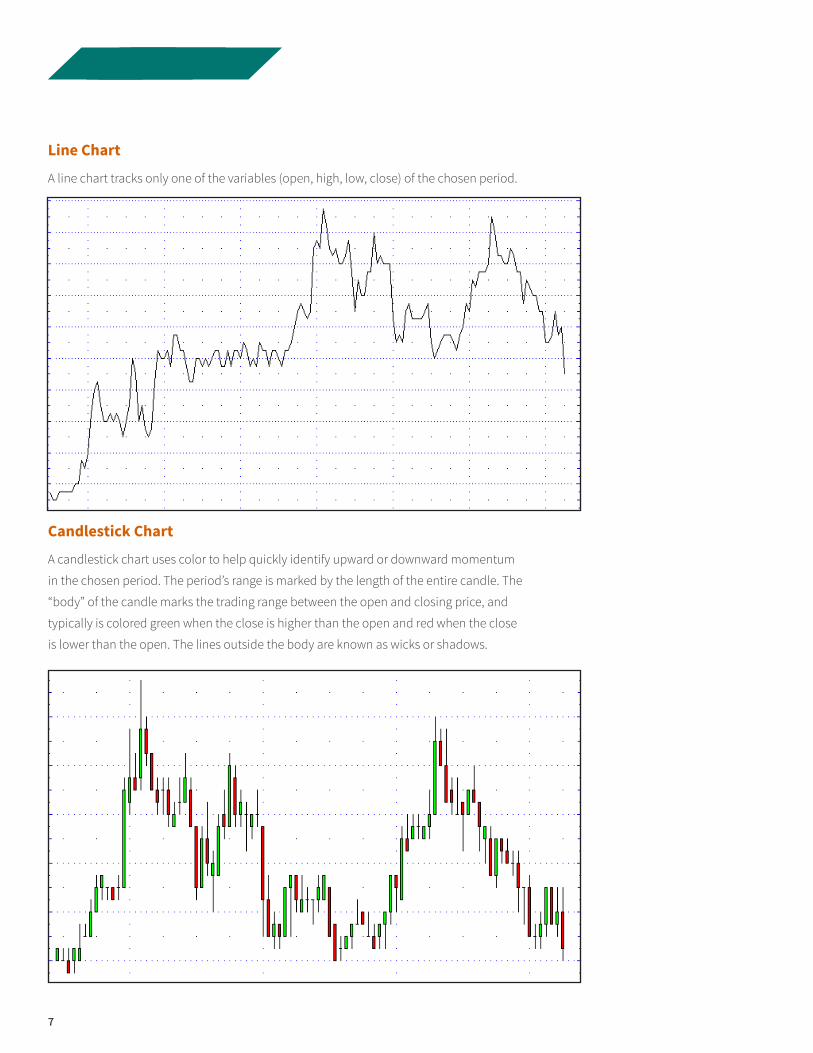
Line Chart
A line chart tracks only one of the variables (open, high, low, close) of the chosen period.
Candlestick Chart
A candlestick chart uses color to help quickly identify upward or downward momentum
in the chosen period. The period’s range is marked by the length of the entire candle. The
“body” of the candle marks the trading range between the open and closing price, and
typically is colored green when the close is higher than the open and red when the close
is lower than the open. The lines outside the body are known as wicks or shadows.
8
Chart Patterns
Trendlines
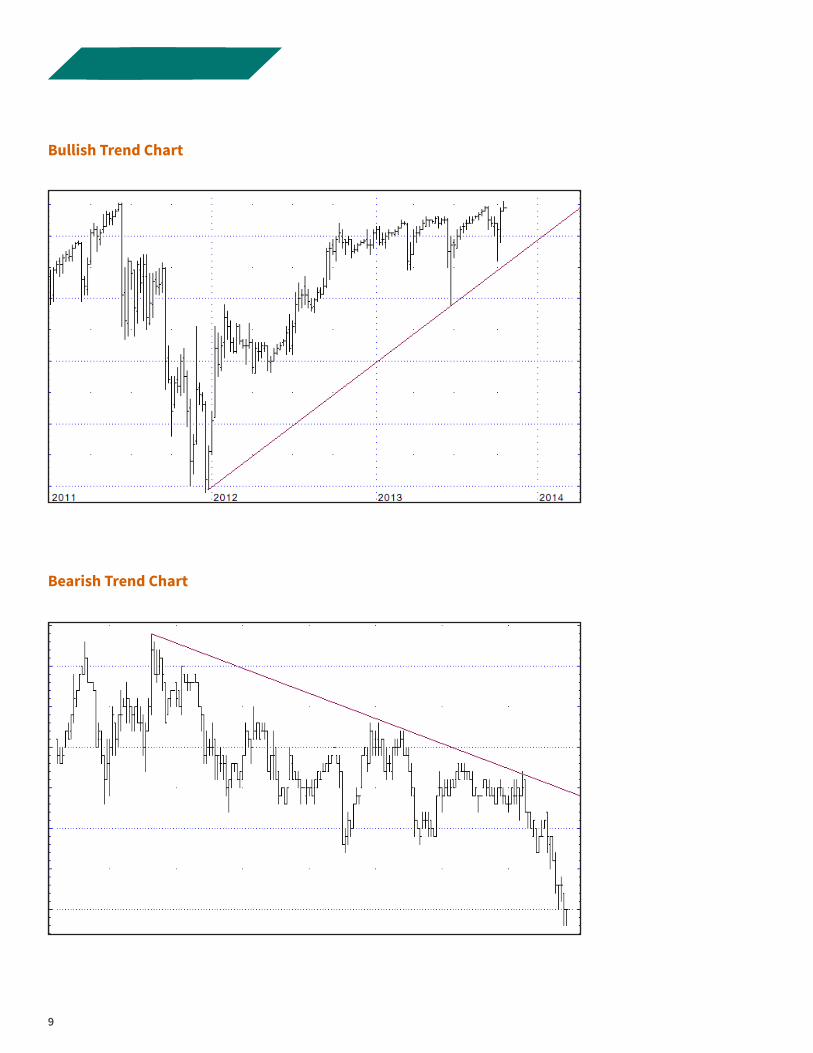
Trendlines are a valuable tool to recognize
bullish, bearish or sideways trends. Draw a bullish
trendline by connecting significant lows in a
market that is making higher highs and higher
lows. A bearish trendline connects significant
highs in a market that is making lower highs
and lower lows. Two parallel lines connect
the highs and lows in a sideways market.
Trendlines are usually applied to charts in
three time frames, including intraday, daily
and weekly. Some long-term traders also use
monthly charts. The longer the market has been
in a trend, the more significant the trendline.
Bullish trendlines (moving upward) should be
viewed as support until broken. Likewise, trendlines
moving downward should be viewed as resistance
until broken. Many traders use trendlines as part
of their risk-management strategy, placing sell
stops below trendline support and buy stops above
trendline resistance. How far above resistance
or below support you place your stops may
depend on the market’s volume and volatility.
Your RJO Futures broker can help you decide on
the appropriate distance to place your stops.
The way prices move tend to create pictures in our minds, and this section
highlights some of the most common patterns for identifying market direction and
target prices.
ADDITIONAL RESOURCES
Click for your RJO Futures guide, Introduction to Futures Trading for more detailed examination of trading the futures markets.
Or, call 800-441-1616 or 1-312-373-5478 to request your free copy.
9
Bullish Trend Chart
Bearish Trend Chart
10
Change of Trend
Identifying true trend changes can help
improve your entry and exit timing. The
most important signals include:
• Close above the resistance trendline or below the support trendline.
• Close below the most recent low or a close above the most recent high.
• Increase in volume as a trendline is broken.
• Moving average changes direction or the lines cross over each other.
The number of contracts changing hands in the
market is useful information about the trend.
When trendline support or resistance levels
hold and are accompanied by high volume,
that indicates the trendline is significant.
The simple moving average, which averages
the closing price over a set number of periods,
can signal a change in trend when it turns
or crosses over. The most common set of
moving averages include the 9-, 21-, 50-, 200
-day periods. However, you can use moving
averages on any chart from short-term intraday
charts to longer-term monthly charts.
Sometimes, of course, the market fakes
you out. To help determine if the change in
trend is real, experienced traders use these
common rules of thumb. On long-term
trends, they wait for price to move 3% in the
new direction. On shorter-term trends, they
look for at least a 1% price move or for the
breakthrough to hold for two trading days.
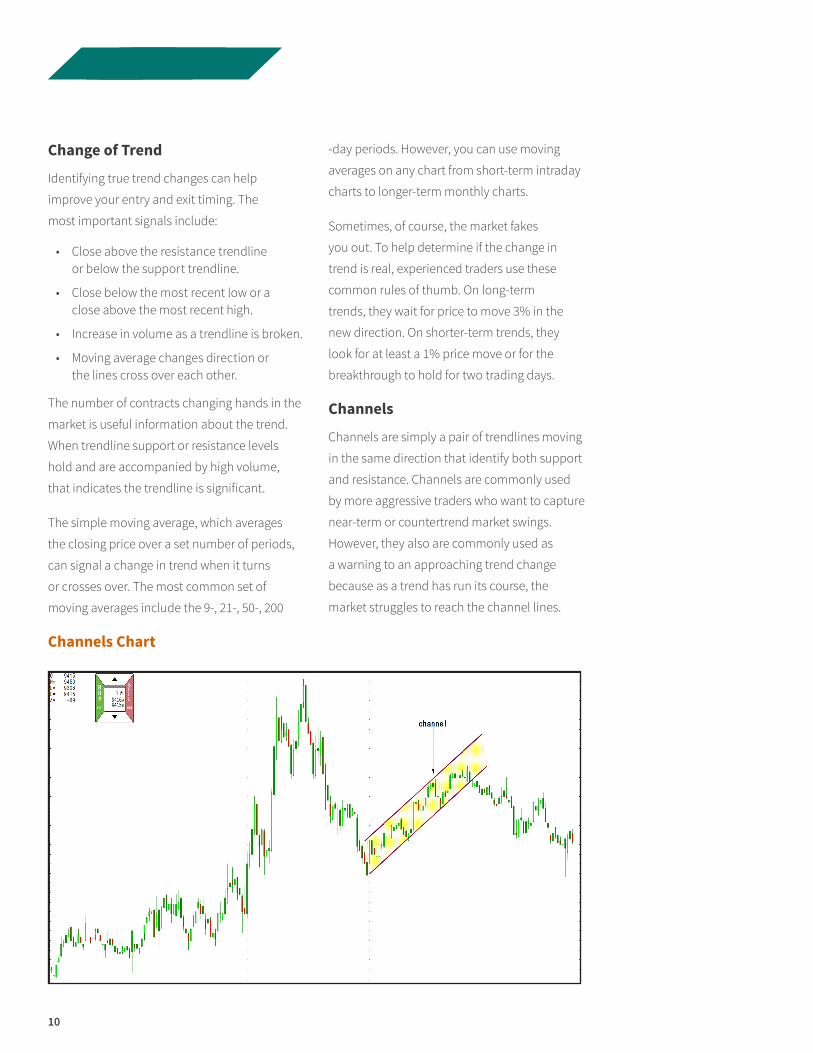
Channels
Channels are simply a pair of trendlines moving
in the same direction that identify both support
and resistance. Channels are commonly used
by more aggressive traders who want to capture
near-term or countertrend market swings.
However, they also are commonly used as
a warning to an approaching trend change
because as a trend has run its course, the
market struggles to reach the channel lines.
Channels Chart

11
Continuation Patterns
Probabilities are higher that a market
trend will continue in the same direction
upon completing a continuation pattern,
which can look like a flag, pennant,
triangle or wedge. Traders often use these
patterns to project the distance of the
price move that follows the breakout.
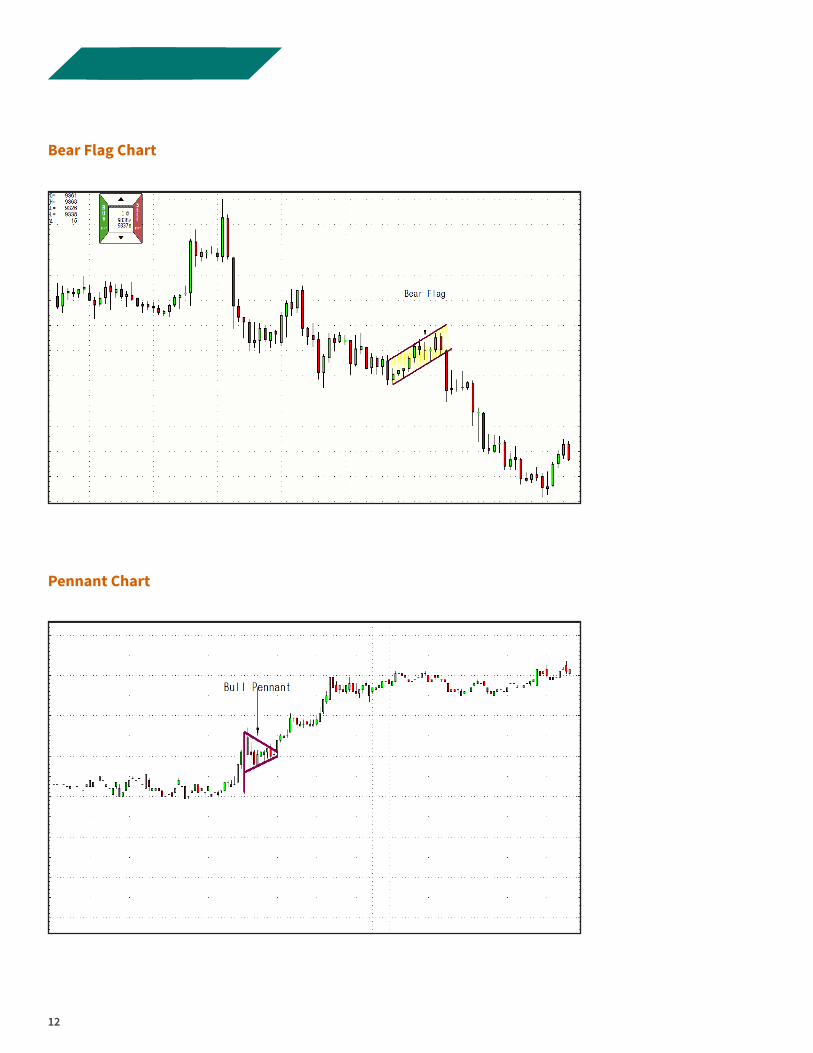
Flags and Pennants
Flags and pennants are created as a result of
a sharp, high-volume market move and the
need for the market to take a breather. Both
formations usually last one to three weeks
before the longer-term trend resumes, and
may be on the shorter end in bear markets.
Once the flag and pennant formations have
completed, the market typically resumes
the original trend with higher volume.
The flag is a parallelogram that countertrends
the longer-term trend. The pennant resembles
a symmetrical triangle, with a much larger
rally or sell-off than the flag upon breakout.
Bullish Flag Chart
12
Bear Flag Chart
Pennant Chart
13
Triangles
Traders like to see prices form symmetrical,
ascending or descending triangles on the chart
because they reveal clues about when and
which way the market will make it’s next move.
The longer the market trades in the triangle,
the greater the odds a breakout is approaching
because it should occur before prices reach
the triangle’s apex. As prices break out of a
triangle pattern, volume typically increases.
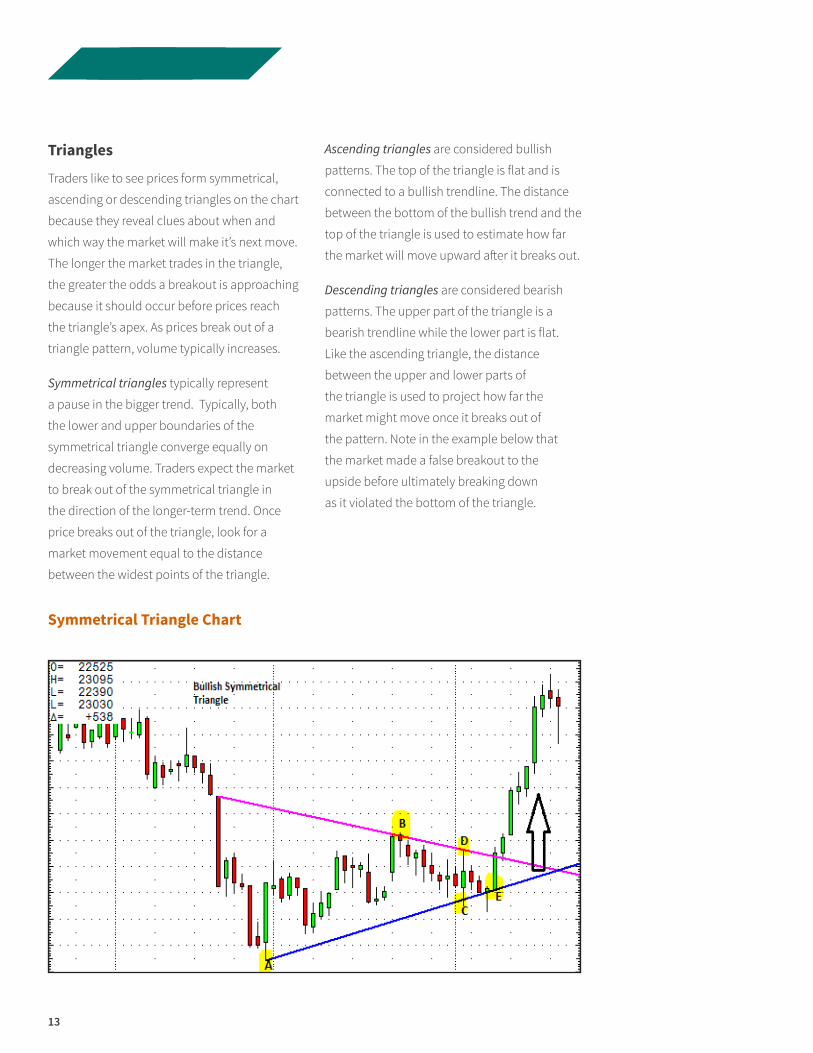
Symmetrical triangles typically represent
a pause in the bigger trend. Typically, both
the lower and upper boundaries of the
symmetrical triangle converge equally on
decreasing volume. Traders expect the market
to break out of the symmetrical triangle in
the direction of the longer-term trend. Once
price breaks out of the triangle, look for a
market movement equal to the distance
between the widest points of the triangle.
Ascending triangles are considered bullish
patterns. The top of the triangle is flat and is
connected to a bullish trendline. The distance
between the bottom of the bullish trend and the
top of the triangle is used to estimate how far
the market will move upward after it breaks out.
Descending triangles are considered bearish
patterns. The upper part of the triangle is a
bearish trendline while the lower part is flat.
Like the ascending triangle, the distance
between the upper and lower parts of
the triangle is used to project how far the
market might move once it breaks out of
the pattern. Note in the example below that
the market made a false breakout to the
upside before ultimately breaking down
as it violated the bottom of the triangle.
Symmetrical Triangle Chart

14
Descending Triangle Chart
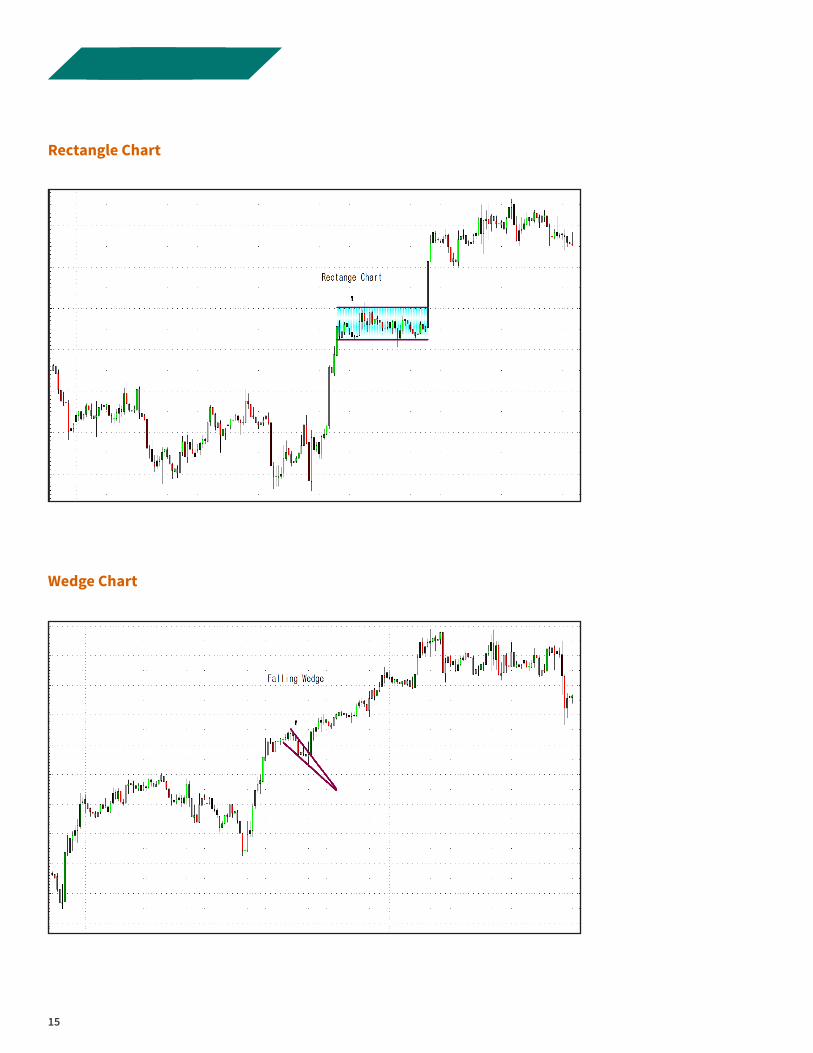
Rectangles
Rectangles are similar to the symmetrical
triangle except that the upper and lower
trendlines are parallel (like a short-term
sideways market.) Rectangles are considered
a continuation pattern because the market
often breaks out in the direction of the longer-
term trend. However, it is not unheard of for
the rectangle to act as a reversal pattern.
Volume in rectangle formations, which can
last as long as one to three months, usually is
higher than during the formation of triangles
due to the wide price swings. Even so, volume
still increases on a breakout. Volume is key
to predicting which way the market will likely
breakout. If volume is higher on the up-trending
swings vs. the down-trending swings, the market
will likely break to the upside and vice versa.
Wedges
In a wedge pattern, both sides of the triangle
are headed in the same direction. A falling
wedge is considered bullish and a rising wedge
is considered bearish. It is not uncommon
for prices to break out of a wedge much
closer to the apex than in other triangles.
Like other triangles, expect relatively low
volume as the pattern forms and an increase
upon breakout. Wedges are most commonly
seen as a continuation pattern of the
longer-term trend. However, they are found
occasionally in trend reversal situations.
15
Rectangle Chart
Wedge Chart
16
Reversal Patterns
Everyone who trades wants to know when the
market is going to change course. Although
there is no crystal ball, some patterns provide
hints that a reversal is in the making.
Head & Shoulders
This pattern gets its name from the
picture it makes on the chart—that of a
head between two shoulders. Technicians
measure the distance from the top of the
head to the neckline as an indication of the
minimum amount the market will move
once it breaks out of the formation, often
on high volume and with a gap in prices.
A head-and-shoulders top starts with a high
(left shoulder), correction and then a rally to
a higher high (head). The ensuing correction
finds support in the same area as the previous
correction, forming a neckline. The market
rally from this support often falters near the
left shoulder, creating the right shoulder.
An inverted head-and-shoulders is a bottom-
forming pattern. The left shoulder is the first
low, the head is a new, lower low and the right
shoulder is a low in the area of the left shoulder.
The two corrective moves in between these
three lows mark the formation’s neckline.
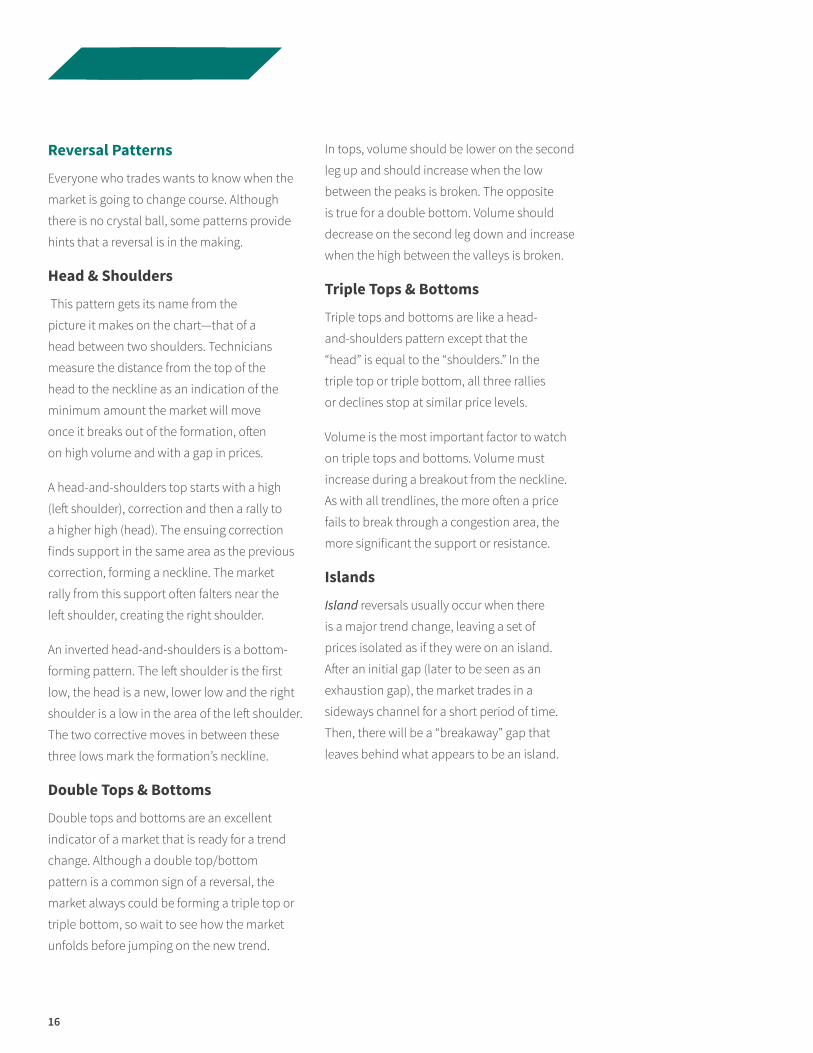
Double Tops & Bottoms
Double tops and bottoms are an excellent
indicator of a market that is ready for a trend
change. Although a double top/bottom
pattern is a common sign of a reversal, the
market always could be forming a triple top or
triple bottom, so wait to see how the market
unfolds before jumping on the new trend.
In tops, volume should be lower on the second
leg up and should increase when the low
between the peaks is broken. The opposite
is true for a double bottom. Volume should
decrease on the second leg down and increase
when the high between the valleys is broken.
Triple Tops & Bottoms
Triple tops and bottoms are like a head-
and-shoulders pattern except that the
“head” is equal to the “shoulders.” In the
triple top or triple bottom, all three rallies
or declines stop at similar price levels.
Volume is the most important factor to watch
on triple tops and bottoms. Volume must
increase during a breakout from the neckline.
As with all trendlines, the more often a price
fails to break through a congestion area, the
more significant the support or resistance.
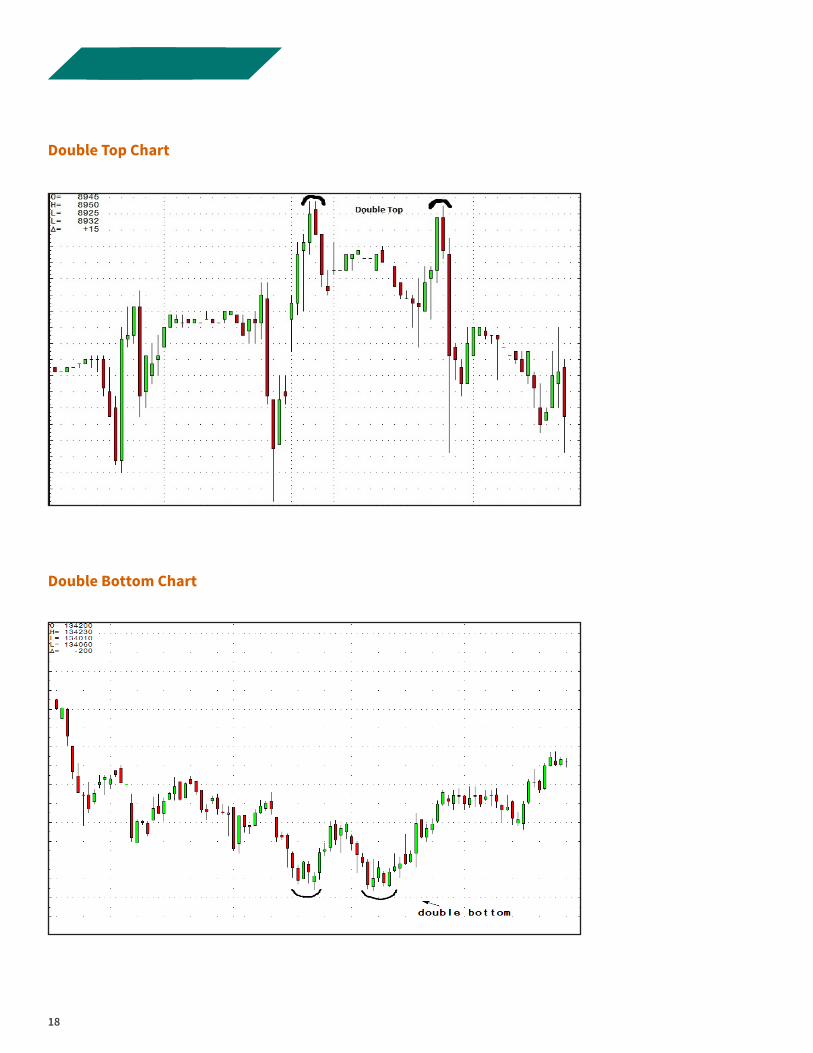
Islands
Island reversals usually occur when there
is a major trend change, leaving a set of
prices isolated as if they were on an island.
After an initial gap (later to be seen as an
exhaustion gap), the market trades in a
sideways channel for a short period of time.
Then, there will be a “breakaway” gap that
leaves behind what appears to be an island.

17
Head-and-Shoulders Bottom Chart
Head-and-Shoulders Top Chart
18
Double Top Chart
Double Bottom Chart
19
Island Top Chart
Island Bottom Chart
2020
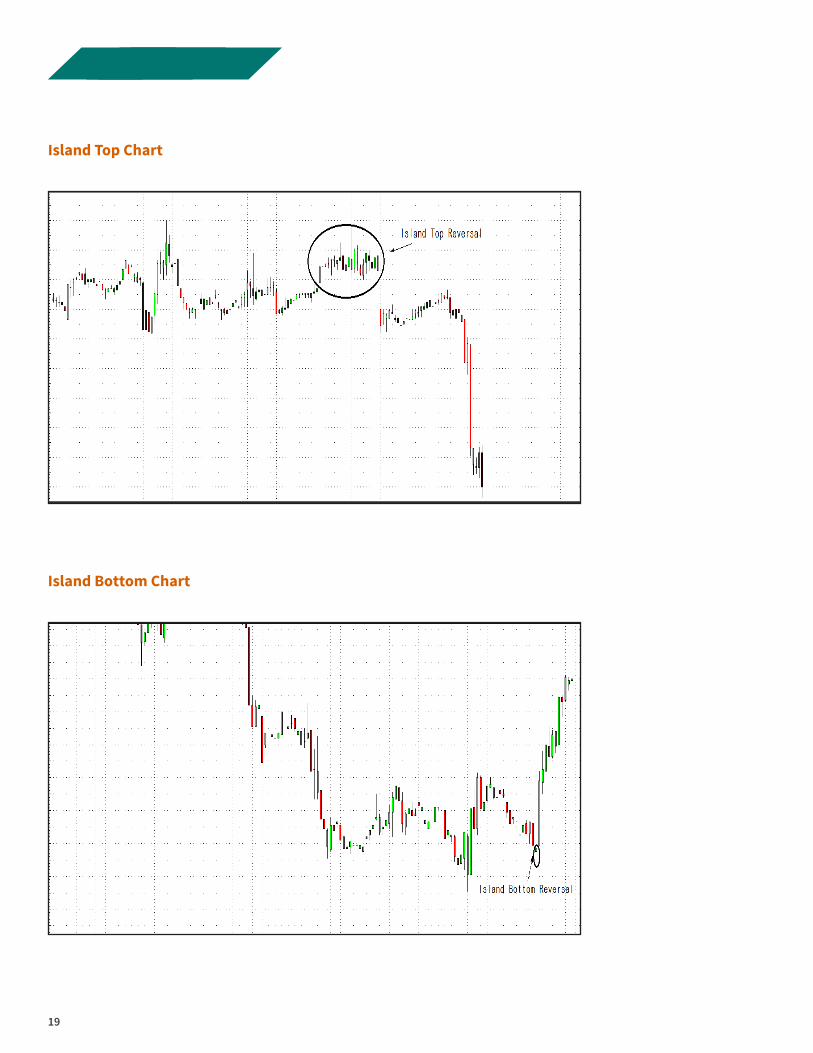
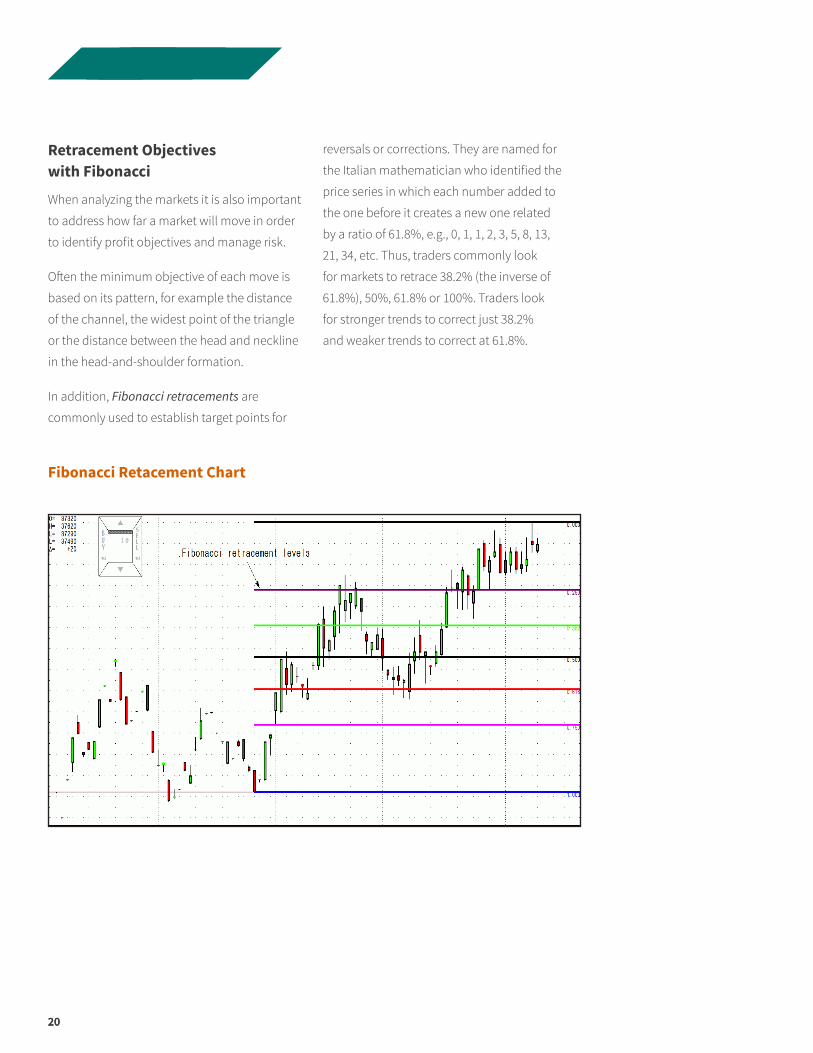
Retracement Objectives with Fibonacci
When analyzing the markets it is also important
to address how far a market will move in order
to identify profit objectives and manage risk.
Often the minimum objective of each move is
based on its pattern, for example the distance
of the channel, the widest point of the triangle
or the distance between the head and neckline
in the head-and-shoulder formation.
In addition, Fibonacci retracements are
commonly used to establish target points for
reversals or corrections. They are named for
the Italian mathematician who identified the
price series in which each number added to
the one before it creates a new one related
by a ratio of 61.8%, e.g., 0, 1, 1, 2, 3, 5, 8, 13,
21, 34, etc. Thus, traders commonly look
for markets to retrace 38.2% (the inverse of
61.8%), 50%, 61.8% or 100%. Traders look
for stronger trends to correct just 38.2%
and weaker trends to correct at 61.8%.
Fibonacci Retacement Chart
21
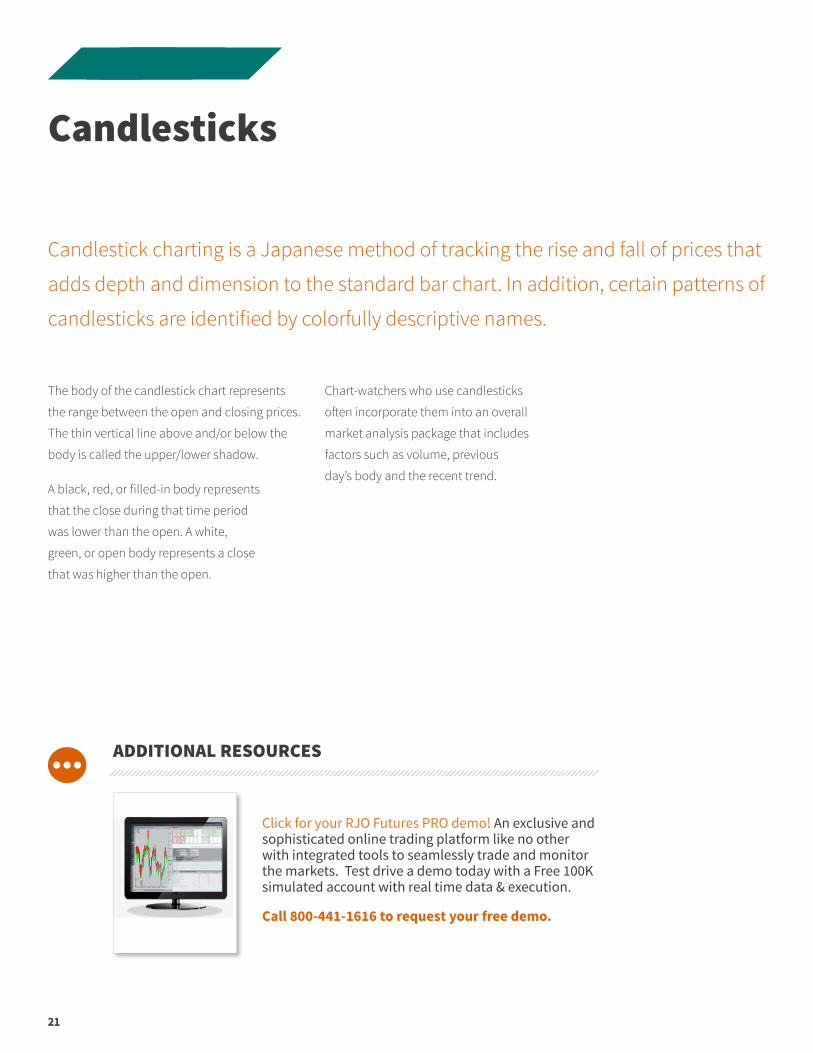
Candlestick charting is a Japanese method of tracking the rise and fall of prices that
adds depth and dimension to the standard bar chart. In addition, certain patterns of
candlesticks are identified by colorfully descriptive names.
Candlesticks
The body of the candlestick chart represents
the range between the open and closing prices.
The thin vertical line above and/or below the
body is called the upper/lower shadow.
A black, red, or filled-in body represents
that the close during that time period
was lower than the open. A white,
green, or open body represents a close
that was higher than the open.
Chart-watchers who use candlesticks
often incorporate them into an overall
market analysis package that includes
factors such as volume, previous
day’s body and the recent trend.
21
ADDITIONAL RESOURCES
Click for your RJO Futures PRO demo! An exclusive and sophisticated online trading platform like no other with integrated tools to seamlessly trade and monitor the markets. Test drive a demo today with a Free 100K simulated account with real time data & execution.
Call 800-441-1616 to request your free demo.

22
Doji
Doji are important candlesticks that provide
information on their own and also feature in
a number of important patterns. Doji form
when a market open and close are basically
equal. Alone, Doji are neutral patterns. Any
bullish or bearish bias is based on previous
price action and future confirmation.
A Doji can signal weakening buying pressure
only when it appears after a long green
candlestick or an upward trend pattern.
Conversely, a Doji can signal weakening selling
pressure when it appears after a long red bar
or a downward trend pattern. Either way,
Doji show that buying and selling pressure
is evenly matched, and might indicate a
possible trend reversal. This pattern alone
is not enough to give the trader a sound
reversal signal. One must always look for
more confirmation when these Doji appear.
Doji: This line implies indecision. The market opened and closed at the same price.
2323
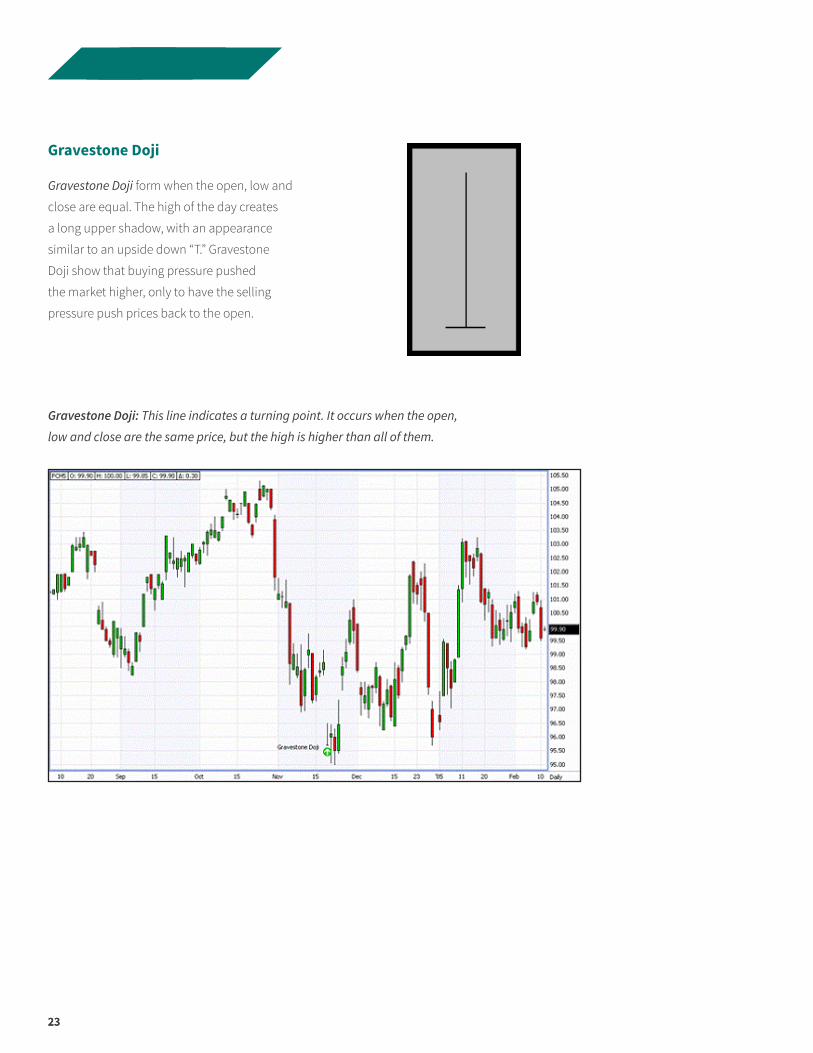
Gravestone Doji
Gravestone Doji form when the open, low and
close are equal. The high of the day creates
a long upper shadow, with an appearance
similar to an upside down “T.” Gravestone
Doji show that buying pressure pushed
the market higher, only to have the selling
pressure push prices back to the open.
Gravestone Doji: This line indicates a turning point. It occurs when the open,
low and close are the same price, but the high is higher than all of them.
24
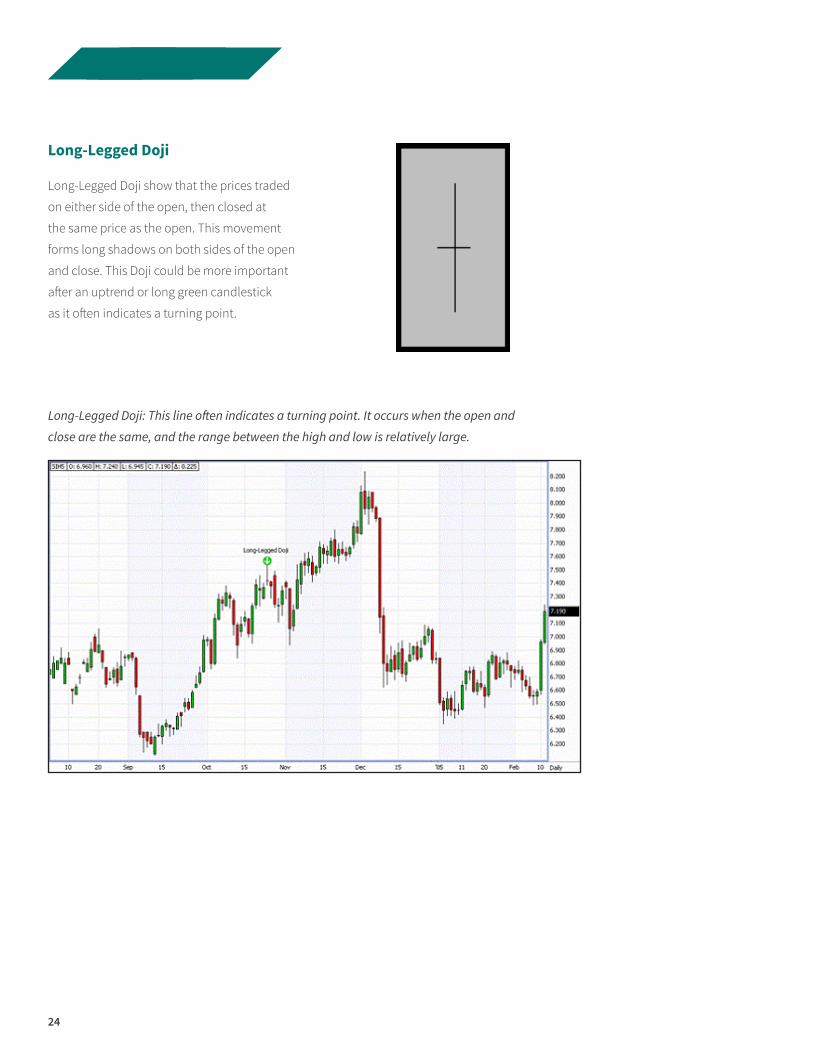
Long-Legged Doji
Long-Legged Doji show that the prices traded
on either side of the open, then closed at
the same price as the open. This movement
forms long shadows on both sides of the open
and close. This Doji could be more important
after an uptrend or long green candlestick
as it often indicates a turning point.
Long-Legged Doji: This line often indicates a turning point. It occurs when the open and
close are the same, and the range between the high and low is relatively large.

25
Bullish and Bearish Engulfing Lines
An engulfing pattern occurs when the daily
trading range is larger than the previous
day’s range and has a counter-trend close.
This pattern can indicate that the market
has lost strength to continue in the direction
in which it was previously headed.
Bullish Engulfing Line: This pattern is very bullish if it occurs after
a fairly large downtrend, acting as a reversal pattern.
Bearish Engulfing Line: This pattern is very bearish if it occurs after
a fairly large uptrend, acting as a reversal pattern.
26
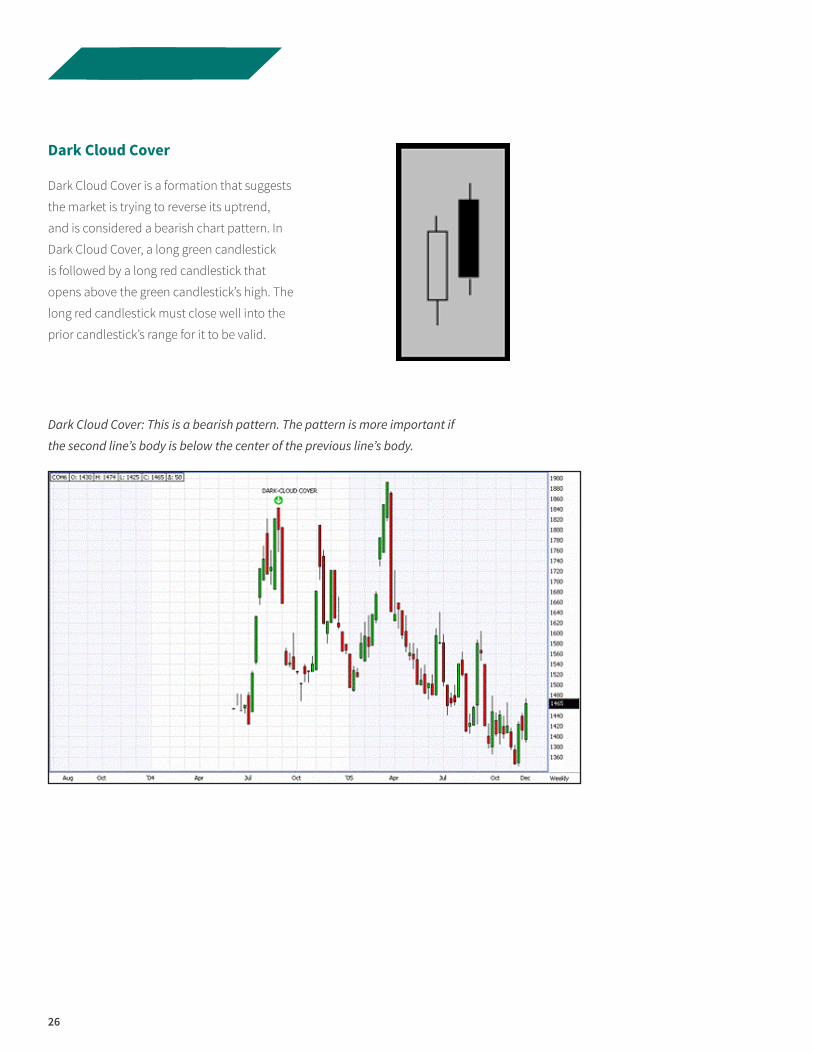
Dark Cloud Cover
Dark Cloud Cover is a formation that suggests
the market is trying to reverse its uptrend,
and is considered a bearish chart pattern. In
Dark Cloud Cover, a long green candlestick
is followed by a long red candlestick that
opens above the green candlestick’s high. The
long red candlestick must close well into the
prior candlestick’s range for it to be valid.
Dark Cloud Cover: This is a bearish pattern. The pattern is more important if
the second line’s body is below the center of the previous line’s body.
27
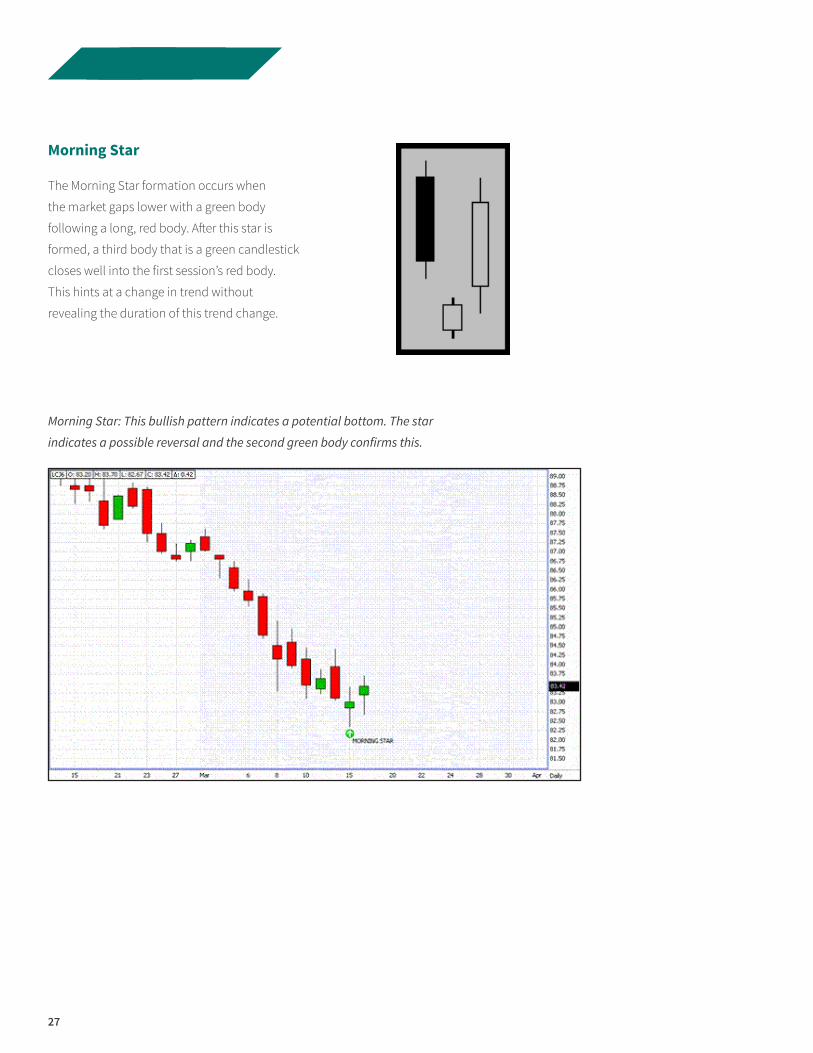
Morning Star
The Morning Star formation occurs when
the market gaps lower with a green body
following a long, red body. After this star is
formed, a third body that is a green candlestick
closes well into the first session’s red body.
This hints at a change in trend without
revealing the duration of this trend change.
Morning Star: This bullish pattern indicates a potential bottom. The star
indicates a possible reversal and the second green body confirms this.
28
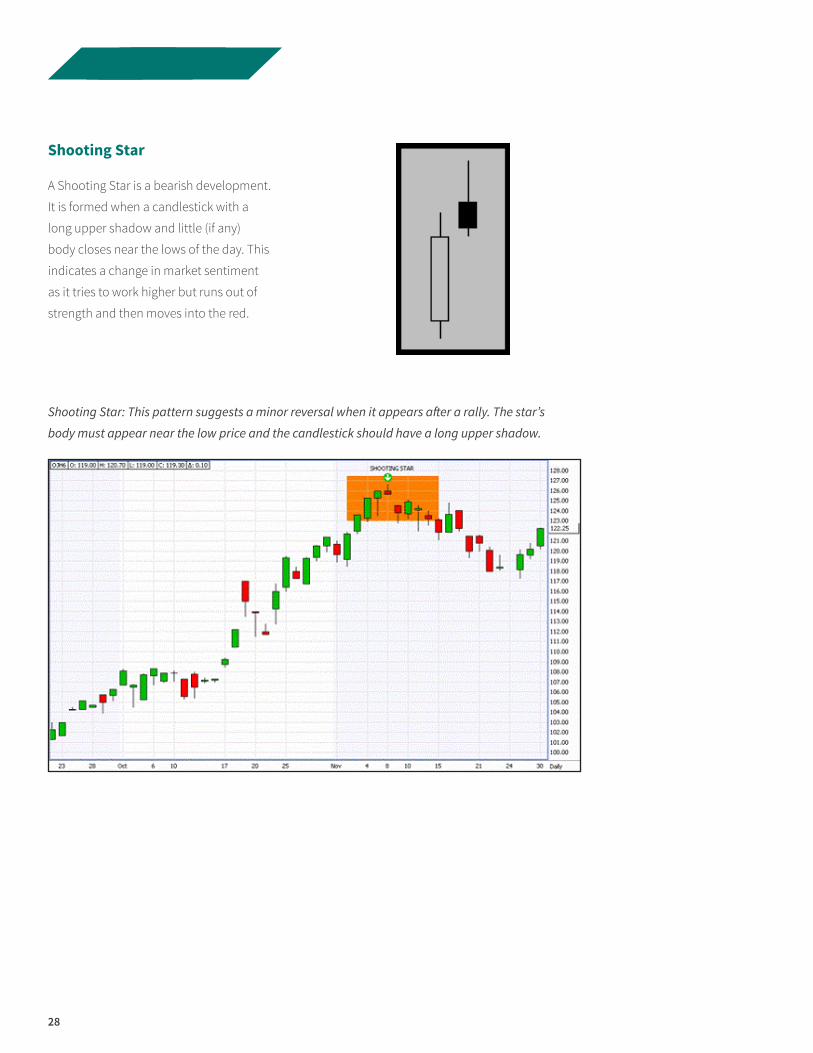
Shooting Star
A Shooting Star is a bearish development.
It is formed when a candlestick with a
long upper shadow and little (if any)
body closes near the lows of the day. This
indicates a change in market sentiment
as it tries to work higher but runs out of
strength and then moves into the red.
Shooting Star: This pattern suggests a minor reversal when it appears after a rally. The star’s
body must appear near the low price and the candlestick should have a long upper shadow.
29
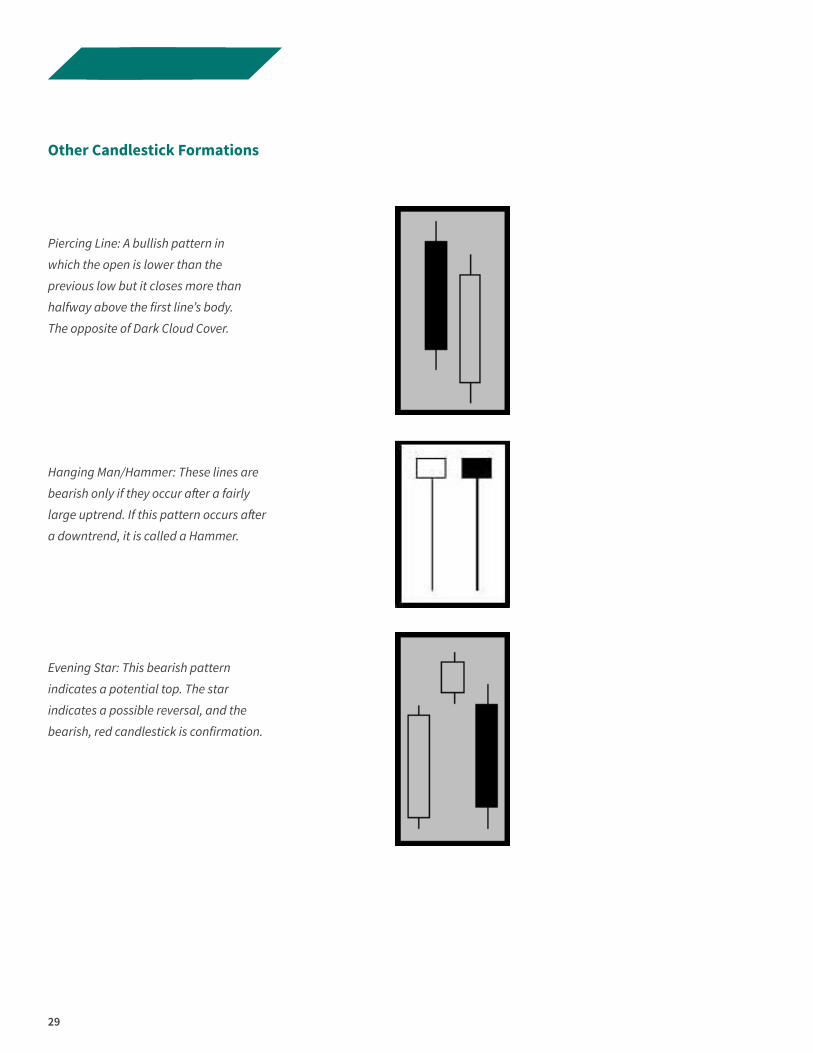
Other Candlestick Formations
Piercing Line: A bullish pattern in
which the open is lower than the
previous low but it closes more than
halfway above the first line’s body.
The opposite of Dark Cloud Cover.
Evening Star: This bearish pattern
indicates a potential top. The star
indicates a possible reversal, and the
bearish, red candlestick is confirmation.
Hanging Man/Hammer: These lines are
bearish only if they occur after a fairly
large uptrend. If this pattern occurs after
a downtrend, it is called a Hammer.
30
One of the biggest benefits to understanding technical analysis is the ability to use a
combination of studies that you believe gives you an edge in the market.
Using and Applying Studies
We’ve outlined a few of the most popular
market studies in this Guide. You’ll likely
find that just a few of them appeal to
you and work with how you like to trade,
and that’s OK. No one uses them all.
If you need help editing any of the
study indicators to your preferences,
ask your RJO Futures broker to
walk you through the process.
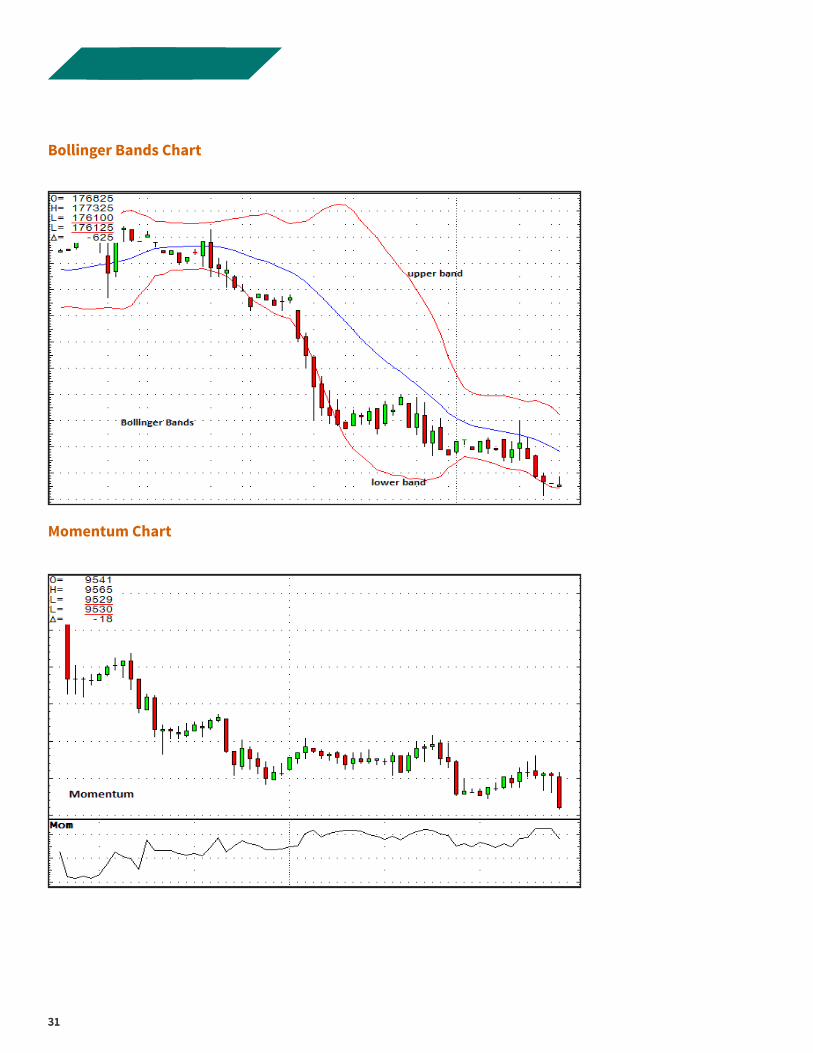
Bollinger Bands
Bollinger Bands take a moving average and
plot it two standard deviations above and two
standard deviations below the original moving
average to determine overbought and oversold
areas. When prices approach the upper band it
is an indication of an overbought market and
prices should soon drop. When prices close
in on the lower band it indicates an oversold
market and prices should soon rally. The width
between the two bands indicates the level
of market volatility, which can be a valuable
piece of information for option traders.
Commitments of Traders (COT)
The Commitments of Traders report comes
out weekly from the Commodity Futures
Trading Commission (CFTC) and tracks
open interest by three categories of market
participants—large hedgers, large speculators,
and small traders. Traders are particularly
interested in the large trader categories
because they can be market movers.
http://www.cftc.gov/MarketReports/
CommitmentsofTraders/index.htm
Momentum
The momentum line is calculated by
subtracting the current day’s closing price
from the closing price X number of days
ago. It is used to determine overbought
and oversold markets and also indicates
the pace of the rise or fall of prices.
30
3131
Bollinger Bands Chart
Momentum Chart
3232
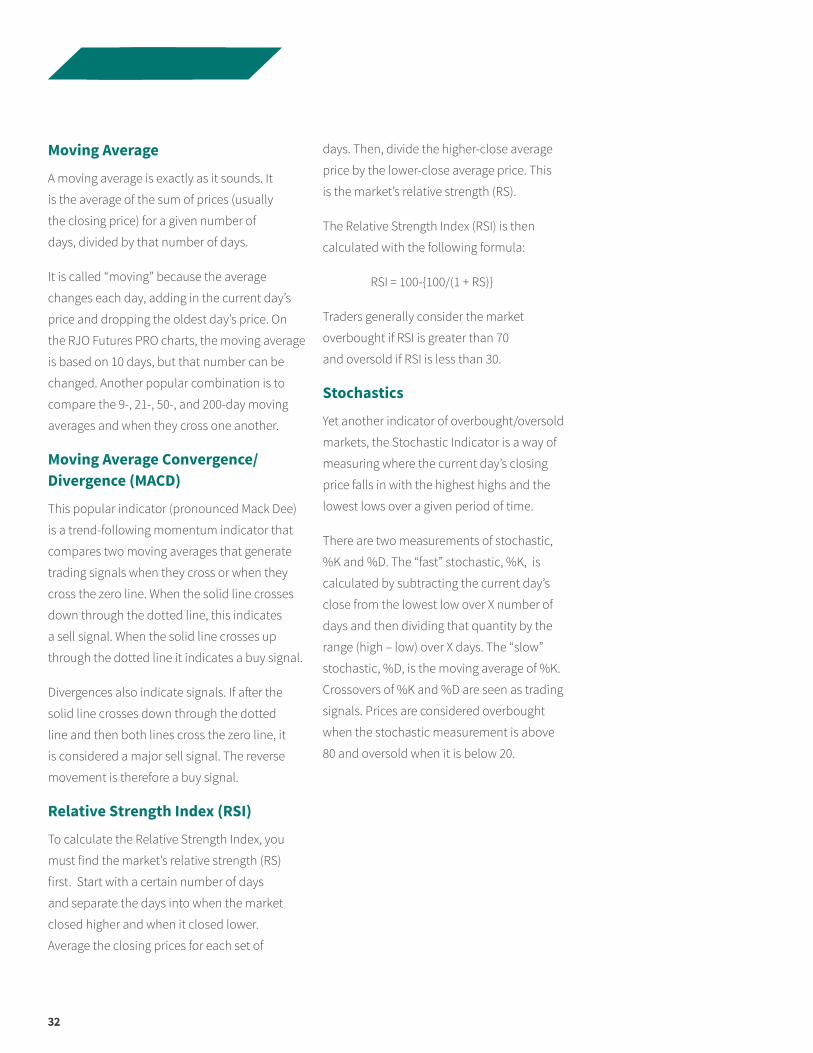
Moving Average
A moving average is exactly as it sounds. It
is the average of the sum of prices (usually
the closing price) for a given number of
days, divided by that number of days.
It is called “moving” because the average
changes each day, adding in the current day’s
price and dropping the oldest day’s price. On
the RJO Futures PRO charts, the moving average
is based on 10 days, but that number can be
changed. Another popular combination is to
compare the 9-, 21-, 50-, and 200-day moving
averages and when they cross one another.
Moving Average Convergence/Divergence (MACD)
This popular indicator (pronounced Mack Dee)
is a trend-following momentum indicator that
compares two moving averages that generate
trading signals when they cross or when they
cross the zero line. When the solid line crosses
down through the dotted line, this indicates
a sell signal. When the solid line crosses up
through the dotted line it indicates a buy signal.
Divergences also indicate signals. If after the
solid line crosses down through the dotted
line and then both lines cross the zero line, it
is considered a major sell signal. The reverse
movement is therefore a buy signal.
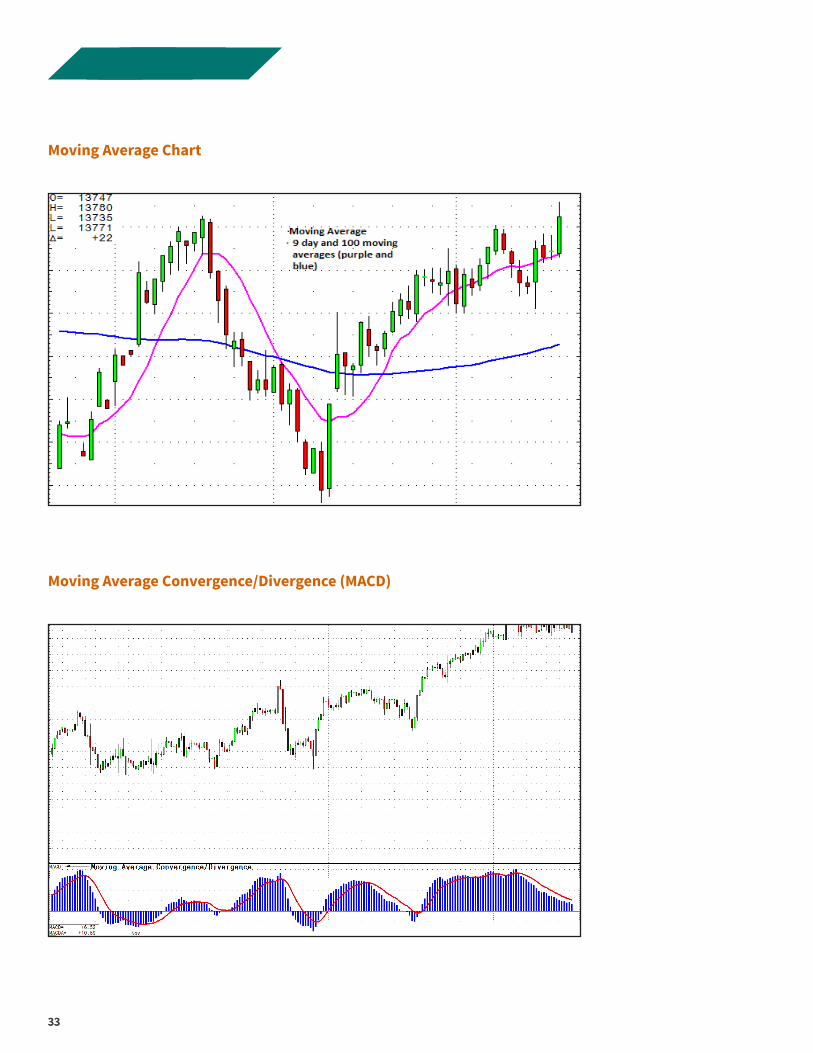
Relative Strength Index (RSI)
To calculate the Relative Strength Index, you
must find the market’s relative strength (RS)
first. Start with a certain number of days
and separate the days into when the market
closed higher and when it closed lower.
Average the closing prices for each set of
days. Then, divide the higher-close average
price by the lower-close average price. This
is the market’s relative strength (RS).
The Relative Strength Index (RSI) is then
calculated with the following formula:
RSI = 100-{100/(1 + RS)}
Traders generally consider the market
overbought if RSI is greater than 70
and oversold if RSI is less than 30.
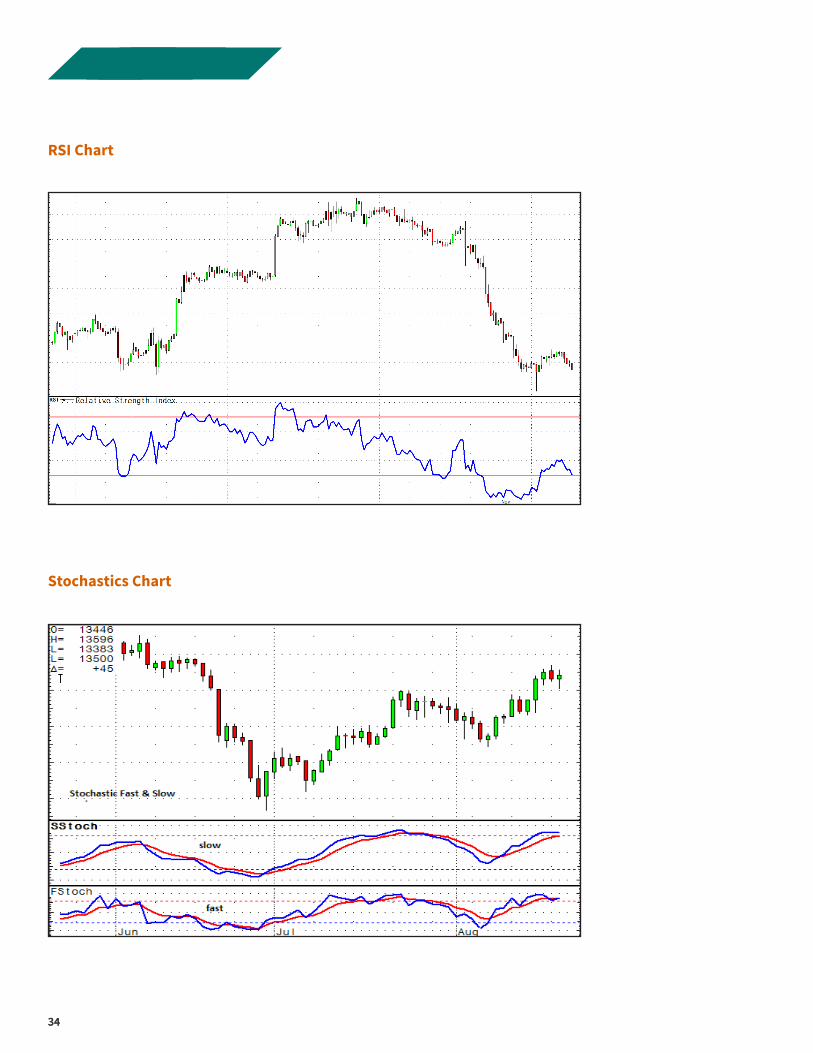
Stochastics
Yet another indicator of overbought/oversold
markets, the Stochastic Indicator is a way of
measuring where the current day’s closing
price falls in with the highest highs and the
lowest lows over a given period of time.
There are two measurements of stochastic,
%K and %D. The “fast” stochastic, %K, is
calculated by subtracting the current day’s
close from the lowest low over X number of
days and then dividing that quantity by the
range (high – low) over X days. The “slow”
stochastic, %D, is the moving average of %K.
Crossovers of %K and %D are seen as trading
signals. Prices are considered overbought
when the stochastic measurement is above
80 and oversold when it is below 20.
3333
Moving Average Chart
Moving Average Convergence/Divergence (MACD)
3434
RSI Chart
Stochastics Chart
3535
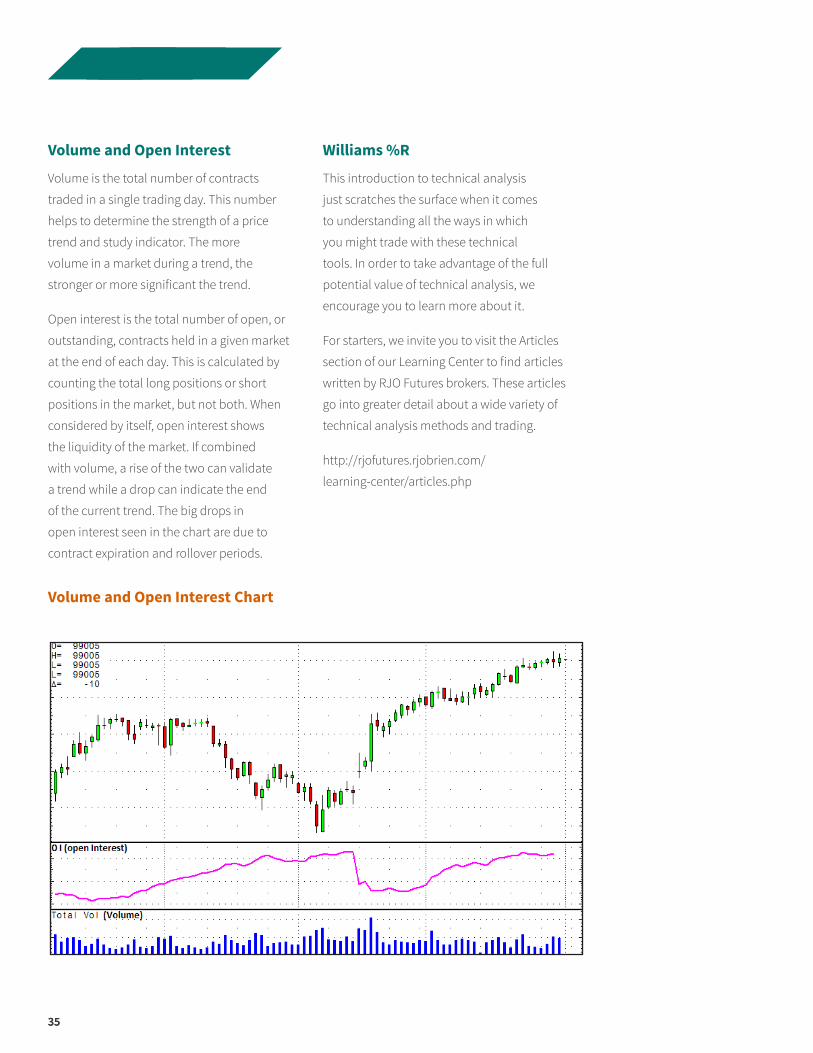
Volume and Open Interest
Volume is the total number of contracts
traded in a single trading day. This number
helps to determine the strength of a price
trend and study indicator. The more
volume in a market during a trend, the
stronger or more significant the trend.
Open interest is the total number of open, or
outstanding, contracts held in a given market
at the end of each day. This is calculated by
counting the total long positions or short
positions in the market, but not both. When
considered by itself, open interest shows
the liquidity of the market. If combined
with volume, a rise of the two can validate
a trend while a drop can indicate the end
of the current trend. The big drops in
open interest seen in the chart are due to
contract expiration and rollover periods.
Williams %R
This introduction to technical analysis
just scratches the surface when it comes
to understanding all the ways in which
you might trade with these technical
tools. In order to take advantage of the full
potential value of technical analysis, we
encourage you to learn more about it.
For starters, we invite you to visit the Articles
section of our Learning Center to find articles
written by RJO Futures brokers. These articles
go into greater detail about a wide variety of
technical analysis methods and trading.
http://rjofutures.rjobrien.com/
learning-center/articles.php
Volume and Open Interest Chart
36
Open an Account Easily and Quickly:
Thank you for the opportunity to provide you with this educational material. Anyone can offer
online trading in online markets. But RJO Futures is not just anyone. We are specialists devoted
to delivering the best possible trading experience for our clients. Whether you want to trade on
your own, tap into the experience of our brokers or let a professional money manager make
the calls, you can do it all at RJO Futures, the premier provider of futures brokerage services.
By Phone: 800-441-1616
312-373-5478
Online: rjofutures.com/open-account rjofutures.com/open-account/type/downloadforms
By Email: [email protected]
RJO Futures eView E-newsletter
For a longer-term view on the markets as well as pointers on trading techniques, subscribe to
eView, our free newsletter delivered to your inbox every two weeks. You’ll read insights from our
team of professional futures brokers, whose commentary is often featured in major news media.
Click to sign up for your free eView subscription today.
RJO Futures Learning Center
We believe that knowledge makes better traders. In the RJO Futures Learning Center you’ll
find educational tools for every level of experience. We offer a library of guides and articles
that help you learn about futures and futures on options from the basics to technical
analytics. For an interactive experience, join us for our regularly scheduled live webinars.
Click to visit the RJO Futures Learning Center.
RJO Futures Brokers
The RJO Futures brokers provide the experience and background to help you with your trading
needs, and assist you with reaching your investment goals. We invite you to review each broker’s
profile, experience, and techniques to help you select a partner that best fits your trading needs
and style.
Click to meet our team.
Additional Resources

Futures trading involves the substantial risk of loss and is not suitable for all investors.
© Copyright 2014 R.J. O’Brien & Associates, LLC
0114
RJO Futures 222 South Riverside Plaza Suite 900 Chicago, Illinois 60606
800-441-1616 312-373-5478
rjofutures.com
Facebook RJO Futures Twitter @rjofutures LinkedIn RJO Futures
A division of R.J. O’Brien