Embed Size (px)
Citation preview

Page 1
Intro: What is this Course About?
and
Lecture I: Where was the Economy pre-COVID?

Page 2
Course Outline
Note: Varying amounts of time will be spent on each topic
Lecture Date Topics Covered
1 6-Nov
2 13-Nov
3 20-Nov
Where was the economy before
COVID, where is economy now, and
what are the prospects post-COVID?
Page 3
A Look Ahead from Today’s NY Times
What does this mean?

Page 4
Unemployment Rate Announced Today

Page 5
Initial Comments and Caveats
1) Economics is a social science, not a natural science!
There aren’t labs to “test” hypotheses, only economic statistics and inferences drawn from those “observations,” which are based on measures that may be frequently revised.
This is more true for macroeconomics because of the number of potential variables involved to fully model a national economy
And, in macroeconomics, much of the data is quarterly, beginning after World War II, limiting the number of observations.
Macroeconomics involves many analyses that directly involve public policies which economists and the public have strong priors about. In particular:
The Role of Government in Managing the Economy
Most Importantly: Tax & Spending Policies
Macroeconomic Time Series and # of Observations
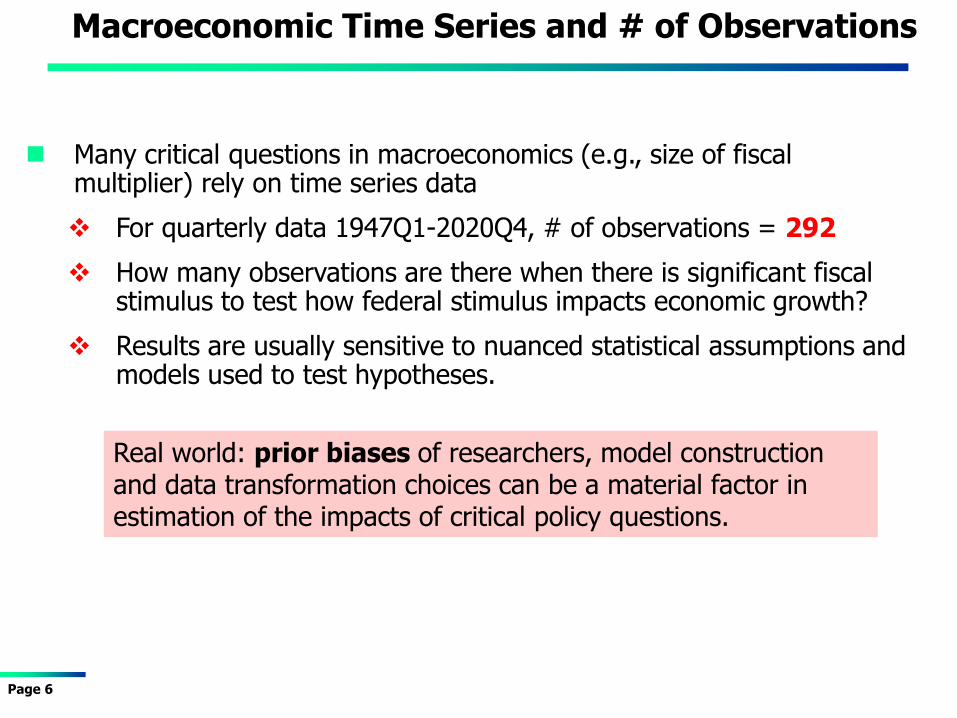
Many critical questions in macroeconomics (e.g., size of fiscal multiplier) rely on time series data
For quarterly data 1947Q1-2020Q4, # of observations = 292
How many observations are there when there is significant fiscal stimulus to test how federal stimulus impacts economic growth?
Results are usually sensitive to nuanced statistical assumptions and models used to test hypotheses.
Real world: prior biases of researchers, model construction and data transformation choices can be a material factor in estimation of the impacts of critical policy questions.
Page 6

Page 7
Initial Comments
As a consequence … 1) There are and will be ongoing debates within the economics profession
over the effect of macroeconomic policies and whether they will improve or harm the economy in various economic conditions.
2) The media doesn’t help: In setting up point-counter-point formats makes these disagreements appear more material than they actually are within the economics profession.
Surveys of Economists’ Opinions Surveys of professional economists indicate that about 70% of them trained in macroeconomics will agree with what I’ll be teaching in this course.

What Did Economists Think about the 2009 Fiscal Stimulus?
Page 8

Two Quotes Illustrate the Internal Dynamics within the Economics Profession
Robert Lucas and Tom Sargent in 1978 (both Nobel Prize winners)
“Modern macroeconomic models are of no value in guiding economic policy and this condition will not be remedied by modifications…”
Paul Krugman in 2012 (Nobel Prize winner)
“Freshwater economics became a kind of cult, ignoring and ridiculing any ideas that didn’t fit its paradigm. By 1980 Robert Lucas, wrote approvingly of how people would giggle and whisper when facing a Keynesian. What’s remarkable about that is that this was all based on the presumption that freshwater logic would provide a plausible, workable alternative to Keynes – a presumption that was not borne out by anything that had happened in the 1970s. And in fact it never happened.”
Page 9

Page 10
Economists and the Political Spectrum
% of Total Economists

Page 11
When Macroeconomics Began
It’s not a coincidence that Keynes wrote the “General Theory of Employment Interest and Money” in 1936.
Unemployment Rate %)
25% of the US Labor Force was unemployed at the trough of the Great Depression
Gray shaded areas are recessions

Page 12
Keynes and Macroeconomic Policy
Macroeconomic policies implemented post-Keynes have made a huge socially meaningful and positive difference to macroeconomic performance and improving the lives of human beings in virtually all industrialized economies.
Recessions have not been eliminated, but they have been less frequent and of shorter duration
GDP Growth (%) Unemployment Rate (%)
Gray shaded areas are recessions
Note: the recession this spring hasn’t yet been announced

Page 13
Recession Stats Pre vs. Post Keynes
We live in a Post-Keynesian Macroeconomy!
% D in GDP
Period Years Number FrequencyDecline in
GDP
1890-1946 56 15 45% -6.0%
1947-2020Q3 73.8 12* 15% -2.4%*
* Counts 2020Q2 as a recession

Page 14
Keynes and Macroeconomic Policy
Annual Inflation Rate (%)
“Inflation Targeting” will be discussed in more detail later. 1891-1947 1.9 5.3
1948-1993 4.1 3.3
1994-2020(Sep) 2.2 1.0
Stand
DeviationAvg.
Annual Inflation Rate
Period

Page 15
The Macroeconomic System Pre-Pandemic
Income Employment & Unemployment
Deficits and Debt
The Federal Reserve &
Money
Inflation
The Financial Collapse & Great Recession – Pt I
Fiscal Policy Monetary Policy Bank Regulatory
Policy
The Macroeconomy: it’s an interconnected System
International Events

Page 16
COVID and the Macroeconomy
Income Employment & Unemployment
Deficits and Debt
The Federal Reserve &
Money
Inflation
The Financial Collapse & Great Recession – Pt I
Fiscal Policy Monetary Policy Bank Regulatory
Policy
International Events
The Pandemic poses is a major macroeconomic challenge

Macroeconomic Policy Matters!
Well Designed Macroeconomic Policies
Poorly Designed Macroeconomic Policies
Faster economic growth Stable economic growth Lower unemployment rates Low inflation rates Lower levels of poverty
Slower economic growth Significant economic fluctuations Higher unemployment rates Higher inflation rates Higher levels of poverty
Page 17
Poorly Designed Responses to a
Pandemic
OR

Page 18
Where was the Economy in Feb
2020 and Why was it Performing so
Well?

February 2020
Key Economic Performance Metrics
Positive Results
Unemployment rates were at historical lows
Inflation was at just under 2%
Interest rates were low
Family incomes were rising
The economy had been growing virtually uninterrupted since June 2009 or for over 10 years
Page 19

Page 20
Unemployment through Feb 2020
U Rate (%)
Historical note: the lowest unemployment rate since the end of WWII was 2.5% in 1953

Page 21
GDP Growth Prior to 2020Q1
Annual % D
Real GDP
2020Q1 excluded because it
includes pandemic impacts

Page 22
Job Growth – Pre COVID
D
Jobs (000)
Bush | Obama | Trump
Bush | Obama | Trump

Page 23
Potential Real GDP vs. Actual Real GDP
Gray shaded areas are recessions
Real Potential and Real GDP in
$Trillions Constant
2020 Dollars

Page 24
GDP GAP
= $4.9 Trillion in Lost Output
Real Potential and Real GDP in $Trillions Current Dollars

Page 25
GDP Gap and Unemployment
Periods following troughs are usually when Real GDP grows faster than potential and the unemployment rate is lowered
Real & Potential
GDP $2018 Trillions
Unemployment Rate (%)

Page 26
Inflation Rate – Through Feb 2020
CPI Annual
Inflation Rate (%)
Avg St Dev
Jan48 - Jan94 4.0 3.3
Jan94 - Feb20 2.2 1.1
Inflation Rate (%)Period

Page 27
CPI Annual
Inflation Rate (%)
Announced Target has been 2%. Average over 20 years has been 2.2%
Inflation Rate – Last 20 years

Page 28
Inflation Rates (%)
Inflation Rates in Advanced Economies

Page 29
Avg Inf (%)
1995-2020
St Dev 1995-2020
Inflation Rates in Advanced Economies
1960-95 1995-20 1960-95 1995-20
USA 4.7 2.2 4.7 1.1
Gr Britain 7.2 2.0 7.2 0.8
Japan 4.8 0.2 4.8 1.0
Germany 3.4 1.4 3.4 0.7
France 5.9 1.3 5.9 0.8
Switz 3.7 0.5 3.7 0.8
Canada 4.9 1.7 4.9 0.8
CountryAverage St. Deviation

It’s a Macroeconomic Policy Success Story
Central banks in the advanced economies have been following a coordinated policy of “inflation rate targeting”
This policy has led to a material reduction in inflation rates and inflation rate volatility for over 20 years
The central banks are not going to “give it up” any time soon
In one country (Japan) it has been too successful
During the pandemic the U.S. is challenged by too little inflation.
Page 30

Theoretical Note about Inflation
Page 31
Social Costs
Social Benefits
- 2 0 2 4 6 8 Inflation Rate (%)
Deflation is Very Bad
High Inflation is
Bad
Low Inflation is Better than High Inflation
Fed Policy Target = 2%
Current “Thinking”

Benefits of a Low Unemployment and Low Inflation Economy
Low unemployment benefits the last to be
employed
Page 32
%
%
Low unemployment benefits ALL ethnic groups
U6 is an unemployment rate measure that captures discouraged workers

Page 33
Interest Rates

Treasury Yield Curve and Other Interest Rates
Other rates are priced off the Treasury curve
Maturity
Nominal interest rate (%)
10Yrs 3 Mths
30 Yr Fixed Rate
Mortgage Prime Rate
15 Yr Fixed Rate
Mortgage
Page 34
The Treasury Yield Curve is referred to a Benchmark Curve

History of Interest Rates - USA
Page 35
Rate (%)
“Yield Curve”: 10Y – 3M Rate
(%)
Declining Trend,
Currently historically
low
Volatile, Currently
“Flat”
Rate levels have declined, but not the volatility between longer and shorter term rates
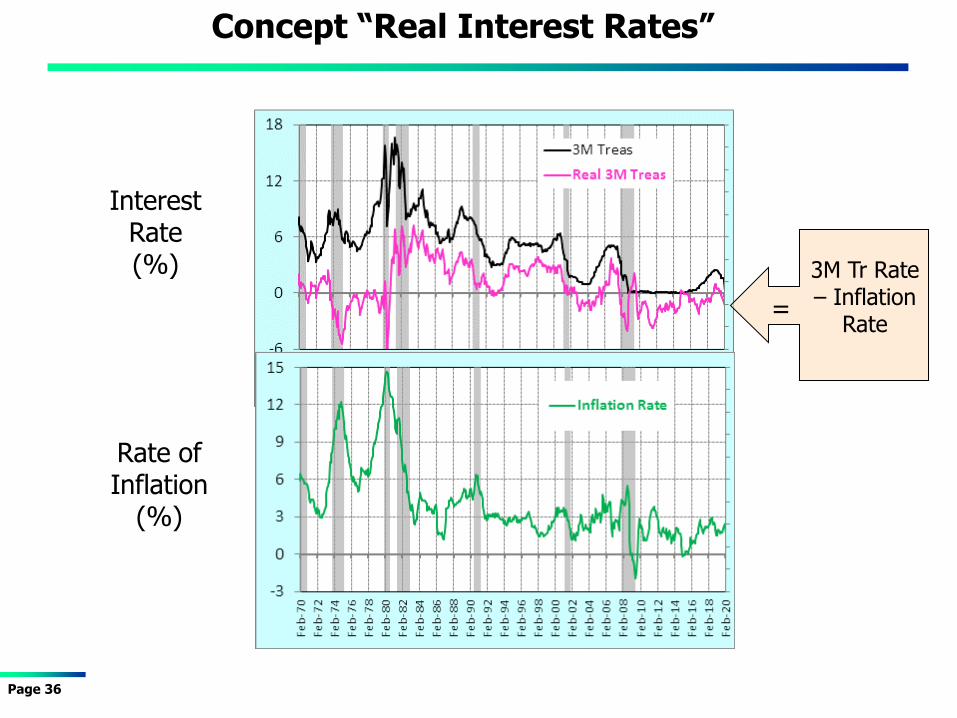
Concept “Real Interest Rates”
Page 36
Interest Rate (%)
Rate of Inflation
(%)
3M Tr Rate – Inflation
Rate =

International Real Interest Rates including USA
Page 37
Real Interest
Rate (%)
Why have real interest rates declined over the past 30 years?

The “Natural” Real Rate of Interest (R*)
Easy to describe
Since the economy is only at full employment “occasionally” the estimate of R* is based on a “theoretical” model
This means that measurement is highly sensitive to modeling assumptions, involving non-directly observable parameters
Academics refer to these as “posited parameters.”
Definition: the real short term risk free interest rate that occurs when GDP is equal to Potential GDP
Page 38

The “Natural” Real Rate of Interest
Implications
Measurement was conducted and published in a paper by the current President of the FRB of NY
It has influenced the thinking among the staff of the Fed and contributed to the reduction of interest rates in the fall of 2018.
Central banks will have less power to mitigate the impacts of recessions UNLESS they are willing to generate even lower nominal rates
This means there is the potential for negative nominal interest rates in the US at some point in the future.
If Central Banks believe the trend in R*, the impacts on the performance of the national economies could be material
Page 39

Page 40
Estimate Posted on FRB – NY Website
Note to Investors: this has material implications for equity vs. bond returns