Embed Size (px)
Citation preview

F&C Global Smaller Companies PLC
REPORT AND ACCOUNTS 2016
ContentsIntroducing Foreign & Colonial 1Financial highlights 2015 2Chairman’s statement 6Business model 10Policies 11Key Performance Indicators 12Fund Manager’s Review 14Twenty largest fund holdings 21Principal Risks and Future Prospects 22Directors 26Directors’ Report 28Corporate Governance Statement 32Management and Advisers 34Report of the Management Engagement Committee 35Report of the Nomination Committee 37Remuneration Report 38Report of the Audit Committee 41Statement of Directors’ Responsibilities 45Independent Auditors’ Report 47Income Statement 53Statement of Changes in Equity 54Balance Sheet 55Statement of Cash Flows 56Notes on the Accounts 571. General information 572. Significant accounting policies 573. Income 604. Management fees 615. Other expenses 626. Finance costs 627. Taxation on ordinary activities 638. Net return per share 639. Dividends 6410. Investments and derivative financial instruments 6511. Substantial interests 6612. Debtors 6613. Creditors: amounts falling due within one year 6714. Creditors: amounts falling due within one year 6715. Creditors: amounts falling due after more than one year 6716. Creditors: amounts falling due after more than one year 6717. Share capital 6818. Capital redemption reserve 6819. Other reserves 6920. Net asset value per ordinary share 6921. Reconciliation of total return before finance costs and taxation to net cash inflow from operating activities 7022. Contingencies and capital commitments 7023. Related Party Transactions 7124. Going Concern 7225. Financial Risk Management 7226. AIFMD 7827. Post balance sheet movement in net assets 78Ten Year Record 79Notice of Annual General Meeting 81Information for Shareholders 86How to Invest 87Glossary of Terms 88

Contents
THIS DOCUMENT IS IMPORTANT AND REQUIRES YOUR IMMEDIATE ATTENTION. If you are in any doubt about the action you should take, you are recommended to seek your own independent financial advice from your stockbroker, bank manager, solicitor, accountant or other independent financial adviser authorised under the Financial Services and Markets Act 2000 if you are in the United Kingdom or, if not, from another appropriately authorised financial adviser. If you have sold or otherwise transferred all your ordinary shares or your holding of 3.5% Convertible Unsecured Loan Stock 2019 in F&C Global Smaller Companies PLC please forward this document, together with the accompanying documents, immediately to the purchaser or transferee or to the stockbroker, bank or agent through whom the sale or transfer was effected for transmission to the purchaser or transferee.
Registered in England and Wales with company registration number 28264.
ii | F&C Global Smaller Companies PLC
OVERVIEWIntroducing F&C Global Smaller Companies PLC 1Financial Highlights 2
STRATEGIC REPORTChairman’s Statement 6Business Model 10Policies 11Key Performance Indicators 12Manager’s Review 13Thirty Largest Holdings 24List of Investments 26Principal Risks and Future Prospects 30
GOVERNANCE REPORTDirectors 34Directors’ Report 35Corporate Governance Statement 42Remuneration Report 46Report of the Audit and Management Engagement Committee 49Statement of Directors’ Responsibilities 53
AUDITORS’ REPORTIndependent Auditors’ Report 56
FINANCIAL REPORTIncome Statement 63Statement of Changes in Equity 64Balance Sheet 65Statement of Cash Flows 66Notes on the Accounts 67Ten Year Record 84
NOTICE OF MEETINGNotice of Annual General Meeting 86
OTHER INFORMATIONInformation for Shareholders 91How to Invest 92Management and Advisers 93Glossary of Terms 94
Financial Calendar
Annual General Meeting 28 July 2016
Final dividend payable* 12 August 2016
Half-yearly results for 2017 announced December 2016
Interim dividend payable January 2017
Final Results for 2017 announced June 2017*To shareholders on the register at the close of business on 15 July 2016

Report and Accounts 2016 | 1
OV
ER
VIE
WS
TR
AT
EG
IC R
EP
OR
TG
OV
ER
NA
NC
E R
EP
OR
TA
UD
ITO
RS
’ RE
PO
RT
FINA
NC
IAL R
EP
OR
TN
OT
ICE
OF M
EE
TIN
GO
TH
ER
INFO
RM
AT
ION
OVERVIEW
Visit our website at www.fandcglobalsmallers.com
Introducing F&C Global Smaller Companies PLC
Potential investors are reminded that the value of investments and the income from them may go down as well as up and investors may not receive back the full amount invested. Tax benefits may vary as a result of statutory changes and their value will depend on individual circumstances.
The objective of your Company is to invest in smaller companies worldwide in order to secure a high total return.
We ignore the largest listed companies, focusing instead on smaller quoted stocks which display the potential for superior growth. Many smaller companies are often overlooked by brokers and other investors, providing us the opportunity to identify undervalued opportunities within a wide investment universe.
We recognise the particular risks inherent in smaller company investing. Our portfolio is invested across many individual companies and funds, providing a global exposure to stock markets and sectors reducing the risk of over-exposure to any one company, market, currency or industry.
Our record of increasing the dividend for 46 years in a row is one that we are proud of. By focusing on companies that have the potential to deliver future growth, we hope to receive an increasing stream of investment income in the years ahead.
F&C Global Smaller Companies is suitable for retail investors in the UK, professionally advised private clients and institutional investors who seek growth over the long term, and who understand and are willing to accept the risks, as well as the rewards, of exposure to smaller companies.

2 | F&C Global Smaller Companies PLC
Forward-looking statementsThis document may contain forward-looking statements with respect to the financial condition, results of operations and business of the Company. Such statements involve risk and uncertainty because they relate to future events and circumstances that could cause actual results to differ materially from those expressed or implied by forward-looking statements. The forward-looking statements are based on the Directors’ current view and on information known to them at the date of this document. Nothing should be construed as a profit forecast.
Consolidating our performance record
Financial highlights
Dividend of 10.70 pence – 46th consecutive annual increaseWe recognise the importance of a rising dividend in real terms. The total dividend for the year is 10.70 pence, an increase of 10.9%.10.70
pence
Shares ended the year at a premium of 0.7%For most of the year the share price traded at a premium to NAV at a time when other trusts have seen more volatility in their discount.0.7%
Strong performance with 3.5% Net Asset Value (“NAV”) total returnThe diluted NAV rose to 994.50p. The total return of 3.5% beat the benchmark which returned 1.3%.3.5%
3.2%Share price total return of 3.2%The share price ended the year at 1001p and over ten years has risen by 157.3%, the equivalent of 9.9% per annum.
Report and Accounts 2016 | 3
OVERVIEW
OV
ER
VIE
WS
TR
AT
EG
IC R
EP
OR
TG
OV
ER
NA
NC
E R
EP
OR
TA
UD
ITO
RS
’ RE
PO
RT
FINA
NC
IAL R
EP
OR
TN
OT
ICE
OF M
EE
TIN
GO
TH
ER
INFO
RM
AT
ION
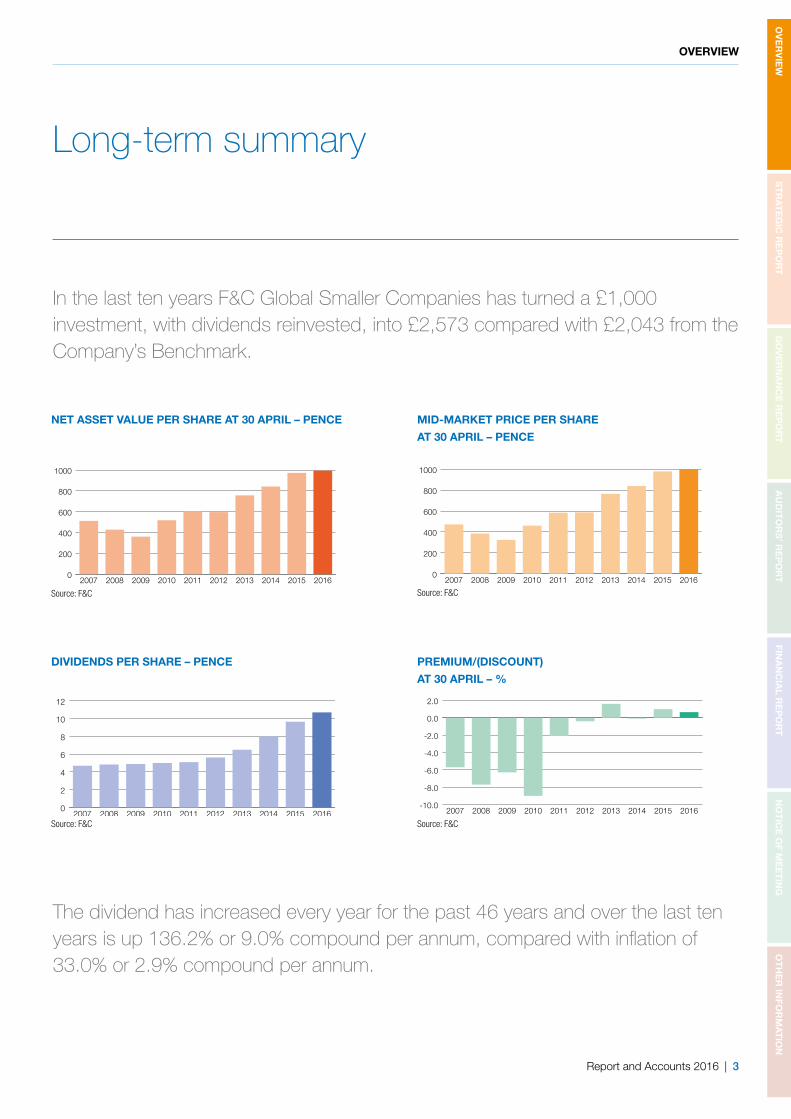
DIVIDENDS PER SHARE – PENCE
0
2
4
6
8
10
12
2016201520142013201220112010200920082007Source: F&C
Long-term summary
In the last ten years F&C Global Smaller Companies has turned a £1,000 investment, with dividends reinvested, into £2,573 compared with £2,043 from the Company’s Benchmark.
The dividend has increased every year for the past 46 years and over the last ten years is up 136.2% or 9.0% compound per annum, compared with inflation of 33.0% or 2.9% compound per annum.
NET ASSET VALUE PER SHARE AT 30 APRIL – PENCE
0
200
400
600
800
1000
2016201520142013201220112010200920082007
Source: F&C
PREMIUM/(DISCOUNT)
AT 30 APRIL – %
-10.0
-8.0
-6.0
-4.0
-2.0
0.0
2.0
2016201520142013201220112010200920082007
Source: F&C
0
200
400
600
800
1000
2016201520142013201220112010200920082007
MID-MARKET PRICE PER SHARE
AT 30 APRIL – PENCE
Source: F&C

4 | F&C Global Smaller Companies PLC
BUSINESS MODEL AND STRATEGY
in 2014.”
‘The Company’s shares have been a popular choice for parents, with more than 20,000 children having become shareholders through a Child Trust Fund or Junior ISA’

Report and Accounts 2016 | 5
STRATEGIC REPORT
OV
ER
VIE
WS
TR
AT
EG
IC R
EP
OR
TG
OV
ER
NA
NC
E R
EP
OR
TA
UD
ITO
RS
’ RE
PO
RT
FINA
NC
IAL R
EP
OR
TN
OT
ICE
OF M
EE
TIN
GO
TH
ER
INFO
RM
AT
ION
6 | F&C Global Smaller Companies PLC
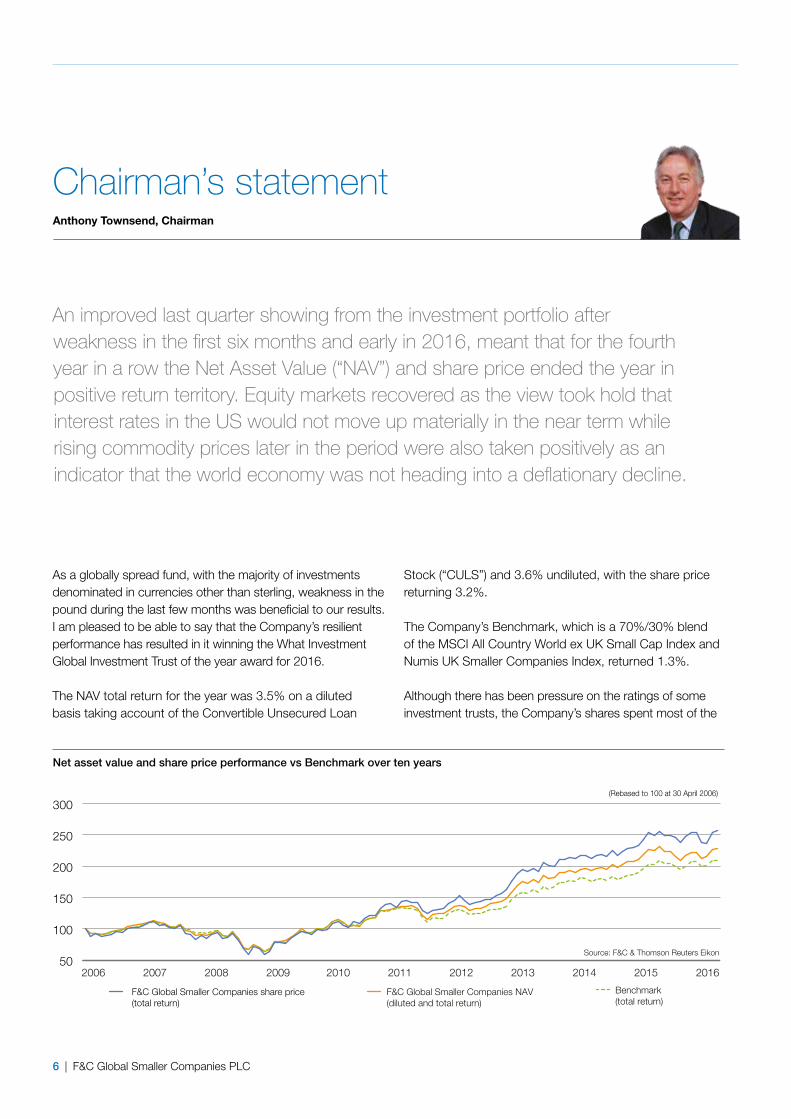
Net asset value and share price performance vs Benchmark over ten years
Anthony Townsend, Chairman
Chairman’s statement
50
100
150
200
250
300
2006 2007 2008 2009 2010 2011 2012 2013 2014 20162015
Source: F&C & Thomson Reuters Eikon
Benchmark (total return)
F&C Global Smaller Companies NAV (diluted and total return)
F&C Global Smaller Companies share price (total return)
(Rebased to 100 at 30 April 2006)
An improved last quarter showing from the investment portfolio after weakness in the first six months and early in 2016, meant that for the fourth year in a row the Net Asset Value (“NAV”) and share price ended the year in positive return territory. Equity markets recovered as the view took hold that interest rates in the US would not move up materially in the near term while rising commodity prices later in the period were also taken positively as an indicator that the world economy was not heading into a deflationary decline.
As a globally spread fund, with the majority of investments denominated in currencies other than sterling, weakness in the pound during the last few months was beneficial to our results. I am pleased to be able to say that the Company’s resilient performance has resulted in it winning the What Investment Global Investment Trust of the year award for 2016.
The NAV total return for the year was 3.5% on a diluted basis taking account of the Convertible Unsecured Loan
Stock (“CULS”) and 3.6% undiluted, with the share price returning 3.2%.
The Company’s Benchmark, which is a 70%/30% blend of the MSCI All Country World ex UK Small Cap Index and Numis UK Smaller Companies Index, returned 1.3%.
Although there has been pressure on the ratings of some investment trusts, the Company’s shares spent most of the

Report and Accounts 2016 | 7
STRATEGIC REPORT
OV
ER
VIE
WS
TR
AT
EG
IC R
EP
OR
TG
OV
ER
NA
NC
E R
EP
OR
TA
UD
ITO
RS
’ RE
PO
RT
FINA
NC
IAL R
EP
OR
TN
OT
ICE
OF M
EE
TIN
GO
TH
ER
INFO
RM
AT
ION
year trading at a small premium to the prevailing NAV, and a total of 2,276,000 new shares (4.3% of the initial share capital ) were issued to meet demand from new and existing investors. The shares ended the year at a 0.7% premium to the diluted cum-income NAV. We will use our buyback powers if necessary to help maintain a stable relationship between the NAV and share price.
DividendsSteady underlying dividend growth across the fund continued to be evident in the year. Diluted revenue per share rose by 8.4% despite lower special dividends from stocks held in the portfolio. Expenses fell in the year mainly because the previous year’s costs had included one-off fees relating to the issue of Convertible Unsecured Loan Stock in 2014.
The Board is therefore proposing a final dividend of 7.80 pence per share, which together with the interim 2.90 pence per share makes a full year payment of 10.70 pence. This is 10.9% higher than last year and is the 46th consecutive year in which the dividend has risen. Payment will be made on 12 August 2016 to those on the register on 15 July 2016.
‘We are included in the ‘dividend heroes’ list published by the AIC’
Economic backgroundInterest rate movements are often key drivers for stock markets, and much attention in the year surrounded the outlook for rates in the US. Although growth in the US economy eased back in the second half, the Federal Reserve Bank eventually decided to raise rates for the first time in nearly a decade by 0.25% just before Christmas as a pre-emptive strike against the potential threat of inflation. Elsewhere, Central Banks were generally in easing mode, and we now even have the phenomenon of negative interest rates in a number of countries. These are meant to encourage the financial sector to use its capacity to lend more to the wider economy. In many places however, demand for credit remains suppressed and banks are also under regulatory pressure to
build their capital strength so have been reluctant to expand their loan books too aggressively.
Commodity price weakness driven in large part by a slowdown in demand from China, continued to be a major feature. Brent crude prices slumped to below $30 a barrel at the start of 2016, but have bounced back more recently as the markets have started to anticipate the supply response. Lower oil prices were expected to boost the global economy by encouraging extra retail spending, but consumers in most nations have remained cautious in using this windfall.
In the UK, the economy grew satisfactorily in 2015, with domestic consumption benefiting from a strong labour market. Continental European economies continued to stage a recovery, though the refugee crisis and renewed fragility in parts of the banking sector undermined confidence in the latter stages of the period. As a result, the European Central Bank stepped up its market intervention with interest rates cut once again and the scale of quantitative easing increased. The Bank of Japan, seeking to lift its sluggish domestic economy and reach its targeted 2% inflation rate, moved to impose negative interest rates on some commercial bank deposits in January.
Asian and Latin American economies were mixed with on the one hand some countries like India doing relatively well. Others with a high dependence on commodities trade, such as Brazil, moved into deep recession. China, increasingly important now in a global sense, reported a modest slowdown in overall growth, with signs of stress apparent in a number of export dependent sectors where capacity has been expanded too much.
Portfolio performanceCurrency moves had a larger than usual impact on the performance of the fund this year. The US dollar was strong as the markets anticipated higher US rates, but it pulled back later on as expectations of further rises faded. As often in times of uncertainty, the yen appreciated, despite the Bank of Japan’s move on rates. Weakness in sterling took hold late in the year as the government called for a poll on the

8 | F&C Global Smaller Companies PLC
UK’s membership of the EU, and opinion polls indicated uncertainty around the eventual outcome.
Invariably however, it is stock selection that will define whether it has been a good year or a bad year. The table below highlights the returns from the five parts of the portfolio compared to the local small cap markets. Representing more than 70% of our assets, stock-picking in the US and UK will always be key to the overall out-turn, and we were well ahead in both countries. Although we were behind in Europe and more markedly in Japan, this followed strong relative performance in these markets in 2014/15. Returns in the Rest of World segment, incorporating our fund holdings targeting the Pacific ex Japan and Latin American markets, were once again disappointing compared to elsewhere, as sentiment to emerging markets as a whole remained fragile.
Asset AllocationThe year end asset allocation by geographic exposure did not change much from a year ago. In the first half of the year, the UK weighting rose to over 30% reflecting a good flow of new investment opportunities being identified, but it drifted lower near the end of the period as the Manager took action to reflect the risk of sterling weakness ahead of the EU referendum. We moved overweight compared to the Benchmark in North America during the second half of the year, taking the view that the market could be something of a safe haven given the possibility of higher US interest rates coming through. In contrast, we took some money out of our Japanese funds and moved slightly underweight on the basis that the relative outperformance of the market had gone far enough. Exposure to the Rest of World (predominantly Asian markets) dropped, mainly as a consequence of the weak market performance. In
overall terms our asset allocation positioning during the year added some value against the Benchmark, with the decisions to be underweight to the Rest of the World and overweight in Europe proving the right calls.
GearingThe Board believes that the use of a moderate level of structural, or on-going, leverage, is likely to be beneficial over
‘Representing more than 70% of our assets, stock-picking in the US and UK will always be key to the overall out-turn, and we were well ahead in both countries.’
Geographical performance (total return sterling adjusted) for the year ended 30 April 2016
-12
-9
-6
-3
0
3
6
9
12
15
Latin AmericaPacific ex JapanJapanContinental EuropeUSUK
Source: F&CPortfolio Local smaller companies index
7.6%
1.8%(1.3)%
1.6%
5.7%
3.1%
12.1%
(9.3)% (9.9)% (9.3)% (7.1)%
6.7%

Report and Accounts 2016 | 9
STRATEGIC REPORT
OV
ER
VIE
WS
TR
AT
EG
IC R
EP
OR
TG
OV
ER
NA
NC
E R
EP
OR
TA
UD
ITO
RS
’ RE
PO
RT
FINA
NC
IAL R
EP
OR
TN
OT
ICE
OF M
EE
TIN
GO
TH
ER
INFO
RM
AT
ION
the long term as market levels appreciate. Taking account of the Convertible Unsecured Loan Stock and net cash held in the normal course of portfolio management, effective gearing was relatively stable through the year, ending it at 4.7%.
Change to management fee arrangementsThe Company has, for the last ten years, paid fees to the Manager, F&C, on both an ad-valorem and performance basis. The performance element of the fee related to the Company’s NAV return compared to that of the Benchmark. Over this time, the NAV has risen by 132.8% compared to a 104.3% rise from the Benchmark (both in total return terms) and F&C have earned a performance fee on six occasions, including in each of the last four years. For 2015/16, a performance fee of £1.3m is due to be paid as a result of the outperformance delivered in the year.
Since 2006, there have been many changes within the funds market place and the Board has regularly reviewed whether a performance fee based structure remains appropriate. Having traditionally been more expensive for retail investors, open ended funds such as unit trusts or OEICs, have tended to cut their fee rates in recent years, while there has been a move away from the use of performance fees by investment trusts amid a general trend towards simplification.
F&C Global Smaller Companies’ base management fees have been 0.4% for that part of the investment portfolio invested in individual company equities and 0.25% for the collective funds used mainly to gain exposure to Japanese and Asian markets. F&C to this point, have had the opportunity to earn additional remuneration through the performance fee structure whereby they received 10% of the excess performance compared to the Benchmark.
The Board, after careful consideration and discussion with F&C, has concluded that there is merit in reducing the complexity around the costs of investing in your Company by, with effect from 1 May 2016, removing the performance fee and increasing the base fee on individual holdings to 0.55%, and the fee on the collectives to 0.275%. Based on the end of year split of assets this translates into approximately a 0.50% blended management fee payable to F&C which should, depending on the geographic split of assets and the extent to which collectives are used, remain fairly constant going forward. No further performance fees will be paid to F&C, and as a result the volatility around fund charges will be reduced.
The Board appreciates the increasing focus on fund costs and believes that the revised fee arrangement will position the Company very competitively relative to alternative
options. Had the proposed new fee structure been in place in 2015/16, fees payable to F&C would have been £658,000 lower. Incorporating the new fee structure, the ongoing charges ratio is 0.85%.
The Board and corporate governanceThe three new directors who joined the Board in 2015 have settled in very well and the Board continues to have the right level of investment knowledge, business and financial skills and experience for the future success of your Company.
Your Board remains committed to the highest standards of corporate governance. Jane Tozer and I have been Directors for more than nine years and, as reported last year, all the Directors will now stand for re-election annually regardless of their length of tenure in line with corporate governance best practice.
OutlookEquities struggled to advance over the last year in part due to lacklustre corporate earnings numbers pretty much around the globe. However, low and now in some places, negative bank interest rates, plus compressed government and corporate bond yields, provide investors with few attractive alternative options. Although there is uncertainty around the up-coming EU referendum, the Board continues to be optimistic that the Company can continue to deliver on its objective to shareholders over the medium term.
Anthony Townsend Chairman 22 June 2016
North America 42.3% (40.2%)
UK 29.3% (29.6%)
Continental Europe 11.9% (11.5%)
Rest of World 9.0% (11.0%)
Japan 7.5% (7.7%)
Geographical distribution of the investment portfolio as at 30 April 2016
Source: F&C
The percentages in brackets are as at 30 April 2015
10 | F&C Global Smaller Companies PLC
Business model
Our objective is to invest in smaller companies worldwide in order to secure a high total return.
Our approachIn most parts of the world, smaller company equities have historically delivered strong longer term returns to investors ahead of overall equity market returns. As an investment trust, the Company is particularly well suited to long-term investment in these smaller less liquid companies. Our approach is to seek out suitable long-term global investment opportunities in publicly listed companies with market capitalisations that fall into the generally accepted local definition of a smaller company.
Our appointed Manager, F&C, places particular focus on fundamental analysis of the opportunities in the North American, UK and Continental European stock markets. The emphasis is on meeting individual companies and understanding the quality of their management, their position in their targeted market and their strategy for growth. Importantly, assessment is made on each individual company’s financial strength and cash flow dynamics. The aim is to invest in high quality companies at attractive prices with the potential to deliver strong returns. We use funds to gain exposure to companies in areas where our Manager lacks dedicated smaller company investment management resource, such as in Japan, Asia, Latin America and Africa. Exposure to the different geographic markets is adjusted within specific ranges in the light of the attraction of local valuations and the outlook for currencies, but stock selection is the main driver of the Company’s overall returns. A full list of investments appears on pages 26 to 29.
The BoardThe Board of Directors is responsible for corporate strategy; corporate governance; risk and control assessment; the overall investment and dividend policies; setting limits on gearing and asset allocation; monitoring investment performance and for approving marketing budgets. An important responsibility is the formal annual evaluation of
the Manager’s appointment as part of which investment performance and administrative services are reviewed. The wholly non-executive Board comprises three male and three female Directors.
The Lead ManagerAs Lead Manager on behalf of F&C, Peter Ewins is responsible for the allocation of the assets on a regional basis and for the construction of the investment portfolio including the selection of any smaller company investment funds. F&C has a team of smaller company investment managers that support the Lead Manager in the selection of stocks for the North American, UK and Continental European stock markets.
MarketingF&C continues to promote investment in the Company’s shares, which are suitable for retail distribution in the UK as well as professionally advised private clients and institutional investors. Promotion has traditionally been made through the F&C Savings Plans, which remain a cost effective and flexible way to invest in the Company.
The Company continues to see a notable increase in the number of shares held through investment platforms. The Board hopes to see access to the Company’s shares on as many platforms as possible as more and more investors make their own investment decisions in the wake of the Retail Distribution Review.
The Board will continue to work closely with F&C to ensure optimal delivery of the Company’s investment proposition through all available channels.
Report and Accounts 2016 | 11
STRATEGIC REPORT
OV
ER
VIE
WS
TR
AT
EG
IC R
EP
OR
TG
OV
ER
NA
NC
E R
EP
OR
TA
UD
ITO
RS
’ RE
PO
RT
FINA
NC
IAL R
EP
OR
TN
OT
ICE
OF M
EE
TIN
GO
TH
ER
INFO
RM
AT
ION
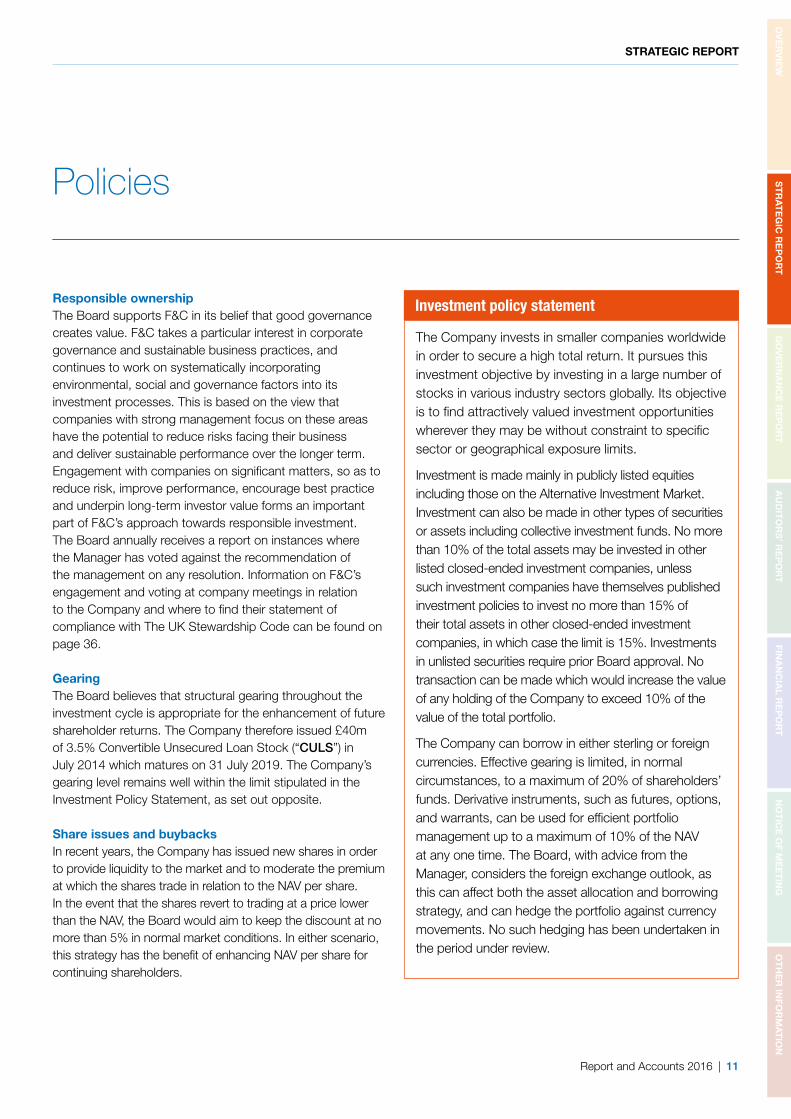
Policies
Responsible ownershipThe Board supports F&C in its belief that good governance creates value. F&C takes a particular interest in corporate governance and sustainable business practices, and continues to work on systematically incorporating environmental, social and governance factors into its investment processes. This is based on the view that companies with strong management focus on these areas have the potential to reduce risks facing their business and deliver sustainable performance over the longer term. Engagement with companies on significant matters, so as to reduce risk, improve performance, encourage best practice and underpin long-term investor value forms an important part of F&C’s approach towards responsible investment. The Board annually receives a report on instances where the Manager has voted against the recommendation of the management on any resolution. Information on F&C’s engagement and voting at company meetings in relation to the Company and where to find their statement of compliance with The UK Stewardship Code can be found on page 36.
GearingThe Board believes that structural gearing throughout the investment cycle is appropriate for the enhancement of future shareholder returns. The Company therefore issued £40m of 3.5% Convertible Unsecured Loan Stock (“CULS”) in July 2014 which matures on 31 July 2019. The Company’s gearing level remains well within the limit stipulated in the Investment Policy Statement, as set out opposite.
Share issues and buybacksIn recent years, the Company has issued new shares in order to provide liquidity to the market and to moderate the premium at which the shares trade in relation to the NAV per share. In the event that the shares revert to trading at a price lower than the NAV, the Board would aim to keep the discount at no more than 5% in normal market conditions. In either scenario, this strategy has the benefit of enhancing NAV per share for continuing shareholders.
The Company invests in smaller companies worldwide in order to secure a high total return. It pursues this investment objective by investing in a large number of stocks in various industry sectors globally. Its objective is to find attractively valued investment opportunities wherever they may be without constraint to specific sector or geographical exposure limits.
Investment is made mainly in publicly listed equities including those on the Alternative Investment Market. Investment can also be made in other types of securities or assets including collective investment funds. No more than 10% of the total assets may be invested in other listed closed-ended investment companies, unless such investment companies have themselves published investment policies to invest no more than 15% of their total assets in other closed-ended investment companies, in which case the limit is 15%. Investments in unlisted securities require prior Board approval. No transaction can be made which would increase the value of any holding of the Company to exceed 10% of the value of the total portfolio.
The Company can borrow in either sterling or foreign currencies. Effective gearing is limited, in normal circumstances, to a maximum of 20% of shareholders’ funds. Derivative instruments, such as futures, options, and warrants, can be used for efficient portfolio management up to a maximum of 10% of the NAV at any one time. The Board, with advice from the Manager, considers the foreign exchange outlook, as this can affect both the asset allocation and borrowing strategy, and can hedge the portfolio against currency movements. No such hedging has been undertaken in the period under review.
Investment policy statement

12 | F&C Global Smaller Companies PLC
Key Performance Indicators
The Board recognises that it is longer term share price performance that is most important to the Company’s investors, coupled with a steadily rising dividend. Underlying share price performance is driven largely by the performance of the NAV. The overriding priority is to continue to strive for the consistent achievement of relative outperformance; adding value for shareholders through NAV and share price total return; discount/premium management; dividend
growth; low and competitive ongoing charges; and effective marketing. The Board assesses its performance in meeting the Company’s objective against the following measures including regional performance against local benchmarks set out on page 13. Commentary can be found in the Chairman’s Statement and Manager’s Review in relation to regional performance.
Premium/(Discount) (including current period income)
At 30 April %
2016 0.7
2015 1.0
2014 (0.1)*
2013 1.6*
2012 (0.4)*
*Debenture at market valueSource: F&C
Ongoing charges* (as a percentage of average net assets)
30 April % (excluding
performance fees)% (including
performance fees)
2016 0.85 0.85
2015 0.79 1.08
2014 0.76 0.78
2013 0.85 1.49
2012 1.08 1.56
Source: F&C*Calculated under the AIC Guidelines issued in May 2012. See page 96
Total return performance
1 Year %
3 Years %
5 Years %
Company NAV (diluted) total return 3.5 35.3 71.8
Benchmark total return 1.3 30.3 53.0
Company share price total return 3.2 34.7 79.8Source: F&C
Dividend growth
1 Year%
3 Years%
5 Years%
Dividends 10.9 64.7 109.9
Retail Prices Index 1.3 4.8 11.5
Source: F&C and Thomson Reuters Eikon

Report and Accounts 2016 | 13
STRATEGIC REPORT
Peter Ewins, Lead Manager
Manager’s Review
OV
ER
VIE
WS
TR
AT
EG
IC R
EP
OR
TG
OV
ER
NA
NC
E R
EP
OR
TA
UD
ITO
RS
’ RE
PO
RT
FINA
NC
IAL R
EP
OR
TN
OT
ICE
OF M
EE
TIN
GO
TH
ER
INFO
RM
AT
ION
Manager’s Review
2016 ResultsThe last financial year proved to be a tough one for global equity investors with the markets beset by worries about the potential impact of a rise in US interest rates and poor economic news in China, where reported GDP growth of around 7% appears to be over-stating the real state of the local economy. Smaller stocks did better than large caps in the UK, Europe and Japan, but lagged in Asia as a whole and the US. We always aim to deliver the best returns that we can in the circumstances, while keeping an eye on the portfolio’s risk profile, and we ended the year slightly up, with a NAV total return of 3.5%, beating the 1.3% rise in the Benchmark. Strong income received from the portfolio allowed the Board again to propose a meaningful increase in the dividend.
Last year, I reflected upon the impact on the fund of the plummeting oil price, which had started its descent in late 2014. This weakness persisted through the first two thirds of the financial year, after which there has been a partial recovery. During the year we looked for opportunities to acquire undervalued oil related investments, but it proved to be very hard to find oil exploration, production or services companies that appealed. When we did our analysis, in many cases balance sheet risk ruled stocks out, while in others the shares had not fallen far enough and were discounting a very sharp bounce-back in the oil price. Tangentially within mining, we have always felt that there are few small cap companies in possession of mines well positioned on the cost curve, and
during the year we exited several low conviction holdings on the UK portfolio. We did however feel that there were several companies which had some partial exposure to oil or mining activities, where the stock market was taking too negative a view on prospects. Some of these stocks that we acquired have bounced back nicely from their lows.
While there has been much talk about difficult economic conditions, it is worth reflecting upon the fact that the US economy has been growing now since mid 2009, and unemployment is down to a historically low 5.5%. We view this as indicating that the economic cycle is looking quite extended, so over recent months, we have also moved to re-focus our US portfolio more towards steady growth businesses, reducing exposure to recovery or management turnaround stories. This is because it is easier to deliver a turnaround if the economy is accelerating, than when growth is anaemic. In Europe on the other hand, where the recovery out of the downturn has been less significant to date, we have potentially got more scope to see companies earnings performance recover with the cycle.
Across the whole portfolio, the balance sheet strength of potential investments remained a key focus. Post the recent US rate rise, the markets are becoming less willing to tolerate high leverage and companies with net cash or strong balance sheets have optionality in terms of strategy going forward. We are also conscious that the period of low rates has potentially
Table of returns
1 year 3 years 5 years
Fund Benchmark Fund Benchmark Fund Benchmark
UK 7.6% 1.8% 54.6% 33.0% 107.4% 65.4%
US 6.7% (1.3)% 38.5% 32.3% 83.0% 59.8%
Continental Europe 1.6% 5.7% 42.4% 41.9% 71.5% 32.3%
Japan 3.1% 12.1% 34.2% 29.1% 93.9% 72.1%
Rest of World* (9.3)% (9.9)% (8.7)% 0.8% 12.5% 3.2%*Rest of World performance is compared against the MSCI All Countries Asia Pacific ex Japan Small Cap Index
Source F&C, sterling total returns

14 | F&C Global Smaller Companies PLC
created bubble like valuations in certain income orientated assets, or where DCF calculations on very long dated cashflow projections are relied upon to justify share prices. While low rates may be with us for some time yet, we are cautious in believing that they will be sustainable at these levels forever.
So how did the regional portfolios do last year and how have they done over longer time periods? The table on the previous page shows the results all in sterling total return terms and over the last year the overseas returns have been flattered by the weakness of sterling. Despite this, we achieved our best return in the UK, once again justifying the high exposure that we retained to domestic stocks. Most pleasing for me last year was the result from the US portfolio with our team delivering a very strong return, having actively rebalanced the portfolio over the course of the year. While we had a more difficult time in Europe and Japan, the long term numbers in both areas continue to make for pleasant reading.
During the year we did not change much in terms of asset allocation as can be seen by the pie chart on page 29, with our year end positioning versus the Benchmark shown in the bar chart above. The most significant change was to move a little overweight in the US. The UK weighting ended the year little moved, while we remained overweight to Europe. We continue to feel that the quantitative easing policy of the ECB is supporting the local economic outlook and prospects for good quality European based companies. By contrast we moved underweight in Japan, as the local economy remained
sluggish, and there is a possibility that the yen could start to lose ground at some point.
We moved further underweight in terms of our exposure to the Rest of the World segment. With US rates rising and concerns about the real state of play in China unlikely to abate, we felt that sentiment was likely to remain against these markets. Having said this, we have more recently stepped up our research on a number of potential new Asian market focused funds that could fit into our Rest of World portfolio.
We remained more or less equally geared at around the 5% level in line with the Board’s policy throughout the year with most of the £40m Convertible Unsecured Loan Stock listed in 2014, remaining in issue. The impact of the gearing was limited given the modest underlying move in the investment portfolio.
UK Review
Portfolio Performance +7.6%
Numis UK Smaller Companies (excluding investment companies) Index +1.8%
FTSE All Share Index -5.7%
This was the sixth year in a row that the portfolio has beaten the Numis index shown above. A lower exposure to the weak commodity related sectors for small caps compared to large caps and a higher weighting of domestic cyclicals, meant that smaller company returns were considerably ahead of the FTSE All Share.
90
100
110
120Currency strengtheningagainst Sterling
Currency weakeningagainst Sterling
Apr 15 Aug 15 Dec 15 Apr 16
Currency movements relative to sterling in the year ended 30 April 2016
Source: F&C
US Dollar Japanese YenEuro
-2% -1% 0% 1% 2%
North America 1.2%
Continental Europe 1.9%
Rest of World (1.8)%
Japan (0.6)%
UK (0.7)%
Geographical weightings against Benchmark as at 30 April 2016
Source: F&C & MSCI

Report and Accounts 2016 | 15
STRATEGIC REPORT
OV
ER
VIE
WS
TR
AT
EG
IC R
EP
OR
TG
OV
ER
NA
NC
E R
EP
OR
TA
UD
ITO
RS
’ RE
PO
RT
FINA
NC
IAL R
EP
OR
TN
OT
ICE
OF M
EE
TIN
GO
TH
ER
INFO
RM
AT
ION
quoted low cost gym operator taking share from mid-market operators, while Purplebricks Group operates a hybrid online/personal service model, charging a much cheaper fee for property vendors compared to traditional high street estate agents.
Some of our longer term holdings also delivered well. James Fisher & Sons supplies a wide range of niche services into mainly marine based markets, and with some exposure to offshore oil, it had underperformed during the previous year and in the first half of 2015/16. In the second half however, the recovery in the oil price and a succession of major contract wins in the renewables, defence and nuclear sectors were announced, underlining just how broad the company’s range of expertise is. While capital goods stocks were generally weak, within the wide universe of small cap stocks, there are nearly always companies that can buck the general trend. Hill & Smith has been held in the fund for more than a decade and the company enjoyed an excellent year with its galvanising business in the US going well. The company has skilfully expanded its presence across the US in places where there is a shortage of capacity, while the outlook for the UK centric roads products business is now looking rosier as the Highways Agency is pushing on with a major investment program over the next few years. In the insurance sector, Novae once again delivered good underwriting results and a sizeable special dividend to us.
The UK economy grew at a respectable 2.3% in 2015 and the number of people in employment rose to a new record level. This provided a solid base for companies exposed to consumer spending, although less positively the UK’s fiscal situation and current account deficit remain seemingly intractable problems. The Bank of England kept base rates at 0.5% for the full year but announced measures aimed at restraining buy to let lending amid fears over the risks stemming from a potential housing market correction.
Some of the larger positive contributions came from stocks which have not been in the public arena for long, most notably premium tonics supplier Fevertree Drinks and fund administration business Sanne. Fevertree Drinks’ sales rose 71% in 2015 as it managed to secure greater distribution within some of the key UK supermarket chains and also grew its international business. The shares ended the period some 356% up on their November 2014 float price. Sanne has also been re-rated significantly. The market has warmed to the recurring nature of its revenue and management have delivered against objectives set at the time it joined the market. Clipper Logistics was another good performer. This online retail logistics business won new contracts with John Lewis and other blue chip operators and its shares were up by 42.1%. We trimmed all three of these positions during the course of the year as the valuation case became less strong in the short term. In terms of initial public offerings in 2015/16, two performed very well for us. The Gym Group is the only
JD Sports Fashion once again increased its market share.
16 | F&C Global Smaller Companies PLC
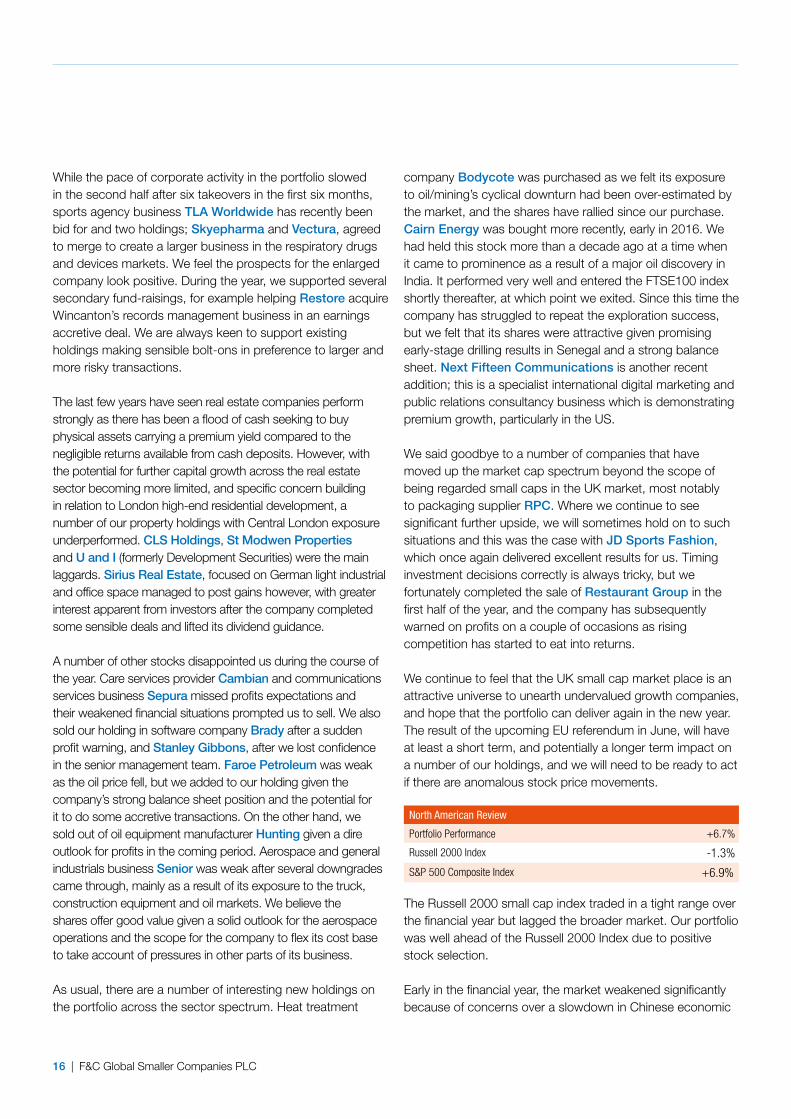
company Bodycote was purchased as we felt its exposure to oil/mining’s cyclical downturn had been over-estimated by the market, and the shares have rallied since our purchase. Cairn Energy was bought more recently, early in 2016. We had held this stock more than a decade ago at a time when it came to prominence as a result of a major oil discovery in India. It performed very well and entered the FTSE100 index shortly thereafter, at which point we exited. Since this time the company has struggled to repeat the exploration success, but we felt that its shares were attractive given promising early-stage drilling results in Senegal and a strong balance sheet. Next Fifteen Communications is another recent addition; this is a specialist international digital marketing and public relations consultancy business which is demonstrating premium growth, particularly in the US.
We said goodbye to a number of companies that have moved up the market cap spectrum beyond the scope of being regarded small caps in the UK market, most notably to packaging supplier RPC. Where we continue to see significant further upside, we will sometimes hold on to such situations and this was the case with JD Sports Fashion, which once again delivered excellent results for us. Timing investment decisions correctly is always tricky, but we fortunately completed the sale of Restaurant Group in the first half of the year, and the company has subsequently warned on profits on a couple of occasions as rising competition has started to eat into returns.
We continue to feel that the UK small cap market place is an attractive universe to unearth undervalued growth companies, and hope that the portfolio can deliver again in the new year. The result of the upcoming EU referendum in June, will have at least a short term, and potentially a longer term impact on a number of our holdings, and we will need to be ready to act if there are anomalous stock price movements.
North American Review
Portfolio Performance +6.7%
Russell 2000 Index -1.3%
S&P 500 Composite Index +6.9%
The Russell 2000 small cap index traded in a tight range over the financial year but lagged the broader market. Our portfolio was well ahead of the Russell 2000 Index due to positive stock selection.
Early in the financial year, the market weakened significantly because of concerns over a slowdown in Chinese economic
While the pace of corporate activity in the portfolio slowed in the second half after six takeovers in the first six months, sports agency business TLA Worldwide has recently been bid for and two holdings; Skyepharma and Vectura, agreed to merge to create a larger business in the respiratory drugs and devices markets. We feel the prospects for the enlarged company look positive. During the year, we supported several secondary fund-raisings, for example helping Restore acquire Wincanton’s records management business in an earnings accretive deal. We are always keen to support existing holdings making sensible bolt-ons in preference to larger and more risky transactions.
The last few years have seen real estate companies perform strongly as there has been a flood of cash seeking to buy physical assets carrying a premium yield compared to the negligible returns available from cash deposits. However, with the potential for further capital growth across the real estate sector becoming more limited, and specific concern building in relation to London high-end residential development, a number of our property holdings with Central London exposure underperformed. CLS Holdings, St Modwen Properties and U and I (formerly Development Securities) were the main laggards. Sirius Real Estate, focused on German light industrial and office space managed to post gains however, with greater interest apparent from investors after the company completed some sensible deals and lifted its dividend guidance.
A number of other stocks disappointed us during the course of the year. Care services provider Cambian and communications services business Sepura missed profits expectations and their weakened financial situations prompted us to sell. We also sold our holding in software company Brady after a sudden profit warning, and Stanley Gibbons, after we lost confidence in the senior management team. Faroe Petroleum was weak as the oil price fell, but we added to our holding given the company’s strong balance sheet position and the potential for it to do some accretive transactions. On the other hand, we sold out of oil equipment manufacturer Hunting given a dire outlook for profits in the coming period. Aerospace and general industrials business Senior was weak after several downgrades came through, mainly as a result of its exposure to the truck, construction equipment and oil markets. We believe the shares offer good value given a solid outlook for the aerospace operations and the scope for the company to flex its cost base to take account of pressures in other parts of its business.
As usual, there are a number of interesting new holdings on the portfolio across the sector spectrum. Heat treatment

Report and Accounts 2016 | 17
STRATEGIC REPORT
OV
ER
VIE
WS
TR
AT
EG
IC R
EP
OR
TG
OV
ER
NA
NC
E R
EP
OR
TA
UD
ITO
RS
’ RE
PO
RT
FINA
NC
IAL R
EP
OR
TN
OT
ICE
OF M
EE
TIN
GO
TH
ER
INFO
RM
AT
ION
and during the year it made its first international acquisition, the Perisher Ski Resort in Australia. While banking stocks moved in and out of favour during the year reflecting the evolving outlook for interest rates, Sterling Bancorp (a New York based commercial lender) delivered solid book value per share growth in the year and the shares jumped 25.9% as the company benefitted from a favourable lending environment in its markets, low loan losses and very good cost control. Another strong performer was payments processing company Total System Services, which benefited from adding Bank of America to its customer base. We took profits and sold at the end of 2015.
As ever, not all went to plan, with both ClubCorp Holdings (an operator of golf and country clubs) and Summit Materials (a producer of building materials) suffering from investor concerns over high debt levels and exposure to a weakening Texas economy. America’s Car-Mart, a used car dealer that provides finance to its customers, continued to see elevated levels of competition because of the widespread availability of low cost credit. The company rightly remained disciplined on credit underwriting but as a result earnings growth disappointed and the shares dropped 48.3%. In the latter half of 2015 there was a major correction in valuations across the pharmaceutical and biotech sectors. Whilst in relative terms the portfolio benefited from this correction as we had limited exposure to an area where we felt valuations were too high, two of our holdings were significantly impacted. Pernix Therapeutics Holdings, a provider of
growth and the impact of a rising dollar on the emerging markets. After staging a modest recovery in the Autumn, equities resumed their sell off in December as the Federal Reserve raised interest rates for the first time since 2006. When Janet Yellen subsequently reiterated that she would be patient in raising interest rates further, the market recovered in the run-up to the end of the financial year. Over the year the best performing sectors within the market were utilities, consumer staples and financial services, while the laggards were energy, health care and consumer discretionary.
While we added value through stock selection across almost the entire sector spectrum, we were helped by takeover activity at large premiums in the year for Airgas (a distributor of industrial and specialty gases and related equipment) and HCC Insurance Holdings (a specialty property and casualty insurer). Airgas was bid for by Air Liquide of France and HCC Insurance Holdings was bought by Tokio Marine Holdings of Japan. Later in the year, a Canadian listed holding, Progressive Waste Solutions announced a merger with US based peer Waste Connections, also on attractive terms.
Aside from takeovers and despite the flat overall market conditions, a number of our holdings enjoyed superb years. Profitability improved at Granite Construction and the company also benefitted from a build in backlog after a long-term highway funding bill was finally put in place in December, its shares rose 28.5%. Vail Resorts, an operator of high end ski resorts, continued to deliver impressive earnings growth
VWR is one of the largest global distributors of laboratory products to the life science and research markets.

18 | F&C Global Smaller Companies PLC
(a provider of software and information services to the fund management industry) no longer stood intact when the company reported that margins would remain under pressure for some time because of an increased need for investment to meet regulatory demands. We also decided to sell Sotheby’s as a previously hoped for turnaround proved elusive with the fine art market turning down.
The near term outlook for the US economy appears to be one of slow growth. Manufacturing is still suffering from a stronger dollar and lower commodity prices but the employment situation continues to improve with jobless claims at very low levels and wages slowly edging upwards. A healthy job market combined with lower gasoline prices and much improved consumer balance sheets should provide tailwinds behind consumer spending, which has historically been the largest driver of the US economy. The equity market may however remain volatile in the near term ahead of the impending Presidential election. At an aggregated level, corporate profit margins look full and earnings growth seems to have ground to a halt, although share buybacks have continued to support the market. Further market progress will probably require a resumption in earnings growth and continued monetary policy accommodation. We remain positive as far as the outlook for our portfolio is concerned.
Continental European Review
Portfolio Performance +1.6%
Euromoney Smaller Europe Ex UK Index +5.7%
FTSE All World Developed Europe ex UK Index -3.9%
This was a more challenging year for our European portfolio with the return underperforming the wider small cap market, although at least small caps did better than their larger peers.
The year was one of stuttering progress for the region, but leading indicators are now showing encouraging signs of a slow recovery. Indeed the Eurozone area grew at a faster than expected +0.6% in the first quarter of 2016, stronger than either the UK or the US. Given this backdrop, and the support from the latest Quantitative Easing programme from the European Central Bank, it is perhaps surprising that European smaller companies didn’t make more progress. The missing ingredient of late has been earnings growth which has proved somewhat elusive.
The other challenge when assessing the markets this year has been the wide dispersion in terms of valuation between quality assets and everything else. Last year saw a significant
paediatric medicines over-extended itself on acquisitions and ran into financial trouble, so we decided to cut our losses and sell. Specialty pharmaceuticals company BioDelivery Sciences International made progress during the year with the launch of two new products but suffered from a slower than expected sales ramp-up and as a result the shares underperformed.
This was a year of above normal activity on the portfolio as we sought to take account of volatility and diverging valuations. One of our largest purchases in the year was Martin Marietta Materials, an aggregates and cement supplier to the construction industry. This is an attractive area because the high costs involved in transporting aggregates and cement means that the company effectively operates a series of local monopolies. Industry volumes sold should increase significantly over the medium to long term as ageing US infrastructure is repaired or replaced. Other stocks in the US portfolio that are also likely to benefit from this trend are Astec Industries (a manufacturer of road paving machines and asphalt plants) and the aforementioned Granite Construction.
During the year we started a position in Sabre, a market leader in the provision of software and services to the travel and hospitality sector. We think that Sabre should continue to expand by making bolt on acquisitions that provide additional software capabilities and by using its global scale to take market share from smaller competitors. Another new holding is The Ensign Group. This is a national provider of skilled nursing facilities. We feel earnings should grow steadily as the company continues its strategy of buying and improving underperforming rival facilities. While we have held rail operator Genesee & Wyoming for several years, we decided to buy into a peer during the year as the sector pulled back in response to near term weakness in transported volumes of certain commodities. Kansas City Southern is focussed on cross border trade between Mexico and the US and the company should benefit in coming years from growth in the manufacturing footprint of global businesses seeking a cheaper base to produce goods that are destined for the US.
Our sales were mostly instances where companies performed well and reached their price targets or where we had grounds to believe that our original investment thesis was broken. In the former camp, three examples would be INTL.FCStone, a provider of financial risk management services to commercial clients, Total System Services and retailer Conn’s. We felt that our original investment thesis for DST Systems

Report and Accounts 2016 | 19
STRATEGIC REPORT
OV
ER
VIE
WS
TR
AT
EG
IC R
EP
OR
TG
OV
ER
NA
NC
E R
EP
OR
TA
UD
ITO
RS
’ RE
PO
RT
FINA
NC
IAL R
EP
OR
TN
OT
ICE
OF M
EE
TIN
GO
TH
ER
INFO
RM
AT
ION
and operating in a well-structured market. We believe that Permanent TSB is transitioning to this business model; the Irish market is consolidated and offers an enticing prospect for lenders in a good economic backdrop. The challenge for the company is to shed their remaining non-core assets and transition their historic low margin loan book to the high margins that operators in the market are currently lending at. The shares performed badly at the start of this year when it became apparent that both challenges were taking longer to overcome. We do however think that, although delayed, the investment case is still valid. EFG International on the other hand performed badly ahead of, and in reaction to the company’s announced bid for BSI, another private bank of similar size to itself. We conducted a review with the conclusion that the original investment thesis was no longer valid and have since sold the position.
On a more positive note, a number of our holdings were boosted by delivery of good results. Our strongest performer was the Irish ferry operator Irish Continental. The attractions of the business are that it is operating in a consolidated market, which yields rational competitor behaviour, while it generates strong cash flows, because of the lack of investment needs. The company is managed by a team who have proven track records of capital allocation and who are well aligned with us due to significant equity ownership. The share price performed particularly well, increasing by 28.8%, due to the improving Irish economic back-drop and
re-rating of quality companies to levels where valuations became increasingly challenging. With this backdrop, our approach has been to maintain a core portfolio of stocks where we have high conviction in the long term potential, and to augment this with a portion of more value-orientated assets, in the belief that a balanced portfolio makes sense currently. While we still believe this to be the right approach, our holdings in some of these lower rated stocks have had a very challenging year and have been responsible for almost all of our underperformance.
Many of these weaker performers can be found in the financial sector. Leonteq, for example, one of our best contributors last year, had a torrid time, falling 58.5%. This is a Swiss listed low cost provider of structured financial products. The strategy has been to provide their systems and processes to third parties for their structured products’ issuance. This strategy, however, stalled last year as their flagship partnership with DBS, the Asian private bank, broke down. This significantly delays the strategy and growth, which has led to a de-rating of the stock. We are currently reviewing the position.
The other significant negative contributors were the Irish bank Permanent TSB, which fell 41.4%, and Swiss private bank EFG International, which fell 53.5%. While we are aware that this is a contrarian stance, we believe that banks can be good businesses if they are well capitalised, focused
Rational’s equipment is widely used in the global catering trade.

20 | F&C Global Smaller Companies PLC
the Swedish window supplier. As Europe’s largest producer of wooden windows with dominant market shares in their Nordic home markets we expect them to benefit from lower costs of procurement and manufacturing to drive revenues and profits.
In terms of outlook, there are reasons to be more positive as the air of crisis that has overhung the euro to at least some degree in recent years has for now passed. Some of the hardest hit economies in the recessionary years such as Ireland and Spain are now recovering strongly, although as discussed in the introduction to this section, in the stock market, earnings recovery is still elusive. We will remain focused on executing our philosophy and process with the belief that this will drive us to invest in stocks that will deliver good returns over the long term.
Japanese Review
Portfolio Performance +3.1%
MSCI Japan Small Cap Index +12.1%
Topix Index -0.3%
While our Japanese portfolio reported a small rise over the year, this was a poor showing compared to the MSCI Japan Small Cap Index. Performance was flattered by the impact of a 17.3% rise in the yen versus sterling over the year, with the market well down in local currency terms.
This was a disappointing year also for the Japanese economy, which has broadly been treading water. While not helped by the slowdown in China ( Japan’s second biggest export market after the US ), the fact that things proved so lacklustre is perhaps surprising given the boost that low commodity prices should have given the economy. In addition, the Bank of Japan has been printing money and using this to buy a huge amount of government bonds in an attempt to lift the economy out of its torpor and get to the targeted 2% rate of inflation. More recently the Bank has imposed a negative interest rate on some of the commercial bank sector’s deposits. This policy has not been well received by the population (many of whom tend to hold cash deposits themselves) notwithstanding the fact that retail deposits are not subject to the negative rate.
With elections coming up again soon, it is anticipated that there could be further policy initiatives from Prime Minister Abe and also from the Bank of Japan. A further fiscal stimulus programme has been agreed by parliament, and the government has delayed a proposed increase in sales tax. It
the fact that costs were falling as a result of lower oil prices. Gerresheimer, the pharmaceutical packaging company, also had a strong year, rising 28.1%. This was particularly satisfying as the company had been through a difficult period. We increased our position and were well rewarded as the company demonstrated good operating performance and also made a well-conceived acquisition in the US.
Another strong contributor came from what we would regard as one of the highest quality companies in Europe; Rational, the German producer of combi-steamer ovens. This is a family controlled business whose brand name is synonymous with the product they produce; they dominate the market. The product itself is increasing its penetration within commercial kitchens as it improves the quality of food produced while reducing costs. This yields consistent high growth at very strong margin levels. The company accomplished another year of excellent delivery but the share was also re-rated as the market flocked to quality assets. Another high quality business is Christian Hansen, whose share price rose by 25.4%. The company makes cultures and enzymes which are used predominantly in the dairy industry. They operate in a global oligopoly with high barriers to entry and deliver consistent high growth. Last year’s results were excellent, though not out of line with historic precedence, yet the market was prepared to pay an increasingly high price for these characteristics.
We made a number of changes to the portfolio through the year. This included paring back our financials exposure by selling EFG International, Delta Lloyd and Banca Generali. We also sold three of our holdings which sell into the auto sector, Elringklinger, SHW and Kendrion. While these companies delivered reasonable levels of sales growth, these did not translate smoothly into profit growth, leading us to question their business models and our investment rationale.
The additions to the portfolio mainly took place in the early part of 2016 as we took advantage of the market pull-back at this time to add some more higher quality companies. Holdings in Marr, an Italian food distributor, IMCD, the Dutch specialty chemical distributor and Industria Macchine Automatiche, an Italian packaging machinery manufacturer, were acquired. We had looked at all these companies during 2015 but had not deemed the valuations attractive enough. All these companies are dominant operators in their markets which we would expect them to outgrow, and they all benefit from having significant founder or family shareholdings. Another new holding purchased during the year was Inwido,

Report and Accounts 2016 | 21
STRATEGIC REPORT
OV
ER
VIE
WS
TR
AT
EG
IC R
EP
OR
TG
OV
ER
NA
NC
E R
EP
OR
TA
UD
ITO
RS
’ RE
PO
RT
FINA
NC
IAL R
EP
OR
TN
OT
ICE
OF M
EE
TIN
GO
TH
ER
INFO
RM
AT
ION
more flexible place for businesses to operate in, with progress on meaningful labour market reform still awaited.
Rest of World Review
Portfolio Performance -9.3%
MSCI All Countries Asia Pacific ex Japan Small Cap Index -9.9%
MSCI EM Latin American Small Cap Index -7.1%
The numbers above show that it was another mediocre year on the Asian and Latin American small cap scene, and our portfolio was down in common with the indices.
Investors have for some time been cautious about the prospects for these markets at a time when US interest rates were likely to be moving up. It has been felt that capital which had exited the US in search for better yield in higher yielding markets, could start to head in the other direction if US rates started to look more attractive. This threat has over-hung these markets for quite a long time, but in the early part of the period, the fact is that these markets were performing poorly despite the fact that US rates had been held static for longer than expected.
It is always hard to tell quite what is going on within the huge country and economy of China, and as stated earlier, published economic data here is not always to be trusted. It is clear however that China’s labour costs have been rising sharply in recent times in comparison to some of the regional peers, not least because many Asian and indeed Latin American countries currencies have fallen heavily versus the US Dollar. The Chinese currency is effectively pegged to the US Dollar to within a small band around a rate set by the Chinese authorities. In August, reflecting general weakening growth in the Chinese economy, the authorities moved this rate down by around 2%. This led to a period of high volatility in regional currency and equity markets, but fortunately investors soon calmed down, and in 2016 to date a number of emerging market currencies have actually appreciated against the US Dollar.
China’s equity markets remain immature and were hugely volatile over the past year. The authorities eventually moved to crack down to an extent upon speculative private investor share trading, but not before many thousands of individuals will have lost considerable amounts of money in their first foray into equity investing. While other Asian markets on the whole were less volatile, gains were hard to come by across the region. Some of the better performing markets have been those where economic policies have been more sensibly
is also possible that the Bank of Japan may widen the range of assets that it buys in the quantitative easing program to potentially incorporate equities, not least because it is rapidly running out of government bonds to buy. In common with the US and UK, one bright spot on the macro-side is the low level of unemployment, which stands at around 3%.
At the corporate level, things have been more encouraging, with Japanese companies as a whole outperforming global stocks in terms of earnings growth, continuing the trend from the previous twelve months. Return on equity performance is also improving, with more companies paying greater attention to shareholder’s best interests. Japanese companies are paying out more in the way of dividends or buying in their own shares rather than sitting on surplus capital or persisting with investments in areas that aren’t generating adequate returns.
Performance on a sector basis in Japan has to an extent mirrored some of the other developed markets, with defensive and perceived high quality stocks doing well, while companies linked to cyclical markets or resources, have struggled. With the yen’s rise in recent months, export sensitive sectors such as the automotive suppliers have suffered, while utility stocks and companies exposed to a boom in tourist numbers from China, have been doing well.
We derive our exposure to Japanese small caps through third party managed funds. As was explained at the interim stage, we switched from an M&G badged fund to an Eastspring one in the first half. The Eastspring fund is managed by the same team who used to run the M&G fund, using a value orientated approach. With highly rated defensive stocks being in vogue during the year, this fund struggled in 2015/16. Likewise Aberdeen’s Japanese small cap fund that we have also held for a long time, concurrently lagged. Stock selection within the fund in the consumer and capital goods areas was weak, while an underweight stance to financials also proved detrimental to performance. We still feel these two funds will deliver outperformance over the medium term, managed as they are by experienced teams, but are monitoring alternative options in the same way that we do for the other segments of the portfolio.
During the year we took some money out of both our Japanese funds as part of a minor asset allocation switch out of the market. While many companies in the country are moving in the right direction, there must be some risk that we get the reverse impact on the yen at some stage, and if we don’t there will be pressure on some companies’ profit margins. The government still needs to make the country a
22 | F&C Global Smaller Companies PLC
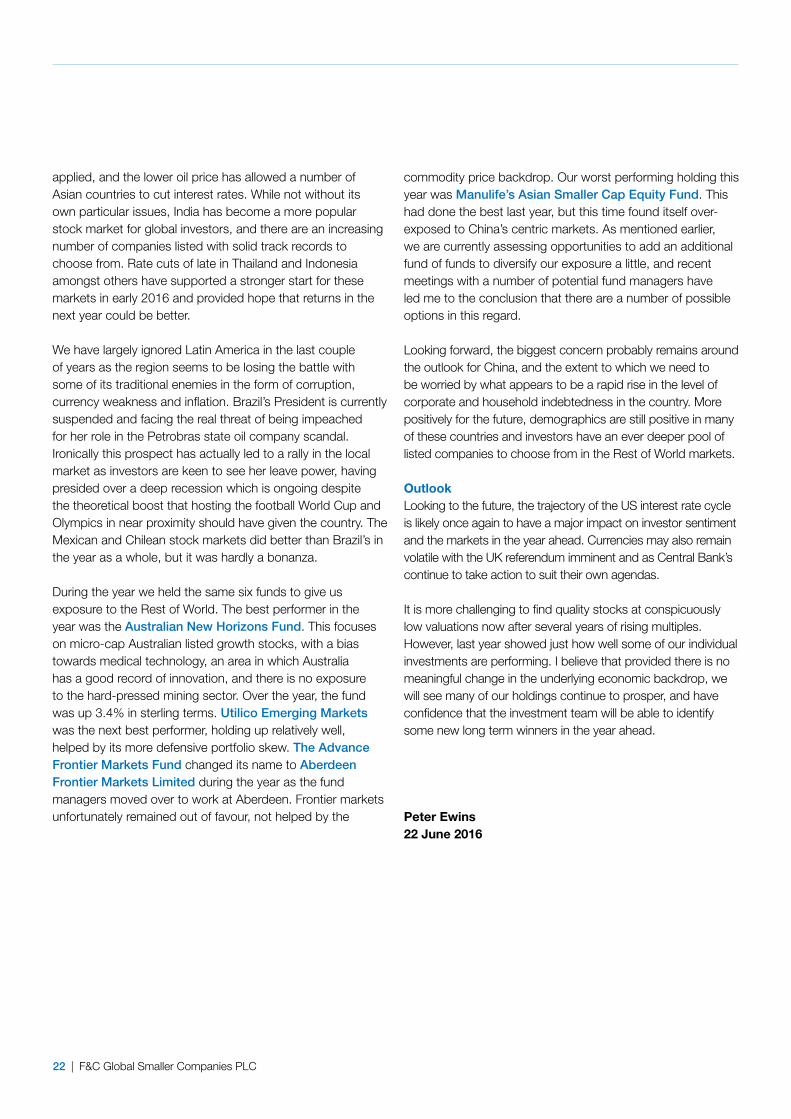
commodity price backdrop. Our worst performing holding this year was Manulife’s Asian Smaller Cap Equity Fund. This had done the best last year, but this time found itself over-exposed to China’s centric markets. As mentioned earlier, we are currently assessing opportunities to add an additional fund of funds to diversify our exposure a little, and recent meetings with a number of potential fund managers have led me to the conclusion that there are a number of possible options in this regard.
Looking forward, the biggest concern probably remains around the outlook for China, and the extent to which we need to be worried by what appears to be a rapid rise in the level of corporate and household indebtedness in the country. More positively for the future, demographics are still positive in many of these countries and investors have an ever deeper pool of listed companies to choose from in the Rest of World markets.
OutlookLooking to the future, the trajectory of the US interest rate cycle is likely once again to have a major impact on investor sentiment and the markets in the year ahead. Currencies may also remain volatile with the UK referendum imminent and as Central Bank’s continue to take action to suit their own agendas.
It is more challenging to find quality stocks at conspicuously low valuations now after several years of rising multiples. However, last year showed just how well some of our individual investments are performing. I believe that provided there is no meaningful change in the underlying economic backdrop, we will see many of our holdings continue to prosper, and have confidence that the investment team will be able to identify some new long term winners in the year ahead.
Peter Ewins 22 June 2016
applied, and the lower oil price has allowed a number of Asian countries to cut interest rates. While not without its own particular issues, India has become a more popular stock market for global investors, and there are an increasing number of companies listed with solid track records to choose from. Rate cuts of late in Thailand and Indonesia amongst others have supported a stronger start for these markets in early 2016 and provided hope that returns in the next year could be better.
We have largely ignored Latin America in the last couple of years as the region seems to be losing the battle with some of its traditional enemies in the form of corruption, currency weakness and inflation. Brazil’s President is currently suspended and facing the real threat of being impeached for her role in the Petrobras state oil company scandal. Ironically this prospect has actually led to a rally in the local market as investors are keen to see her leave power, having presided over a deep recession which is ongoing despite the theoretical boost that hosting the football World Cup and Olympics in near proximity should have given the country. The Mexican and Chilean stock markets did better than Brazil’s in the year as a whole, but it was hardly a bonanza.
During the year we held the same six funds to give us exposure to the Rest of World. The best performer in the year was the Australian New Horizons Fund. This focuses on micro-cap Australian listed growth stocks, with a bias towards medical technology, an area in which Australia has a good record of innovation, and there is no exposure to the hard-pressed mining sector. Over the year, the fund was up 3.4% in sterling terms. Utilico Emerging Markets was the next best performer, holding up relatively well, helped by its more defensive portfolio skew. The Advance Frontier Markets Fund changed its name to Aberdeen Frontier Markets Limited during the year as the fund managers moved over to work at Aberdeen. Frontier markets unfortunately remained out of favour, not helped by the

Report and Accounts 2016 | 23
BUSINESS MODEL AND STRATEGY
‘We have confidence in the investment team’s ability to identify some new long-term winners in the year ahead’
OV
ER
VIE
WS
TR
AT
EG
IC R
EP
OR
TG
OV
ER
NA
NC
E R
EP
OR
TA
UD
ITO
RS
’ RE
PO
RT
FINA
NC
IAL R
EP
OR
TN
OT
ICE
OF M
EE
TIN
GO
TH
ER
INFO
RM
AT
ION

24 | F&C Global Smaller Companies PLC
“Our private equity portfolio materially outperformed listed stock markets again in 2014.”
Thirty largest holdings
30 April 2016
30 April 2015
% of total investments
Value £m
1 – Eastspring Investments Japan Smaller Companies Fund Japan 3.8 21.9Fund providing exposure to Japanese smaller companies.
2 1 Aberdeen Global-Japanese Smaller Companies Fund Japan 3.7 21.8Fund providing exposure to Japanese smaller companies.
3 3 The Scottish Oriental Smaller Companies Trust Rest of World 2.9 16.6Investment company providing exposure to Asian smaller companies.
4 4 Manulife Global Fund – Asian Smaller Cap Equity Fund Rest of World 2.2 12.6Investment company providing exposure to Asian smaller companies.
5 5 Aberdeen Global-Asian Smaller Companies Fund Rest of World 1.8 10.7Investment company providing exposure to Asian smaller companies.
6 6 Utilico Emerging Markets Rest of World 1.6 9.3Investment company focusing on utility and infrastructure companies in emerging markets.
7 11 Alleghany United States 1.1 6.6Specialist commercial insurer.
8 19 LKQ Corp United States 1.1 6.4A distributor of alternative car parts.
9 53 Sterling Bancorp United States 1.1 6.4New York based commercial lender.
10 14 Cardinal Financial United States 1.1 6.1Bank based in North Virginia that focuses on commercial lending.
11 - Martin Marietta Materials United States 1.0 6.0Aggregates and cement producer that served the construction industry.
12 8 CLS Holdings United Kingdom 1.0 5.6Property investment company mainly operating in the UK, France, Germany and Sweden.
13 48 State Bank Financial United States 0.9 5.5Atlanta based bank.
14 10 WEX United States 0.9 5.4An operator of a fuel card payment network.
15 – Sabre United States 0.9 5.1Travel network and technology company serving the airline and hospitality sectors.
16 42 Hill & Smith Holdings United States 0.9 5.1Provider of infrastructure products and galvanising services.
17 18 Roper Technologies United States 0.9 5.1An operator of niche industrial business.
18 – Franklin Financial Network, Inc United States 0.9 5.1Tennessee based bank that makes real estate based loans.
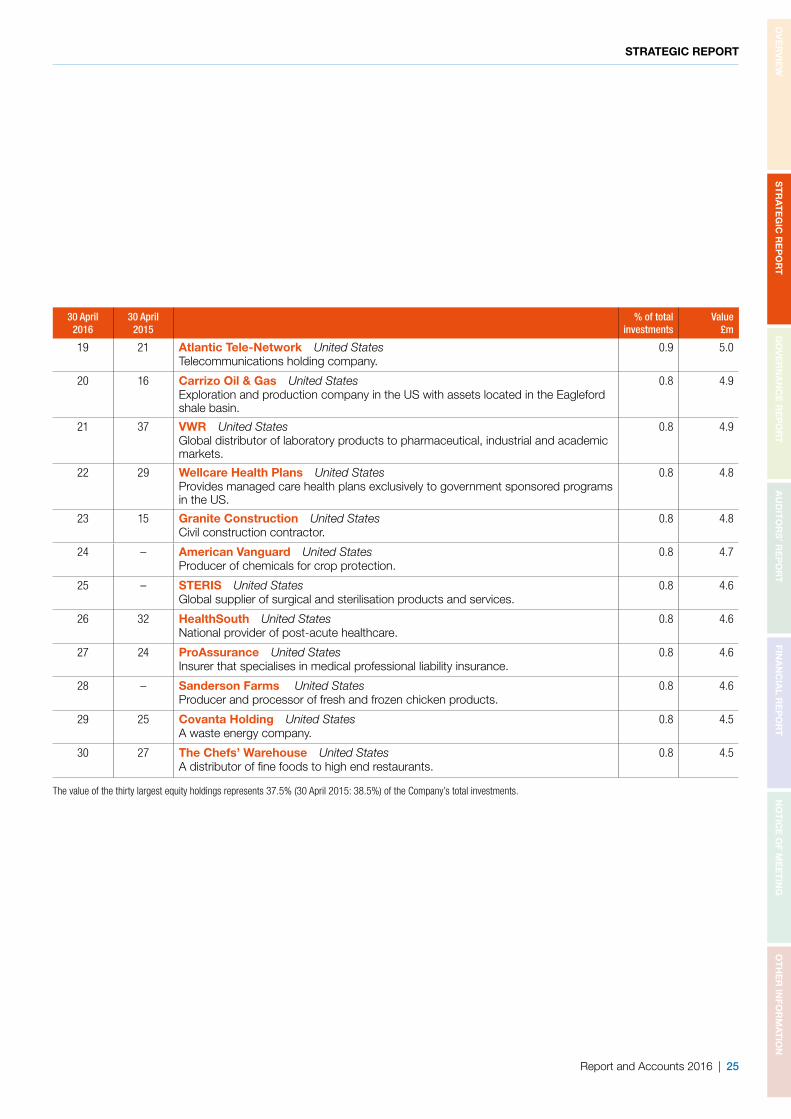
Report and Accounts 2016 | 25
STRATEGIC REPORT
OV
ER
VIE
WS
TR
AT
EG
IC R
EP
OR
TG
OV
ER
NA
NC
E R
EP
OR
TA
UD
ITO
RS
’ RE
PO
RT
FINA
NC
IAL R
EP
OR
TN
OT
ICE
OF M
EE
TIN
GO
TH
ER
INFO
RM
AT
ION
“Our private equity portfolio materially outperformed listed stock markets again in 2014.”
30 April 2016
30 April 2015
% of total investments
Value £m
19 21 Atlantic Tele-Network United States 0.9 5.0Telecommunications holding company.
20 16 Carrizo Oil & Gas United States 0.8 4.9Exploration and production company in the US with assets located in the Eagleford shale basin.
21 37 VWR United States 0.8 4.9Global distributor of laboratory products to pharmaceutical, industrial and academic markets.
22 29 Wellcare Health Plans United States 0.8 4.8Provides managed care health plans exclusively to government sponsored programs in the US.
23 15 Granite Construction United States 0.8 4.8Civil construction contractor.
24 – American Vanguard United States 0.8 4.7Producer of chemicals for crop protection.
25 – STERIS United States 0.8 4.6Global supplier of surgical and sterilisation products and services.
26 32 HealthSouth United States 0.8 4.6National provider of post-acute healthcare.
27 24 ProAssurance United States 0.8 4.6Insurer that specialises in medical professional liability insurance.
28 – Sanderson Farms United States 0.8 4.6Producer and processor of fresh and frozen chicken products.
29 25 Covanta Holding United States 0.8 4.5A waste energy company.
30 27 The Chefs’ Warehouse United States 0.8 4.5A distributor of fine foods to high end restaurants.
The value of the thirty largest equity holdings represents 37.5% (30 April 2015: 38.5%) of the Company’s total investments.

26 | F&C Global Smaller Companies PLC
List of Investments
30 April 2016
Quoted investments HoldingValue
£’000s
CONTINENTAL EUROPE
DENMARK
Christian Hansen 46,348 1,971
Ringkjoebing Landbobank 14,379 2,063
Topdanmark 91,907 1,661
Total Denmark 5,695
FINLAND
Amer Sports 138,837 2,802
FRANCE
Plastic Omnium 105,563 2,385
GERMANY
Aareal Bank 56,802 1,379
CTS Eventim 79,058 1,885
Gerresheimer 49,224 2,494
Norma Group 45,987 1,616
Rational 5,680 1,965
SAF Holland 176,549 1,418
Symrise 22,616 1,023
Takkt 172,364 2,451
Total Germany 14,231
IRELAND
C&C Group 463,349 1,417
Glanbia 151,924 1,944
IFG Group 910,510 1,481
Irish Continental 715,007 2,879
Origin Enterprises 447,901 2,161
Permanent TSB Group 305,437 650
Total Ireland 10,532
ITALY
Azimut Holding 95,029 1,633
Cerved Information Solutions 405,907 2,229
Credito Emiliano 169,095 832
30 April 2016
Quoted investments HoldingValue
£’000s
Industria Macchine Automatiche 15,705 624
Interpump Group 180,473 1,761
Marr 77,775 1,081
Total Italy 8,160
NETHERLANDS
ASM International 61,370 1,709
IMCD Group 55,672 1,530
Total Netherlands 3,239
NORWAY
Sparebank 325,268 1,081
Storebrand 433,419 1,252
Tomra Systems 206,026 1,628
Total Norway 3,961
PORTUGAL
CTT Correios de Portugal 399,262 2,515
SPAIN
Atresmedia 183,397 1,630
Bolsas Y Mercados 80,650 1,863
Mediaset España 198,898 1,762
Viscofan 38,590 1,476
Total Spain 6,731
SWEDEN
Betsson 178,801 1,657
Indutrade 48,978 1,875
Inwido 191,867 1,649
Total Sweden 5,181
SWITZERLAND
Forbo Holdings 3,422 2,844
Leonteq 18,271 867
Total Switzerland 3,711
TOTAL CONTINENTAL EUROPE 69,143

Report and Accounts 2016 | 27
STRATEGIC REPORT
OV
ER
VIE
WS
TR
AT
EG
IC R
EP
OR
TG
OV
ER
NA
NC
E R
EP
OR
TA
UD
ITO
RS
’ RE
PO
RT
FINA
NC
IAL R
EP
OR
TN
OT
ICE
OF M
EE
TIN
GO
TH
ER
INFO
RM
AT
ION
30 April 2016
Quoted investments HoldingValue
£’000s
REST OF WORLD
Aberdeen Frontier Markets Investment Company 5,602,624 2,941
Aberdeen Global-Asian Smaller Companies Fund 389,457 10,654
Manulife Global Fund - Asian Smaller Cap Equity Fund 14,165,527 12,641
The Scottish Oriental Smaller Companies Trust 2,194,999 16,638
Utilico Emerging Markets 5,247,168 9,274
TOTAL REST OF WORLD 52,148
JAPAN
Aberdeen Global-Japanese Smaller Companies Fund
2,919,940 21,796
Eastspring Investments Japan Smaller Companies Fund
2,147,847 21,884
TOTAL JAPAN 43,680
UNITED KINGDOM
4Imprint Group 147,874 1,947
Acal 460,372 1,197
Accesso Technology Group 99,038 1,080
AFH Financial Group 569,226 911
Alternative Networks 447,402 1,523
Anpario 458,699 1,170
Arrow Global Group 804,626 2,068
Ascential 859,808 1,943
Blancco Technology Group 844,413 1,925
Bodycote 491,277 2,928
Brooks Macdonald Group 103,177 1,795
Cairn Energy 770,454 1,725
Clinigen Group 404,406 2,168
Clipper Logistics 853,292 2,219
CLS Holdings 351,115 5,551
Computacenter 242,166 2,022
Craneware 327,733 2,540
Dechra Pharmaceuticals 261,133 2,886
E2V Technologies 1,066,593 2,256
30 April 2016
Quoted investments HoldingValue
£’000s
Ebiquity 1,121,601 1,402
Eco Animal Health Group 299,060 1,107
Elementis 451,643 975
Entertainment One 802,757 1,482
Equiniti Group 1,210,844 2,052
Faroe Petroleum 2,636,432 2,083
Fevertree Drinks 361,542 2,205
Focusrite 477,047 739
Fuller Smith & Turner 182,420 1,897
Galliford Try 120,087 1,532
Genus 168,797 2,532
Go Ahead Group 80,778 2,072
Halfords Group 339,822 1,434
Hill & Smith Holdings 550,029 5,129
Huntsworth 1,547,299 665
Interserve 367,852 1,572
James Fisher & Sons 284,712 4,029
JD Sports Fashion 159,246 1,987
John Laing Group 1,298,081 2,758
Kainos Group 955,594 1,787
Keller Group 199,769 1,765
Laird 873,901 3,045
Lavendon Group 1,093,430 1,520
LXB Retail Properties 2,400,290 2,424
Mcbride 1,354,677 2,107
Mears Group 578,483 2,305
Morgan Sindall Group 233,125 1,855
Nahl Group 407,904 987
Next Fifteen Communications 589,290 1,685
Novae Group 267,378 2,143
On The Beach Group 333,259 901
Orchard Funding Group 1,460,030 1,562
Photo Me International 840,434 1,406
Plastics Capital 1,042,944 1,064
Purecircle 414,111 1,574
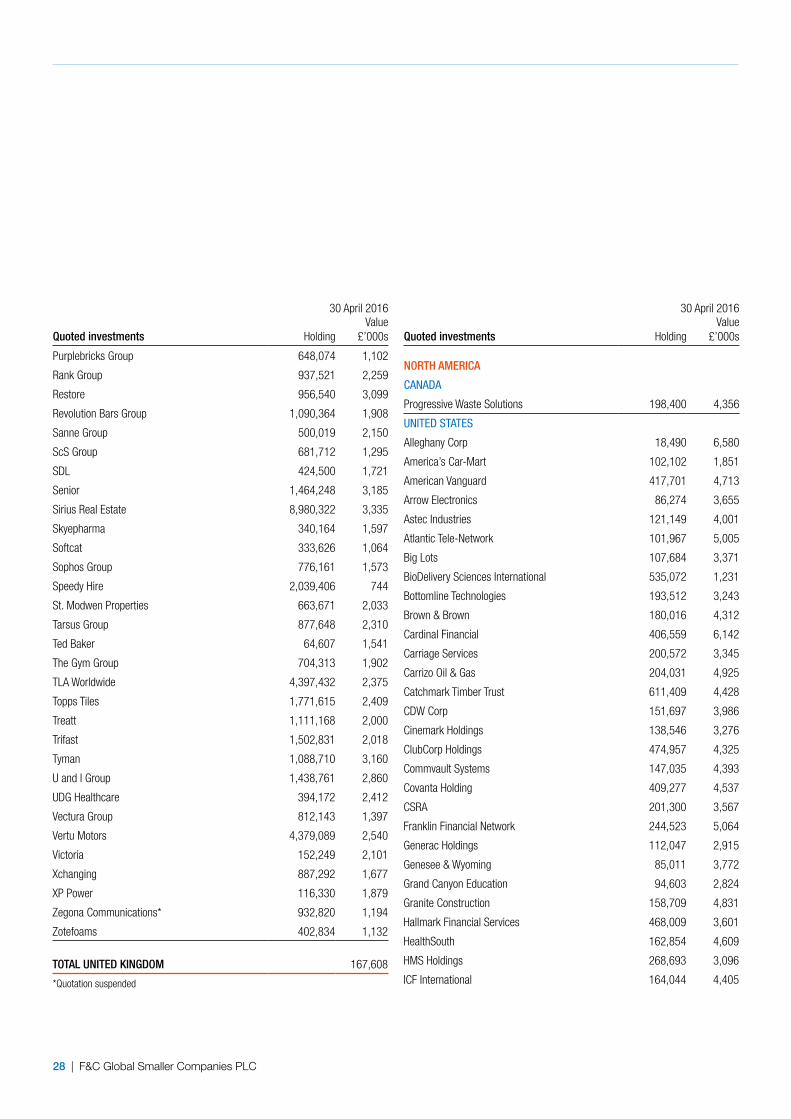
28 | F&C Global Smaller Companies PLC
30 April 2016
Quoted investments HoldingValue
£’000s
NORTH AMERICA
CANADA
Progressive Waste Solutions 198,400 4,356
UNITED STATES
Alleghany Corp 18,490 6,580
America’s Car-Mart 102,102 1,851
American Vanguard 417,701 4,713
Arrow Electronics 86,274 3,655
Astec Industries 121,149 4,001
Atlantic Tele-Network 101,967 5,005
Big Lots 107,684 3,371
BioDelivery Sciences International 535,072 1,231
Bottomline Technologies 193,512 3,243
Brown & Brown 180,016 4,312
Cardinal Financial 406,559 6,142
Carriage Services 200,572 3,345
Carrizo Oil & Gas 204,031 4,925
Catchmark Timber Trust 611,409 4,428
CDW Corp 151,697 3,986
Cinemark Holdings 138,546 3,276
ClubCorp Holdings 474,957 4,325
Commvault Systems 147,035 4,393
Covanta Holding 409,277 4,537
CSRA 201,300 3,567
Franklin Financial Network 244,523 5,064
Generac Holdings 112,047 2,915
Genesee & Wyoming 85,011 3,772
Grand Canyon Education 94,603 2,824
Granite Construction 158,709 4,831
Hallmark Financial Services 468,009 3,601
HealthSouth 162,854 4,609
HMS Holdings 268,693 3,096
ICF International 164,044 4,405
30 April 2016
Quoted investments HoldingValue
£’000s
Purplebricks Group 648,074 1,102
Rank Group 937,521 2,259
Restore 956,540 3,099
Revolution Bars Group 1,090,364 1,908
Sanne Group 500,019 2,150
ScS Group 681,712 1,295
SDL 424,500 1,721
Senior 1,464,248 3,185
Sirius Real Estate 8,980,322 3,335
Skyepharma 340,164 1,597
Softcat 333,626 1,064
Sophos Group 776,161 1,573
Speedy Hire 2,039,406 744
St. Modwen Properties 663,671 2,033
Tarsus Group 877,648 2,310
Ted Baker 64,607 1,541
The Gym Group 704,313 1,902
TLA Worldwide 4,397,432 2,375
Topps Tiles 1,771,615 2,409
Treatt 1,111,168 2,000
Trifast 1,502,831 2,018
Tyman 1,088,710 3,160
U and I Group 1,438,761 2,860
UDG Healthcare 394,172 2,412
Vectura Group 812,143 1,397
Vertu Motors 4,379,089 2,540
Victoria 152,249 2,101
Xchanging 887,292 1,677
XP Power 116,330 1,879
Zegona Communications* 932,820 1,194
Zotefoams 402,834 1,132
TOTAL UNITED KINGDOM 167,608
*Quotation suspended
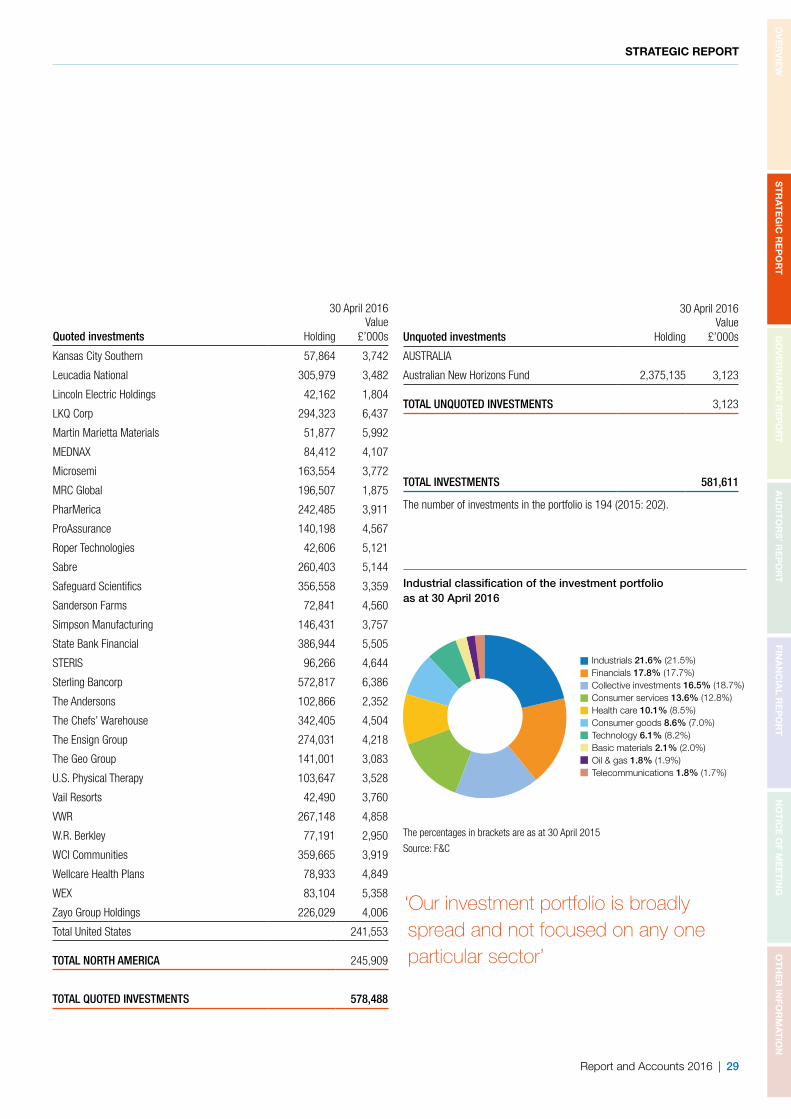
Report and Accounts 2016 | 29
STRATEGIC REPORT
OV
ER
VIE
WS
TR
AT
EG
IC R
EP
OR
TG
OV
ER
NA
NC
E R
EP
OR
TA
UD
ITO
RS
’ RE
PO
RT
FINA
NC
IAL R
EP
OR
TN
OT
ICE
OF M
EE
TIN
GO
TH
ER
INFO
RM
AT
ION
30 April 2016
Quoted investments HoldingValue
£’000s
Kansas City Southern 57,864 3,742
Leucadia National 305,979 3,482
Lincoln Electric Holdings 42,162 1,804
LKQ Corp 294,323 6,437
Martin Marietta Materials 51,877 5,992
MEDNAX 84,412 4,107
Microsemi 163,554 3,772
MRC Global 196,507 1,875
PharMerica 242,485 3,911
ProAssurance 140,198 4,567
Roper Technologies 42,606 5,121
Sabre 260,403 5,144
Safeguard Scientifics 356,558 3,359
Sanderson Farms 72,841 4,560
Simpson Manufacturing 146,431 3,757
State Bank Financial 386,944 5,505
STERIS 96,266 4,644
Sterling Bancorp 572,817 6,386
The Andersons 102,866 2,352
The Chefs’ Warehouse 342,405 4,504
The Ensign Group 274,031 4,218
The Geo Group 141,001 3,083
U.S. Physical Therapy 103,647 3,528
Vail Resorts 42,490 3,760
VWR 267,148 4,858
W.R. Berkley 77,191 2,950
WCI Communities 359,665 3,919
Wellcare Health Plans 78,933 4,849
WEX 83,104 5,358
Zayo Group Holdings 226,029 4,006
Total United States 241,553
TOTAL NORTH AMERICA 245,909
TOTAL QUOTED INVESTMENTS 578,488
Industrial classification of the investment portfolio as at 30 April 2016
Industrials 21.6% (21.5%)Financials 17.8% (17.7%)Collective investments 16.5% (18.7%)Consumer services 13.6% (12.8%)Health care 10.1% (8.5%)Consumer goods 8.6% (7.0%)Technology 6.1% (8.2%)Basic materials 2.1% (2.0%)Oil & gas 1.8% (1.9%)Telecommunications 1.8% (1.7%)
Source: F&C
The percentages in brackets are as at 30 April 2015
30 April 2016
Unquoted investments HoldingValue
£’000s
AUSTRALIA
Australian New Horizons Fund 2,375,135 3,123
TOTAL UNQUOTED INVESTMENTS 3,123
TOTAL INVESTMENTS 581,611
The number of investments in the portfolio is 194 (2015: 202).
‘Our investment portfolio is broadly spread and not focused on any one particular sector’

30 | F&C Global Smaller Companies PLC
Principal Risks Mitigation Actions taken on Principal Risks in the year
Security and operational issuesLoss of assets or other damage to the interests of investors and the Company could arise due to poor systems and physical access security, operational errors, fraud or control failures at service providers or loss of data through increasing levels of cyber-threats or business continuity failure could damage reputation or investors’ interests or result in loss.
The Board receives regular control reports from the Manager covering risk and compliance including oversight of third party service providers. The Board has access to F&C’s Head of Business Risk and requires any significant issues directly relevant to the Company to be reported immediately. The Depositary is specifically liable for loss of any of the Company’s securities and cash held in custody.
The Manager continues to strengthen its Risk, Compliance and Internal Control functions as part of the integration of its operations with BMO. IT security includes continuous updates of firewalls and annual third party penetration testing. Supervision of third party service providers has been maintained by F&C and includes assurances regarding IT security and cyber-threat. The Depositary oversees custody of investments and cash and reports to the Company in accordance with the AIFMD.
Investment PerformanceAn inappropriate investment strategy or policy, or ineffective implementation, could result in poor returns for shareholders.
The Board regularly reviews overall strategy and in considering investment policy reviews regular reports from the Manager: on stock selection; asset allocation; gearing; currency exposure; investment performance and the cost of running the Company. The Board meets regularly with the senior management of the Manager, which structures its recruitment and remuneration packages in order to retain and enhance the quality of the management team. The management contract can be moved at short notice.
The Board, through its review process, did not identify any specific new actions required to mitigate performance risks. Loan interest costs were much lower following the repayment of a long-term debenture at the end of 2014. The Company’s issue of CULS provides a long-term modest “borrowing” facility which has the potential to convert into ordinary shares and hence not to require repayment. The Lead Manager’s Review on pages 13 to 22 explains the changes in the year in the portfolio.
Discount/premium to NAVA significant share price discount or premium to the Company’s NAV per share, or related volatility, could lead to high levels of uncertainty or speculation and the potential to reduce investor confidence.
The Board has established share buyback and share issue policies, together with a dividend policy, in order to moderate the level of share price premium or discount to the NAV per share and related volatility and seeks shareholder approval each year for the necessary powers to implement these policies.
The share price traded at a small premium to NAV for the majority of the year and shares continued to be issued to satisfy demand and help moderate the level of premium to NAV.
The Board has proposed an increase in full year dividends.
Increased in the year under review
Unchanged throughout the year under review.
Unchanged throughout the year under review.
Principal Risks and Future Prospects
The principal risks and their mitigations are set out in the table below and the processes for monitoring them are set out on pages 50 and 51. Note 26 on the accounts reports on the Financial Risk Management of the Company. The risks that affect the Company’s ongoing operations may vary in significance from time to time.
The principal risks identified as most relevant to the assessment of the Company’s future prospects and viability were those relating to inappropriate business strategy, potential investment portfolio under-performance and its effect on share price discount/premium and dividends, as well as threats to security over the Company’s assets.
During the year the Board carried out a robust assessment of the principal risks and uncertainties that could threaten the Company’s objective, future performance, liquidity and solvency. Its future prospects and viability were also considered as an integral part of this assessment in accordance with new requirements under the UK Code.
Report and Accounts 2016 | 31
STRATEGIC REPORT
OV
ER
VIE
WS
TR
AT
EG
IC R
EP
OR
TG
OV
ER
NA
NC
E R
EP
OR
TA
UD
ITO
RS
’ RE
PO
RT
FINA
NC
IAL R
EP
OR
TN
OT
ICE
OF M
EE
TIN
GO
TH
ER
INFO
RM
AT
ION
By order of the Board Anthony Townsend Chairman 22 June 2016
When considering the Company’s future prospects and risks, the Board assessed and evaluated the following areas through a series of stress tests: • potential illiquidity of the Company’s portfolio; and• the effects of any substantial future falls in investment
values and income receipts; on the ability to repay the CULS; on potential breach of CULS covenants; and on the maintenance of dividend payments and retention of investors.
The Board’s conclusions are set out under the Five Year Horizon opposite.
Based on its assessment and evaluation of the Company’s future prospects, the Board has a reasonable expectation that the Company will be able to continue in operation and meet its liabilities as they fall due over the coming five years. This period is consistent with advice, provided by many investment advisers, that investors should invest in equities for a minimum of five years. The Company’s business model, strategy and the embedded characteristics listed below have helped define and maintain the stability of the Company over many decades. The Board expects this to continue over the next five years and many more to come.
• The Company has a long-term investment strategy under which it invests mainly in readily realisable, publicly listed securities and which restricts the level of borrowings.
• The Company’s business model and strategy are not time limited.
• The Company is inherently structured for long-term outperformance, rather than short-term opportunities, with five years as a normal investment horizon for investors and a sensible time-frame for measuring and assessing long-term investment performance.
• The Company is able to take advantage of its closed-end investment trust structure.
• The Company has the ability to use short-term borrowings by way of loans and overdrafts.
• Regular and robust review of revenue and expenditure forecasts is undertaken throughout the year against a backdrop of large revenue and capital reserves.
• The Company retains title to all assets held by the Custodian which are subject to further safeguards imposed on the Depositary.
Five Year Horizon
Principal Risks Mitigation Actions taken on Principal Risks in the year
Security and operational issuesLoss of assets or other damage to the interests of investors and the Company could arise due to poor systems and physical access security, operational errors, fraud or control failures at service providers or loss of data through increasing levels of cyber-threats or business continuity failure could damage reputation or investors’ interests or result in loss.
The Board receives regular control reports from the Manager covering risk and compliance including oversight of third party service providers. The Board has access to F&C’s Head of Business Risk and requires any significant issues directly relevant to the Company to be reported immediately. The Depositary is specifically liable for loss of any of the Company’s securities and cash held in custody.
The Manager continues to strengthen its Risk, Compliance and Internal Control functions as part of the integration of its operations with BMO. IT security includes continuous updates of firewalls and annual third party penetration testing. Supervision of third party service providers has been maintained by F&C and includes assurances regarding IT security and cyber-threat. The Depositary oversees custody of investments and cash and reports to the Company in accordance with the AIFMD.
Investment PerformanceAn inappropriate investment strategy or policy, or ineffective implementation, could result in poor returns for shareholders.
The Board regularly reviews overall strategy and in considering investment policy reviews regular reports from the Manager: on stock selection; asset allocation; gearing; currency exposure; investment performance and the cost of running the Company. The Board meets regularly with the senior management of the Manager, which structures its recruitment and remuneration packages in order to retain and enhance the quality of the management team. The management contract can be moved at short notice.
The Board, through its review process, did not identify any specific new actions required to mitigate performance risks. Loan interest costs were much lower following the repayment of a long-term debenture at the end of 2014. The Company’s issue of CULS provides a long-term modest “borrowing” facility which has the potential to convert into ordinary shares and hence not to require repayment. The Lead Manager’s Review on pages 13 to 22 explains the changes in the year in the portfolio.
Discount/premium to NAVA significant share price discount or premium to the Company’s NAV per share, or related volatility, could lead to high levels of uncertainty or speculation and the potential to reduce investor confidence.
The Board has established share buyback and share issue policies, together with a dividend policy, in order to moderate the level of share price premium or discount to the NAV per share and related volatility and seeks shareholder approval each year for the necessary powers to implement these policies.
The share price traded at a small premium to NAV for the majority of the year and shares continued to be issued to satisfy demand and help moderate the level of premium to NAV.
The Board has proposed an increase in full year dividends.

32 | F&C Global Smaller Companies PLC
‘The Directors consider that, following advice from the Audit & Management Engagement Committee, the Report and Accounts, taken as a whole is fair, balanced and understandable and provides information necessary for shareholders to assess the Company’s position and performance, business model and strategy’

Report and Accounts 2016 | 33
STRATEGIC REPORT
OV
ER
VIE
WS
TR
AT
EG
IC R
EP
OR
TG
OV
ER
NA
NC
E R
EP
OR
TA
UD
ITO
RS
’ RE
PO
RT
FINA
NC
IAL R
EP
OR
TN
OT
ICE
OF M
EE
TIN
GO
TH
ER
INFO
RM
AT
ION

34 | F&C Global Smaller Companies PLC
All Directors are members of the Audit and Management Engagement Committee and the Nomination Committee.
Anthony Townsend, Chairman, was appointed to the Board on 24 September 2004 and is chairman of the Nomination Committee. He has spent over 45 years working in the City of London and was chairman of the Association of Investment Companies from 2001 to 2003. He is chairman of Baronsmead Second Venture Trust PLC, British & American Investment Trust PLC, Finsbury Growth & Income Trust PLC, Gresham House PLC and Miton Global Opportunities PLC. Shared directorships with other Directors: None
Andrew Adcock was appointed to the Board on 31 July 2007. He was, until mid 2009, vice chairman of Citigroup Corporate Finance and managing partner of Brompton Asset Management Limited until July 2011. He has more than 30 years’ experience in the City of London and is chairman of Majedie Investments PLC, VPC Specialty Lending Investments PLC, JPMorgan European Investment Trust PLC and Panmure Gordon & Co Ltd. He is also a non-executive director of Kleinwort Benson Bank Ltd and Foxtons Group PLC. Shared directorships with other Directors: JPMorgan European Investment Trust plc with Jo Dixon
Anja Balfour was appointed to the Board on 1 June 2015. She is a non-executive director of Schroder Japan Growth Fund PLC and Martin Currie Asia Unconstrained Trust and a trustee of Venture Scotland, a charity specialising in personal development for young people. Previously she spent over 20 years as a fund manager, running Japanese and International Equity portfolios for Stewart Ivory, Baillie Gifford and latterly, Axa Framlington. Shared directorships with other Directors: None
Directors
Jo Dixon, Chairman of the Audit and Management Engagement Committee, was appointed to the Board on 11 February 2015. She is a non-executive director of Strategic Equity Capital PLC, JPMorgan European Investment Trust PLC, Standard Life Equity Income Trust PLC and Worldwide Healthcare Trust PLC. Shared directorships with other Directors: JPMorgan European Investment Trust plc with Andrew Adcock
David Stileman was appointed to the Board on 1 June 2015. He is chairman of The Garden Bridge Trading Company Ltd. He is also a member of the Advisory Boards of Corsair Capital LLP, FTV Capital LLP and BizEquity LLC. Having been with Standard Chartered Bank since 1984, he retired as Chairman Americas in late 2012. He is now a consultant to Standard Chartered Bank. Shared directorships with other Directors: None
Jane Tozer, Senior Independent Director, was appointed to the Board on 13 June 2005. She is a non-executive director and senior independent director of StatPro PLC and a non-executive director of JPMorgan Income & Growth Investment Trust PLC, Asthma UK, Nominet UK and Citizens Advice in Three Rivers Ltd. She is also a member of the Warwick Business School Advisory Board. She previously worked at IBM and then as CEO of a software development company. Shared directorships with other Directors: None

Report and Accounts 2016 | 35
GOVERNANCE REPORT
OV
ER
VIE
WS
TR
AT
EG
IC R
EP
OR
TG
OV
ER
NA
NC
E R
EP
OR
TA
UD
ITO
RS
’ RE
PO
RT
FINA
NC
IAL R
EP
OR
TN
OT
ICE
OF M
EE
TIN
GO
TH
ER
INFO
RM
AT
ION
Directors’ Report
Statement regarding Report and AccountsThe Directors consider that, following advice from the Audit and Management Engagement Committee, the Report and Accounts, taken as a whole, is fair, balanced and understandable and provides the information necessary for shareholders to assess the Company’s position and performance, business model and strategy. The Audit and Management Engagement Committee had reviewed the draft Report and Accounts for the purposes of this assessment. The outlook for the Company can be found on pages 9, 22 and 30. Note 26 on the accounts sets out the financial risk profile of the Company and indicates the effect on the assets and the liabilities of fluctuations in the value of securities, and exchange and interest rates. There are no instances where the Company is required to make disclosures in respect of Listing Rule 9.8.4R, other than in respect of Listing Rule 9.8.4(7)R concerning the allotment of shares and this disclosure is on page 37.
Results and dividendsThe results for the year are set out in the attached accounts. The recommended final dividend of 7.80 pence per share is payable on 12 August 2016 to shareholders on the register of members on 15 July 2016 subject to approval at the Annual General Meeting (Resolution 4). This, together with the interim dividend of 2.90 pence per share, makes a total dividend of 10.70 pence per share and represents an increase of 10.9% over the comparable 9.65 pence per share paid in respect of the previous year.
Company statusThe Company is a public limited company and an investment company as defined by Section 833 of the Companies Act 2006. The Company is registered in England and Wales with company registration number 28264 and is subject to the UK Listing Authority’s Listing Rules, UK and European legislation and regulations including company law, financial reporting standards, taxation law and its own articles of association.
Investment trust taxation statusThe Company is liable to UK corporation tax on its net revenue profits but is exempt from corporation taxation on capital gains, provided it complies at all times with section 1158 of the Corporation Tax Act 2010. The Company has been approved by HM Revenue and Customs as an investment trust, subject to it continuing to meet the relevant eligibility conditions and ongoing requirements.
Accounting and going concernThe Financial Statements, starting on page 63, comply with current UK Financial Reporting Standards, supplemented by the SORP. The significant accounting policies of the Company are set out in note 2 on the accounts. The unqualified Independent Auditors’ Report on the Financial Statements appears on page 56. The Company’s investment policy statement, as set out on page 11, places the emphasis on investing in readily realisable listed securities and puts a limit on borrowings. The Company retains title to all assets held by the Custodian. A trust deed governs the CULS. Cash is held
The Directors submit the Report and Accounts of the Company for the year ended 30 April 2016. The Corporate Governance Statement, the Remuneration Report and the Report of the Audit and Management Engagement Committee all form part of this Directors’ Report.

36 | F&C Global Smaller Companies PLC
on deposit only with banks approved and regularly reviewed by F&C.
As discussed in note 24 on the Accounts, the Directors believe that, in light of the controls and monitoring processes that are in place, the Company has adequate resources to continue in operational existence for at least twelve months from the date of approval of the financial statements. In considering this, the Directors took into account the diversified portfolio of readily realisable securities which can be used to meet short term funding commitments, and the ability of the Company to meet all of its liabilities and ongoing expenses. Accordingly, it is reasonable for the financial statements to continue to be prepared on a going concern basis.
The Company’s longer term viability is considered in the Future Prospects “Five Year Horizon” Statement on page 30.
Shareholders will be asked to approve the adoption of the Report and Accounts at the forthcoming Annual General Meeting (Resolution 1).
Independent AuditorsEach of the Directors confirms that, to the best of his or her knowledge and belief, there is no information relevant to the preparation of the Report and Accounts which PricewaterhouseCoopers LLP (“PwC”) is unaware and he or she has taken all the steps a Director might reasonably be expected to have taken to be aware of relevant audit information and to establish that PwC is aware of that information.
PwC have indicated their willingness to continue in office as auditors to the Company and a resolution proposing their reappointment and authorising the Audit and Management Engagement Committee to determine their remuneration for the ensuing year will be put to shareholders at the Annual General Meeting (Resolutions 11 and 12).
Voting Policy on portfolio investmentsThe Manager, in the absence of explicit instructions from the Board, is empowered to exercise discretion in the use of the Company’s voting rights. All shareholdings are voted at all meetings worldwide where practicable in accordance with F&C’s own corporate governance policy, which is to seek to maximise shareholder value by constructive use of votes at company meetings and by endeavouring to use its influence as an investor with a principled approach to corporate governance. In the year under review, F&C had engaged with a number of companies held in the portfolio and had voted
at 228 company meetings on a range of issues. Key themes included the risks associated with fossil fuel investment, the alignment of pay with business strategy and risk, and emerging market labour standards in supply chains.
Environmental factors are, where appropriate, taken into consideration with regard to investment decisions taken on behalf of the Company.
F&C’s statement of compliance with The UK Stewardship Code has been reviewed and endorsed by the Board, which encourages and supports F&C on its voting policy and its stance towards environmental, social and governance issues. The statement is available on F&C’s website at www.fandc.com/ukstewardshipcode. The Board periodically receives a report on instances where F&C has voted against the recommendation of the management on any resolution. It also expects to be informed of any sensitive voting issues involving the Company’s investments.
Capital structureThe Company’s issued share capital at 30 April 2016 consisted of 55,411,203 ordinary shares of 25p each
‘The Company’s shareholdings are voted at all meetings worldwide where practicable’

Report and Accounts 2016 | 37
GOVERNANCE REPORT
OV
ER
VIE
WS
TR
AT
EG
IC R
EP
OR
TG
OV
ER
NA
NC
E R
EP
OR
TA
UD
ITO
RS
’ RE
PO
RT
FINA
NC
IAL R
EP
OR
TN
OT
ICE
OF M
EE
TIN
GO
TH
ER
INFO
RM
AT
ION
power to allot such shares for cash without first offering them to existing shareholders in proportion to their holdings.
During the year, the Company issued shares on 60 separate occasions. A total of 2,276,000 ordinary shares with a nominal value of £569,000 were issued at an average price of 975.3 pence per share for a total consideration of £22,199,000 before the deduction of issue costs. 10,126 new ordinary shares were also issued as a result of two CULS conversions during the year. A further 145,000 shares have been allotted since the year end.
Details of the allottees are set out in the following table:
AllotteeNumber of issues
Number of shares
issued
Price range
(pence)
Total consideration
£’000s
Stifel Nicolaus Europe Limited 48 1,866,000876.0
to 1016.5
18,173
Winterflood Securities Limited 10 280,000950.0
to 1005.0
2,757
JPMorgan Cazenove 2 130,000954.5
to 982.5
1,269
Holders of CULS 2 10,126 977.6970 –
Subject to annual shareholder approval, the Company may also purchase its own shares when trading at a discount to diluted NAV per share; the Board aims to keep the discount (with the diluted NAV per share excluding current period income) at no more than 5% in normal market conditions. The shares can either be cancelled or held in treasury to be sold as and when they return to a premium or to a narrower discount than the weighted average discount at which they had been bought back and in any event at no more than a 5% discount to the prevailing diluted NAV per share. At the Annual General Meeting held on 23 July 2015 shareholders gave the Board authority to buy back up to 14.99% of the Company’s shares (8,006,000 shares) during the following 15 months. No shares have been purchased either during the year under review or since the year end and to the date of this report. No shares are held in treasury.
Voting rights and proportional votingAt 20 June 2016 the Company’s 55,556,203 ordinary shares in issue represented a total of 55,556,203 voting rights. As at 30 April 2016 and since that date no notifications of significant voting rights have been received
(“ordinary shares”), with voting rights and £39.9 million nominal of CULS. The CULS are listed on the London Stock Exchange and are tradeable. As at 20 June 2016 (being the latest practicable date before publication of this report) the number of ordinary shares was 55,556,203. All ordinary shares rank equally for dividends and distributions and carry one vote each. There are no restrictions concerning the transfer of securities in the Company, no special rights with regard to control attached to securities, no agreements between holders of securities regarding their transfer known to the Company and no agreement which the Company is party to that affects its control following a takeover bid. Details of the capital structure can be found in note 16 on the accounts. The revenue profits of the Company (including accumulated revenue reserves) are available for distribution by way of dividends to the holders of the ordinary shares. Upon a winding-up, after meeting the liabilities of the Company, the surplus assets would be distributed to shareholders pro rata to their holdings of ordinary shares. Full details are set out in the Company’s articles of association.
On 11 August 2015, 83,597 units of CULS were converted into 8,542 ordinary shares and on 10 February 2016, 15,508 units of CULS were converted into 1,584 ordinary shares. In accordance with the terms of the issue, the conversion price of the CULS was determined at 977.6970 pence per £1 nominal of CULS for one ordinary share. CULS holders are entitled to convert their CULS, in whole or in part, into ordinary shares on each 31 January and 31 July until 31 July 2019. On a winding-up of the Company, the nominal amount of the CULS would rank ahead of the ordinary shares but would be subordinated to the Company’s other borrowings and creditors. Therefore, the rights and remedies available to the CULS Trustee and CULS holders may be limited by applicable winding-up, insolvency, re-organisation, moratorium or similar provisions relating to or affecting creditors’ rights generally.
Issue and buyback of shares The Board closely monitors the prevailing share price premium or discount to the diluted NAV per share. The Board’s policy is for the Company to issue shares at a premium to the diluted NAV per share helping to prevent the excessive build-up of demand for the shares and to reduce premium volatility. Such issues are only made when the Company’s shares are trading at a premium and they are therefore accretive to the NAV. At the Annual General Meeting held on 23 July 2015, shareholders authorised the Board to issue up to 10% of the Company’s shares (5,341,000 shares) until the next Annual General Meeting in July 2016 and the

38 | F&C Global Smaller Companies PLC
under the Financial Conduct Authority’s Disclosure and Transparency Rules.
Ordinary shareholders are entitled to vote on all resolutions which are proposed at general meetings of the Company. Each ordinary shareholder is entitled to one vote on a show of hands and, on a poll, to one vote for every ordinary share held. CULS holders have the right to receive notice of, but not to attend, annual general meetings of the Company.
CULS holders have the power by Extraordinary Resolution to sanction any modification, abrogation or compromise of or arrangement in respect of their rights against the Company and to assent to any modification of the provisions of the Trust Deed.
Approximately 53.5% of the Company’s share capital is held on behalf of non-discretionary clients through the F&C savings plans. The nominee company holding these shares votes the shares held on behalf of planholders who have not returned their voting directions in proportion to the directions of those who have (“proportional voting”). Implementation of this arrangement is subject to a minimum threshold of 5% of the shares held in the savings plans being voted. A maximum limit of 74,000 shares that any one individual investor can vote, being approximately 5% of the minimum threshold, also applies. Any shares voted by an investor in excess of the maximum limit remain valid, but do not form part of the proportional voting basis. Planholders have the right to exclude their shares from the proportional voting arrangement.
BorrowingsAt the year end, the Company had £39.9 million nominal of 3.5% CULS in issue. The net gearing was 4.7%.
The interest rate on the CULS is 3.5% per annum, payable semi-annually in equal instalments in arrears on 31 January and 31 July in each year until 31 July 2019. In accordance with the terms of the CULS issue, the conversion price was determined at 977.6970 pence per £1 nominal of CULS for one ordinary share, which represented a 15% premium to the published unaudited NAV (cum income) per ordinary share of 850.1713 pence at close of business on 30 July 2014. Any CULS not previously redeemed, purchased or converted will be repaid by the Company on 31 July 2019 at its nominal amount together with interest accrued up to but excluding the date of redemption. The Company has no bank borrowing. It has the ability to use short-term borrowings by way of loans and overdrafts, subject to the limit set out on page 11 in
the Company’s investment policy statement. The CULS Trust Deed does not place any restriction on borrowing.
An overdraft facility equal to 10% of the Company’s assets is made available to the Company by the Custodian.
Directors’ Remuneration ReportThe Directors’ Remuneration Policy and Annual Remuneration Report, which can be found on pages 46 to 48, provide detailed information on the remuneration arrangements for Directors of the Company. Shareholders will be asked to approve both the Directors’ Remuneration Policy and Annual Report on Remuneration at the forthcoming Annual General Meeting. (Resolutions 2 and 3).
Directors’ re-elections The names of the current Directors of the Company, along with their biographical details, are set out on page 34 and are incorporated into this report by reference. Other than Anja Balfour and David Stileman, who both joined the Board on 1 June 2015, all the Directors held office throughout the year under review. Les Cullen retired from the Board on 23 July 2015. As reported in the Company’s 2015 Report and Accounts, in accordance with best practice all Directors will stand for re-election annually regardless of their length of service (Resolutions 5 to 10).
The Nomination Committee has considered each Director and the Board has concurred with the Nomination Committee’s assessment that each Director is independent of character and judgement and that there are no relationships or circumstances which are likely to affect the judgement of any Director. Each Director continues to make a valuable and effective contribution and remains committed in the role.
Directors’ interests and indemnificationThere were no contracts of significance to which the Company was a party and in which a Director is, or was, materially interested during the year. There are no agreements between the Company and its Directors concerning compensation for loss of office.
The Company has granted a deed of indemnity to the Directors in respect of liabilities that may attach to them in their capacity as Directors of the Company. This covers any liabilities that may arise to a third party for negligence, default or breach of trust or duty. This deed of indemnity is a qualifying third-party provision (as defined by section 234 of the Companies Act 2006) and has been in force throughout

Report and Accounts 2016 | 39
GOVERNANCE REPORT
OV
ER
VIE
WS
TR
AT
EG
IC R
EP
OR
TG
OV
ER
NA
NC
E R
EP
OR
TA
UD
ITO
RS
’ RE
PO
RT
FINA
NC
IAL R
EP
OR
TN
OT
ICE
OF M
EE
TIN
GO
TH
ER
INFO
RM
AT
ION
the period under review and remains in place as at the date of this report. It is available for inspection at the Company’s registered office during normal business hours and at the Annual General Meeting. The Company also maintains directors’ and officers’ liability insurance.
Safe custody of assetsThe Company’s listed investments are held in safe custody by the Custodian, JPMorgan Chase Bank. Operational matters with the Custodian are carried out on the Company’s behalf by the Manager via F&C in accordance with the provisions of the investment management agreement. The Custodian is paid a variable fee dependent on the number of trades transacted and location of the securities held. The investment in Australian New Horizons Fund is not held by the Custodian but the Board has satisfied itself that adequate custodial arrangements exist.
Depositary JPMorgan Europe Limited acts as the Company’s Depositary in accordance with the Alternative Investment Fund Manager’s Directive (“AIFMD”). The Depositary’s responsibilities, which are set out in an Investor Disclosure Document on the Company’s website, include: cash monitoring; ensuring the proper segregation and safe keeping of the Company’s financial instruments that are held by the Custodian; and monitoring the Company’s compliance with investment and leverage limits requirements. The Depositary receives for its services a fee of one basis point per annum, based on the Company’s net assets, payable monthly in arrears.
Although the Depositary has delegated the safekeeping of all assets held within the Company’s investment portfolio to the Custodian, in the event of loss of those assets that constitute financial instruments under the AIFMD, the Depositary will be obliged to return to the Company financial instruments of an identical type, or the corresponding amount of money, unless it can demonstrate that the loss has arisen as a result of an external event beyond its reasonable control, the consequences of which would have been unavoidable despite all reasonable efforts to the contrary.
The Manager’s feeThe Company has, for the last ten years, paid fees to the Manager, F&C, on both an ad-valorem and performance basis. A management fee of 0.40% per annum of the net assets managed by F&C has been payable to the Manager in respect of the management, administration and ancillary
services provided to the Company. A reduced annual management fee of 0.25% of the market value of investments in third party collective funds has also been paid to the Manager. This related to fund investments made on strategic grounds after 30 April 2006, such as those utilised within the Rest of World and Japanese parts of the portfolio as described in the Manager’s Review.
A performance fee equal to 10% of any out-performance of the Benchmark has been payable annually if the net assets outperformed the Benchmark, subject to a maximum absolute cap on the level of fees (including both the management fee and the performance fee) that the Manager could earn in any one year of 1% of average month-end net assets. Any performance above this cap would have been carried forward to the subsequent period for inclusion in the calculation of performance in that period. Any underperformance would also have been carried forward, thus creating a high watermark. A performance fee of £1,314,000 is payable to the Manager for the year under review.
Change in the fee structureThe fee structure has been changed with effect from 1 May 2016 and this is explained fully in the Chairman’s Statement. The performance fee has been removed and the Manager will receive a management fee of 0.55% per annum of the net assets managed by F&C and a reduced management fee of 0.275% of the market value of investments in third party collective funds. Based on the split of assets this translates into approximately a 0.50% blended management fee payable to F&C which should, depending on the geographic split of assets and the extent to which collectives are used, remain fairly constant going forward.
Greenhouse gas emissionsAll of the Company’s activities are outsourced to third parties. As such it does not have any physical assets, property, employees or operations of its own and does not directly generate any greenhouse gas or other emissions.
Manager evaluation process F&C’s performance is considered by the Board at every meeting with a formal evaluation by the Audit and Management Engagement Committee in June each year. In evaluating their performance, the Board considers a range of factors including the investment performance of the portfolio as a whole, performance of the various regional sub-portfolios and the skills, experience and depth of the team involved in managing the Company’s assets. The Board measures

40 | F&C Global Smaller Companies PLC
Resolution 13 gives the Directors the necessary authority to allot securities up to an aggregate nominal amount of £1,388,000 (5,555,000 ordinary shares), being equivalent to approximately 10% of the Company’s current issued share capital (calculated exclusive of any treasury shares being held by the Company) as at 20 June 2016, being the latest practicable date before the publication of the Notice of the Annual General Meeting. The authority and power expires at the conclusion of the Annual General Meeting in 2017 or, if earlier, 15 months from the passing of the resolution, As at 20 June 2016 no shares were held by the Company in treasury.
Resolution 14 empowers the Directors to allot such securities for cash, other than to existing shareholders on a pro-rata basis and also to sell treasury shares without first offering them to existing shareholders in proportion to their holdings up to an aggregate nominal amount also of £1,388,000 (representing approximately 10% of the issued ordinary share capital of the Company at 20 June 2016). Resolution 16 specifically authorises the Directors to sell treasury shares if the price is at a narrower discount than the weighted average discount at which the shares had been bought back and in any event at no more than a 5% discount to the prevailing net asset value per share. Resolution 16 does not preclude the Directors selling treasury shares at a premium.
These authorities and powers provide the Directors with a degree of flexibility to increase the assets of the Company by the issue of new shares or the sale of treasury shares, in accordance with the policies set out on page 37 or should any other favourable opportunities arise to the advantage of shareholders.
The Directors anticipate that they will mainly use them to satisfy demand from participants in the F&C savings plans when they believe it is advantageous to such participants and the Company’s shareholders to do so. Under no circumstances would the Directors use them to issue new shares unless the shares were trading at a premium to NAV.
Authority for the Company to purchase its own shares (Resolution 15)Resolution 15 authorises the Company to purchase up to a maximum of 8,327,000 ordinary shares (equivalent to approximately 14.99% of the issued share capital) in the market at a minimum price of 25 pence per share and a maximum price per share (exclusive of expenses) of not more than 5% above the average of the middle market quotations for an ordinary share (as derived from the London Stock Exchange Daily Official List) for the five business days immediately before
the overall relative success of the Company against the Benchmark, with each regional sub-portfolio being measured against relevant local small capitalisation indices. It also considers the resources and commitment of the Manager in all areas of its responsibility, including the marketing and administrative services provided to the Company.
Manager reappointmentThe annual evaluation of the Manager by the Audit and Management Engagement Committee took place in June 2016 with a presentation from the Lead Manager and F&C’s Head of Investment Trusts. This focused primarily on investment performance and the services provided to the Company more generally.
The Audit and Management Engagement Committee met in closed session following the presentation and, in light of the long-term investment performance of the Manager and the quality of the overall service provided, it concluded in its opinion that the continuing appointment of F&C Investment Business Limited (“FCIB”) as Manager on the terms agreed is in the interests of shareholders as a whole. The Board ratified this recommendation.
Annual General MeetingThe Annual General Meeting will be held on Thursday 28 July 2016 at 12 noon at The Chartered Accountants’ Hall, One Moorgate Place, London EC2. The Notice of Annual General Meeting appears on pages 86 to 90 and includes a map of the venue. The Lead Manager will give a presentation and there will be an opportunity to ask questions. Shareholders will be able to meet the Directors and the Lead Manager informally over refreshments afterwards.
Authority to allot shares and sell shares from treasury (Resolutions 13, 14 and 16)By law, directors are not permitted to allot new shares (or to grant rights over shares) unless authorised to do so by shareholders. In addition, directors require specific authority from shareholders before allotting new shares (or granting rights over shares) for cash or selling shares out of treasury without first offering them to existing shareholders in proportion to their holdings.
Resolutions 13, 14 and 16 are similar in content to the authorities and power given to the Directors at previous annual general meetings
Report and Accounts 2016 | 41
GOVERNANCE REPORT
OV
ER
VIE
WS
TR
AT
EG
IC R
EP
OR
TG
OV
ER
NA
NC
E R
EP
OR
TA
UD
ITO
RS
’ RE
PO
RT
FINA
NC
IAL R
EP
OR
TN
OT
ICE
OF M
EE
TIN
GO
TH
ER
INFO
RM
AT
ION
All proxy appointments should in any event be returned or lodged so as to be received not later than 48 hours before the time appointed for holding the Annual General Meeting.
Form of direction and proportional votingIf you are an investor in any of the F&C savings plans you will have received a form of direction for use at the Annual General Meeting and you will also have the option of lodging your voting directions using the Internet. The Manager operates a proportional voting arrangement, which is explained on page 38.
All voting directions should be submitted as soon as possible in accordance with the instructions on the form of direction and, in any event, not later than 12 noon on 21 July 2016, so that the nominee company can submit a form of proxy before the 48 hour period begins.
RecommendationYour Board considers that each of the resolutions to be proposed at the Annual General Meeting is likely to promote the success of the Company for the benefit of its members and are in the best interests of the Company and its shareholders as a whole. The Directors unanimously recommend that shareholders vote in favour of the resolutions, as they intend to do in respect of their own beneficial holdings.
By order of the Board For and on behalf of F&C Investment Business Limited, Secretary 22 June 2016
the date of purchase, reflecting requirements of the Companies Act 2006 and the Listing Rules.
In the event that the Company’s shares return to a discount, the Directors intend to use this authority with the objective of keeping the discount at no more than 5% in normal market conditions as well as enhancing the NAV per share for continuing shareholders. Any shares that are purchased will either be cancelled or placed into treasury. The authority will continue until the expiry of 15 months from the date of the passing of the resolution unless it is varied, revoked or renewed prior to that by the Company in general meeting by special resolution. The Board intends to seek a renewal of such authority at subsequent annual general meetings.
Notice period for meetings (Resolution 17)The Act and the Company’s articles of association provide that all general meetings (other than annual general meetings) can be convened on 14 days’ notice. However, one of the requirements of the Shareholder Rights Directive is that all general meetings must be held on 21 clear days’ notice, unless shareholders agree to a shorter notice period. The Board is of the view that it is in the Company’s interests to have a shorter notice period which complies with the provisions of the Act and the Company’s articles allow all general meetings (other than an annual general meeting) to be called on 14 clear days’ notice. The passing of resolution 17 would constitute shareholders’ agreement for the purposes of the Shareholder Rights Directive (which agreement is required annually) and would therefore preserve the Company’s ability to call general meetings (other than an annual general meeting) on 14 clear days’ notice. The Board would utilise this authority to provide flexibility when merited and would not use it as a matter of routine. The Board intends to seek a renewal of such authority at subsequent annual general meetings.
VOTINGForm of proxyIf you are a registered shareholder you will find enclosed a form of proxy for use at the Annual General Meeting. You will also have the option of lodging your proxy vote using the internet. For shares held through CREST, proxy appointments may be submitted via the CREST proxy voting system. Please either complete, sign and return the form of proxy in the envelope provided as soon as possible in accordance with the instructions or, alternatively, lodge your proxy vote via the internet or the CREST proxy voting system, whether or not you intend to be present at the Annual General Meeting. This will not preclude you from attending and voting in person if you wish to do so.

42 | F&C Global Smaller Companies PLC
Corporate Governance Statement
IntroductionThe Company is committed to high standards of corporate governance. The Board has considered the principles and recommendations of the Association of Investment Companies (“AIC”) Code of Corporate Governance (the “AIC Code”) by reference to the AIC Corporate Governance Guide for Investment Companies (the “AIC Guide”), both revised in February 2015. The AIC Code, as explained by the AIC Guide, addresses all the principles set out in the UK Corporate Governance Code (the “UK Code”) as well as setting out additional principles and recommendations on issues that are of specific relevance to the Company*.
The Board considers that reporting against the principles and recommendations of the AIC Code, and by reference to the AIC Guide (which incorporates the UK Code), will provide better information to shareholders.
The Company has complied with the recommendations of the AIC Code that are applicable to smaller companies (those below the FTSE 350) during the year under review and up to the date of this report and thereby the provisions of the UK Code that are relevant to the Company, except as set out below.
The UK Code includes provisions relating to:• directors’ tenure;• the role of the chief executive;• executive directors’ remuneration; and• the need for an internal audit function.
For the reasons set out in the AIC Guide, and as explained in the UK Code, the Board considers these provisions are not relevant to the position of the Company, being an externally managed company. In particular, all of the Company’s day-to-day management and administrative functions have been delegated to the Manager. As a result, the Company has no executive directors, employees or internal operations. Therefore, with the exception of directors’ tenure, which is addressed further on page 44, and the need for an internal audit function which is
* Copies of both codes may be found on the respective websites: www.theaic.co.uk and www.frc.org.uk
addressed further on pages 50 and 51, the Company has not reported further in respect of these provisions.
Articles of associationThe Company’s articles of association may only be amended by special resolution at general meetings of shareholders.
AIFMDThe Company is defined as an AIF under the AIMFD issued by the European Parliament, which requires that all AIFs must appoint a Depositary and an Alternative Investment Fund Manager (“AIFM”). The Board remains fully responsible for all aspects of the Company’s strategy, operations and compliance with regulations. The Company’s AIFM is FCIB.
The Board The Board is responsible for the effective stewardship of the Company’s affairs and reviews the schedule of matters reserved for its decision. These are categorised under strategy, policy, finance, risk, investment restrictions, performance, marketing, appointments, the Board and public documents. It has responsibility for all corporate strategic issues, dividend policy, share buyback and issue policy and corporate governance matters which are all reviewed regularly.
In order to enable them to discharge their responsibilities, all Directors have full and timely access to relevant information. At each meeting the Board reviews the Company’s investment performance and considers financial analyses and other reports of an operational nature. The Board monitors compliance with the Company’s objectives and is responsible for setting investment and gearing limits within which the Lead Manager has discretion to act, and thus supervises the management of the investment portfolio which is contractually delegated to the Manager.
The Board has responsibility for the approval of unlisted investments.
The following table sets out the number of Board and committee meetings held and attended during the year under review.
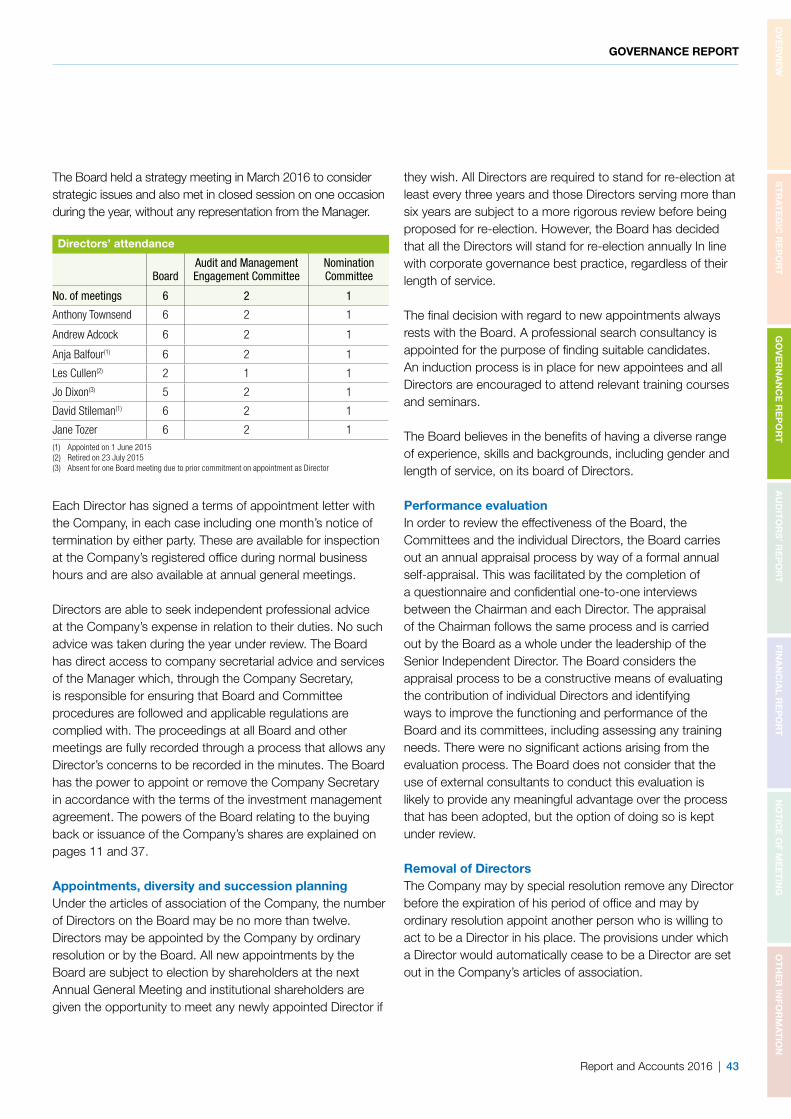
Report and Accounts 2016 | 43
GOVERNANCE REPORT
OV
ER
VIE
WS
TR
AT
EG
IC R
EP
OR
TG
OV
ER
NA
NC
E R
EP
OR
TA
UD
ITO
RS
’ RE
PO
RT
FINA
NC
IAL R
EP
OR
TN
OT
ICE
OF M
EE
TIN
GO
TH
ER
INFO
RM
AT
ION
The Board held a strategy meeting in March 2016 to consider strategic issues and also met in closed session on one occasion during the year, without any representation from the Manager.
Directors’ attendance
BoardAudit and Management Engagement Committee
Nomination Committee
No. of meetings 6 2 1
Anthony Townsend 6 2 1
Andrew Adcock 6 2 1
Anja Balfour(1) 6 2 1
Les Cullen(2) 2 1 1
Jo Dixon(3) 5 2 1
David Stileman(1) 6 2 1
Jane Tozer 6 2 1(1) Appointed on 1 June 2015(2) Retired on 23 July 2015(3) Absent for one Board meeting due to prior commitment on appointment as Director
Each Director has signed a terms of appointment letter with the Company, in each case including one month’s notice of termination by either party. These are available for inspection at the Company’s registered office during normal business hours and are also available at annual general meetings.
Directors are able to seek independent professional advice at the Company’s expense in relation to their duties. No such advice was taken during the year under review. The Board has direct access to company secretarial advice and services of the Manager which, through the Company Secretary, is responsible for ensuring that Board and Committee procedures are followed and applicable regulations are complied with. The proceedings at all Board and other meetings are fully recorded through a process that allows any Director’s concerns to be recorded in the minutes. The Board has the power to appoint or remove the Company Secretary in accordance with the terms of the investment management agreement. The powers of the Board relating to the buying back or issuance of the Company’s shares are explained on pages 11 and 37.
Appointments, diversity and succession planningUnder the articles of association of the Company, the number of Directors on the Board may be no more than twelve. Directors may be appointed by the Company by ordinary resolution or by the Board. All new appointments by the Board are subject to election by shareholders at the next Annual General Meeting and institutional shareholders are given the opportunity to meet any newly appointed Director if
they wish. All Directors are required to stand for re-election at least every three years and those Directors serving more than six years are subject to a more rigorous review before being proposed for re-election. However, the Board has decided that all the Directors will stand for re-election annually In line with corporate governance best practice, regardless of their length of service.
The final decision with regard to new appointments always rests with the Board. A professional search consultancy is appointed for the purpose of finding suitable candidates. An induction process is in place for new appointees and all Directors are encouraged to attend relevant training courses and seminars.
The Board believes in the benefits of having a diverse range of experience, skills and backgrounds, including gender and length of service, on its board of Directors.
Performance evaluationIn order to review the effectiveness of the Board, the Committees and the individual Directors, the Board carries out an annual appraisal process by way of a formal annual self-appraisal. This was facilitated by the completion of a questionnaire and confidential one-to-one interviews between the Chairman and each Director. The appraisal of the Chairman follows the same process and is carried out by the Board as a whole under the leadership of the Senior Independent Director. The Board considers the appraisal process to be a constructive means of evaluating the contribution of individual Directors and identifying ways to improve the functioning and performance of the Board and its committees, including assessing any training needs. There were no significant actions arising from the evaluation process. The Board does not consider that the use of external consultants to conduct this evaluation is likely to provide any meaningful advantage over the process that has been adopted, but the option of doing so is kept under review.
Removal of DirectorsThe Company may by special resolution remove any Director before the expiration of his period of office and may by ordinary resolution appoint another person who is willing to act to be a Director in his place. The provisions under which a Director would automatically cease to be a Director are set out in the Company’s articles of association.

44 | F&C Global Smaller Companies PLC
Nomination Committee The role of the Nomination Committee is to review and make recommendations to the Board with regard to:(i) Board structure, size and composition, the balance of
knowledge, experience, skill range and diversity;(ii) succession planning and tenure policy;(iii) the criteria for future Board appointments and the
methods of recruitment, selection, appointment and induction;
(iv) the appointment of new Directors and the reappointment of those Directors standing for re-election at annual general meetings;
(v) the attendance and time commitment of the Directors in fulfilling their duties, including the extent of their other directorships;
(vi) the question of each Director’s independence prior to publication of the Report and Accounts;
(vii) the authorisation of each Director’s situational conflicts of interests in accordance with the provisions of the Companies Act 2006 and the policy and procedures established by the Board in relation to these provisions; and
(viii) the Directors’ contract for services and terms of office as set out in their Letter of Appointment.
All of the Nomination Committee’s responsibilities have been carried out during the year and to the date of this report.
The Nomination Committee’s terms of reference are available on request and can also be found on the Company’s website at www.fandcglobalsmallers.com The Nomination Committee is composed of the full Board and is chaired by Anthony Townsend. Attendance at meetings is listed on page 43.
Remuneration Committee As the Board has no executive Directors and no employees, and is composed solely of non-executives, it does not have a remuneration committee. Detailed information on the remuneration arrangements for the Directors of the Company can be found in the Directors’ Remuneration Policy and Directors’ Annual Report on Remuneration on pages 46 to 48 and in note 6 on the accounts.
Relations with shareholders Shareholder communication is given a high priority. In addition to the annual and half-yearly reports that are available to shareholders, monthly fact sheets and general
Board independence and tenure The Board is of the view that length of service will not necessarily compromise the independence or contribution of directors of an investment trust company, where continuity and experience can add significantly to the strength of the Board. The Board has a policy that only a minority of the Board should generally have served for more than nine years. The main aim is to ensure that Board members have an appropriate mix of skills, with regular reviews undertaken to ensure that Directors are independent in character and judgement. The Board considers all of the Directors to be independent of F&C and of the Company itself; none has a past or current connection with F&C, with no relationships or circumstances relating to the Company that are likely to affect that judgement. It is considered that the Chairman and Jane Tozer (the senior independent Director) who have each served as a Director for over nine years, continue to be independent in both character and judgement.
Conflicts of interestA company director has a statutory obligation to avoid a situation in which he or she has, or potentially could have, a direct or indirect interest that conflicts with the interests of the company (a “situational conflict”). The Board therefore has procedures in place for the authorisation and review of situational conflicts relating to the Directors. Limits can be imposed as appropriate.
Other than the formal authorisation of the Directors’ other directorships as situational conflicts, no authorisations have been sought. They are reviewed throughout the year at the commencement of each Board meeting and the Nomination Committee reviews the authorisation of each individual Director’s conflicts or potential conflicts annually. In the year under review, the Nomination Committee concluded that in each case these situational conflicts had not affected any individual in his/her role as a Director of the Company.
Aside from situational conflicts, the Directors must also comply with the statutory rules requiring company directors to declare any interest in an actual or proposed transaction or arrangement with the Company.
Audit and Management Engagement Committee The Board has established an Audit and Management Engagement Committee, the role and responsibilities of which are set out in the report on pages 49 to 52.

Report and Accounts 2016 | 45
GOVERNANCE REPORT
OV
ER
VIE
WS
TR
AT
EG
IC R
EP
OR
TG
OV
ER
NA
NC
E R
EP
OR
TA
UD
ITO
RS
’ RE
PO
RT
FINA
NC
IAL R
EP
OR
TN
OT
ICE
OF M
EE
TIN
GO
TH
ER
INFO
RM
AT
ION
information are available on the Company’s website at www.fandcglobalsmallers.com
A regular dialogue is maintained with the Company’s institutional shareholders and with private client asset managers.
Shareholders wishing to communicate with the Chairman, the Senior Independent Director or any other member of the Board may do so by writing to the Company, for the attention of the Company Secretary, at the address set out on page 93.
Unclaimed dividendsThe Company has engaged the services of Georgeson (a subsidiary of Computershare) to locate shareholders, or their beneficiaries, who have lost track of or are unaware of their investments.
By order of the Board For and on behalf of F&C Investment Business Limited Secretary 22 June 2016

46 | F&C Global Smaller Companies PLC
Remuneration Report
The Board presents the Directors’ Remuneration Report for the year ended 30 April 2016 which has been prepared in accordance with the requirements of section 421 of the Companies Act 2006.
The law requires the Company’s auditor to audit certain of the disclosures provided. Where disclosures have been audited, they are indicated as such. The auditor’s opinion is included in their report on pages 56 to 61.
Directors’ Remuneration Policy
The law requires that the Directors’ Remuneration Policy is subject to a triennial binding vote. The Board has, however, decided to seek annual approval and therefore an ordinary resolution to approve this policy will be put to the shareholders at the forthcoming Annual General Meeting. At the Annual General Meeting held on 23 July 2015, 93% of votes were cast in favour of the resolution.
The Board’s policy for this and subsequent years is to set the Directors’ remuneration at a level commensurate with the skills and experience necessary for the effective stewardship of the Company and the expected contribution of the Board as a whole in continuing to achieve the investment objective. Time committed to the Company’s business and the specific responsibilities of the Chairman, Senior Independent Director, Chairman of the Audit and Management Engagement Committee and the Directors and their retention are taken into account. The policy aims to be fair and reasonable in relation to comparable investment trusts and other similar sized financial companies.
The Board has not received any direct communications from the Company’s shareholders in respect of the levels of Directors’ remuneration. The Board considers the level of Directors’ fees annually and the Chairman carried out a review of the fee rates in accordance with this policy towards the end of the year under review. The fees were previously increased in May 2014 and the Board agreed with the Chairman’s recommendation that, commencing 1 May 2016, the Directors’
basic fee should be increased to £24,000 per annum (formerly £22,000) to bring the fees more in line with the market. The Board considered the Chairman’s fee and agreed that this would be increased to £40,000 per annum (formerly £36,000). All other additional fees remain unchanged.
The Company’s articles of association limit the aggregate fees payable to the Board of Directors to a total of £200,000 per annum. Within that limit, it is the responsibility of the Board as a whole to determine and approve the Directors’ fees, following a recommendation from the Chairman and, in his case, from the Senior Independent Director; the Board of Directors is composed solely of non-executive Directors, none of whom has a service contract with the Company, and therefore no remuneration committee has been appointed.
The fees are fixed and are payable in cash, quarterly in arrears. Directors are not eligible for bonuses, pension benefits, share options or long-term incentive schemes.
The fees for specific responsibilities are set out in the table below. No fees are payable for membership of the Nomination Committee.
Annual fees for Board Responsibilities
2017£s
2016*£s
Board
Chairman** 42,000 38,000
Senior Independent Director 25,500 23,500
Director 24,000 22,000
Audit & Management Engagement Committee
Chairman 6,000 6,000
Members 2,000 2,000* Actual ** Includes membership of the Audit and Management Engagement Committee
In addition to the above, Directors are eligible to receive compensation for certain travel and subsistence expenditure. The cost to the Company of such reimbursements amounted to less than £5,000 in the year (2015: less than £1,000).

Report and Accounts 2016 | 47
GOVERNANCE REPORT
OV
ER
VIE
WS
TR
AT
EG
IC R
EP
OR
TG
OV
ER
NA
NC
E R
EP
OR
TA
UD
ITO
RS
’ RE
PO
RT
FINA
NC
IAL R
EP
OR
TN
OT
ICE
OF M
EE
TIN
GO
TH
ER
INFO
RM
AT
ION
Each new Director is provided with a letter of appointment. There is no provision for compensation upon early termination of appointment. The letters of appointment are available on request at the Company’s registered office during business hours and will be available for 15 minutes before and during the forthcoming Annual General Meeting, All Directors will stand for annual re-election.
Based on the current levels of fees, Directors’ remuneration for the year ending 30 April 2017 would be as follows:
Year ending 30 April 2017 £’s
2016* £’s
Anthony Townsend 42,000 38,000
Andrew Adcock 26,000 24,000
Anja Balfour(1) 26,000 22,000
Les Cullen(2) – 6,417
Josephine Dixon(3) 30,000 27,083
David Stileman(1) 26,000 22,000
Jane Tozer 27,500 25,500
Total 177,500 165,000
* Actual(1) Appointed on 1 June 2015(2) Retired on 23 July 2015(3) Appointed chairman of Audit and Management Engagement Committee w.e.f. 23 July 2015
Directors’ Annual Report on Remuneration An ordinary resolution for the approval of the Directors’ Annual Report on Remuneration will be put to shareholders at the forthcoming Annual General Meeting. At the Annual General Meeting held on 23 July 2015, shareholders approved the Directors’ Annual Report on Remuneration in respect of the year ended 30 April 2015. 94% of votes were cast in favour of the resolution.
The table below shows the actual expenditure during the year in relation to Directors’ remuneration, other operating expenses and shareholder distributions:
Actual expenditure
Year ended 30 April 2016£’000s
2015£’000s
%Change
Aggregate Directors’ Remuneration 165.0 144.8 14.0
Management and other operating expenses* 3,947 3,527 11.9
Dividends paid to Shareholders in the year 5,342 4,223 26.5
* Includes Directors’ remuneration and performance fees
Directors’ emoluments for the yearThe Directors who served during the year received the following emoluments in the forms of fees:
Fees for services to the Company (audited)
Year ended 30 April
Director2016
£’s2015
£’s
Anthony Townsend (Chairman and highest paid Director)
38,000 38,000
Andrew Adcock 24,000 24,000
Anja Balfour(1) 22,000 -
Les Cullen(2) 6,417 28,000
Josephine Dixon(3) (Chairman of the Audit and Management Engagement Committee)
27,083 5,286
Dr Franz Leibenfrost(4) – 5,548
David Stileman(1) 22,000 –
Jane Tozer(5) (Senior Independent Director)
25,500 25,157
Mark White(6) – 18,786
165,000 144,777(1) Appointed on 1 June 2015(2) Retired on 23 July 2015(3) Appointed on 11 February 2015 and as chairman of the Audit and Management Engagement
Committee on 23 July 2015(4) Resigned on 24 July 2014(5) Appointed Senior Independent Director on 24 July 2014(6) Resigned on 11 February 2015
Directors’ interests in the CompanyThe Directors (including their connected persons) at 30 April 2016 and 30 April 2015 had no interest in the share capital of the Company other than those interests, all of which are beneficial interests, shown in the table below:
Directors’ interests (audited)
At 30 April 2016 2015Ordinary
Shares CULSOrdinary
Shares CULS
Anthony Townsend 18,000 – 18,000 –
Andrew Adcock 5,000 25,000 5,000 25,000
Anja Balfour(1) 1,600 – – –
Josephine Dixon 2,000 – – –
David Stileman(1) 1,000 – – –
Jane Tozer 3,722 6,389 3,722 6,389
(1) Appointed on 1 June 2015
Since the year end, Ms Balfour has acquired a further 400 ordinary shares. There have been no changes in any of the other Directors’ interests detailed above between 30 April 2016 and the date of this report.
‘Directors are not eligible for bonuses, pension benefits, share options or long-term incentive schemes.’

48 | F&C Global Smaller Companies PLC
As at 20 June 2016 the Lead Manager (including his connected persons) held 22,404 ordinary shares and 20,208 CULS in the Company.
Company PerformanceThe Board is responsible for the Company’s investment strategy and performance, whilst the management of the investment portfolio is delegated to the Manager. An explanation of the performance of the Company for the year ended 30 April 2016 is given in the Chairman’s Statement and Manager’s Review.
A comparison of the Company’s performance over the required seven year period is set out in the following graph. This shows the total return (assuming all dividends are invested) to ordinary shareholders against the Company’s benchmark.
Benchmark
50
100
150
200
250
300
350
Source: F&C & Thomson Reuters Eikon
F&C Global Smaller Companies Share Price
2009 2010 2011 2012 2013 2014 2015 2016
Shareholder total return vs Benchmark total return over seven years
On behalf of the Board Anthony Townsend Chairman 22 June 2016

Report and Accounts 2016 | 49
GOVERNANCE REPORT
Report of the Audit and Management Engagement Committee
OV
ER
VIE
WS
TR
AT
EG
IC R
EP
OR
TG
OV
ER
NA
NC
E R
EP
OR
TA
UD
ITO
RS
’ RE
PO
RT
FINA
NC
IAL R
EP
OR
TN
OT
ICE
OF M
EE
TIN
GO
TH
ER
INFO
RM
AT
ION
Report of the Audit and Management Engagement Committee
I am pleased to present to you the Report for the year ended 30 April 2016. We have spent time bedding in the significant regulatory changes introduced in the previous year and considering the new EU regulations concerning auditors and provision of non-audit services.
Role of the CommitteeThe primary responsibilities of the Audit and Management Engagement Committee (the “Committee”) are to: monitor the integrity of the financial reporting and statements of the Company; to oversee the audit of the annual accounts, preparation of the half yearly accounts and the internal control and risk management processes; and to assess the performance of the Manager and review the fees charged. The Committee met twice during the year; on both occasions with F&C’s Head of Trust Accounting, Head of Investment Trusts, the Risk Manager and the Lead Manager in attendance. PwC attended both meetings and met once in private session with the Committee.
Specifically, the Committee considered, monitored and reviewed the following matters:• The audited annual results statement and annual report and
accounts and the unaudited half-yearly report and accounts;• The accounting policies of the Company including the
application of new accounting standards;• The Principal Risks faced by the Company and the
effectiveness of the Company’s internal control and risk management environment, including consideration of the assumptions underlying the Board’s Future Prospects “Five Year Horizon” Statement;
• The effectiveness of the audit process and the current independence and objectivity of the external auditor, their reappointment, remuneration and terms of engagement;
• The policy on the engagement of the external auditor to supply non-audit services in light of changing regulations;
• The need for the Company to have its own internal audit function;
• The receipt of AAF and SSAE16 reports or their equivalent from F&C, the Custodian and a due diligence report from the Company’s share registrars;
• The performance of the Company’s third party service providers and administrators, other than F&C, and the fees charged in respect of those services;
• The performance of the Manager and their fees; and• The Committee’s terms of reference.
Comprehensive papers relating to each of these matters were prepared by either F&C or PwC for discussion. These were debated by the Committee and any recommendations were fully considered if there was a judgement to be applied in arriving at conclusions. Recommendations were then made to the Board as appropriate.
The Board retains ultimate responsibility for all aspects relating to external financial statements and other significant published financial information as is noted in the Statement of Directors’ Responsibilities on page 53. On broader control policy issues, the Committee has reviewed, and is satisfied with F&C’s Anti-Fraud, Bribery and Corruption Strategy and Policy and with the “whistleblowing” policy that has been put in place by F&C under which its staff may, in confidence, raise

50 | F&C Global Smaller Companies PLC
concerns about possible improprieties in financial reporting or other matters. The necessary arrangements are in place for communication to this Committee where matters might impact the Company with appropriate follow up action. In the year under review, there were no such concerns raised with the Committee.
Composition of the CommitteeThe Committee is currently composed of the full Board and its terms of reference can be found on the website at www.fandcglobalsmallers.com.
All the Committee members are independent non-executive Directors. The Committee was chaired during part of the year by Les Cullen and then latterly by Jo Dixon, who was appointed Chairman of the Committee from 23 July 2015. Jo is a Chartered Accountant and she is currently audit committee chairman of other listed companies. The other members of the Committee have a combination of financial,
investment and business experience through the senior posts held throughout their careers. The majority have a wide experience of the investment trust sector.
Internal controls and management of riskThe Board has overall responsibility for the Company’s systems of internal controls, for reviewing their effectiveness and ensuring that risk management and control processes are embedded in the day-to-day operations, which are managed via the Manager by F&C. The Committee has reviewed and reported to the Board on these controls, which aim to ensure that the assets of the Company are safeguarded, proper accounting records are maintained, and the financial information used within the business and for publication is reliable. Control of the risks identified, covering financial, operational, compliance and overall risk management, is exercised by the Committee through regular reports provided by F&C. The reports cover investment performance, performance attribution, compliance with
Significant Issues considered by the Committee for the year ended 30 April 2016
Matter Action
Investment Portfolio Valuation
The Company’s portfolio is predominantly invested in listed securities. Although the vast majority of the securities are highly liquid and listed on recognised stock exchanges, errors in the valuation could have a material impact on the Company’s NAV per share.
The Board reviews the full portfolio valuation twice a year and, since the implementation of the AIFMD in July 2014, the Committee receives quarterly reports from the AIFM and Depositary. The Committee reviewed F&C’s AAF Report for the year ended 31 October 2015 which is reported on by reputable independent external accountants and which details the systems, processes and controls around the daily pricing and valuation of securities. F&C has provided further evidence of controls operating satisfactorily in the period since that date.
The Committee reviewed the valuation of the unlisted portfolio in detail twice in the year.
Misappropriation of Assets
Misappropriation or non-existence of the Company’s investments or cash balances could have a material impact on its NAV per share.
The Committee reviewed F&C’s AAF Report for the year ended 31 October 2015 which details the controls around the reconciliation of F&C’s records to those of the Custodian. The Committee also reviewed the Custodian's annual internal control report, which is reported on by independent reporting accountants, and which provided details on its control environment. The Depositary issued reports confirming the safe custody of the Company’s assets for the year ended 30 April 2016.
Income Recognition
Incomplete or inaccurate recognition could have an adverse effect on the Company’s NAV and earnings per share and its level of dividend cover.
The Committee reviewed F&C’s AAF Report as above. It also compared the final level of income received against forecasts made during the year and discussed the accounting treatment of special dividends with F&C.
Performance Fee
Verification of F&C’s calculation of its £1,314,000 performance fee for the year.
The calculation, which is governed by strict measurement criteria set out in the investment management agreement, was reviewed by the Committee as part of the approval of the Report and Accounts.
Report and Accounts 2016 | 51
GOVERNANCE REPORT
OV
ER
VIE
WS
TR
AT
EG
IC R
EP
OR
TG
OV
ER
NA
NC
E R
EP
OR
TA
UD
ITO
RS
’ RE
PO
RT
FINA
NC
IAL R
EP
OR
TN
OT
ICE
OF M
EE
TIN
GO
TH
ER
INFO
RM
AT
ION
controls. The assessment included a review of the F&C risk management infrastructure and the report on policies and procedures in operation and tests for the period 1 January to 31 October 2015 (the “AAF Report”) and subsequent confirmation from F&C that there had been no material changes to the control environment. This has been prepared by F&C for all its investment trust clients to the standards of the Institute of Chartered Accountants in England and Wales Technical Release AAF (01/06). The AAF Report from independent reporting accountants KPMG sets out F&C’s control policies and procedures with respect to the management of clients’ investments and maintenance of their financial records. The effectiveness of these controls is monitored by F&C’s Group Audit and Compliance Committee, which receives regular reports from its Internal Audit department. Procedures are also in place to capture and evaluate any failings and weaknesses within F&C’s control environment and those extending to any outsourced service providers to ensure that action would be taken to remedy any significant issues. Any errors or breaches relating to the Company are reported at each Committee and Board meeting by F&C. No failings or weaknesses material to the overall control environment and financial statements were identified in the year. The Committee also reviewed the control reports of the Custodian, the Depositary and the Registrar and were satisfied that there were no material exceptions.
Through the reviews noted above and by direct enquiry of F&C and other relevant parties, the Committee and the Board have satisfied themselves that there were no material control failures or exceptions affecting the Company’s operations during the year nor to the date of this Report.
Based on the processes and controls in place within F&C, including confirmation by a reputable independent accounting firm that those controls operated satisfactorily, the Committee has concluded and the Board has concurred that there is no current need for the Company to have a separate internal audit function. The Board has, nevertheless, questioned whether exceptions identified in the AAF Report related to staff leaver access to systems constitutes a systemic risk and has sought and received assurances from F&C that the necessary controls have been tightened and are being adhered to.
External audit process and significant issues considered by the Committee In carrying out its responsibilities, the Committee has considered the planning arrangements, scope, materiality
agreed and regulatory investment restrictions, financial analyses, revenue estimates, performance of the third party administrators of the F&C savings plans and other relevant management issues.
The Committee has direct access to F&C’s Group Audit Committee and Head of Business Risk for internal audit and risk management activities. F&C’s Business Risk department provides regular control report updates to the Committee covering risk and compliance whilst any significant issues of direct relevance to the Company are reported to the Committee and Board immediately. F&C are integrating their control framework within the wider BMO organisation and the Committee is monitoring the continued awareness of Company relevant control issues.
The significant control issues considered by the Committee, and F&C’s response on policies and procedures in operation during the year, are summarised in the table on the previous page.
A key risk “radar” summary is produced by F&C in consultation with the Board to identify the risks to which the Company is exposed, the controls in place and the actions being taken to mitigate them. The Board has a robust process for considering the resulting risk matrix at each of its meetings and dynamically reviews the significance of the risks and the reasons for any changes. The Company’s Principal Risks are set out on page 30 with additional information given in note 26 on the accounts.
During the year, the Committee has in particular considered the UK Code issued by the Financial Reporting Council in September 2014 which strengthens the reporting on risk management and on viability. The Committee noted the robustness of the Board’s review of Principal Risks and of course participated as Board members themselves. The integration of these risks into the analyses underpinning the Future Prospects “Five Year Horizon” Statement on viability on page 31 was fully considered and the Committee concluded that the Board’s statement was soundly based. The period of five years was also agreed as appropriate for the reasons given in the statement.
The systems of internal controls are designed to manage rather than eliminate risk of failure to achieve business objectives and can only provide reasonable, but not absolute, assurance against material misstatement, or loss or fraud. Further to the review by the Committee, the Board has assessed the effectiveness of the Company’s internal

52 | F&C Global Smaller Companies PLC
every ten years. Given the EU regulations and transition rules on firm rotation, PwC will not be available for re-appointment as auditors beyond the Annual General Meeting following 17 June 2020. In the meantime, the Committee will continue to consider the appointment annually and the need for any change for reasons of quality or independence. At the forthcoming Annual General Meeting shareholders will be able to vote on the reappointment of PwC for the 2017 audit.
The Committee regards the continued independence of the auditor to be a matter of the highest priority and the provision of any non-audit services by PwC require advance approval by the Committee. The Company’s policy with regard to the provision of non-audit services is that appropriate safeguards should be in place and that the subject of the services should neither endanger PwC’s independence as auditor nor have a material effect on the financial statements. PwC non-audit services for the year on behalf of the Company were £5,000. The Committee considers the services to have been cost effective and not to have compromised the independence of PwC.
The new EU Regulations further constrain non-audit services provided by the auditor for accounting periods beginning on or after 16 June 2016. Prohibited services will include tax and systems work. Non-audit service fees will be capped at 70% of audit fees over an averaged three year period. The Company’s policy on non-audit services will be aligned to the finalised regulations. Auditor independence and objectivity will remain a primary concern of the Committee.
Committee evaluationThe activities of the Committee were evaluated as part of the Board appraisal process.
Jo Dixon Audit and Management Engagement Committee Chairman 22 June 2016
levels and conclusions of the external audit for the year. The table on page 50 describes the significant issues considered by the Committee in relation to the financial statements for the year and how these issues were addressed.
Procedures for investment valuation and existence, and recognition of income were the main areas of audit focus and testing, supplemented by specific focus on policy and disclosure changes relating to the implementation of new UK accounting standard FRS 102. The effects of the adoption of FRS 102 are described in note 2(a) on the accounts.
The Committee met in June 2016 to discuss the final draft of the Report and Accounts, with representatives of PwC and F&C in attendance. PwC submitted their Year End Report and confirmed that they had no reason not to issue an unqualified audit report in respect of the Report and Accounts. The Committee established that there were no material issues or findings arising which needed to be brought to the attention of the Board. Consequently, the Committee recommended to the Board that the Report and Accounts were in their view, fair, balanced and understandable in accordance with accounting standards and regulatory requirements. The Independent Auditor’s report, which sets out the unqualified audit opinion, the scope of the audit and the areas of focus, in compliance with applicable auditing standards, can be found on pages 56 to 61.
Auditor assessment, independence and appointmentThe Company reviews the reappointment of the auditor every year. As part of this year’s review of auditor independence and effectiveness, PwC have confirmed that they are independent of the Company and have complied with relevant auditing standards. In evaluating PwC, the Committee has taken into consideration the standing, skills and experience of the firm and the audit team. From direct observation and indirect enquiry of management, the Committee remains satisfied that PwC provide appropriate challenge in carrying out their responsibilities. The Committee has been satisfied with the effectiveness of PwC’s performance on the audit just completed. The fee for the audit was £34,000, having been agreed by the Committee. This compared with £33,850 last year as shown in Note 6 on the accounts.
PwC have been the auditor to the Company since its inception in 1889 and the appointment has not been put out to tender notwithstanding their long tenure. Under new mandatory audit rotation rules, however, the Company will be required to put the external audit out to tender at least

Report and Accounts 2016 | 53
GOVERNANCE REPORT
OV
ER
VIE
WS
TR
AT
EG
IC R
EP
OR
TG
OV
ER
NA
NC
E R
EP
OR
TA
UD
ITO
RS
’ RE
PO
RT
FINA
NC
IAL R
EP
OR
TN
OT
ICE
OF M
EE
TIN
GO
TH
ER
INFO
RM
AT
ION
Statement of Directors’ Responsibilities
Statement of Directors’ ResponsibilitiesThe Directors are responsible for preparing the Report and Accounts, the Directors’ Remuneration Report and the financial statements in accordance with applicable law and regulations.
Company law requires the directors to prepare financial statements for each financial year. Under that law the Directors have prepared the financial statements in accordance with United Kingdom Accounting Standards, comprising FRS 102 “The Financial Reporting Standard applicable in the UK and Republic of Ireland”, and applicable law (United Kingdom Generally Accepted Accounting Practice).
Under company law the Directors must not approve the financial statements unless they are satisfied that they give a true and fair view of the state of affairs of the Company and of the profit or loss of the Company for that period. In preparing these financial statements, the Directors are required to:• select suitable accounting policies and then apply them
consistently;• make judgements and accounting estimates that are
reasonable and prudent;• state whether applicable UK Accounting Standards
have been followed, subject to any material departures disclosed and explained in the financial statements respectively; and
• prepare the financial statements on the going concern basis unless it is inappropriate to presume that the company will continue in business.
The Directors confirm that they have complied with the above requirements in preparing the financial statements.
The Directors are responsible for keeping adequate accounting records that are sufficient to show and explain the Company’s transactions and disclose with reasonable accuracy at any time the financial position of the Company and enable them to ensure that the financial statements and the Directors’ Remuneration Report comply with the Companies Act 2006. They are also responsible for safeguarding the assets of the
Company and hence for taking reasonable steps for the prevention and detection of fraud and other irregularities.
The Report and Accounts is published on the www.fandcglobalsmallers.com website, which is maintained by F&C. The Directors are responsible for the maintenance and integrity of the Company’s website. The work undertaken by the auditors does not involve consideration of the maintenance and integrity of the website and, accordingly, the auditors accept no responsibility for any changes that have occurred to the financial statements since they were initially presented on the website. Visitors to the website need to be aware that legislation in the United Kingdom governing the preparation and dissemination of financial statements may differ from legislation in other jurisdictions.
Statement under Disclosure and Transparency Rule 4.1.12Each of the Directors listed on page 34 confirm to the best of their knowledge that: • the financial statements, prepared in accordance with
applicable accounting standards, give a true and fair view of the assets, liabilities, financial position and profit of the Company;
• the Strategic Report includes a fair review of the development and performance of the business and the position of the Company, together with a description of the principal risks and uncertainties that they face;
• the annual report and financial statements, taken as a whole, are fair, balanced and understandable and provide the information necessary for shareholders to assess the Company’s position and performance, business model and strategy; and
• the financial statements and the Directors’ Report include details on related party transactions.
On behalf of the Board Anthony Townsend Chairman 22 June 2016

54 | F&C Global Smaller Companies PLC
‘Each of the Directors confirms that, to the best of his/her knowledge and belief, there is no information relevant to the preparation of the Report and Accounts of which PwC is unaware and he or she has taken all the steps a Director might reasonably be expected to have taken to be aware of relevant audit information and to establish that PwC is aware of that information’

Report and Accounts 2016 | 55
STRATEGIC REPORT
OV
ER
VIE
WS
TR
AT
EG
IC R
EP
OR
TG
OV
ER
NA
NC
E R
EP
OR
TA
UD
ITO
RS
’ RE
PO
RT
FINA
NC
IAL R
EP
OR
TN
OT
ICE
OF M
EE
TIN
GO
TH
ER
INFO
RM
AT
ION

56 | F&C Global Smaller Companies PLC
Independent Auditors’ Report
Report on the financial statements
Our opinionIn our opinion, F&C Global Smaller Companies PLC’s financial statements (the “financial statements”):• give a true and fair view of the state of the company’s
affairs as at 30 April 2016 and of its profit and cash flows for the year then ended;
• have been properly prepared in accordance with United Kingdom Generally Accepted Accounting Practice; and
• have been prepared in accordance with the requirements of the Companies Act 2006.
What we have auditedThe financial statements, included within the Report and Accounts (the “Annual Report”), comprise:• the Balance Sheet as at 30 April 2016;• the Income Statement for the year then ended;• the Statement of Cash Flows for the year then ended;
• the Statement of Changes in Equity for the year then ended; and
• the notes to the financial statements, which include a summary of significant accounting policies and other explanatory information.
Certain required disclosures have been presented elsewhere in the Annual Report, rather than in the notes to the financial statements. These are cross-referenced from the financial statements and are identified as audited.
The financial reporting framework that has been applied in the preparation of the financial statements is United Kingdom Accounting Standards, comprising FRS 102 “The Financial Reporting Standard applicable in the UK and Republic of Ireland”, and applicable law (United Kingdom Generally Accepted Accounting Practice).
Audit Scope
Materiality
Areas offocus
Our audit approach
• Overall materiality: £5.5 million which represents 1% of Net assets..
• The company is a standalone Investment Trust Company and engages F&C Investment Business Limited (the ‘Manager’) to manage its assets.
• We tailored the scope of our audit taking into account the types of investments within the company, the involvement of the third parties referred to above, the accounting processes and controls, and the industry in which the company operates.
• Income.• Valuation and existence of investments.• Performance fees
JJ Overview

Report and Accounts 2016 | 57
INDEPENDENT AUDITORS’ REPORT
OV
ER
VIE
WS
TR
AT
EG
IC R
EP
OR
TG
OV
ER
NA
NC
E R
EP
OR
TA
UD
ITO
RS
’ RE
PO
RT
FINA
NC
IAL R
EP
OR
TN
OT
ICE
OF M
EE
TIN
GO
TH
ER
INFO
RM
AT
ION
JJ The scope of our audit and our areas of focusWe conducted our audit in accordance with International Standards on Auditing (UK and Ireland) (“ISAs (UK & Ireland)”).
We designed our audit by determining materiality and assessing the risks of material misstatement in the financial statements. In particular, we looked at where the directors made subjective judgements, for example in respect of significant accounting estimates that involved making assumptions and considering future events that are inherently uncertain. As in all of our audits we also addressed the risk of management override of internal controls, including evaluating
whether there was evidence of bias by the directors that represented a risk of material misstatement due to fraud.
The risks of material misstatement that had the greatest effect on our audit, including the allocation of our resources and effort, are identified as “areas of focus” in the table below. We have also set out how we tailored our audit to address these specific areas in order to provide an opinion on the financial statements as a whole, and any comments we make on the results of our procedures should be read in this context. This is not a complete list of all risks identified by our audit.
Area of focus How our audit addressed the area of focus
Income
We focused on the accuracy and completeness of dividend income recognition and its presentation in the Income Statement as set out in the requirements of The Association of Investment Companies Statement of Recommended Practice (the ‘AIC SORP’).
This is because incomplete or inaccurate income could have a material impact on the company’s net asset value and dividend cover.
We assessed the accounting policy for income recognition for compliance with accounting standards and the AIC SORP and performed testing to check that income had been accounted for in accordance with this stated accounting policy.
We found that the accounting policies implemented were in accordance with accounting standards and the AIC SORP, and that income has been accounted for in accordance with the stated accounting policy.
We understood and assessed the design and implementation of key controls surrounding income recognition.
In addition, we tested dividend receipts by agreeing the dividend rates from a sample of investments to independent third party sources.
No misstatements were identified which required reporting to those charged with governance.
To test for completeness, we tested that the appropriate dividends had been received in the year by reference to independent data of dividends declared by a sample of investment holdings in the portfolio.
Our testing did not identify any unrecorded dividends.
We tested the allocation and presentation of dividend income between the income and capital return columns of the Income Statement in line with the requirements set out in the AIC SORP. We then tested the validity of income and capital special dividends to independent third party sources.
We did not find any special dividends that were not treated in accordance with the AIC SORP.

58 | F&C Global Smaller Companies PLC
JJ How we tailored the audit scopeWe tailored the scope of our audit to ensure that we performed enough work to be able to give an opinion on the financial statements as a whole, taking into account the types of investments within the company, the involvement of the Manager and State Street Bank and Trust Company (the “Administrator”), the accounting processes and controls, and the industry in which the company operates.
The Manager delegates certain accounting and administrative functions to the Administrator on which they report to the Manager.
As part of our risk assessment, we assessed the control environment in place at both the Manager and the Administrator to the extent relevant to our audit. This assessment of the operating and accounting structure in place at both organisations involved obtaining and reading the relevant control reports issued by the independent auditor of the Manager and the Administrator in accordance with generally accepted assurance standards for such work. We then identified those key controls at the Administrator on
which we could place reliance to provide audit evidence. We also assessed the gap period of one month between the period covered by the controls report and the year-end of the company. Following this assessment, we applied professional judgement to determine the extent of testing required over each balance in the financial statements, including whether we needed to perform additional testing in respect of those key controls to support our substantive work. For the purposes of our audit, we determined that additional testing of controls in place at the Administrator was not required because additional substantive testing was performed.
JJ MaterialityThe scope of our audit was influenced by our application of materiality. We set certain quantitative thresholds for materiality. These, together with qualitative considerations, helped us to determine the scope of our audit and the nature, timing and extent of our audit procedures on the individual financial statement line items and disclosures and in evaluating the effect of misstatements, both individually and on the financial statements as a whole.
Area of focus How our audit addressed the area of focus
Valuation and existence of investments
The investment portfolio at the year-end principally comprised listed equity investments valued at £577.3m.
We focused on the valuation and existence of investments because investments represent the principal element of the net asset value as disclosed on the Balance Sheet in the financial statements.
We tested the valuation of the listed equity investments by agreeing the prices used in the valuation to independent third party sources.
No misstatements were identified by our testing which required reporting to those charged with governance.
We tested the existence of the investment portfolio by agreeing the holdings for listed equity investments to an independent custodian confirmation from JP Morgan Chase Bank.
No differences were identified.
Performance fees
A performance fee is payable for the year of £1.3m. We focused on this area because the performance fee is calculated using a complex methodology as set out in the Investment Management Agreement between the company and the Manager.
We independently recalculated the performance fee of £1.3m using the methodology set out in the Investment Management Agreement and agreed the inputs to the calculation, including the benchmark data, to independent third party sources, where applicable.
No misstatements were identified which required reporting to those charged with governance.
We tested the allocation of the performance fee between the income and capital return columns of the Income Statement with reference to the accounting policy as set out on page 69.
We found that the allocation of the performance fee was consistent with the accounting policy.

Report and Accounts 2016 | 59
INDEPENDENT AUDITORS’ REPORT
OV
ER
VIE
WS
TR
AT
EG
IC R
EP
OR
TG
OV
ER
NA
NC
E R
EP
OR
TA
UD
ITO
RS
’ RE
PO
RT
FINA
NC
IAL R
EP
OR
TN
OT
ICE
OF M
EE
TIN
GO
TH
ER
INFO
RM
AT
ION
Based on our professional judgement, we determined materiality for the financial statements as a whole as follows:
Overall materiality
£5.5 million (2015: £5.2 million).
How we determined it
1% of net assets.
Rationale for benchmark applied
We have applied this benchmark, a generally accepted auditing practice for investment trust audits, in the absence of indicators that an alternative benchmark would be appropriate and because we believe this provides an appropriate and consistent year-on-year basis for our audit.
We agreed with the Audit and Management Engagement Committee that we would report to them misstatements identified during our audit above £276,000 (2015: £258,000) as well as misstatements below that amount that, in our view, warranted reporting for qualitative reasons.
JJ Going concernUnder the Listing Rules we are required to review the directors’ statement, set out on page 36, in relation to going concern. We have nothing to report having performed our review.
Under ISAs (UK & Ireland) we are required to report to you if we have anything material to add or to draw attention to in relation to the directors’ statement about whether they considered it appropriate to adopt the going concern basis in preparing the financial statements. We have nothing material to add or to draw attention to.
As noted in the directors’ statement, the directors have concluded that it is appropriate to adopt the going concern basis in preparing the financial statements. The going concern basis presumes that the company has adequate resources to remain in operation, and that the directors intend it to do so, for at least one year from the date the financial statements were signed. As part of our audit we have concluded that the directors’ use of the going concern basis is appropriate. However, because not all future events or conditions can be predicted, these statements are not a guarantee as to the company’s ability to continue as a going concern.
Other required reportingConsistency of other informationJJ Companies Act 2006 opinion
In our opinion, the information given in the Strategic Report and the Directors’ Report for the financial year for which the financial statements are prepared is consistent with the financial statements.
JJ ISAs (UK & Ireland) reportingUnder ISAs (UK & Ireland) we are required to report to you if, in our opinion:• information in the Annual Report is:
– materially inconsistent with the information in the audited financial statements; or
– apparently materially incorrect based on, or materially inconsistent with, our knowledge of the company acquired in the course of performing our audit; or
– otherwise misleading.We have no exceptions to report.
• the statement given by the directors on page 35, in accordance with provision C.1.1 of the UK Corporate Governance Code (the “Code”), that they consider the Annual Report taken as a whole to be fair, balanced and understandable and provides the information necessary for members to assess the company’s position and performance, business model and strategy is materially inconsistent with our knowledge of the company acquired in the course of performing our audit.
We have no exceptions to report.
• the section of the Annual Report on page 49, as required by provision C.3.8 of the Code, describing the work of the Audit and Management Engagement Committee does not appropriately address matters communicated by us to the Audit and Management Engagement Committee.
We have no exceptions to report.
JJ The directors’ assessment of the prospects of the company and of the principal risks that would threaten the solvency or liquidity of the company
Under ISAs (UK & Ireland) we are required to report to you if we have anything material to add or to draw attention to in relation to:
• the directors’ confirmation on page 30 of the Annual Report, in accordance with provision C.2.1 of the Code, that they have carried out a robust assessment of the
60 | F&C Global Smaller Companies PLC
principal risks facing the company, including those that would threaten its business model, future performance, solvency or liquidity.
We have nothing material to add or to draw attention to.
• the disclosures in the Annual Report that describe those risks and explain how they are being managed or mitigated.We have nothing material to add or to draw attention to.
• the directors’ explanation on page 31 of the Annual Report, in accordance with provision C.2.2 of the Code, as to how they have assessed the prospects of the company, over what period they have done so and why they consider that period to be appropriate, and their statement as to whether they have a reasonable expectation that the company will be able to continue in operation and meet its liabilities as they fall due over the period of their assessment, including any related disclosures drawing attention to any necessary qualifications or assumptions.We have nothing material to add or to draw attention to.
Under the Listing Rules we are required to review the directors’ statement that they have carried out a robust assessment of the principal risks facing the company and the directors’ statement in relation to the longer-term viability of the company. Our review was substantially less in scope than an audit and only consisted of making inquiries and considering the directors’ process supporting their statements; checking that the statements are in alignment with the relevant provisions of the Code; and considering whether the statements are consistent with the knowledge acquired by us in the course of performing our audit. We have nothing to report having performed our review.
JJ Adequacy of accounting records and information and explanations received
Under the Companies Act 2006 we are required to report to you if, in our opinion:• we have not received all the information and explanations
we require for our audit; or• adequate accounting records have not been kept, or
returns adequate for our audit have not been received from branches not visited by us; or
• the financial statements and the part of the Directors’ Remuneration Report to be audited are not in agreement with the accounting records and returns.
We have no exceptions to report arising from this responsibility.
JJ Directors’ remunerationDirectors’ remuneration report – Companies Act 2006 opinionIn our opinion, the part of the Directors’ Remuneration Report to be audited has been properly prepared in accordance with the Companies Act 2006.
JJ Other Companies Act 2006 reportingUnder the Companies Act 2006 we are required to report to you if, in our opinion, certain disclosures of directors’ remuneration specified by law are not made. We have no exceptions to report arising from this responsibility.
JJ Corporate governance statementUnder the Listing Rules we are required to review the part of the Corporate Governance Statement relating to ten further provisions of the Code. We have nothing to report having performed our review.
Responsibilities for the financial statements and the audit
Our responsibilities and those of the directorsAs explained more fully in the Statement of Directors’ Responsibilities set out on page 53, the directors are responsible for the preparation of the financial statements and for being satisfied that they give a true and fair view.
Our responsibility is to audit and express an opinion on the financial statements in accordance with applicable law and ISAs (UK & Ireland). Those standards require us to comply with the Auditing Practices Board’s Ethical Standards for Auditors.
This report, including the opinions, has been prepared for and only for the company’s members as a body in accordance with Chapter 3 of Part 16 of the Companies Act 2006 and for no other purpose. We do not, in giving these opinions, accept or assume responsibility for any other purpose or to any other person to whom this report is shown or into whose hands it may come save where expressly agreed by our prior consent in writing.
What an audit of financial statements involvesAn audit involves obtaining evidence about the amounts and disclosures in the financial statements sufficient to give reasonable assurance that the financial statements are free

Report and Accounts 2016 | 61
INDEPENDENT AUDITORS’ REPORT
OV
ER
VIE
WS
TR
AT
EG
IC R
EP
OR
TG
OV
ER
NA
NC
E R
EP
OR
TA
UD
ITO
RS
’ RE
PO
RT
FINA
NC
IAL R
EP
OR
TN
OT
ICE
OF M
EE
TIN
GO
TH
ER
INFO
RM
AT
ION
from material misstatement, whether caused by fraud or error. This includes an assessment of: • whether the accounting policies are appropriate to the
company’s circumstances and have been consistently applied and adequately disclosed;
• the reasonableness of significant accounting estimates made by the directors; and
• the overall presentation of the financial statements.
We primarily focus our work in these areas by assessing the directors’ judgements against available evidence, forming our own judgements, and evaluating the disclosures in the financial statements.
We test and examine information, using sampling and other auditing techniques, to the extent we consider necessary to provide a reasonable basis for us to draw conclusions. We obtain audit evidence through testing the effectiveness of controls, substantive procedures or a combination of both.
In addition, we read all the financial and non-financial information in the Annual Report to identify material inconsistencies with the audited financial statements and to identify any information that is apparently materially incorrect based on, or materially inconsistent with, the knowledge acquired by us in the course of performing the audit. If we become aware of any apparent material misstatements or inconsistencies we consider the implications for our report
Jeremy Jensen (Senior Statutory Auditor) For and on behalf of PricewaterhouseCoopers LLP Chartered Accountants and Statutory Auditors London 22 June 2016

62 | F&C Global Smaller Companies PLC
‘ Diluted revenue per share rose by 8.4% as investment income remained strong and expenses fell in the year’

Report and Accounts 2016 | 63
FINANCIAL REPORT
OV
ER
VIE
WS
TR
AT
EG
IC R
EP
OR
TG
OV
ER
NA
NC
E R
EP
OR
TA
UD
ITO
RS
’ RE
PO
RT
FINA
NC
IAL R
EP
OR
TN
OT
ICE
OF M
EE
TIN
GO
TH
ER
INFO
RM
AT
ION
Report and Accounts 2016 | 63
Income Statement
for the year ended 30 April
Revenue£’000s
Capital£’000s
2016 Total
£’000s Revenue
£’000sCapital£’000s
2015 Total
£’000s
11 Gains on investments – 16,820 16,820 – 69,146 69,146
20 Foreign exchange gains 17 217 234 8 483 491
3 Income 8,486 – 8,486 7,786 – 7,786
4 4 Management fee (498) (1,495) (1,993) (436) (1,307) (1,743)
5 Performance fee – (1,314) (1,314) – (983) (983)
6 Other expenses (618) (22) (640) (777) (24) (801)
Net return before finance costs and taxation 7,387 14,206 21,593 6,581 67,315 73,896
7 7 Finance costs (435) (1,306) (1,741) (533) (1,598) (2,131)
Net return on ordinary activities before taxation 6,952 12,900 19,852 6,048 65,717 71,765
8 8 Taxation on ordinary activities (500) – (500) (389) – (389)
Net return attributable to equity shareholders 6,452 12,900 19,352 5,659 65,717 71,376
9 9 Return per share (basic) – pence 11.86 23.72 35.58 10.87 126.22 137.09
9 9 Return per share (diluted) – pence 11.78 23.72 35.58 10.87 121.02 131.90
The total column of this statement is the profit and loss account of the Company.All revenue and capital items in the above statement derive from continuing operations.A statement of total recognised gains and losses is not required as all gains and losses of the Company have been reflected in the above statement.
The notes on pages 67 to 83 form an integral part of the financial statements.
Rev
enue
not
es
Cap
ital n
otes

64 | F&C Global Smaller Companies PLC64 | F&C Global Smaller Companies PLC
Statement of Changes in Equity
for the year ended 30 April 2016
Not
es
Share capital£’000s
Share premium account £’000s
Capital redemption
reserve£’000s
Equity component
of CULS £’000s
Capital reserves
£’000s
Revenue reserves
£’000s
Total shareholders’
funds£’000s
Balance at 30 April 2015 13,281 119,394 16,158 1,312 355,285 11,533 516,963
Movements during the year ended 30 April 2016
10 Dividends paid – – – – – (5,342) (5,342)
Shares issued 569 21,555 – – – – 22,124
14 Conversion of Convertible Unsecured Loan Stock (“CULS”) 3 97 – (5) – – 95
Net return attributable to equity shareholders – – – – 12,900 6,452 19,352
Balance at 30 April 2016 13,853 141,046 16,158 1,307 368,185 12,643 553,192
for the year ended 30 April 2015
Not
es
Share capital£’000s
Share premium account £’000s
Capital redemption
reserve£’000s
Equity component
of CULS £’000s
Capital reserves£’000s
Revenue reserves£’000s
Total shareholders’
funds£’000s
Balance at 30 April 2014 12,803 102,460 16,158 – 289,568 10,097 431,086
Movements during the year ended 30 April 2015
10 Dividends paid – – – – – (4,223) (4,223)
14 CULS – – – 1,339 – – 1,339
Issue costs of equity component of CULS – – – (27) – – (27)
Shares issued 477 16,889 – – – – 17,366
14 Conversion of CULS 1 45 – – – – 46
Net return attributable to equity shareholders – – – – 65,717 5,659 71,376
Balance at 30 April 2015 13,281 119,394 16,158 1,312 355,285 11,533 516,963
The notes on pages 67 to 83 form an integral part of the financial statements.

Report and Accounts 2016 | 65
FINANCIAL REPORT
OV
ER
VIE
WS
TR
AT
EG
IC R
EP
OR
TG
OV
ER
NA
NC
E R
EP
OR
TA
UD
ITO
RS
’ RE
PO
RT
FINA
NC
IAL R
EP
OR
TN
OT
ICE
OF M
EE
TIN
GO
TH
ER
INFO
RM
AT
ION
Report and Accounts 2016 | 65
Balance Sheet
at 30 April
Not
es
£’000s2016
£’000s £’000s 2015
£’000s
Fixed assets
11 Investments 581,611 548,639
Current assets
12 Debtors 2,529 4,086
Cash at bank and short-term deposits 12,249 13,502
14,778 17,588
Creditors: amounts falling due within one year
13 Creditors (4,787) (11,135)
Net current assets 9,991 6,453
Total assets less current liabilities 591,602 555,092
Creditors: amounts falling due after more than one year
14 Convertible Unsecured Loan Stock (“CULS”) (38,410) (38,129)
Net assets 553,192 516,963
Capital and reserves
16 Share capital 13,853 13,281
17 Share premium account 141,046 119,394
18 Capital redemption reserve 16,158 16,158
19 Equity component of CULS 1,307 1,312
20 Capital reserves 368,185 355,285
20 Revenue reserve 12,643 11,533
539,339 503,682
Total shareholders’ funds 553,192 516,963
21 Net asset value per share (basic) – pence 998.34 973.11
21 Net asset value per share (diluted) – pence 994.50 970.25
The notes on pages 67 to 83 form an integral part of the financial statements.
The Financial Statements were approved by the Board on 22 June 2016 and signed on its behalf by
Anthony Townsend, Chairman

66 | F&C Global Smaller Companies PLC66 | F&C Global Smaller Companies PLC
Statement of Cash Flows
for the year ended 30 April
Not
es
2016
£’000s 2015
£’000s
22 Cash flows from operating activities 2,617 2,609
Investing activities
Purchases of investments (227,066) (223,013)
Sales of investments 206,005 173,737
Other capital charges (21) (25)
Cash flows from investing activities (21,082) (49,301)
Cash flows before financing activities (18,465) (46,692)
Financing activities
Ordinary dividends paid (5,342) (4,223)
CULS issued – 40,000
Issue costs of CULS – (795)
Debenture repaid – (10,000)
Proceeds from issue of shares 22,320 18,016
Cash flows from financing activities 16,978 42,998
Net movement in cash and cash equivalents (1,487) (3,694)
Cash and cash equivalents at the beginning of the year 13,502 16,705
Effect of movement in foreign exchange 234 491
Cash and cash equivalents at the end of the year 12,249 13,502
Represented by:
Cash at bank and short-term deposits 12,249 13,502
The notes on pages 67 to 83 form an integral part of the financial statements.

Report and Accounts 2016 | 67
FINANCIAL REPORT
OV
ER
VIE
WS
TR
AT
EG
IC R
EP
OR
TG
OV
ER
NA
NC
E R
EP
OR
TA
UD
ITO
RS
’ RE
PO
RT
FINA
NC
IAL R
EP
OR
TN
OT
ICE
OF M
EE
TIN
GO
TH
ER
INFO
RM
AT
ION
Report and Accounts 2016 | 67
Notes on the Accounts
1. General informationF&C Global Smaller Companies PLC is an investment company incorporated in the United Kingdom with a listing on the London Stock Exchange. The Company registration number is 28264 and the registered office is Exchange House, Primrose Street, London, EC2A 2NY, England.
The Company conducts its affairs so as to qualify as an investment trust under the provisions of section 1158 of the Corporation Tax Act 2010 (“section 1158”). Approval of the Company under section 1158 has been received. The Company intends to conduct its affairs so as to enable it to continue to comply with the requirements. Such approval exempts the Company from UK Corporation Tax on gains realised on its portfolio of fixed asset investments.
2. Significant accounting policies
(a) Basis of accountingThe accounts of the Company have been prepared on a going concern basis under the historical cost convention, modified to include fixed asset investments at fair value, and in accordance with the Companies Act 2006, Accounting Standards applicable in the United Kingdom and with the Statement of Recommended Practice “Financial Statements of Investment Trust Companies and Venture Capital Trusts” (“SORP”) issued in November 2014. The Company is applying for the first time Financial Reporting Standard (FRS 102), including amendments thereto issued in March 2016 concerning fair value hierarchy disclosures, applicable in the UK and Republic of Ireland. This forms part of the revised Generally Accepted Accounting Practice (New UK GAAP) issued by the Financial Reporting Council (FRC) in 2012 and 2013. As a result of the first time adoption of New UK GAAP, presentation formats have been amended where required. The prior year net return attributable to ordinary shareholders and total shareholders’ funds remain unchanged from under the old UK GAAP basis. The prior year Statement of Cash Flows has been amended to reflect presentational changes required under FRS 102 and does not include any other material changes.
There have been no other significant changes to the Company’s accounting policies during the year ended 30 April 2016.
The functional and presentational currency of the Company is pounds sterling because that is the currency of the primary economic environment in which the Company operates.
In accordance with the SORP, the Income Statement has been analysed between a revenue account (dealing with items of a revenue nature) and a capital account (relating to items of a capital nature). Revenue returns include, but are not limited to, dividend income and operating expenses and tax (insofar as the expenses and tax are not allocated to capital, as described in note 2(b) below). Net revenue returns are allocated via the revenue account to the revenue reserve, out of which interim and final dividend payments are made. Capital returns include, but are not limited to, realised and unrealised profits and losses on fixed asset investments and currency profits and losses on cash and borrowings. The Company’s Articles prohibit the distribution of net capital returns by way of dividend. Such returns are allocated via the capital account to the capital reserves. Dividends paid to equity shareholders are shown in the Statement of Changes in Equity.
(b) Principal accounting policiesThe policies set out below have been applied consistently throughout the year.
(i) Financial instrumentsFinancial instruments include fixed asset investments, derivative assets and liabilities, long-term debt instruments, cash and short-term deposits, debtors and creditors. Accounting standards recognise a hierarchy of fair value measurements for financial instruments measured at fair value on the Balance Sheet which gives the highest priority to unadjusted quoted prices in active markets for identical assets or liabilities (level 1) and the lowest priority to unobservable inputs (level 3). The classification of financial instruments depends on the lowest significant applicable input, as follows:
Level 1 – Unadjusted, fully accessible and current quoted prices in active markets for identical assets or liabilities. Included within this category are investments listed on any recognised stock exchange or quoted on AIM in the UK.

68 | F&C Global Smaller Companies PLC68 | F&C Global Smaller Companies PLC
2. Significant accounting policies (continued) Level 2 – Quoted prices for similar assets or liabilities, or other directly or indirectly observable inputs which exist for the duration of the
period of investment. Examples of such instruments would be those for which the quoted price has been suspended, forward exchange contracts and certain other derivative instruments.
Level 3 – External inputs are unobservable. Value is the Directors’ best estimate of fair value, based on advice from relevant knowledgeable experts, use of recognised valuation techniques and on assumptions as to what inputs other market participants would apply in pricing the same or similar instrument. Included within this category are unquoted investments.
(ii) Fixed asset investments and derivative financial instruments.As an investment trust, the Company measures its fixed asset investments and derivative financial instruments at “fair value through profit or loss” and treats all transactions on the realisation and revaluation of investments and derivative financial instruments as transactions on the capital account. Purchases are recognised on the relevant trade date, inclusive of expenses which are incidental to their acquisition. Sales are also recognised on the trade date, after deducting expenses incidental to the sales.
Quoted investments are valued at bid value at the close of business on the relevant date on the exchange on which the investment is quoted. Investments which are not quoted or which are not frequently traded are stated at Directors’ best estimate of fair value. In arriving at their estimate, the Directors make use of recognised valuation techniques and may take account of recent arm’s length transactions in the same or similar investment instruments. Where no reliable fair value can be estimated, investments are carried at cost less any provision for impairment.
(iii) Debt instrumentsInterest-bearing loans and overdrafts are recorded initially at the proceeds received, net of issue costs, irrespective of the duration of the instrument. No debt instruments held during the year required hierarchical classification.
Finance charges, including interest, are accrued using the effective interest rate method and are added to the carrying amount of the instrument to the extent that they are not settled in the period. See (vi) below for allocation of finance charges within the Income Statement.
In July 2014 the Company issued CULS, the accounting policies for which are set out below.(a) The CULS are regarded as a compound instrument comprising a liability and an equity component. The fair value of the liability
component, assessed at the date of issue of the CULS, was estimated based on an equivalent non-convertible security. The fair value of the equity component was derived by deducting the CULS issue proceeds from the fair value of the liability component.
(b) The liability component is subsequently measured at amortised cost using the effective interest rate. The equity component value remains unchanged over the life of the CULS.
(c) Costs incurred directly as a result of the CULS issue are allocated between the liability and equity components in proportion to the split of the proceeds. Expenses allocated to the liability component are amortised over the life of the CULS using the effective interest rate.
(d) Finance costs on the CULS, comprising interest payable and amortised costs, are calculated based on an effective interest rate of 4.7%. Amortised costs are allocated against the CULS liability.
(e) On conversion of the CULS, equity is issued and the relevant liability component is de-recognised.
Further details on the CULS can be found in note 14.
(iv) Foreign currencyMonetary assets, monetary liabilities and equity investments denominated in a foreign currency are expressed in sterling at rates of exchange ruling at the balance sheet date. Purchases and sales of investment securities, derivative financial instruments, dividend income, interest income and expenses are translated at the rates of exchange prevailing at the respective dates of such transactions.
Foreign exchange profits and losses on fixed asset investments and derivative financial instruments are included within the changes in fair value in the capital account. Foreign exchange profits and losses on other currency balances are separately credited or charged to the capital account except where they relate to revenue items when they are credited or charged to the revenue account.

Report and Accounts 2016 | 69
FINANCIAL REPORT
OV
ER
VIE
WS
TR
AT
EG
IC R
EP
OR
TG
OV
ER
NA
NC
E R
EP
OR
TA
UD
ITO
RS
’ RE
PO
RT
FINA
NC
IAL R
EP
OR
TN
OT
ICE
OF M
EE
TIN
GO
TH
ER
INFO
RM
AT
ION
Report and Accounts 2016 | 69
2. Significant accounting policies (continued) (v) Income
Income from equity shares is brought into the revenue account (except where, in the opinion of the Directors, its nature indicates it should be recognised within the capital account) on the ex-dividend date or, where no ex-dividend date is quoted, when the Company’s right to receive payment is established. Fixed returns on non-equity shares and debt securities are recognised on a time apportionment basis so as to reflect the effective yield on the investment.
Dividends are accounted for in accordance with FRS102 on the basis of income actually receivable, without adjustment for the tax credit attaching to the dividends. Dividends from overseas companies are shown gross of withholding tax.
Where the Company has elected to receive its dividends in the form of additional shares rather than in cash (scrip dividends), the amount of the cash dividend foregone is recognised as income. Any excess in the value of the shares received over the amount of the cash dividend foregone is recognised in the capital account.
Underwriting commission is recognised when the Company’s right to receive payment is established. Deposit interest is accounted for on an accruals basis.
(vi) Expenses, including finance chargesExpenses are charged to the revenue account of the Income Statement, except as noted below: – expenses incidental to the acquisition or disposal of fixed asset investments and derivative financial instruments are included
within the cost of the investments and derivative financial instruments or deducted from the disposal proceeds of investments and derivative financial instruments and are thus charged to capital reserve – arising on investments sold via the capital account;
– 75% of management fees and 75% of finance costs (including finance costs on CULS) are allocated to capital reserve – arising on investments sold via the capital account, in accordance with the Board’s long-term expected split of returns from the investment portfolio of the Company.
– performance fees insofar as they relate to capital performance are allocated to capital reserve – arising on investments sold; and – all expenses are accounted for on an accruals basis.
(vii) TaxationDeferred tax is provided in accordance with FRS102 on all timing differences that have originated but not reversed by the balance sheet date, based on the tax rates that have been enacted at the balance sheet date and that are expected to apply in the period when the liability is settled or the asset is realised. Deferred tax assets are only recognised if it is considered more likely than not that there will be suitable profits from which the future reversal of timing differences can be deducted. In line with the recommendations of the SORP, the allocation method used to calculate the tax relief on expenses charged to capital is the “marginal” basis. Under this basis, if taxable income is capable of being offset entirely by expenses charged through the revenue account, then no tax relief is transferred to the capital account.
(viii) Share PremiumThe surplus of net proceeds received from the issue of new ordinary shares over the nominal value of such shares is credited to this account. The nominal value of the shares issued is recognised in share capital.
(ix) Capital Redemption ReserveThe nominal value of ordinary share capital purchased and cancelled is transferred out of called-up share capital and into the capital redemption reserve, which is a non-distributable reserve, on the trade date.

70 | F&C Global Smaller Companies PLC70 | F&C Global Smaller Companies PLC
2. Significant accounting policies (continued) (x) Capital Reserves
These are distributable reserves which may be utilised for the repurchase of share capital:Capital reserve – arising on investments soldThe following are accounted for in this reserve: – 75% of management fees and finance costs as set out in note 2(b)(vi); – performance fees as set out in note 2(b)(vi); – gains and losses on the realisation of fixed asset investments and derivative financial instruments; – foreign exchange differences of a capital nature; – costs of professional advice, including related irrecoverable VAT, relating to the capital structure of the Company; – other capital charges and credits charged or credited to this account in accordance with the above policies; and – costs of purchasing ordinary share capital.
Capital reserve – arising on investments heldThe following are accounted for in this reserve: – increases and decreases in the valuation of fixed asset investments held at the year end.
3. Income
2016 £’000s
2015 £’000s
Income from investments
Dividends 8,277 7,591
Scrip dividends 166 169
8,443 7,760
Other Income
Interest on cash and short-term deposits 41 21
Underwriting commission 2 5
Total income 8,486 7,786
Total income comprises:
Dividends 8,443 7,760
Other income 43 26
8,486 7,786
Income from investments comprises:
Quoted 8,443 7,729
Unquoted – 31
8,443 7,760

Report and Accounts 2016 | 71
FINANCIAL REPORT
OV
ER
VIE
WS
TR
AT
EG
IC R
EP
OR
TG
OV
ER
NA
NC
E R
EP
OR
TA
UD
ITO
RS
’ RE
PO
RT
FINA
NC
IAL R
EP
OR
TN
OT
ICE
OF M
EE
TIN
GO
TH
ER
INFO
RM
AT
ION
Report and Accounts 2016 | 71
4. Management fees
Revenue
£’000s Capital £’000s
2016 Total
£’000s
Revenue
£’000s Capital £’000s
2015 Total
£’000s
Management fee 498 1,495 1,993 436 1,307 1,743
The Manager, F&C Investment Business Limited (“FCIB”) provides investment management, marketing and general administrative services to the Company. The management fee is an amount equal to 0.4% per annum (0.55% with effect from 1 May 2016), payable monthly in arrears, of net assets managed by the Manager at the calculation date. Investments made by the Company in third party collective investment schemes are subject to a management fee, payable monthly in arrears to the Manager, of 0.25% (0.275% with effect from 1 May 2016) per annum of the month end market value of those investments. The management agreement may be terminated upon six months’ notice given by either party.
The fees have been allocated 75% to capital reserve in accordance with accounting policies.
Changes to the management fee arrangements, including the removal of the performance fee element, take effect from 1 May 2016 and are explained in the Chairman’s Statement on page 9 and the Directors’ Report on page 39.
5. Performance fee
2016 Capital £’000s
2015 Capital £’000s
Performance fee 1,314 983
Under the terms of the fee agreement in place to 30 April 2016, the Manager was entitled to a performance fee, payable annually, equal to 10% of the value of any outperformance in the year by the net assets (with debt at market value, adjusted for share issues, buybacks and dividends) compared to the Benchmark Index. The fee is subject to a maximum absolute cap (including both the management fee and the performance fee) that the Manager can earn in any one year of 1% of average month-end net assets.
With effect from 1 May 2016, no performance fee will be payable to the Manager.
The performance fee is allocated 100% to capital reserve – arising on investments sold.
6. Other expenses
2016 £’000s
2015 £’000s
Auditors’ remuneration:
audit services* 37 38
non-audit services* 5 6
Directors’ fees for services to the Company† 165 145
Marketing 148 170
Printing and postage 73 103
Custody fees 25 24
Depositary fees 56 41
Sundry expenses 109 250
618 777
* Auditors’ remuneration for audit services, exclusive of VAT, amounts to £34,000 (2015: £33,850). Total auditors’ remuneration for non-audit services, exclusive of VAT, amounts to £5,000 (2015: £6,000) comprising taxation compliance services. No part of these amounts was charged to capital reserves (2015: £nil).
† See the Directors’ Remuneration Report on page 47.
All expenses are stated gross of irrecoverable VAT, where applicable.

72 | F&C Global Smaller Companies PLC72 | F&C Global Smaller Companies PLC
7. Finance costs
2016 2015
Revenue £’000s
Capital £’000s
Total £’000s
Revenue £’000s
Capital £’000s
Total £’000s
CULS interest payable and amortised costs 435 1,306 1,741 341 1,022 1,363
Debenture interest – – – 192 576 768
435 1,306 1,741 533 1,598 2,131
Finance costs have been allocated 75% to capital reserve in accordance with the Company’s accounting policies.
8. Taxation on ordinary activities
(a) Analysis of tax charge for the year
2016 2015
Revenue £’000s
Capital £’000s
Total £’000s
Revenue £’000s
Capital £’000s
Total £’000s
Corporation tax payable at 20.0% (2015: 20.9%) – – – – – –
Overseas taxation 500 – 500 389 – 389
Current tax charge for the year (note 8(b)) 500 – 500 389 – 389
Deferred taxation on accrued income – – – – – –
Taxation on ordinary activities 500 – 500 389 – 389
The tax assessed is lower than the standard rate of Corporate Tax in the UK (2015: lower).
(b) Factors affecting tax charge for the year
2016 2015
Revenue £’000s
Capital £’000s
Total £’000s
Revenue £’000s
Capital £’000s
Total £’000s
Return on ordinary activities before tax 6,952 12,900 19,857 6,048 65,717 71,765
Return on ordinary activities multiplied by the standard rate of corporation tax of 20.0% (2015: 20.9%)
1,391 2,580 3,971 1,264 13,735 14,999
Effects of:
Dividends* (1,689) – (1,689) (1,622) – (1,622)
Expenses not deductible for tax purposes 17 – 17 18 – 18
Overseas tax in excess of double taxation relief 500 – 500 389 – 389
Expenses not utilised in the year 281 827 1,108 340 818 1,158
Capital returns* – (3,407) (3,407) – (14,553) (14,553)
Total current taxation (note 8(a)) 500 – 500 389 – 389
* These items are not subject to corporation tax in an investment trust company.
The Company is not subject to corporation tax on capital gains or on dividend income. As a consequence, it has unutilised expenses which have given rise to a deferred tax asset of £6.3m (2015: £5.3m). This asset has not been recognised as the Directors believe it is unlikely that the Company will have sufficient taxable profits in future to utilise it. Of this amount £1.4m (2015: £1.2m) relates to revenue expenses and £4.9m (2015: £4.1m) to capital expenses.

Report and Accounts 2016 | 73
FINANCIAL REPORT
OV
ER
VIE
WS
TR
AT
EG
IC R
EP
OR
TG
OV
ER
NA
NC
E R
EP
OR
TA
UD
ITO
RS
’ RE
PO
RT
FINA
NC
IAL R
EP
OR
TN
OT
ICE
OF M
EE
TIN
GO
TH
ER
INFO
RM
AT
ION
Report and Accounts 2016 | 73
9. Return per ordinary share Earnings for the purpose of basic earnings per share is the profit for the year attributable to ordinary shareholders and based on the following data.
2016 2015
Revenue £’000s
Capital £’000s
Total £’000s
Revenue £’000s
Capital £’000s
Total £’000s
Net return attributable to equity shareholders – £’000s 6,452 12,900 19,352 5,659 65,717 71,376
Return per share – pence 11.86 23.72 35.58 10.87 126.22 137.09
Both the revenue and capital returns per share are based on a weighted average of 54,396,920 ordinary shares in issue during the year (2015: 52,066,072).
Diluted earnings per shareEarnings for the purpose of diluted earnings per share is the adjusted profit for the year attributable to ordinary shareholders and based on the following data.
2016 2015
Revenue £’000s
Capital £’000s
Total £’000s
Revenue £’000s
Capital £’000s
Total £’000s
Net return attributable to equity shareholders – £’000s 6,887 14,206 21,093 6,000 66,739 72,739
Diluted return per share – pence 11.78 23.72 35.58 10.87 121.02 131.90
There is no dilution of capital or total return in the year (2015: there is no dilution of revenue return in the year). Both the revenue and capital returns per share are based on a weighted average of 58,476,340 ordinary shares in issue during the year (2015: 55,147,522).
For the purpose of calculating diluted total, revenue and capital returns per ordinary share, the number of ordinary shares used is the weighted average number used in the basic calculation plus the number of ordinary shares deemed to be issued for no consideration on exercise of all CULS. Total returns attributable to shareholders, adjusted for CULS finance costs accounted for in the period, are divided by the resulting weighted average shares in issue to arrive at diluted total returns per share. Once dilution has been determined, individual revenue and capital returns are calculated.
10. Dividends
Dividends on ordinary shares Register date Payment date 2016
£’000s 2015
£’000s
Interim for the year ended 30 April 2016 of 2.90 pence 8 January 2016 29 January 2016 1,594 –
Final for the year ended 30 April 2015 of 7.00 pence 17 July 2015 14 August 2015 3,748 –
Interim for the year ended 30 April 2015 of 2.65 pence 5 January 2015 30 January 2015 – 1,384
Final for the year ended 30 April 2014 of 5.50 pence 18 July 2014 15 August 2014 – 2,839
5,342 4,223
The Directors have proposed a final dividend in respect of the year ended 30 April 2016 of 7.80 pence per share, payable on 12 August 2016 to all shareholders on the register at close of business on 15 July 2016. The recommended final dividend is subject to approval by shareholders at the Annual General Meeting.
The attributable revenue and the dividends paid and proposed in respect of the financial year ended 30 April 2016 for the purposes of the income retention test for section 1159 of the Income and Corporation Tax Act 2010, are set out below:
2016 £’000s
Revenue attributable to equity shareholders 6,452
Interim for the year ended 30 April 2016 of 2.90p (1,594)
Proposed final for the year ended 30 April 2016 of 7.80 pence* (4,333)
Amount transferred to revenue reserve for section 1159 purposes** 525
*Based on 55,556,203 shares in issue at 20 June 2016.
** Undistributed revenue for the year equated to 6.2% of total income of £8,486,000 (see note 3).

74 | F&C Global Smaller Companies PLC74 | F&C Global Smaller Companies PLC
11. Investments
Level 1* £’000s
Level 2* £’000s
Level 3*
£’000s
2016 Total
£’000s Level 1* £’000s
Level 3* £’000s
2015 Total
£’000s
Cost brought forward 412,061 – 1,570 413,631 322,818 1,570 324,388
Gains brought forward 133,648 – 1,360 135,008 99,606 1,350 100,956
Valuation brought forward 545,709 – 2,930 548,639 422,424 2,920 425,344
Movements in the year:
Purchases at cost 220,476 – – 220,476 228,595 – 228,595
Transfer to level 2† (1,393) 1,393 – –
Sales proceeds (204,324) – – (204,324) (174,446) – (174,446)
Gains on investments sold in year 43,867 – – 43,867 35,094 – 35,094
(Losses)/gains on investments held at year end (27,041) (199) 193 (27,047) 34,042 10 34,052
Valuation of investments held at 30 April 577,294 1,194 3,123 581,611 545,709 2,930 548,639
Level 1* £’000s
Level 2* £’000s
Level 3*
£’000s
Total
£’000s Level 1* £’000s
Level 3* £’000s
Total
£’000s
Cost at 30 April 470,687 1,393 1,570 473,650 412,061 1,570 413,631
Gains/(losses) at 30 April 106,607 (199) 1,553 107,961 133,648 1,360 135,008
Valuation at 30 April 577,294 1,194 3,123 581,611 545,709 2,930 548,639
* Level 1 includes investments listed on any recognised stock exchange or quoted on AIM in the UK.Level 2 includes investments for which the quoted price has been suspended.Level 3 includes unquoted investments, which are held at Directors’ valuation.† Transfer due to suspension of listing of investee company involved in bid speculation.
A full list of investments is set out on pages 26 to 29.
Gains on investments
2016 £’000s
2015 £’000s
Gains on investments sold during the year 43,867 35,094
Gains on investments held at year end (27,047) 34,052
Total gains on investments 16,820 69,146
Substantial interestsAt 30 April 2016 the Company held more than 3% of the following undertaking held as an investment which, in the opinion of the Directors, did not represent a participating interest:
Company
Country of registration and
incorporationNumber of
units/shares heldHolding*
%
Australian New Horizons Fund Australia 2,375,135 33.32
*The company neither has a controlling interest nor participates in the management of this undertaking.

Report and Accounts 2016 | 75
FINANCIAL REPORT
OV
ER
VIE
WS
TR
AT
EG
IC R
EP
OR
TG
OV
ER
NA
NC
E R
EP
OR
TA
UD
ITO
RS
’ RE
PO
RT
FINA
NC
IAL R
EP
OR
TN
OT
ICE
OF M
EE
TIN
GO
TH
ER
INFO
RM
AT
ION
Report and Accounts 2016 | 75
12. Debtors
2016 £’000s
2015 £’000s
Investment debtors 1,257 2,772
Prepayments and accrued income 1,145 1,036
Share issue proceeds due – 196
Overseas taxation recoverable 127 82
2,529 4,086
13. Creditors: amounts falling due within one year
2016
£’000s 2015
£’000s
Investment creditors 2,862 9,452
Interest accrued on CULS 349 381
Management fee and performance fee accrued 1,485 1,142
Other accrued expenses 91 160
4,787 11,135
14. Convertible Unsecured Loan Stock (“CULS”)
2016 £’000s
2015 £’000s
Balance brought forward 38,129 –
Issue of CULS on 30 July 2014 – 40,000
Issue costs of CULS on 30 July 2014 – (768)
Transfer to equity component of CULS on 30 July 2014 – (1,339)
Transfer to share capital and share premium on conversion of CULS (95) (46)
Amortised costs 376 282
Balance carried forward 38,410 38,129
The Company issued 40 million CULS at £1 each which were admitted to the Official List and to trading on the London Stock Exchange on 30 July 2014.
The interest rate on the CULS is fixed at 3.5 per cent. per annum, payable semi-annually with the first interest period ending on 31 January 2015. CULS holders are able to convert their CULS into ordinary shares at no cost on 31 January and 31 July of each year throughout the life of the CULS. All outstanding CULS will be repayable at par on 31 July 2019 together with outstanding interest due. The rate of conversion of 977.6970 pence per £1 nominal of CULS for one ordinary share was set at a premium of 15% to the unaudited Net Asset Value per ordinary share at the time the CULS were issued.
At 30 April 2015, 39,951,303 units of CULS were in issue. On 31 July 2015, holders of 83,597 CULS converted their holdings into 8,542 ordinary shares and on 31 January 2016, holders of 15,508 CULS converted their holdings into 1,584 ordinary shares. At 30 April 2016, 39,852,198 units of CULS were in issue.
The market price of the CULS at 30 April 2016 was 110.50p per 100p nominal. The CULS are unsecured and are subordinate to any creditors of the Company.

76 | F&C Global Smaller Companies PLC76 | F&C Global Smaller Companies PLC
15. Geographical and industrial classification (total assets less current liabilities)
North America
%UK %
Continental Europe
%
Rest of World
%Japan
%
2016 Total
%
2015 Total
%
Industrials 9.8 8.2 3.2 - - 21.2 21.3
Financials 9.5 5.0 2.5 - - 17.0 17.5
Collective investments - - - 9.3 7.4 16.7 18.5
Consumer services 5.5 6.0 1.9 - - 13.4 12.6
Health care 6.6 2.6 0.8 - - 10.0 8.4
Consumer goods 3.5 2.2 2.6 - - 8.3 6.8
Technology 3.2 2.5 0.3 - - 6.0 8.1
Basic materials 0.8 0.9 0.4 - - 2.1 2.0
Oil & gas 1.2 0.6 - - - 1.8 1.9
Telecommunications 1.5 0.3 - - - 1.8 1.7
Total investments 41.6 28.3 11.7 9.3 7.4 98.3 98.8
Net current assets 1.1 0.5 - 0.1 - 1.7 1.2
Total assets less current liabilities 42.7 28.8 11.7 9.4 7.4 100.0
2015 totals 40.1 29.6 11.6 11.1 7.6 100.0
16. Share capital
Issued and fully paid
Equity share capital Number £’000s
Ordinary shares of 25p each
Balance brought forward 53,125,077 13,281
Shares issued 2,276,000 569
Shares issued on conversion of CULS 10,126 3
Balance carried forward 55,411,203 13,853
During the year 2,276,000 ordinary shares were issued, raising proceeds of £22,124,000. Since the year end a further 145,000 ordinary shares have been issued, raising proceeds of £1,462,000.
On 11 August 2015, 8,542 ordinary shares were issued on the conversion of 83,597 CULS, at no cost and on 10 February 2016, 1,584 ordinary shares were issued on the conversion of 15,508 CULS, at no cost (see note 14).
17. Share premium account
2016 £’000s
2015 £’000s
Balance brought forward 119,394 102,460
Premium on issue of shares 21,555 16,889
Transfer from CULS liability on conversion of CULS 92 45
Transfer from equity component of CULS on conversion of CULS 5 –
Balance carried forward 141,046 119,394
18. Capital redemption reserve
2016 £’000s
2015 £’000s
Balance brought forward and carried forward 16,158 16,158

Report and Accounts 2016 | 77
FINANCIAL REPORT
OV
ER
VIE
WS
TR
AT
EG
IC R
EP
OR
TG
OV
ER
NA
NC
E R
EP
OR
TA
UD
ITO
RS
’ RE
PO
RT
FINA
NC
IAL R
EP
OR
TN
OT
ICE
OF M
EE
TIN
GO
TH
ER
INFO
RM
AT
ION
Report and Accounts 2016 | 77
19. Equity component of CULS
2016 £’000s
2015 £’000s
Balance brought forward 1,312 –
Transfer to share premium on conversion of CULS (5) –
Transfer from CULS liability on issue of CULS – 1,339
Issue costs of equity component of CULS – (27)
Balance carried forward 1,307 1,312
20. Other reserves
Capital reserve arising on
investments sold
£’000s
Capital reserve arising on
investments held
£’000s
Capital reserves
– total £’000s
Revenue reserve £’000s
Movements in the year
Gains on investments sold in year 43,867 – 43,867 –
Losses on investments held at year end – (27,047) (27,047) –
Foreign exchange losses 217 – 217 –
Management fee (see note 4) (1,495) – (1,495) –
Performance fee (see note 5) (1,314) – (1,314) –
Other expenses (22) – (22) –
Finance costs (see note 7) (1,306) – (1,306) –
Revenue return – – – 6,452
Net return attributable to ordinary shareholders 39,947 (27,047) 12,900 6,452
Dividends paid in the year – – – (5,342)
39,947 (27,047) 12,900 1,110
Balance brought forward 220,277 135,008 355,285 11,533
Balance carried forward 260,224 107,961 368,185 12,643
Included within the capital reserve movement for the year are £392,000 (2015: £394,000) of transaction costs on purchases of investments, £216,000 (2015: £118,000) of transaction costs on sales of investments and £890,000 (2015: £2,965,000) of distributions received recognised as capital.

78 | F&C Global Smaller Companies PLC78 | F&C Global Smaller Companies PLC
21. Net asset value per ordinary share
2016 2015
Net assets attributable at the year end – (£’000s) 553,192 516,963
Number of ordinary shares in issue at the year end 55,411,203 53,125,077
Net asset value per share – pence 998.34 973.11
Diluted net asset value per ordinary share is based on net assets at the end of the year assuming the conversion of 39,852,198 (2015: 39,951,303) 100p CULS in issue at the rate of 977.6970 pence per £1 nominal of CULS for one ordinary share.
2016 2015
Net assets attributable at the year end 553,192 516,963
Amount attributable to ordinary shareholders on conversion of CULS 38,410 38,129
Attributable net assets assuming conversion 591,602 555,092
Number Number
Ordinary shares in issue at the year end 55,411,203 53,125,077
Ordinary shares created on conversion of CULS 4,076,130 4,086,266
Number of ordinary shares for diluted calculation 59,487,333 57,211,343
Diluted net asset value per ordinary share – pence 994.50 970.25
22. Reconciliation of total return before finance costs and taxation to net cash flows from operating activities
2016 £’000s
2015 £’000s
Profit before taxation 19,852 71,765
Adjust for returns from non-operating activities
Gains on investments (16,820) (69,146)
Foreign exchange gains (234) (491)
Other expenses charged to capital 22 24
Return from operating activities 2,820 2,152
Adjust for non-cash flow items
Decrease/(increase) in prepayments and accrued income (114) (260)
Increase in creditors 220 1,020
Scrip dividends (166) (169)
Amortised costs 376 282
Overseas taxation (519) (416)
Net cash inflow from operating activities 2,617 2,609
23. Related party transactionsThe following are considered related parties: the Board of Directors (the “Board”), the Manager and fellow members of BMO.
There are no transactions with the Board other than aggregated remuneration for services as Directors as disclosed in the Remuneration Report on page 47. and as set out in note 6 on the accounts. There are no outstanding balances with the Board at the year end. Transactions between the Company and F&C are detailed in note 4 on management fees, note 5 on performance fees and note 13, where accrued management and performance fees are disclosed.
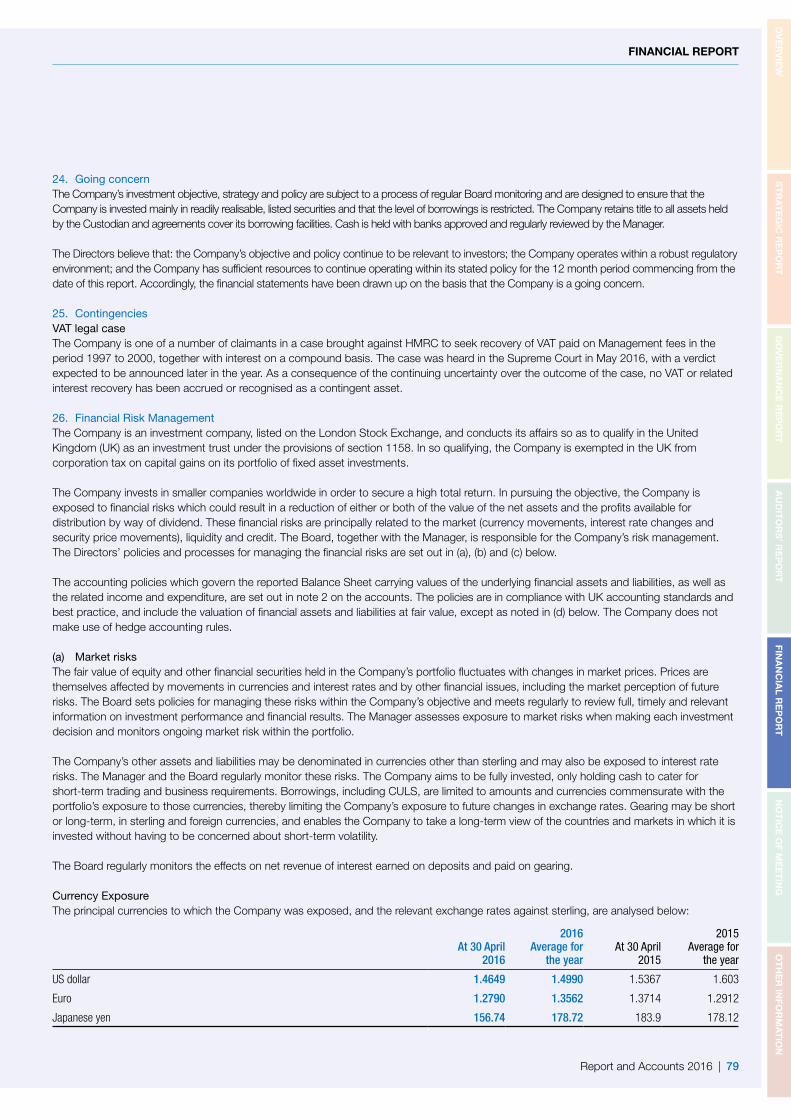
Report and Accounts 2016 | 79
FINANCIAL REPORT
OV
ER
VIE
WS
TR
AT
EG
IC R
EP
OR
TG
OV
ER
NA
NC
E R
EP
OR
TA
UD
ITO
RS
’ RE
PO
RT
FINA
NC
IAL R
EP
OR
TN
OT
ICE
OF M
EE
TIN
GO
TH
ER
INFO
RM
AT
ION
Report and Accounts 2016 | 79
24. Going concernThe Company’s investment objective, strategy and policy are subject to a process of regular Board monitoring and are designed to ensure that the Company is invested mainly in readily realisable, listed securities and that the level of borrowings is restricted. The Company retains title to all assets held by the Custodian and agreements cover its borrowing facilities. Cash is held with banks approved and regularly reviewed by the Manager.
The Directors believe that: the Company’s objective and policy continue to be relevant to investors; the Company operates within a robust regulatory environment; and the Company has sufficient resources to continue operating within its stated policy for the 12 month period commencing from the date of this report. Accordingly, the financial statements have been drawn up on the basis that the Company is a going concern.
25. ContingenciesVAT legal caseThe Company is one of a number of claimants in a case brought against HMRC to seek recovery of VAT paid on Management fees in the period 1997 to 2000, together with interest on a compound basis. The case was heard in the Supreme Court in May 2016, with a verdict expected to be announced later in the year. As a consequence of the continuing uncertainty over the outcome of the case, no VAT or related interest recovery has been accrued or recognised as a contingent asset.
26. Financial Risk Management The Company is an investment company, listed on the London Stock Exchange, and conducts its affairs so as to qualify in the United Kingdom (UK) as an investment trust under the provisions of section 1158. In so qualifying, the Company is exempted in the UK from corporation tax on capital gains on its portfolio of fixed asset investments.
The Company invests in smaller companies worldwide in order to secure a high total return. In pursuing the objective, the Company is exposed to financial risks which could result in a reduction of either or both of the value of the net assets and the profits available for distribution by way of dividend. These financial risks are principally related to the market (currency movements, interest rate changes and security price movements), liquidity and credit. The Board, together with the Manager, is responsible for the Company’s risk management. The Directors’ policies and processes for managing the financial risks are set out in (a), (b) and (c) below.
The accounting policies which govern the reported Balance Sheet carrying values of the underlying financial assets and liabilities, as well as the related income and expenditure, are set out in note 2 on the accounts. The policies are in compliance with UK accounting standards and best practice, and include the valuation of financial assets and liabilities at fair value, except as noted in (d) below. The Company does not make use of hedge accounting rules.
(a) Market risks The fair value of equity and other financial securities held in the Company’s portfolio fluctuates with changes in market prices. Prices are themselves affected by movements in currencies and interest rates and by other financial issues, including the market perception of future risks. The Board sets policies for managing these risks within the Company’s objective and meets regularly to review full, timely and relevant information on investment performance and financial results. The Manager assesses exposure to market risks when making each investment decision and monitors ongoing market risk within the portfolio.
The Company’s other assets and liabilities may be denominated in currencies other than sterling and may also be exposed to interest rate risks. The Manager and the Board regularly monitor these risks. The Company aims to be fully invested, only holding cash to cater for short-term trading and business requirements. Borrowings, including CULS, are limited to amounts and currencies commensurate with the portfolio’s exposure to those currencies, thereby limiting the Company’s exposure to future changes in exchange rates. Gearing may be short or long-term, in sterling and foreign currencies, and enables the Company to take a long-term view of the countries and markets in which it is invested without having to be concerned about short-term volatility.
The Board regularly monitors the effects on net revenue of interest earned on deposits and paid on gearing.
Currency ExposureThe principal currencies to which the Company was exposed, and the relevant exchange rates against sterling, are analysed below:
At 30 April
2016
2016 Average for
the yearAt 30 April
2015
2015 Average for
the year
US dollar 1.4649 1.4990 1.5367 1.603
Euro 1.2790 1.3562 1.3714 1.2912
Japanese yen 156.74 178.72 183.9 178.12

80 | F&C Global Smaller Companies PLC80 | F&C Global Smaller Companies PLC
26. Financial Risk Management (continued) Based on the financial assets and liabilities held and the exchange rates applying at the balance sheet date, a weakening or strengthening of sterling against each of the principal currencies by 10% would have the following approximate effect on returns attributable to equity shareholders and on the net asset value (“NAV”) per share:
Weakening of Sterling by 10%US$
£’000s
2016 €
£’000sUS$
£’000s
2015 €
£’000s
Net revenue return attributable to equity shareholders 243 119 191 109
Net capital return attributable to equity shareholders 28,970 5,998 26,117 5,455
Net total return attributable to equity shareholders 29,213 6,117 26,308 5,564
Net asset value per share (basic) – pence 52.72 11.04 49.52 10.47
Strengthening of Sterling by 10%US$
£’000s
2016 €
£’000sUS$
£’000s
2015 €
£’000s
Net revenue return attributable to equity shareholders (199) (98) (156) (89)
Net capital return attributable to equity shareholders (23,702) (4,907) (21,368) (4,463)
Net total return attributable to equity shareholders (23,901) (5,005) (21,524) (4,552)
Net asset value per share (basic) – pence (43.13) (9.03) (40.52) (8.57)
These analyses are presented in sterling and are representative of the Company’s activities although the level of the Company’s exposure to currencies fluctuates in accordance with the investment and risk management processes. This level of change is considered to be a reasonable illustration based on observation of current market conditions.
The fair values of the Company’s assets and liabilities at 30 April by currency are shown below:
2016
Short-term debtors £’000s
Cash at bank and short-term
deposits £’000s
Short-term creditors
£’000s
CULS (at amortised
cost) £’000s
Net monetary assets/
liabilities £’000s
Investments £’000s
Net exposure
£’000s
Sterling 1,145 5,603 (3,609) (38,410) (35,271) 225,665 190,394
US dollar 989 5,927 (383) – 6,533 254,194 260,727
Euro 127 719 (795) – 51 53,931 53,982
Other 268 – – – 268 47,821 48,089
Total 2,529 12,249 (4,787) (38,410) (28,419) 581,611 553,192
2015
Short-term debtors £’000s
Cash at bank and short-term
deposits £’000s
Short-term creditors
£’000s
CULS (at amortised
cost) £’000s
Net monetary assets/
liabilities £’000s
Investments £’000s
Net exposure
£’000s
Sterling 1,232 7,604 (6,448) (38,129) (35,741) 222,565 186,824
US dollar – 5,461 (3,225) – 2,236 232,816 235,052
Euro 1,896 437 (1,462) – 871 48,221 49,092
Other 958 – – – 958 45,037 45,995
Total 4,086 13,502 (11,135) (38,129) (31,676) 548,639 516,963

Report and Accounts 2016 | 81
FINANCIAL REPORT
OV
ER
VIE
WS
TR
AT
EG
IC R
EP
OR
TG
OV
ER
NA
NC
E R
EP
OR
TA
UD
ITO
RS
’ RE
PO
RT
FINA
NC
IAL R
EP
OR
TN
OT
ICE
OF M
EE
TIN
GO
TH
ER
INFO
RM
AT
ION
Report and Accounts 2016 | 81
26. Financial Risk Management (continued) Interest rate exposureThe exposure of the financial assets and liabilities to interest rate movements at 30 April were:
Within one year
£’000s
More than one year
£’000s
2016 Net total
£’000s
Within one year
£’000s
More than one year
£’000s
2015 Net total
£’000s
Exposure to floating rates – cash 12,249 – 12,249 13,502 – 13,502
Exposure to fixed rates – CULS – (39,852) (39,852) – (39,951) (39,951)
Net exposure 12,249 (39,852) (27,603) 13,502 (39,951) (26,449)
Minimum net exposure during the year 9,128 (39,868) (33,486) 9,508 (50,000) (40,492)
Maximum net exposure during the year 6,465 (39,951) (23,720) 21,061 (10,000) 11,061
Exposures vary throughout the year as a consequence of changes in the make-up of the net assets of the Company arising out of the investment and risk management processes.
Interest received on cash balances, or paid on bank overdrafts and borrowings, is at ruling market rates. The interest rate applying on the CULS is set out in note 14 on the accounts. There were no material holdings in fixed interest investment securities during the year or at the year end.
The Company’s total returns and net assets are sensitive to changes in interest rates on cash and borrowings, and to the ability of CULS holders to convert their holdings into ordinary shares.
Based on the financial assets and liabilities held, and the interest rates ruling, at each balance sheet date, a decrease or increase in interest rates of 2% would have the following approximate effects on the income statement revenue and capital returns after tax and on the NAV:
Increase in rate £’000s
2016 Decrease
in rate £’000s
Increase in rate £’000s
2015 Decrease
in rate £’000s
Revenue return 245 (245) 270 (21)
Capital return – – – –
Total return 245 (245) 270 (21)
NAV per share – pence 0.44 (0.44) 0.51 (0.04)
The calculations in the table above which are based on the financial assets and liabilities held at each balance sheet date and assume outstanding CULS are unconverted, are not representative of the year as a whole, nor are they reflective of future market conditions.
Other market risk exposuresThe Company did not enter into derivative transactions in managing its exposure to other market risks (2015: same). The portfolio of investments, valued at £581,611,000 at 30 April 2016 (2015: £548,639,000) is therefore exposed to market price changes. The Manager assesses these exposures at the time of making each investment decision. The Board reviews overall exposures at each meeting against indices and other relevant information. An analysis of the portfolio by geographical region and major industrial sector is set out in note 15 on the accounts.
Based on the portfolio of investments held at each balance sheet date, and assuming other factors remain constant, a decrease or increase in the fair values of the portfolio by 20% would have had the following approximate effects on the net capital return attributable to equity shareholders and on the NAV:
Increase in value £’000s
2016 Decrease
in value £’000s
Increase in value £’000s
2015 Decrease
in value £’000s
Capital return 116,322 (116,322) 109,728 (109,728)
NAV per share – pence 209.93 (209.93) 206.55 (206.55)
This level of change is considered to be a reasonable illustration based on observation of current market conditions.
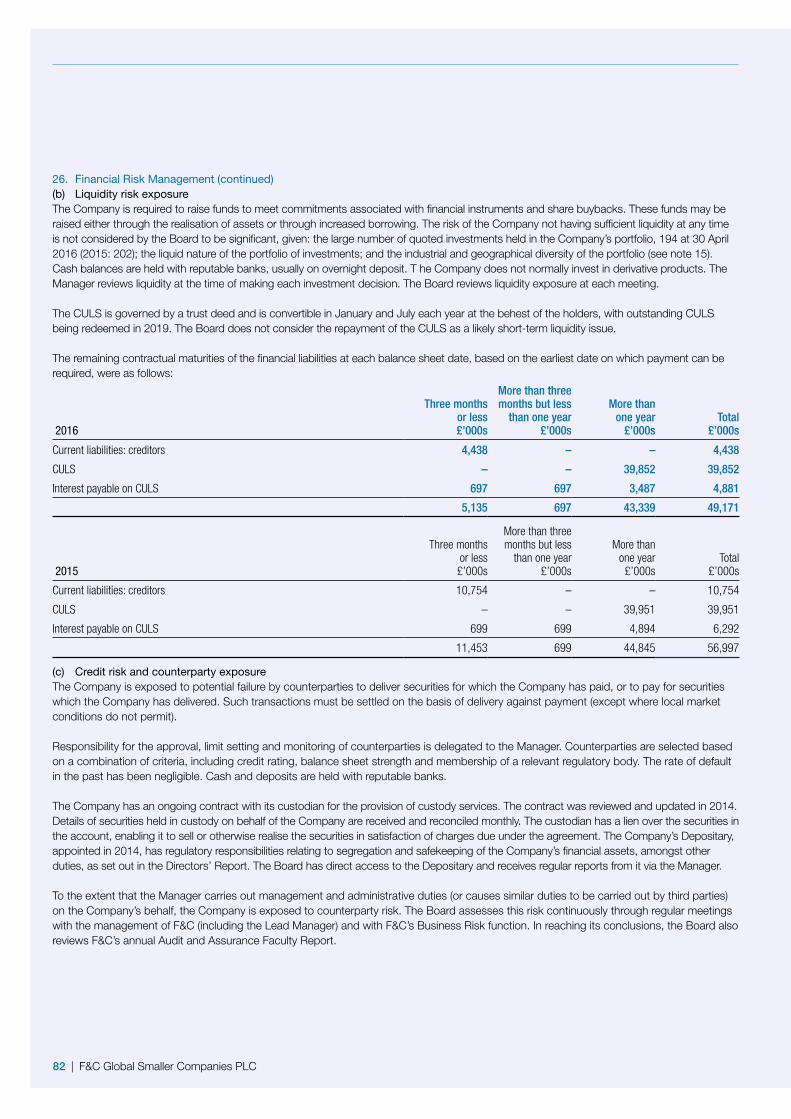
82 | F&C Global Smaller Companies PLC82 | F&C Global Smaller Companies PLC
26. Financial Risk Management (continued) (b) Liquidity risk exposureThe Company is required to raise funds to meet commitments associated with financial instruments and share buybacks. These funds may be raised either through the realisation of assets or through increased borrowing. The risk of the Company not having sufficient liquidity at any time is not considered by the Board to be significant, given: the large number of quoted investments held in the Company’s portfolio, 194 at 30 April 2016 (2015: 202); the liquid nature of the portfolio of investments; and the industrial and geographical diversity of the portfolio (see note 15). Cash balances are held with reputable banks, usually on overnight deposit. T he Company does not normally invest in derivative products. The Manager reviews liquidity at the time of making each investment decision. The Board reviews liquidity exposure at each meeting.
The CULS is governed by a trust deed and is convertible in January and July each year at the behest of the holders, with outstanding CULS being redeemed in 2019. The Board does not consider the repayment of the CULS as a likely short-term liquidity issue.
The remaining contractual maturities of the financial liabilities at each balance sheet date, based on the earliest date on which payment can be required, were as follows:
2016
Three months or less £’000s
More than three months but less
than one year £’000s
More than one year
£’000sTotal
£’000s
Current liabilities: creditors 4,438 – – 4,438
CULS – – 39,852 39,852
Interest payable on CULS 697 697 3,487 4,881
5,135 697 43,339 49,171
2015
Three months or less £’000s
More than three months but less
than one year £’000s
More than one year
£’000sTotal
£’000s
Current liabilities: creditors 10,754 – – 10,754
CULS – – 39,951 39,951
Interest payable on CULS 699 699 4,894 6,292
11,453 699 44,845 56,997
(c) Credit risk and counterparty exposureThe Company is exposed to potential failure by counterparties to deliver securities for which the Company has paid, or to pay for securities which the Company has delivered. Such transactions must be settled on the basis of delivery against payment (except where local market conditions do not permit).
Responsibility for the approval, limit setting and monitoring of counterparties is delegated to the Manager. Counterparties are selected based on a combination of criteria, including credit rating, balance sheet strength and membership of a relevant regulatory body. The rate of default in the past has been negligible. Cash and deposits are held with reputable banks.
The Company has an ongoing contract with its custodian for the provision of custody services. The contract was reviewed and updated in 2014. Details of securities held in custody on behalf of the Company are received and reconciled monthly. The custodian has a lien over the securities in the account, enabling it to sell or otherwise realise the securities in satisfaction of charges due under the agreement. The Company’s Depositary, appointed in 2014, has regulatory responsibilities relating to segregation and safekeeping of the Company’s financial assets, amongst other duties, as set out in the Directors’ Report. The Board has direct access to the Depositary and receives regular reports from it via the Manager.
To the extent that the Manager carries out management and administrative duties (or causes similar duties to be carried out by third parties) on the Company’s behalf, the Company is exposed to counterparty risk. The Board assesses this risk continuously through regular meetings with the management of F&C (including the Lead Manager) and with F&C’s Business Risk function. In reaching its conclusions, the Board also reviews F&C’s annual Audit and Assurance Faculty Report.
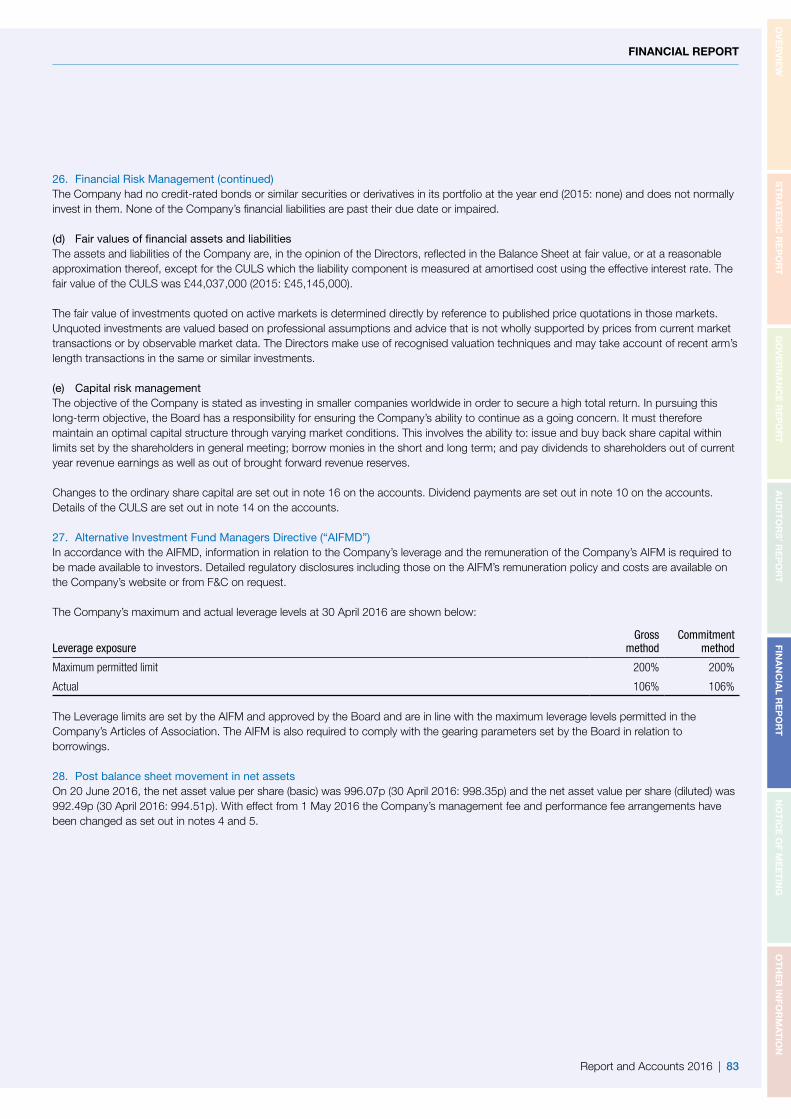
Report and Accounts 2016 | 83
FINANCIAL REPORT
OV
ER
VIE
WS
TR
AT
EG
IC R
EP
OR
TG
OV
ER
NA
NC
E R
EP
OR
TA
UD
ITO
RS
’ RE
PO
RT
FINA
NC
IAL R
EP
OR
TN
OT
ICE
OF M
EE
TIN
GO
TH
ER
INFO
RM
AT
ION
Report and Accounts 2016 | 83
26. Financial Risk Management (continued) The Company had no credit-rated bonds or similar securities or derivatives in its portfolio at the year end (2015: none) and does not normally invest in them. None of the Company’s financial liabilities are past their due date or impaired.
(d) Fair values of financial assets and liabilitiesThe assets and liabilities of the Company are, in the opinion of the Directors, reflected in the Balance Sheet at fair value, or at a reasonable approximation thereof, except for the CULS which the liability component is measured at amortised cost using the effective interest rate. The fair value of the CULS was £44,037,000 (2015: £45,145,000).
The fair value of investments quoted on active markets is determined directly by reference to published price quotations in those markets. Unquoted investments are valued based on professional assumptions and advice that is not wholly supported by prices from current market transactions or by observable market data. The Directors make use of recognised valuation techniques and may take account of recent arm’s length transactions in the same or similar investments.
(e) Capital risk managementThe objective of the Company is stated as investing in smaller companies worldwide in order to secure a high total return. In pursuing this long-term objective, the Board has a responsibility for ensuring the Company’s ability to continue as a going concern. It must therefore maintain an optimal capital structure through varying market conditions. This involves the ability to: issue and buy back share capital within limits set by the shareholders in general meeting; borrow monies in the short and long term; and pay dividends to shareholders out of current year revenue earnings as well as out of brought forward revenue reserves.
Changes to the ordinary share capital are set out in note 16 on the accounts. Dividend payments are set out in note 10 on the accounts. Details of the CULS are set out in note 14 on the accounts.
27. Alternative Investment Fund Managers Directive (“AIFMD”)In accordance with the AIFMD, information in relation to the Company’s leverage and the remuneration of the Company’s AIFM is required to be made available to investors. Detailed regulatory disclosures including those on the AIFM’s remuneration policy and costs are available on the Company’s website or from F&C on request.
The Company’s maximum and actual leverage levels at 30 April 2016 are shown below:
Leverage exposureGross
methodCommitment
method
Maximum permitted limit 200% 200%
Actual 106% 106%
The Leverage limits are set by the AIFM and approved by the Board and are in line with the maximum leverage levels permitted in the Company’s Articles of Association. The AIFM is also required to comply with the gearing parameters set by the Board in relation to borrowings.
28. Post balance sheet movement in net assetsOn 20 June 2016, the net asset value per share (basic) was 996.07p (30 April 2016: 998.35p) and the net asset value per share (diluted) was 992.49p (30 April 2016: 994.51p). With effect from 1 May 2016 the Company’s management fee and performance fee arrangements have been changed as set out in notes 4 and 5.

84 | F&C Global Smaller Companies PLC
Ten Year Record
84 | F&C Global Smaller Companies PLC
Ten Year Record
All data is based on assets, liabilities, earnings and expenses as reported in accordance with the Company’s accounting policies and is unaudited but derived from the audited Accounts.
Assets at 30 April
£’000s 2006 2007 2008 2009 2010 2011 2012 2013 2014 2015 2016
Total assets 240,652 249,574 198,100 160,994 218,384 251,604 256,776 350,090 441,086 555,092 591,602
Debenture and loans 13,000 10,000 10,000 10,000 10,000 10,000 10,000 10,000 10,000 – –
CULS – – – – – – – – – 38,129 38,410
Net assets 227,652 239,574 188,100 150,994 208,384 241,604 246,776 340,090 431,086 516,963 553,192
Net Asset Value (”NAV”)at 30 April
pence 2006 2007 2008 2009 2010 2011 2012 2013 2014 2015 2016
NAV (basic) per share 470.8 512.2 428.2 360.2 518.1 602.5 596.4 756.2 841.8 973.1 998.34
NAV (diluted) per share n/a n/a n/a n/a n/a n/a n/a n/a n/a 970.3 994.50
NAV total return on 100p – 5 years (per AIC) 175.0
NAV total return on 100p – 10 years (per AIC) 235.3
Share Price at 30 April
pence 2006 2007 2008 2009 2010 2011 2012 2013 2014 2015 2016
Middle market price per share 435.0 473.3 385.0 325.0 461.0 583.5 588.0 764.5 840.0 980.0 1,001.0p
Share price high 444.5 473.3 482.0 405.0 461.0 587.0 618.0 779.0 879.5 1,025.0 1,024.0p
Share price low 268.5 364.3 339.8 221.0 310.5 405.0 485.0 554.0 745.3 784.5 859.0p
Share price total return on 100p – 5 years (per AIC) 179.8
Share price total return on 100p – 10 years (per AIC) 257.3
Revenue for the year ended 30 April
2006 2007 2008 2009 2010 2011 2012 2013 2014 2015 2016
Available for ordinary shares – £’000s 3,210 2,270 2,510 2,430 2,016 2,039 2,799 3,044 4,461 5,659 6,452
Return per share 4.54p 4.75p 5.54p 5.66p 4.88p 5.08p 6.87p 7.10p 9.31p 10.87p* 11.78p*
Dividends per share 5.53p# 4.69p 4.83p 4.89p 5.00p 5.10p 5.63p 6.50p 8.00p 9.65p 10.70p
* diluted# includes a special dividend of 1.00p.

Report and Accounts 2016 | 85
FINANCIAL REPORT
OV
ER
VIE
WS
TR
AT
EG
IC R
EP
OR
TG
OV
ER
NA
NC
E R
EP
OR
TA
UD
ITO
RS
’ RE
PO
RT
FINA
NC
IAL R
EP
OR
TN
OT
ICE
OF M
EE
TIN
GO
TH
ER
INFO
RM
AT
ION
Report and Accounts 2016 | 85
Performance (rebased at 30 April 2006)
2006 2007 2008 2009 2010 2011 2012 2013 2014 2015 2016
NAV per share 100 108.8 91 76.5 110 128 126.7 160.6 178.8 206.1* 211.2*
Middle market price per share 100 108.8 88.5 74.7 106 134.1 135.2 175.7 193.1 225.3 230.1
Earnings per share 100 104.6 122 124.7 107.5 111.9 151.3 156.4 205.1 239.4 261.2
Dividends per share 100# 84.8 87.3 88.4 90.4 92.2 101.8 117.5 144.7 174.5 193.5
RPI 100 104.5 108.9 107.6 113.4 119.3 123.4 127.0 130.1 131.3 133.0
* diluted
# includes a special dividend of 1.00p.
Cost of running the Company (ongoing charges/TER)for the year ended 30 April
Expressed as a percentage of average net assets 2006 2007 2008 2009 2010 2011 2012 2013 2014 2015 2016
Ongoing charges
excluding performance fees – – – – – 1.00% 1.08% 0.85% 0.76% 0.79% 0.85%
including performance fees – – – – – 1.02% 1.56% 1.49% 0.78% 1.08% 0.85%
TER
excluding performance fees 0.69% 0.74% 0.77% 0.93% 0.78% 0.76% 0.79% 0.71% 0.50% 0.53% 0.51%
including performance fees 0.69% 0.99% 0.77% 0.93% 0.78% 0.76% 1.17% 1.22% 0.50% 0.74% 0.76%
Gearing at 30 April
% 2006 2007 2008 2009 2010 2011 2012 2013 2014 2015 2016
Effective gearing 4.7% 2.7% 3.3% 4.1% (3.3)% 2.7% 1.7% (2.3)% (1.3)% 4.8% 4.7%
Fully invested gearing 5.7% 4.2% 5.3% 6.6% 4.8% 4.1% 4.1% 2.9% 2.2% 7.4% 6.9%
Analysis of ordinary shareholders at 30 April 2016
Category Holding %
F&C savings plans 53.5
Nominees 32.0
Institutions 7.8
Direct individuals 6.7
100.0
Source: F&C

86 | F&C Global Smaller Companies PLC
Notice of Annual General MeetingNotice of Annual General Meeting
Notice is hereby given that the one hundred and twenty-seventh Annual General Meeting of the Company will be held at The Chartered Accountants’ Hall, One Moorgate Place, London EC2 on Thursday 28 July 2016 at 12 noon for the following purposes:
To consider and, if thought fit, pass the following resolutions 1 to 13 as ordinary resolutions:1. To receive and adopt the Directors’ report and accounts
for the year ended 30 April 2016.2. To approve the Directors’ Remuneration Policy.3. To approve the Directors’ Annual Remuneration Report.4. To declare a final dividend of 7.80 pence per share.5. To re-elect Andrew Adcock as a Director.6. To re-elect Anja Balfour as a Director.7. To re-elect Josephine Dixon as a Director.8. To re-elect David Stileman as a Director.9. To re-elect Anthony Townsend as a Director.10. To re-elect Jane Tozer as a Director.11. To re-appoint PricewaterhouseCoopers LLP as auditors
to the Company.12. To authorise the Audit and Management Engagement
Committee to determine the remuneration of the auditors.13. Authority to allot shares
THAT, in substitution for any existing authority, but without prejudice to the exercise of any such authority prior to the date hereof, the Directors be and they are hereby generally and unconditionally authorised, in accordance with section 551 of the Companies Act 2006 (the “Act”), to exercise all the powers of the Company to allot shares in the Company and to grant rights to subscribe for, or convert any security into, shares in the Company (together being “relevant securities”) up to an aggregate nominal amount of £1,388,000 (representing approximately 10% of the issue share capital of the Company (excluding treasury shares)), during the period commencing on the date of the passing of this resolution and expiring at the conclusion of the Annual General Meeting of the Company in 2017 or on the expiry of 15 months from the passing of this resolution (whichever is earlier), unless previously revoked, varied or extended
by the Company in a general meeting (the “relevant period”); save that the Company may at any time prior to the expiry of this authority make offers or enter into agreements which would or might require relevant securities to be allotted after the expiry of the relevant period and notwithstanding such expiry the Directors may allot relevant securities in pursuance of such offers or agreements.
To consider and, if thought fit, pass the following resolution as a special resolution:14. Disapplication of pre-emption rights
THAT, subject to the passing of resolution 13 above and in substitution for any existing authority, but without prejudice to the exercise of any such authority prior to the date hereof, the Directors be and they are hereby empowered, pursuant to sections 570 and 573 of the Companies Act 2006 (the “Act”), to allot equity securities (within the meaning of section 560 of the Act) either pursuant to the authority conferred by resolution 13 for cash or by way of a sale of treasury shares as if section 561(1) of the Act did not apply to any such allotment or transfer, provided this power shall be limited to:(a) the allotment of equity securities in connection with an
offer of equity securities:(i) to ordinary shareholders in proportion (as nearly as
may be practicable) to their existing holdings; and
(ii) to holders of other equity securities as required by the rights of those securities or as the Directors otherwise consider necessary,
and so that the Directors may impose any limits or restrictions and make any arrangements which they consider necessary or appropriate to deal with any treasury shares, fractional entitlements or securities represented by depositary receipts, record dates, legal, regulatory or practical problems in, or under the laws of, any territory or the requirements of any regulatory body or stock exchange or any other matter; and

Report and Accounts 2016 | 87
NOTICE OF MEETING
OV
ER
VIE
WS
TR
AT
EG
IC R
EP
OR
TG
OV
ER
NA
NC
E R
EP
OR
TA
UD
ITO
RS
’ RE
PO
RT
FINA
NC
IAL R
EP
OR
TN
OT
ICE
OF M
EE
TIN
GO
TH
ER
INFO
RM
AT
ION
(b) the allotment (otherwise than under paragraph (a) of this Resolution 14) of equity securities up to an aggregate nominal amount of £1,388,000, and shall expire at the conclusion of the next Annual General Meeting of the Company after the passing of this resolution or on the expiry of 15 months from the passing of this resolution (whichever is the earlier), unless extended by the Company in a general meeting (“the relevant period”) save that the Company may at any time prior to the expiry of this authority make offers or enter into agreements which would or might require equity securities to be allotted or transferred after the expiry of the relevant period and notwithstanding such expiry the Directors may allot or transfer equity securities in pursuance of such offers or agreements.
To consider and, if thought fit, pass the following resolution as a special resolution:
15. Share buyback authorityTHAT, in substitution for any existing authority, but without prejudice to the exercise of any such authority prior to the date hereof, the Company be and is hereby generally and unconditionally authorised, pursuant to and in accordance with section 701 of the Companies Act 2006 (the “Act”), to make market purchases (within the meaning of section 693(4) of the Act) of fully paid ordinary shares of 25p each in the capital of the Company (“ordinary shares”) on such terms and in such manner as the Directors may from time to time determine, provided that:(a) the maximum number of ordinary shares hereby
authorised to be purchased shall be 8,327,000 or, if less, 14.99% of the number of ordinary shares in issue (excluding treasury shares) as at the date of the passing of this resolution;
(b) the minimum price (exclusive of expenses) which may be paid for an ordinary share shall be 25p;
(c) the maximum price (exclusive of expenses) which may be paid for an ordinary share is the higher of (i) an amount equal to 105% of the average of the middle market quotations for an ordinary share (as derived from the London Stock Exchange Daily Official List) for the five business days immediately preceding the date on which the ordinary share is contracted to be purchased, and (ii) an amount equal to the higher of the price of the last independent trade for an ordinary share and the highest current independent bid for an ordinary share on the trading venues where the purchase is carried out;
(d) the authority hereby conferred shall expire at the conclusion of the next Annual General Meeting of the Company after the passing of this resolution or on the expiry of 15 months from the passing of this resolution (whichever is earlier), unless such authority is varied, revoked or renewed prior to such time by the Company in general meeting by special resolution; and
(e) the Company may at any time prior to the expiry of such authority enter into a contract or contracts to purchase ordinary shares under such authority which will or may be completed or executed wholly or partly after the expiration of such authority and the Company may purchase ordinary shares pursuant to any such contract or contracts as if the authority conferred hereby had not expired.
To consider and, if thought fit, pass the following resolution as an ordinary resolution:
16. Treasury sharesTHAT, subject to the passing of resolution 14 set out above, the Directors be and they are hereby authorised, for the purposes of paragraph 15.4.11 of the Listing Rules of the United Kingdom Listing Authority, to sell or transfer out of treasury equity securities for cash at a price below the net asset value per share of the existing ordinary shares in issue (excluding treasury shares) pursuant to the authority conferred by resolution 14, provided that the discount at which such equity securities are sold or transferred out of treasury is: (i) always less than the weighted average discount at which the equity securities held in treasury have been purchased; and (ii) no more than 5% of the prevailing net asset value per share.
To consider and, if thought fit, pass the following resolution as a special resolution:
17. THAT the Company be and is hereby generally and unconditionally authorised to hold general meetings (other than annual general meetings) on 14 clear days’ notice, such authority to expire at the conclusion of the next Annual General Meeting of the Company.
By Order of the Board F&C Investment Business Limited Secretary 22 June 2016
Registered office: Exchange House Primrose Street London EC2A 2NY

88 | F&C Global Smaller Companies PLC
Notes:1. A member is entitled to appoint one or more proxies to exercise all or any
of the member’s rights to attend, speak and vote at the meeting. A proxy
need not be a member of the Company but must attend the meeting for
the member’s vote to be counted. If a member appoints more than one
proxy to attend the meeting, each proxy must be appointed to exercise
the rights attached to a different share or shares held by that member.
2. If the Chairman, as a result of any proxy appointments, is given discretion
as to how the votes are cast and the voting rights in respect of those
discretionary proxies, when added to the interests in the Company’s
securities already held by the Chairman, result in the Chairman holding
such number of voting rights that he has a notifiable obligation under
the Disclosure and Transparency Rules, the Chairman will make the
necessary notifications to the Company and the Financial Conduct
Authority. As a result, any person holding 3% or more of the voting
rights in the Company who grants the Chairman a discretionary proxy in
respect of some or all of those voting rights and so would otherwise have
a notification obligation under the Disclosure and Transparency Rules
need not make a separate notification to the Company and the Financial
Conduct Authority.
3. Any such person holding 3% or more of the voting rights in the Company
who appoints a person other than the Chairman as his proxy will need
to ensure that both he and such person complies with their respective
disclosure obligations under the Disclosure and Transparency Rules.
4. A Form of Proxy is provided with this notice for members. If a member
wishes to appoint more than one proxy and so requires additional proxy
forms, the member should contact Computershare Investor Services
PLC on 0370 889 4088. To be valid, the Form of Proxy and any power
of attorney or other authority under which it is signed (or a notarially
certified copy of such authority) must be received by post or (during
normal business hours only) by hand at the Company’s registrars,
Computershare Investor Services PLC, The Pavilions, Bridgwater Road,
Bristol BS99 6ZY, not less than 48 hours before the time of the holding
of the meeting or any adjournment thereof. Completion and return of a
Form of Proxy will not preclude members from attending and voting at the
Chartered Accountants’ Hall
meeting should they wish to do so. Amended instructions must also be
received by the Company’s registrars by the deadline for receipt of Forms
of Proxy.
5. Alternat ively, members may register the appointment of a
proxy for the meeting electronically, by accessing the website
www.eproxyappointment.com where full instructions for the procedure
are given. The Control Number, Shareholder Reference and PIN as
printed on the Form of Proxy will be required in order to use the electronic
proxy appointment system. This website is operated by Computershare
Investor Services PLC. The proxy appointment and any power of attorney
or other authority under which the proxy appointment is made must be
received by Computershare Investor Services PLC not less than 48 hours
before the time for holding the meeting or adjourned meeting or (in the
case of a poll taken otherwise than at or on the same day as the meeting
or adjourned meeting) for the taking of the poll at which it is to be used.
If you want to appoint more than one proxy electronically please contact
Computershare Investor Services PLC on 0370 889 4088.
6. Investors holding shares in the Company through the F&C Private
Investor, or Children’s Investment Plans, the F&C Child Trust Fund, Junior
ISA or in an F&C Individual Savings Account should ensure that forms of
direction are returned to Computershare Investor Services PLC not later
than 12 noon on 21 July 2016. Alternatively, voting directions can be
submitted electronically at www.eproxyappointment.com by entering the
Control Number, Shareholder Reference Number and PIN as printed on
the form of direction. Voting directions must be submitted electronically
no later than 12 noon on 21 July 2016.
7. Any person receiving a copy of this notice as a person nominated by a
member to enjoy information rights under section 146 of the Companies
Act 2006 (a “Nominated Person”) should note that the provisions in notes
1, 4 and 5 above concerning the appointment of a proxy or proxies to
attend the meeting in place of a member do not apply to a Nominated
Person as only shareholders have the right to appoint a proxy. However,
a Nominated Person may have a right under an agreement between the
Nominated Person and the member by whom he or she was nominated
to be appointed, or to have someone else appointed, as a proxy for the
meeting. If a Nominated Person has no such proxy appointment right
or does not wish to exercise it, he/she may have a right under such an
agreement to give instructions to the member as to the exercise of voting
rights at the meeting.
8. Nominated Persons should also remember that their main point of
contact in terms of their investment in the Company remains the member
who nominated the Nominated Person to enjoy information rights (or,
perhaps, the custodian or broker who administers the investment on their
behalf). Nominated Persons should continue to contact that member,
custodian or broker (and not the Company) regarding any changes or
queries relating to the Nominated Person’s personal details and interest
in the Company (including any administrative matter). The only exception
to this is where the Company expressly requests a response from a
Nominated Person.

Report and Accounts 2016 | 89
NOTICE OF MEETING
OV
ER
VIE
WS
TR
AT
EG
IC R
EP
OR
TG
OV
ER
NA
NC
E R
EP
OR
TA
UD
ITO
RS
’ RE
PO
RT
FINA
NC
IAL R
EP
OR
TN
OT
ICE
OF M
EE
TIN
GO
TH
ER
INFO
RM
AT
ION
of the CREST system by any particular time. In this connection, CREST
members and, where applicable, their CREST sponsors or voting service
provider(s) are referred, in particular, to those sections of the CREST
Manual concerning practical limitations of the CREST system and timings
(www.euroclear.com/CREST).
13. The Company may treat as invalid a CREST Proxy Instruction in the
circumstances set out in Regulation 35(5)(a) of the Uncertificated
Securities Regulations 2001 (as amended).
14. Any corporation which is a member can appoint one or more corporate
representatives who may exercise on its behalf all of its powers as
a member provided that, if it is appointing more than one corporate
representative, it does not do so in relation to the same shares. It is
therefore no longer necessary to nominate a designated corporate
representative.
15. Under section 527 of the Companies Act 2006, members meeting the
threshold requirements set out in that section have the right to require
the Company to publish on a website a statement setting out any matter
relating to:
(a) the audit of the Company’s accounts (including the auditor’s report
and the conduct of the audit) that are to be laid before the meeting;
or
(b) any circumstances connected with an auditor of the Company
ceasing to hold office since the previous meeting at which annual
accounts and reports were laid in accordance with section 437 of the
Companies Act 2006.
16. The Company may not require the members requesting any such website
publication to pay its expenses in complying with sections 527 or 528
of the Companies Act 2006. Where the Company is required to place a
statement on a website under section 527 of the Companies Act 2006,
it must forward the statement to the Company’s auditor not later than the
time when it makes the statement available on the website. The business
which may be dealt with at the meeting includes any statement that the
Company has been required under section 527 of the Companies Act
2006 to publish on a website.
17. Any member attending the meeting has the right to ask questions.
The Company must cause to be answered any question relating to the
business being dealt with at the meeting put by a member attending the
meeting. However, members should note that no answer need be given
in the following circumstances:
(a) if to do so would interfere unduly with the preparation of the meeting
or would involve a disclosure of confidential information;
(b) if the answer has already been given on a website in the form of an
answer to a question; or
(c) if it is undesirable in the interests of the Company or the good order
of the meeting that the question be answered.
18. As at 20 June 2016, being the latest practicable date before the
publication of this notice, the Company’s issued capital consisted of
55,556,203 ordinary shares of 25 pence each carrying one vote each.
9. Pursuant to Regulation 41(1) of the Uncertificated Securities Regulations
2001 (as amended) and for the purposes of section 360B of the
Companies Act 2006, the Company has specified that only those
members registered on the register of members of the Company at
11 p.m. on 26 July 2016 (the “Specified Time”) (or, if the meeting is
adjourned to a time more than 48 hours after the Specified Time, by
11 p.m. on the day which is two days prior to the time of the adjourned
meeting) shall be entitled to attend and vote at the meeting in respect of
the number of shares registered in their name at that time. If the meeting
is adjourned to a time not more than 48 hours after the Specified Time,
that time will also apply for the purpose of determining the entitlement
of members to attend and vote (and for the purposes of determining the
number of votes they may cast) at the adjourned meeting. Changes to
the register of members after the relevant deadline shall be disregarded
in determining the rights of any person to attend and vote at the meeting.
10. CREST members who wish to appoint a proxy or proxies through the
CREST electronic proxy appointment service may do so for the meeting
and any adjournment(s) thereof by using the procedures described in the
CREST Manual. CREST Personal Members or other CREST sponsored
members, and those CREST members who have appointed a voting
service provider(s), should refer to their CREST sponsor or voting service
provider(s), who will be able to take the appropriate action on their behalf.
11. In order for a proxy appointment or instruction made using the CREST
service to be valid, the appropriate CREST message (a “CREST Proxy
Instruction”) must be properly authenticated in accordance with Euroclear
UK & Ireland Limited’s specifications and must contain the information
required for such instruction, as described in the CREST Manual
(available via www.euroclear.com/CREST). The message, regardless of
whether it constitutes the appointment of a proxy or is an amendment
to the instruction given to a previously appointed proxy must, in order
to be valid, be transmitted so as to be received by the issuer’s agent (ID
number 3RA50) by the latest time(s) for receipt of proxy appointments
specified in notes 4 and 5 above. For this purpose, the time of receipt
will be taken to be the time (as determined by the time stamp applied
to the message by the CREST Application Host) from which the issuer’s
agent is able to retrieve the message by enquiry to CREST in the manner
prescribed by CREST. After this time, any change of instructions to
proxies appointed through CREST should be communicated to the
appointee through other means.
12. CREST members and, where applicable, their CREST sponsors or
voting service provider(s) should note that Euroclear UK & Ireland
Limited does not make available special procedures in CREST for
any particular messages. Normal system timings and limitations will
therefore apply in relation to the input of CREST Proxy Instructions.
It is the responsibility of the CREST member concerned to take (or,
if the CREST member is a CREST personal member or sponsored
member or has appointed a voting service provider(s), to procure that
his CREST sponsor or voting service provider(s) take(s)) such action as
shall be necessary to ensure that a message is transmitted by means
90 | F&C Global Smaller Companies PLC
23. Under sections 338 and 338A of the Act, members meeting the threshold
requirements in those sections have the right to require the Company;
(a) to give, to members of the Company entitled to receive notice of the
meeting, notice of a resolution which may properly be moved and is
intended to be moved at the meeting, and/or
(b) to include in the business to be dealt with at the meeting any matter
(other than a proposed resolution) which may be properly included
in the business.
A resolution may properly be moved or a matter may properly be included
in the business unless:
(a) (in the case of a resolution only) it would, if passed, be ineffective
(whether by reason of inconsistency with any enactment or the
company’s constitution or otherwise),
(b) it is defamatory of any person or
(c) it is frivolous or vexatious.
Such a request may be in hard copy form or in electronic form, and must
identify the resolution of which notice is to be given or the matter to be
included in the business, must be authorised by the person or persons
making it, must be received by the Company not later than 15 June
2016, being the date six clear weeks before the meeting, and (in the case
of a matter to be included in the business only) must be accompanied by
a statement setting out the grounds for the request.
Therefore, the total voting rights in the Company as at 20 June 2016 were
55,556,203. No shares are held in Treasury.
19. This notice, together with information about the total number of shares in
the Company in respect of which members are entitled to exercise voting
rights at the meeting as at 20 June 2016 being the latest practicable
date prior to the printing of this notice and, if applicable, any members’
statements, members’ resolutions or members’ matters of business
received by the Company after the date of this notice, will be available at
www.fandcglobalsmallers.com.
20. Any electronic address provided either in this notice or in any
related documents (including the Form of Proxy) may not be used to
communicate with the Company for any purposes other than those
expressly stated.
21. Copies of the letters of appointment between the Company and its
Directors; a copy of the articles of association of the Company; the
register of Directors’ holdings; and a deed poll relating to Directors’
indemnities will be available for inspection at the registered office of the
Company during usual business hours on any weekday (Saturdays,
Sundays and Bank Holidays excluded) until the date of the meeting and
also on the date and at the place of the meeting from 15 minutes prior to
the commencement of the meeting to the conclusion thereof.
22. No Director has a service agreement with the Company.

Report and Accounts 2016 | 91
INFORMATION
Information for Shareholders
OV
ER
VIE
WS
TR
AT
EG
IC R
EP
OR
TG
OV
ER
NA
NC
E R
EP
OR
TA
UD
ITO
RS
’ RE
PO
RT
FINA
NC
IAL R
EP
OR
TN
OT
ICE
OF M
EE
TIN
GO
TH
ER
INFO
RM
AT
ION
Association of Investment Companies (“AIC”)F&C Global Smaller Companies PLC is a member of the AIC, which publishes a monthly statistical information service in respect of member companies. The publication also has details of ISA and other investment plans available. For further details, please contact the AIC on 020 7282 5555, or visit the website: www.theaic.co.uk
Electronic communicationsComputershare provides a service to enable shareholders to receive shareholder correspondence electronically (including annual and half yearly financial reports) if they wish. If a shareholder opts to receive documents in this way, paper documents will only be available on request. Shareholders who opt for this service will receive a Notice of Availability via e-mail from Computershare with a link to the relevant section of the Company’s website where the documents can be viewed or printed. For more information, to view the terms and conditions and to register for this service, please visit Computershare’s internet site at www.investorcentre.co.uk (you will need your shareholder reference number which can be found on your share certificate or dividend confirmation).
Common reporting standardsNew tax legislation was introduced on 1 January 2016. Investment trust companies are required to provide information annually to the local tax authority on the tax residencies of a number of non-UK based certificated shareholders, and corporate entities, who have purchased shares in investment trusts. Only a small number of our shareholders fall into this category and only those shareholders will receive a request from the registrar for personal information to comply with this legal obligation. If you have any queries on the validity of any document received from the registrar you can contact them directly on 0370 889 4088.
Registered in England and Wales with Company Registration No. 28264
Information for Shareholders
Net asset value and share priceThe Company’s net asset value per share is released daily, on the working day following the calculation date, to the London Stock Exchange. The current share price of F&C Global Smaller Companies PLC is shown in the investment trust section of the stock market page in most leading newspapers, usually under “F&C Global Smaller Cos”.
Performance informationInformation on the Company’s performance is provided in the half-yearly and final reports which are sent to shareholders in December and June respectively. More up-to-date performance information is available on the Internet at www.fandcglobalsmallers.com under “Investor Information”. This website also provides a monthly update on the Company’s geographic spread and largest holdings, along with comments from the Lead Manager.
UK capital gains tax (“CGT”)An approved investment trust does not pay tax on capital gains. UK resident individuals may realise net capital gains of up to £11,100 in the tax year ended 5 April 2017 without incurring any tax liability.
A rate of CGT of 10% will apply where taxable income and gains do not exceed the income tax higher rate threshold (£32,000 in 2016–17 tax year). A higher rate of 20% will apply to those whose income and gains exceed this figure.
Income taxThe recommended final dividend of 7.80 pence per share is payable on 12 August 2016. From April 2016 dividend tax credits will be replaced by an annual £5,000 tax-free allowance to UK residents on dividend income received in their entire share portfolios. Dividend income received in excess of this amount will be taxed at rates of 7.5% (basic rate taxpayers), 32.5% (higher rate taxpayers) or 38.1% (additional rate taxpayers).
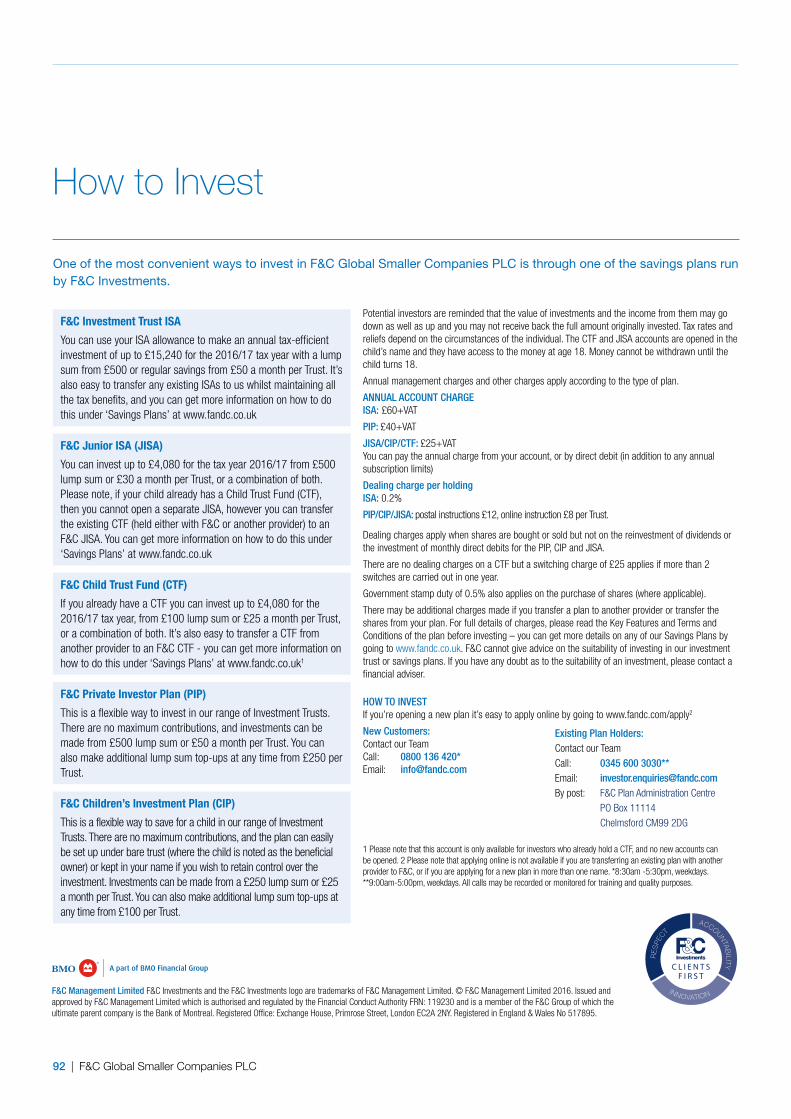
92 | F&C Global Smaller Companies PLC
Potential investors are reminded that the value of investments and the income from them may go down as well as up and you may not receive back the full amount originally invested. Tax rates and reliefs depend on the circumstances of the individual. The CTF and JISA accounts are opened in the child’s name and they have access to the money at age 18. Money cannot be withdrawn until the child turns 18.
Annual management charges and other charges apply according to the type of plan.
ANNUAL ACCOUNT CHARGE ISA: £60+VAT
PIP: £40+VAT
JISA/CIP/CTF: £25+VAT You can pay the annual charge from your account, or by direct debit (in addition to any annual subscription limits)
Dealing charge per holdingISA: 0.2%
PIP/CIP/JISA: postal instructions £12, online instruction £8 per Trust.
Dealing charges apply when shares are bought or sold but not on the reinvestment of dividends or the investment of monthly direct debits for the PIP, CIP and JISA.
There are no dealing charges on a CTF but a switching charge of £25 applies if more than 2 switches are carried out in one year.
Government stamp duty of 0.5% also applies on the purchase of shares (where applicable).
There may be additional charges made if you transfer a plan to another provider or transfer the shares from your plan. For full details of charges, please read the Key Features and Terms and Conditions of the plan before investing – you can get more details on any of our Savings Plans by going to www.fandc.co.uk. F&C cannot give advice on the suitability of investing in our investment trust or savings plans. If you have any doubt as to the suitability of an investment, please contact a financial adviser.
HOW TO INVESTIf you’re opening a new plan it’s easy to apply online by going to www.fandc.com/apply2
New Customers:Contact our TeamCall: 0800 136 420*Email: [email protected]
Existing Plan Holders:Contact our TeamCall: 0345 600 3030**Email: [email protected] post: F&C Plan Administration Centre PO Box 11114 Chelmsford CM99 2DG
How to Invest
One of the most convenient ways to invest in F&C Global Smaller Companies PLC is through one of the savings plans run by F&C Investments.
F&C Management Limited F&C Investments and the F&C Investments logo are trademarks of F&C Management Limited. © F&C Management Limited 2016. Issued and approved by F&C Management Limited which is authorised and regulated by the Financial Conduct Authority FRN: 119230 and is a member of the F&C Group of which the ultimate parent company is the Bank of Montreal. Registered Office: Exchange House, Primrose Street, London EC2A 2NY. Registered in England & Wales No 517895.
INNOVATION
RE
SP
EC
T ACCOUN
TAB
ILITY
C L I E N T SF I R S T
F&C Investment Trust ISA
You can use your ISA allowance to make an annual tax-efficient investment of up to £15,240 for the 2016/17 tax year with a lump sum from £500 or regular savings from £50 a month per Trust. It’s also easy to transfer any existing ISAs to us whilst maintaining all the tax benefits, and you can get more information on how to do this under ‘Savings Plans’ at www.fandc.co.uk
F&C Junior ISA (JISA)
You can invest up to £4,080 for the tax year 2016/17 from £500 lump sum or £30 a month per Trust, or a combination of both. Please note, if your child already has a Child Trust Fund (CTF), then you cannot open a separate JISA, however you can transfer the existing CTF (held either with F&C or another provider) to an F&C JISA. You can get more information on how to do this under ‘Savings Plans’ at www.fandc.co.uk
F&C Child Trust Fund (CTF)
If you already have a CTF you can invest up to £4,080 for the 2016/17 tax year, from £100 lump sum or £25 a month per Trust, or a combination of both. It’s also easy to transfer a CTF from another provider to an F&C CTF - you can get more information on how to do this under ‘Savings Plans’ at www.fandc.co.uk1
F&C Private Investor Plan (PIP)
This is a flexible way to invest in our range of Investment Trusts. There are no maximum contributions, and investments can be made from £500 lump sum or £50 a month per Trust. You can also make additional lump sum top-ups at any time from £250 per Trust.
F&C Children’s lnvestment Plan (CIP)
This is a flexible way to save for a child in our range of Investment Trusts. There are no maximum contributions, and the plan can easily be set up under bare trust (where the child is noted as the beneficial owner) or kept in your name if you wish to retain control over the investment. Investments can be made from a £250 lump sum or £25 a month per Trust. You can also make additional lump sum top-ups at any time from £100 per Trust.
1 Please note that this account is only available for investors who already hold a CTF, and no new accounts can be opened. 2 Please note that applying online is not available if you are transferring an existing plan with another provider to F&C, or if you are applying for a new plan in more than one name. *8:30am -5:30pm, weekdays. **9:00am-5:00pm, weekdays. All calls may be recorded or monitored for training and quality purposes.
Report and Accounts 2016 | 93
GOVERNANCE REPORT
Management and Advisers
OV
ER
VIE
WS
TR
AT
EG
IC R
EP
OR
TG
OV
ER
NA
NC
E R
EP
OR
TA
UD
ITO
RS
’ RE
PO
RT
FINA
NC
IAL R
EP
OR
TN
OT
ICE
OF M
EE
TIN
GO
TH
ER
INFO
RM
AT
ION
Management and Advisers
The Management CompanyThe Company is managed by F&C Investment Business Limited (“FCIB” or the “Manager”), a wholly-owned subsidiary of F&C Asset Management Group (“F&C”) which is ultimately owned by Bank of Montreal. FCIB is appointed under a management agreement with the Company, setting out its responsibilities for investment management, administration and marketing. As Manager, it is authorised and regulated in the UK by the Financial Conduct Authority.
The Manager also acts as the Alternative Investment Fund Manager (“AIFM”).
Peter Ewins Lead Manager: Responsible for the UK equity portfolio, selection of collective funds for Japan, Asia, Emerging Markets and overall asset allocation. He joined F&C in 1996.
Nish Patel: Responsible for the US portfolio. He joined F&C in 2007.
Sam Cosh: Responsible for the Continental European portfolio. He joined F&C in 2010.
Jan Baker: Represents the Manager as Company Secretary and is responsible for the Company’s statutory compliance. She joined F&C in 2005.
Marrack Tonkin: Head of Investment Trusts of F&C Asset Management plc. He has responsibility for F&C’s relationship with the Company. He joined F&C in 1989.
Secretary and Company’s Registered OfficeF&C Investment Business Limited, Exchange House, Primrose Street, London EC2A 2NY
Telephone: 020 7628 8000 Facsimile: 020 7628 8188 Website: www.fandc.com Email: [email protected]
Independent AuditorPricewaterhouseCoopers LLP (“PwC” or the “auditors”), 7 More London Riverside London SE1 2RT
Bankers JPMorgan Chase Bank, 25 Bank Street, Canary Wharf, London E14 5JP
CustodianJPMorgan Chase Bank (the “Custodian”), 25 Bank Street, Canary Wharf, London E14 5JP
DepositaryJPMorgan Europe Limited (the “Depositary”), 25 Bank Street, Canary Wharf, London E14 5JP
Share RegistrarsComputershare Investor Services PLC (the “Registrar”), The Pavilions, Bridgwater Road, Bristol BS99 6ZZ Telephone: 0370 889 4088 Authorised and regulated in the UK by the Financial Conduct Authority.
SolicitorsDickson Minto WS, Broadgate Tower, 20 Primrose Street, London EC2A 2EW
StockbrokersStifel Nicolaus Europe Limited, 150 Cheapside, London EC2V 6ET
Trustee for CULS holdersThe Law Debenture Trust Corporation plc Fifth Floor, 100 Wood Street, London EC2V 7EX
94 | F&C Global Smaller Companies PLC
Glossary of Terms
AAF Report – Report prepared in accordance with Audit and Assurance Faculty guidance issued by the Institute of Chartered Accountants in England and Wales.
Administrator – State Street Bank and Trust Company.
AIFMD – Alternative Investment Fund Managers Directive. Issued by the European Parliament in 2012 and 2013, the Directive requires that all investment vehicles (“AIFs”) in the European Union, including Investment Trusts, must appoint a Depositary and an Alternative Investment Fund Manager (“AIFM”). The Board of Directors of an Investment Trust, nevertheless, remains fully responsible for all aspects of the Company’s strategy, operations and compliance with regulations. The Company’s AIFM is F&C Investment Business Limited (“FCIB”), a wholly-owned subsidiary of F&C Asset Management plc and ultimately BMO.
BMO – Bank of Montreal, which is the ultimate parent company of F&C
Benchmark – a blend of two Indices, namely the MSCI All Country World ex UK Small Cap Index (70%) and the Numis UK Smaller Companies (ex investment companies) Index (30%). This benchmark, against which the increase or decrease in the Company’s net asset value is measured, measures the performance of a defined selection of smaller companies listed in stock markets around the world and gives an indication of how those companies have performed in any period. Divergence between the performance of the Company and the Benchmark is to be expected as: the investments within this Index are not identical to those of the Company; the Index does not take account of operating costs; and the Company’s strategy does not include replicating (tracking) this Index.
Closed-end company – a company, including an Investment Company, with a fixed issued ordinary share capital the shares of which are traded on an exchange at a price not necessarily related to the net asset value of the company and which can only be issued or bought back by the company in certain circumstances.
CULS – 3.5% Convertible Unsecured Loan Stock 2019 – issued in July 2014 and listed on the LSE. The CULS can be bought and sold on the LSE and can be converted at specified dates into the Company’s ordinary shares.
Cum-dividend – shares are classified as cum-dividend when the buyer of a security is entitled to receive a dividend that has been declared, but not paid. Shares which are not cum-dividend are described as ex-dividend.
Custodian – The Custodian is JP Morgan Chase Bank. The custodian is a financial institution responsible for safeguarding, worldwide, the listed securities and certain cash assets of the Company, as well as the income arising therefrom, through provision of custodial, settlement and associated services.
Depositary – The Depositary is JPMorgan Europe Limited. Under AIFMD rules applying from July 2014, the Company must appoint a Depositary, whose duties in respect of investments, cash and similar assets include: safekeeping; verification of ownership and valuation; and cash monitoring. Under the AIFMD rules, the Depositary has strict liability for the loss of the Company’s financial assets in respect of which it has safe–keeping duties. The Depositary’s oversight duties will include but are not limited to oversight of share buybacks, dividend payments and adherence to investment limits.

Report and Accounts 2016 | 95
INFORMATION
OV
ER
VIE
WS
TR
AT
EG
IC R
EP
OR
TG
OV
ER
NA
NC
E R
EP
OR
TA
UD
ITO
RS
’ RE
PO
RT
FINA
NC
IAL R
EP
OR
TN
OT
ICE
OF M
EE
TIN
GO
TH
ER
INFO
RM
AT
ION
Diluted Net Asset Value – assumes that the CULS are converted into ordinary shares at the rate of 977.697 pence per £1 nominal CULS value (see “Net Asset Value” and note 21 on the accounts).
Discount/Premium – the share price of an Investment Trust is derived from buyers and sellers trading their shares on the stock market. This price is not identical to NAV per share of the underlying assets less liabilities of the Company. If the share price is lower than the NAV per share, the shares are trading at a discount. This usually indicates that there are more sellers of shares than buyers. Shares trading at a price above NAV per share are said to be at a premium, in which case there tend to be more buyers than sellers. The Board of the Company tries to ensure that the shares trade, in normal market conditions, at around the value of the net assets. This is done by means of buying shares from sellers at the below-NAV price (and placing them in Treasury or cancelling and issuing at discount out of Treasury) or selling new shares to shareholders at a premium to NAV. Buybacks and issues effectively create an accretion to NAV and for the Company and at least temporarily deal with the perceived excess of shares in the market.
Distributable Reserves – Reserves distributable by way of dividend or for the purpose of buying back ordinary share capital (see notes 2, 17, 18 and 20 on the accounts). Company Law requires that Share Capital and the Capital Redemption Reserve may not be distributed. The Company’s articles of association allow distributions by way of dividend out of Capital Reserves. Dividend payments are currently made out of Revenue Reserve. The cost of all share buybacks is deducted from Capital Reserves.
Dividend Dates – Reference is made in announcements of dividends to three dates. The “record” date is the date after which buyers of the shares will not be recorded on the register of shareholders as qualifying for the pending dividend payment. The “payment” date is the date that dividends are credited to shareholders’ bank accounts. The “ex-dividend” date is normally the business day prior to the record date (most ex-dividend dates are on a Thursday).
F&C – F&C Asset Management plc and its subsidiaries (including the Manager).
GAAP – Generally Accepted Accounting Practice. This includes UK GAAP and International GAAP (IFRS or International Financial Reporting Standards applicable in the European Union).
Gearing – this is the ratio of the borrowings of the Company to its net assets. Borrowings have a “prior charge” over the assets of a company, ranking before ordinary shareholders in their entitlement to capital and/or income. They include: preference shares; debentures; overdrafts and short and long-term loans from banks; and derivative contracts. If the Company has cash assets, these may be assumed either to net off against borrowings, giving a “net” or ”effective” gearing percentage, or to be used to buy investments, giving a “gross” or “fully invested” gearing figure. Where cash assets exceed borrowings, the Company is described as having “net cash”. The Company’s maximum permitted level of gearing is set by the Board and is described within the Strategic Report and Directors’ Report.
Investment Company (Section 833) – UK Company Law allows an Investment Company to make dividend distributions out of realised distributable reserves, even in circumstances where it has made Capital losses in any year, provided the Company’s assets remaining after payment of the dividend exceed 150% of the liabilities. An Investment Company is defined as investing its funds in shares, land or other assets with the aim of spreading investment risk.
Investment Trust taxation status (Section 1158) – UK Corporation Tax law allows an Investment Company (referred to in Tax law as an Investment Trust) to be exempted from tax on its profits realised on investment transactions, provided it complies with certain rules. These are similar to Section 833 Company law rules but further require that the Company must be listed on a regulated stock exchange and that it cannot retain more than 15% of income received. The Directors Report contains confirmation of the Company’s compliance with this law and its consequent exemption from taxation on capital gains.
Leverage – as defined under AIFMD rules, leverage is any method by which the exposure of an AIF (being an investment vehicle under the AIFMD) is increased through borrowing of cash or securities or leverage embedded in derivative positions.

96 | F&C Global Smaller Companies PLC
Leverage is broadly equivalent to gearing, but is expressed as a ratio between the assets (excluding borrowings) and the net assets (after taking account of borrowings). Under the gross method, exposure represents the sum of the Company’s positions after deduction of cash balances, without taking account of any hedging or netting arrangements. Under the commitment method, exposure is calculated without the deduction of cash balances and after certain hedging and netting positions are offset against each other.
Manager (AIFM) – F&C Investment Business Limited (“FCIB”), a subsidiary of F&C Asset Management plc, which in turn is wholly owned by the Bank of Montreal Group (“BMO”). The responsibilities and remuneration of FCIB are set out in the Business Model, Directors’ Report and note 4 on the accounts.
Net asset value (NAV) – the assets less liabilities of the Company, as set out in the Balance Sheet, all valued in accordance with the Company’s Accounting Policies (see note 2 on the accounts) and UK Accounting Standards. The net assets correspond to Total Shareholders’ Funds, which comprise the share capital account, capital redemption reserve and capital and revenue reserves.
Non-executive Director – a Director who has a contract for services, rather than a contract of employment, with the Company. The Company does not have any executive Directors. Non-executive Directors’ remuneration is described in detail in the Remuneration Report. The duties of the Directors, who govern the Company through the auspices of a Board and Committees of the Board, are set out in the Corporate Governance Statement.
OEICs – Open-Ended Investment Companies, an Open-ended Fund.
Ongoing Charges – all operating costs expected to be regularly incurred and that are payable by the Company or suffered within underlying investee fund, expressed as a proportion of the average net assets of the Company over the reporting year (see Ten Year Record). The costs of buying and selling investments and derivatives are excluded, as are interest costs, taxation, non-recurring costs and the costs of buying back or issuing ordinary shares.
Open-ended Fund – a collective investment scheme which issues shares or units directly to investors, and redeems directly from investors, at a price that is linked to the net asset value of the fund.
SORP – Statement of Recommended Practice. The accounts of the Company are drawn up in accordance with the Investment Trust SORP, issued by the AIC, as described in note 2 on the accounts.
Total expense ratio (TER) – an alternative measure of expenses to Ongoing Charges. It comprises all operating costs incurred in the reporting period by the Company, calculated as a percentage of the average net assets in that year (see Ten Year Record). Operating costs exclude costs suffered within underlying investee funds, costs of buying and selling investments and derivatives, interest costs, taxation and the costs of buying back or issuing ordinary shares.
Total return – the return to shareholders calculated on a per share basis by adding dividends paid in the period to the increase or decrease in the Share Price or NAV in the period. The dividends are assumed to have been re-invested in the form of shares or net assets, respectively, on the date on which the shares were quoted ex-dividend.
Trust Deed – the trust deed between the Company and the Trustee constituting the CULS.
Trustee – The Law Debenture Trust Corporation plc.
UK Code of Corporate Governance (UK Code) – the standards of good practice in relation to board leadership and effectiveness, remuneration, accountability and relations with shareholders that all companies with a Premium Listing on the London Stock Exchange are required to report on in their annual report and accounts.

Warning to shareholders – Beware of Share Fraud.
Fraudsters use persuasive and high-pressure tactics to lure investors into scams. They may offer to sell shares that turn out to be worthless or non-existent,
or to buy shares at an inflated price in return for an upfront payment.
If you receive unsolicited investment advice or requests:
• Check the Financial Services Register from www.fca.org.uk to see if the person or firm contacting you is authorised by the FCA
• Call the Financial Conduct Authority ('FCA') on 0800 111 6768 if the firm does not have contact details on the Register or you are told they are out of date
• Search the list of unauthorised firms to avoid at www.fca.org.uk/scams
• Consider that if you buy or sell shares from an unauthorised firm you will not have access to the Financial Ombudsman Service or Financial Services
Compensation Scheme
• Think about getting independent financial and professional advice
If you are approached by fraudsters please tell the FCA by using the share fraud reporting form at www.fca.org.uk/scams where you can find out more about
investment scams. You can also call the FCA Consumer Helpline on 0800 111 6768. If you have already paid money to share fraudsters you should contact
Action Fraud on 0300 123 2040.

F&C Global Smaller Companies PLC
GSC/Ann/16
Registered office:Exchange House, Primrose Street, London EC2A 2NYTel: 020 7628 8000 Fax: 020 7628 [email protected]
Registrars:Computershare Investor Services PLC,The Pavilions, Bridgwater Road,Bristol BS99 6ZZTel: 0800 923 1506 Fax: 0870 703 [email protected]
REPORT AND ACCOUNTS 2016