Embed Size (px)
Citation preview


Syllabus
Introduction to Physical Geography
GPHY 111
Instructor: Dr. Neil Suits
Phone: (406) 896-5931
Office: Science 118
Office Hours: Mondays and Fridays: 9-11, and of course by appointment.
Class meets in the Science Auditorium Tuesdays and Thursdays, 10:30-12:00 pm
Required Texts:
Introducing Physical Geography, 4th Ed., Strahler and Strahler, Wiley, 2006.
Geologic Map of Montana
At times there may also be other handouts and readings
Grading:
Homework 15%
Exams: 3 midterms + Final 80%
Class Participation 5%
Homework is ungraded, i.e., you either get credit or you don‟t. However, I may ask you to redo an assignment if I think it is not up to
snuff. Homework will generally be short (sometimes mindless) exercises intended to reinforce basic knowledge and ideas. Some of
these will involve reproducing „visual overviews‟ found at the beginning of many of our textbook‟s chapters. Homework may include a
Physical Map of the World, Mountain ranges of the world, Maps of Climate Zones, Land Use, Wind Patterns, Ocean Currents, factors
affecting Climate Change etc.
It would probably be a good idea to get some colored pencils or pens for the homework. These will also be helpful in the labs.
Lectures will generally posted in the morning at: http://www.msubillings.edu/sciencefaculty/Spring%202010%20handouts.htm
These can be printed out at no charge at several MSU-B facilities
For learning basic geographic facts and names check out: http://www.ilike2learn.com/

http://www.cnn.com/video/#/video/weather/2010/01/13/rob.marciano.haiti.cnn

Introducing Physical Geography
• Introducing Geography
• Spheres, Systems, Cycles and Trends
• Physical Geography, Environment, and
Global Change

Introducing Geography
Geography can be subdivided into human
geography and physical geography
human geography examines economic, social and
behavioral processes
physical geography examines natural processes

Geographic fields of study
They all interact
Spheres, Systems and Cycles
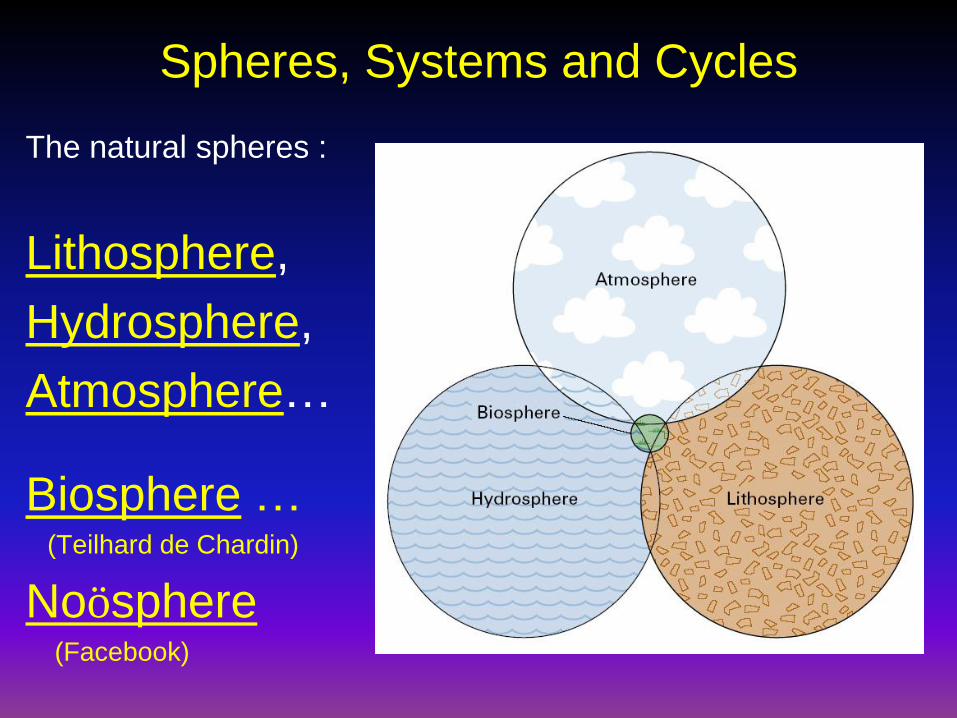
The natural spheres :
Lithosphere,
Hydrosphere,
Atmosphere…
Biosphere …(Teilhard de Chardin)
Noösphere(Facebook)

Spheres, Systems and Cycles
The life layer is the shallow Earth surface layer where the
four realms (or spheres) interact and where most life forms
are found
lithosphere
Hydrosphere
Atmosphere
Biosphere

Spheres, Systems and Cycles
Scale, pattern and process are three interrelated geographic themes
Scale: the level of structure or organization at which a phenomenon is studied
Pattern: variation in phenomenon observed at a particular scale, diurnal (day-night) cycles, El Niño, Atlantic Oscillation…
Process: how the factors that affect a phenomenon act to produce a pattern at a particular scale
Example: Process (wind) >>>> Pattern (waves)

Spatial Scales
Processes in the four spheres
are studied at different spatial
scales or levels of detail (global,
continental, regional, local,
individual, microscopic,
atomic…)

1000-Year Temperature Records
Global

Box 11.1, Figure 2
Regional

Local

Local

Natural Systems
a system is a collection of physical
processes that are linked and act together in
an organized way
a systems approach to physical geography
looks for quantitative linkages and
interactions between processes and rates
this is a kind of accounting!
Feedbacks: Positive and Negative

Cycles
Cycles are periodic changes in rates of
processes that can occur on periods of any
time scale.
e.g., rotation of the Milky Way galaxy,
revolution of the Earth about the Sun, daily
rotation of the Earth about its axis, waves
hitting a beach, a vibrating guitar string, the
vibration of an atom…..


Tides
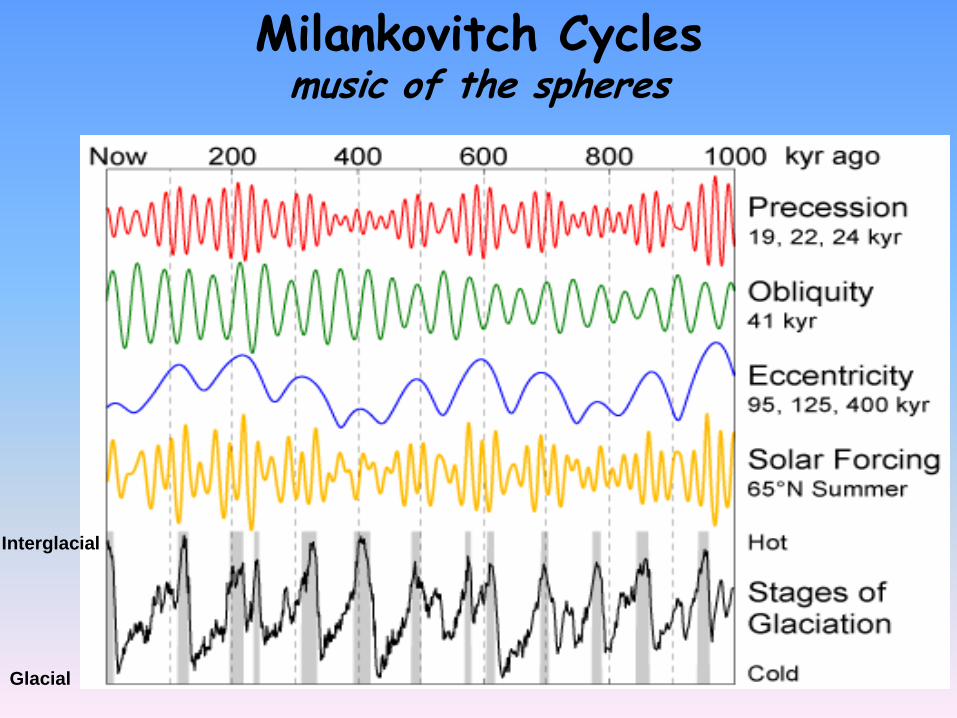
Milankovitch Cyclesmusic of the spheres
Interglacial
Glacial

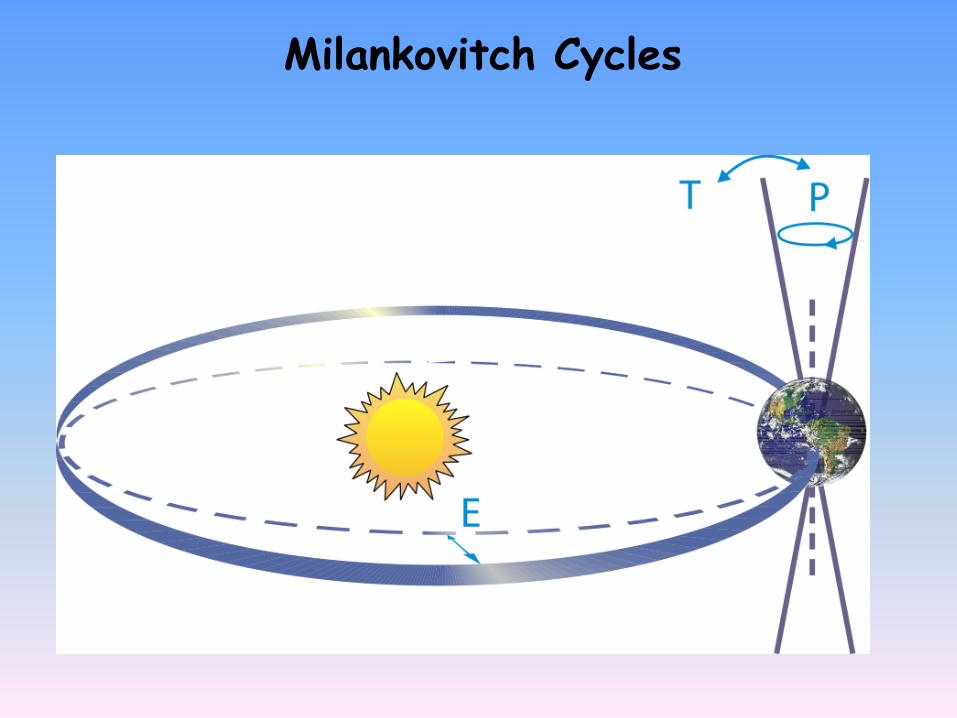
Milankovitch Cycles

Eccentricity (~100 Ka)

Orbital Obliquity (Axial tilt; ~41 Ka) and Precession (~26 Ka)

Trends
Trends are long term monotonic changes in
rates of processes.
e.g., change in Sun‟s solar output, the
rise of oxygen in the atmosphere, global
warming,….

Recent Increases in Carbon Dioxide
• Human activities have caused dramatic increases in
greenhouse gas concentrations
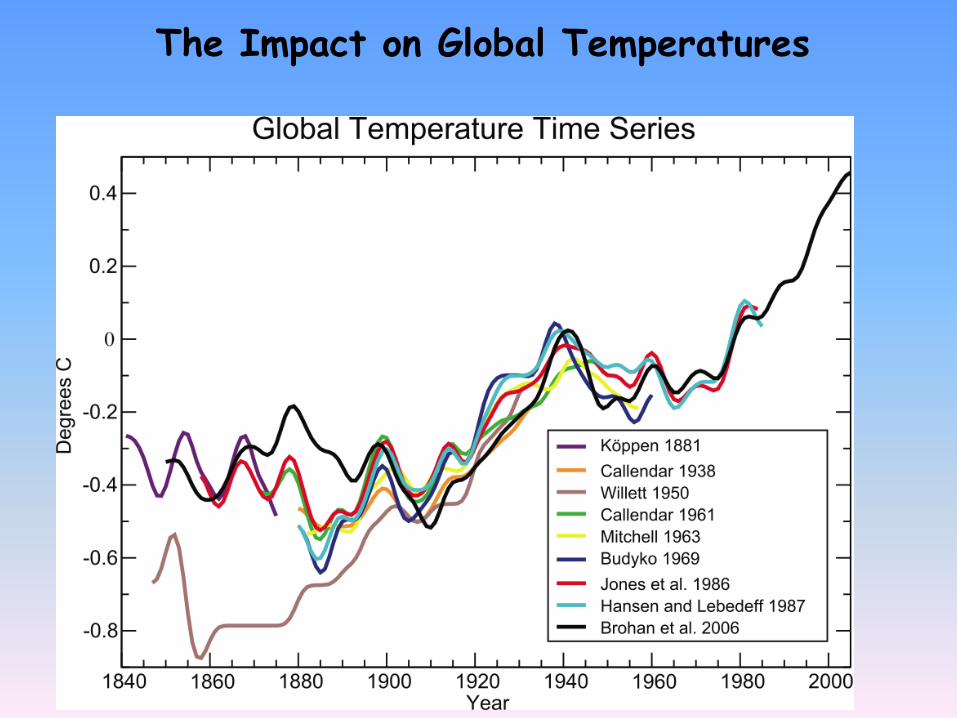
The Impact on Global Temperatures

Physical Geography, Environment, and
Global Change
Physical geography is also concerned with the relationships between humans and their environments
Environmental change is caused by both natural processes and human interference
Some important topics of global change that physical geographers are investigating are global climate change, the carbon cycle, biodiversity, pollution, and extreme events

Basic Tools
Maps
What can maps show us?

Political boundaries

Is this a map?

Seasonal Air Temperature Patterns
• Stronger seasonal heating and cooling on land produces asymmetry
• Poleward distortion of isotherms over northern high latitude oceans
• Equatorward distortion over subtropics
winter
summer
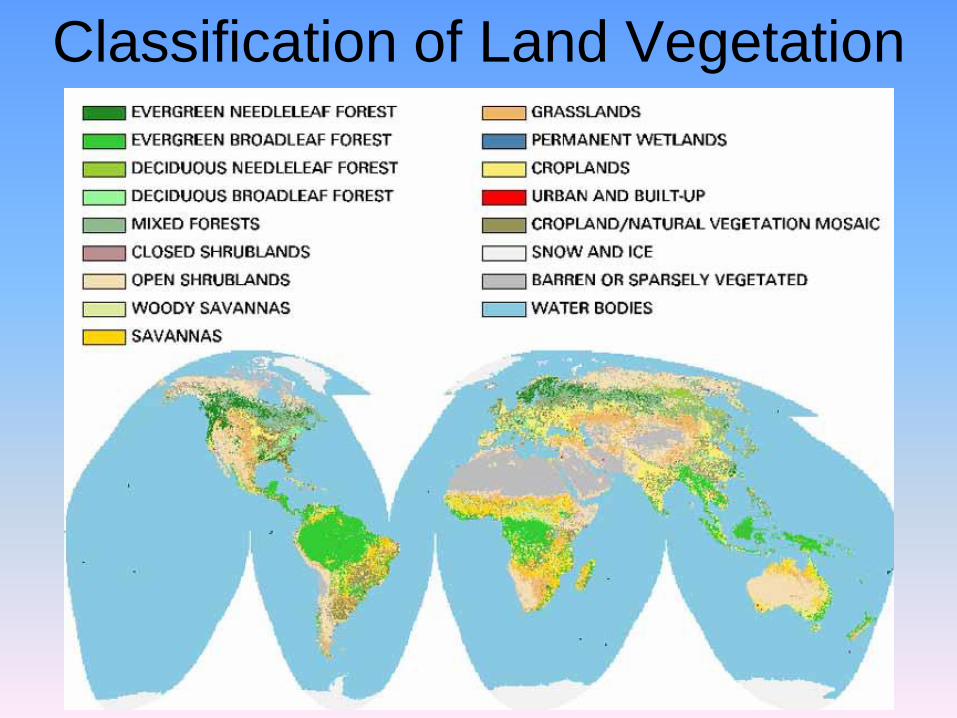
Classification of Land Vegetation

Sea Surface Temperature (SST)

Physical features

Tectonic features
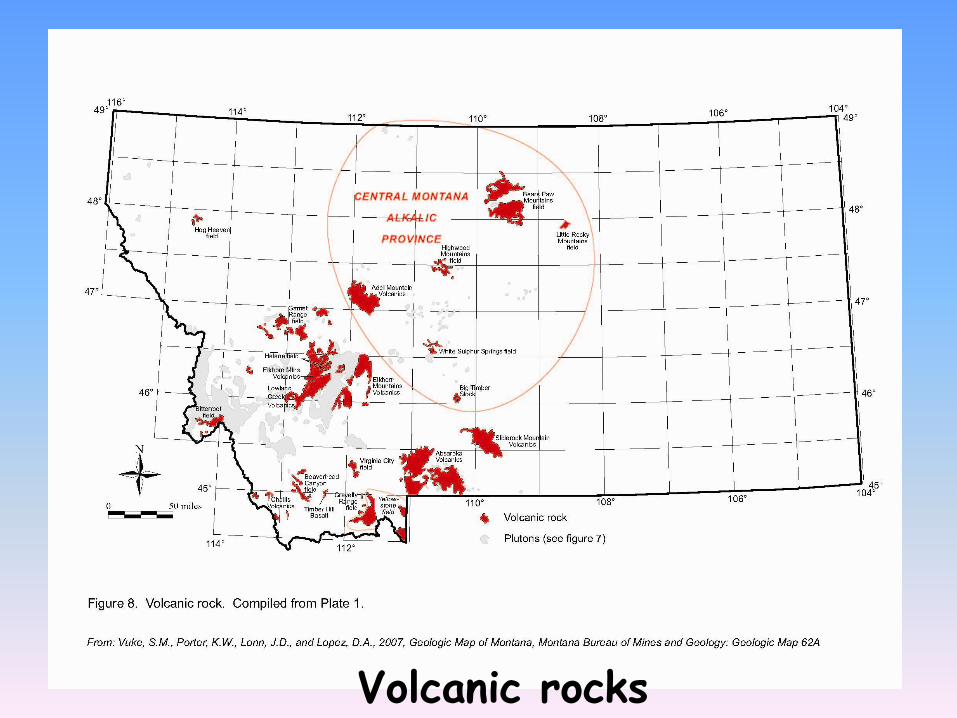
Volcanic rocks

Major faults

Precipitation

Geologic Formations

Geographic Information Systems (GIS)
Geographers use specialized tools including maps, geographical information systems (GIS), remote sensing,mathematical modeling andstatistics to allow them to portray information that varies spatially on the Earth‟s surface
p. 13

Processes
Example:
Convection

Heat driven
convection
1. Bottom water is warmed
2. It expands an is therefore less dense
3. It rises to the surface and then
spreads out
4. Cooler water at the sides descends to
fill the void

A convective thunderstorm


Some of
the topics
we will
study

Weather and
Climate
http://www.cnn.com/video/#/video/weather/2010/01/13/rob.marciano.haiti.cnn


Planetary Energy Balance
Energy In = Energy Out
2 2 4(1 ) 4S R R T
o18 CT
But the observed Ts is about 15° C

What‟s Missingfrom the 0-D energy balance model?
• Vertical structure
The “greenhouse effect”
• Energy storage and transport
The “general circulation” of the atmosphere
and oceans
In other words, The Greenhouse Effect!

Temperature Patterns• Stronger seasonal
heating and cooling on land produces asymmetry
• Poleward distortion of isotherms over northern high latitude oceans
• Equatorward distortion over subtropics

How is Energy Transportedto its “escape zones?”
• Both atmospheric and ocean transport are crucial
• Buoyancy-driven convection drives vertical transport
• Latent heat is at least as important as sensible heat
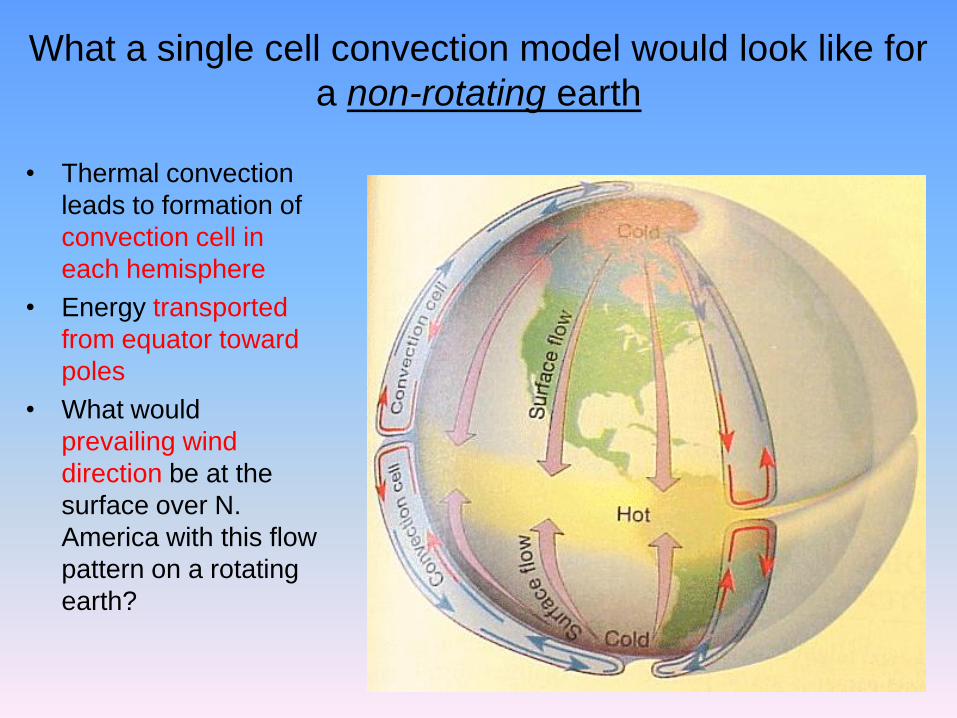
What a single cell convection model would look like for
a non-rotating earth
• Thermal convection
leads to formation of
convection cell in
each hemisphere
• Energy transported
from equator toward
poles
• What would
prevailing wind
direction be at the
surface over N.
America with this flow
pattern on a rotating
earth?

Coriolis Effect
The Coriolis Effect deflects moving objects to the right in the northern
hemisphere and to the left in the southern.


Climate “Zones”• Circulation features are
tied to regional climate
• Rising air associated
with lots of precipitation

Precipitation (mm/month)
January
July
• Very wet over tropics
• Seasonal shift (N/S)
• Monsoon regions
• Extremely dry subtropical highs
• Midlatitudes get more summer rain
• July rainfall looks like a map of forest cover

Biogeography

Classification of Land Vegetation


Tectonics
and
Landforms


RotatingGlobeLQ.mov
http://www.ngdc.noaa.gov/mgg/image/2minrelief.html

Western North
American
Mobile Belt
North
American
Craton
Shield
Eastern North
American
Mobile Belt
Platform


Ocean-Continent convergence


Northern Rocky Mountains
Young folded and faulted
mountains

Chinese WallBob Marshal Wilderness

Rocks and
Minerals
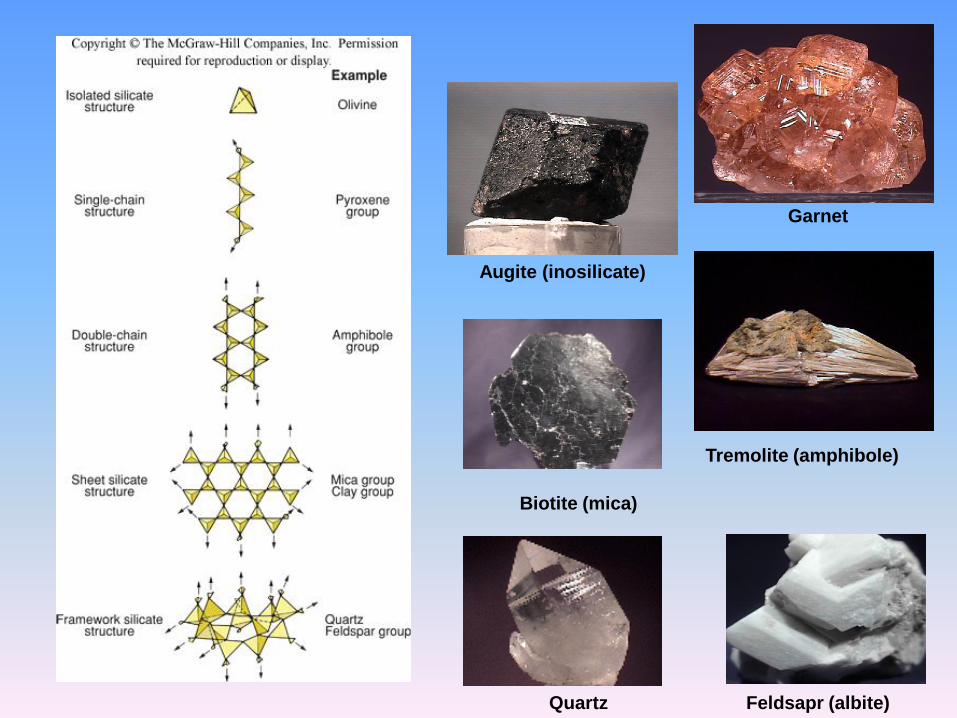
Biotite (mica)
Quartz Feldsapr (albite)
Tremolite (amphibole)
Augite (inosilicate)
Garnet


Imagine the first rock and the cycles that it
has been through.
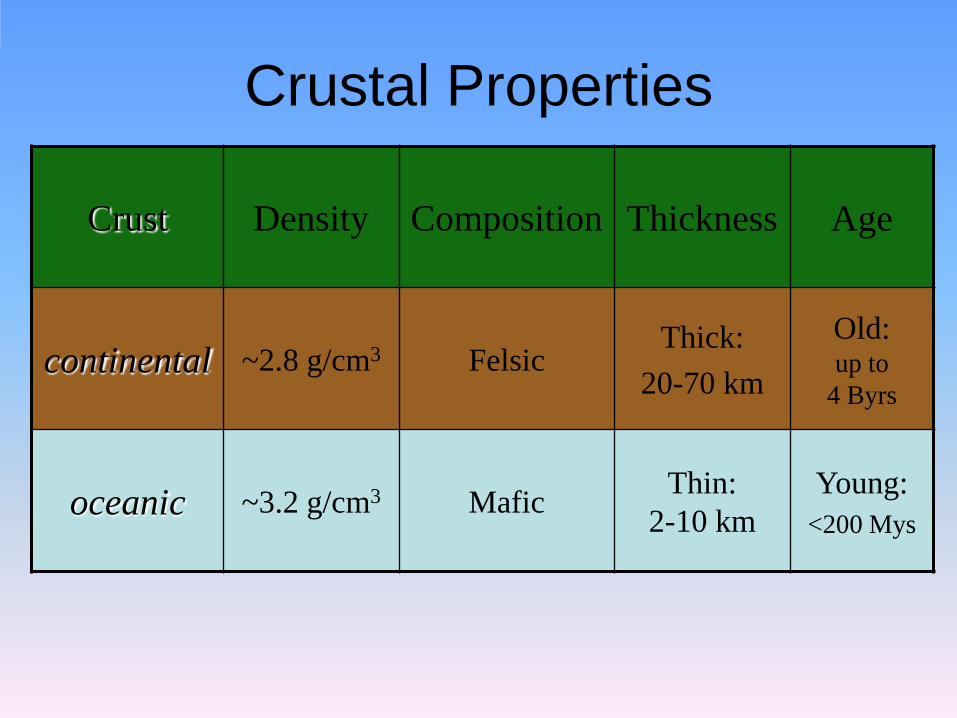
Crustal Properties
Crust Density Composition Thickness Age
continental ~2.8 g/cm3 FelsicThick:
20-70 km
Old:up to
4 Byrs
oceanic ~3.2 g/cm3 MaficThin:
2-10 km
Young:
<200 Mys


Flood basalts with several thick and
thin layers. Each layer represents a separate eruption.

Granite Batholiths:
Half Dome; part of the Sierra Nevada batholith
The
Hydrologic
Cycle and Its
Impact


Rivers and Landslides

Glaciers, Glacial/Interglacial
Cycles and Ice Ages


Ancient Moraines