Embed Size (px)
Citation preview
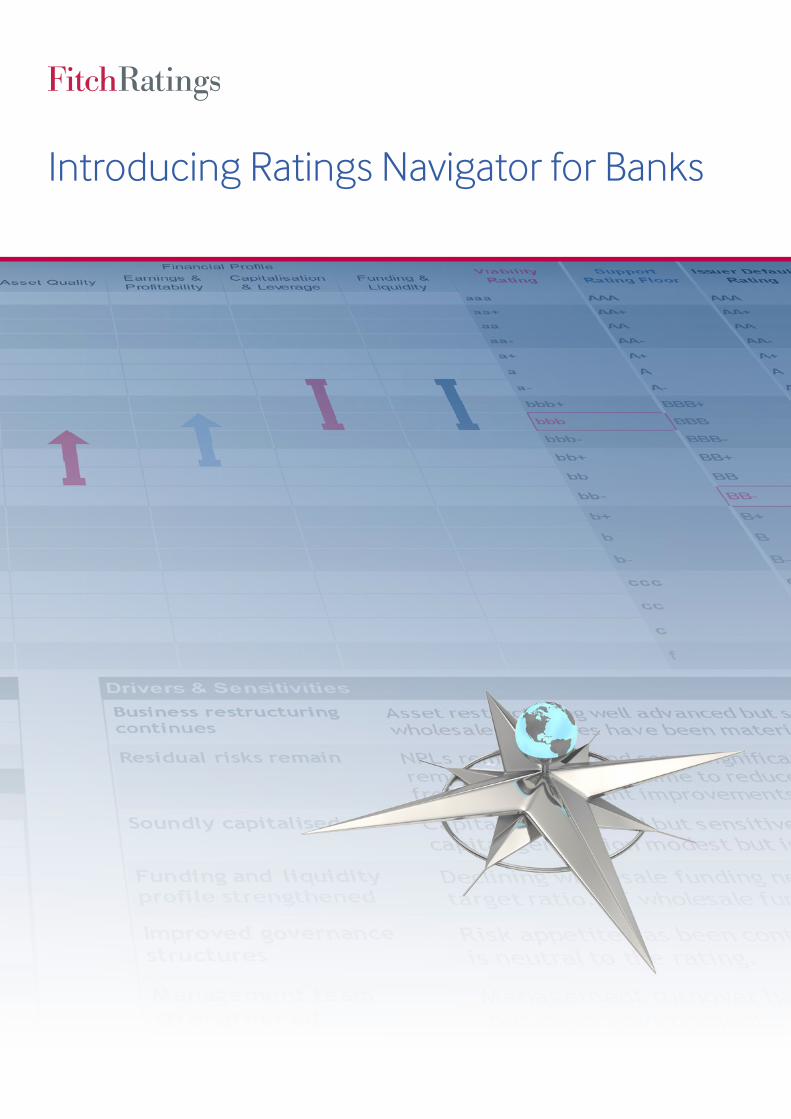
Introducing Ratings Navigator for Banks
www.fitchratings.com | April 2014 2
ContactsEMEA: Gordon Scott Financial Institutions +44 20 3530 1075 [email protected]
Bridget Gandy +44 20 3530 1095 [email protected]
James Longsdon +44 20 3530 1076 [email protected]
James Watson +7 495 956 9901 [email protected]
Erwin van Lumich +34 93 323 8403 [email protected]
David Weinfurter +44 20 3530 1505 [email protected]
North America: Joo-Yung Lee +1 212-908-0560 [email protected]
Chris Wolfe +1 212-908-0771 [email protected]
Nathan Flanders +1 212-908-0827 [email protected]
Asia Pacific: Mark Young +65 6796 7229 [email protected]
Jonathan Cornish +852 2263 9901 [email protected]
Latin America: Franklin Santarelli +1 212-908-0739 [email protected]
Business and Relationship Management: David Wharrier Managing Director +44 203 530 1150 [email protected]
David Turner EMEA +44 203 530 1442 [email protected]
John Bareiss North America +1 312 368 3162 [email protected]
Kathleen Holtzman LATAM +1 212 908 9103 [email protected]
Vivek Goyall APAC +65 6796 7203 [email protected]
Financial InstitutionsBank Ratings Navigator
Bank Ratings Navigator
Sector Details: aaa aaa AAA AAA RO+
Sector: aa+ aa+ AA+ AA+ RO+
Region: aa aa AA AA RO+
Country: aa- aa- AA- AA- RO+
Country IDR: AA- stable a+ a+ A+ A+ RO+
Last IDR Action: a a A A RO+
Last Action Date: a- a- A- A- RO+
Country Ceiling: AA+ bbb+ bbb+ BBB+ BBB+ RO+
Country MPI: 2 bbb bbb BBB BBB RO+
Country BSI: bbb+ bbb- bbb- BBB- BBB- RO+
bb+ bb+ BB+ BB+ RO+
Ratings History bb bb BB BB RO+
Date Viability Rating Action bb- bb- BB- BB- RO+
bbb b+ b+ B+ B+ RO+
bbb b b B B RO+
bbb- b- b- B- B- RO+
Date Support Floor Action ccc ccc CCC CCC RO+
BB- cc cc CC CC RO+
BB- c c C C RO+
BB- f f NF D or RD RO+
Date IDR Alert Action Support Rating Floor Drivers & Sensitivitiesbbb stable Typical D-SIFI SRF range for country's rating level (assuming high propensity)
bbb stable Actual country D-SIFI SRF
bbb- RO+ Bank Support Rating FloorBar Chart Legend: Support FactorsVertical bars = VR range of Rating Factor Sovereign Ability to Support System
Bar Colors = Influence on final VR Size of Banking System
Higher Influence Size of Potential Problem
Moderate Influence Structure of Banking System
Lower Influence Liability Structure of Banking System
Bar Arrows = Rating Factor Outlook Sovereign Financial Flexibility
Positive Negative Sovereign Propensity to Support System
Evolving Stable Track Record of Banking Sector Support
Resolution Legislation
Peer Ratings bars = Count of banks Government Statements of Support
51 Sovereign Propensity to Support Bank
9 Systemic Importance
Ownership (Non-Government)
Relevant Criteria & References Liability Structure of Bank
Specifics of Bank Failure
Policy Banks
Policy Role AnalystsFunding Guarantees and Legal Status 1st
Ownership (Government) 2nd
Global FI Rating Criteria
Country X Bank Sector ReviewEvaluating Corporate Governance
Peer Ratings Operating Environment
BB-
Company Profile
Management
A-
A+ to A-
Value
Negative
+44 (0) 20 3530 1000
+44 (0) 20 3530 1001
Issuer Default RatingCapitalisation
& Leverage
Risk Appetite
Support Rating FloorEarnings &
ProfitabilityAsset Quality
Financial Profile Viability Rating
Region/Sector
Country/Sector
Upgrade
19-Oct-11 Affirmed
19-Oct-11
24-Aug-12
12-Jul-13
12-Jul-13
24-Aug-12 Upgrade
Affirmed
Last Saved:
19-Oct-11
31-Jan-14
12-Nov-13
Affirmed
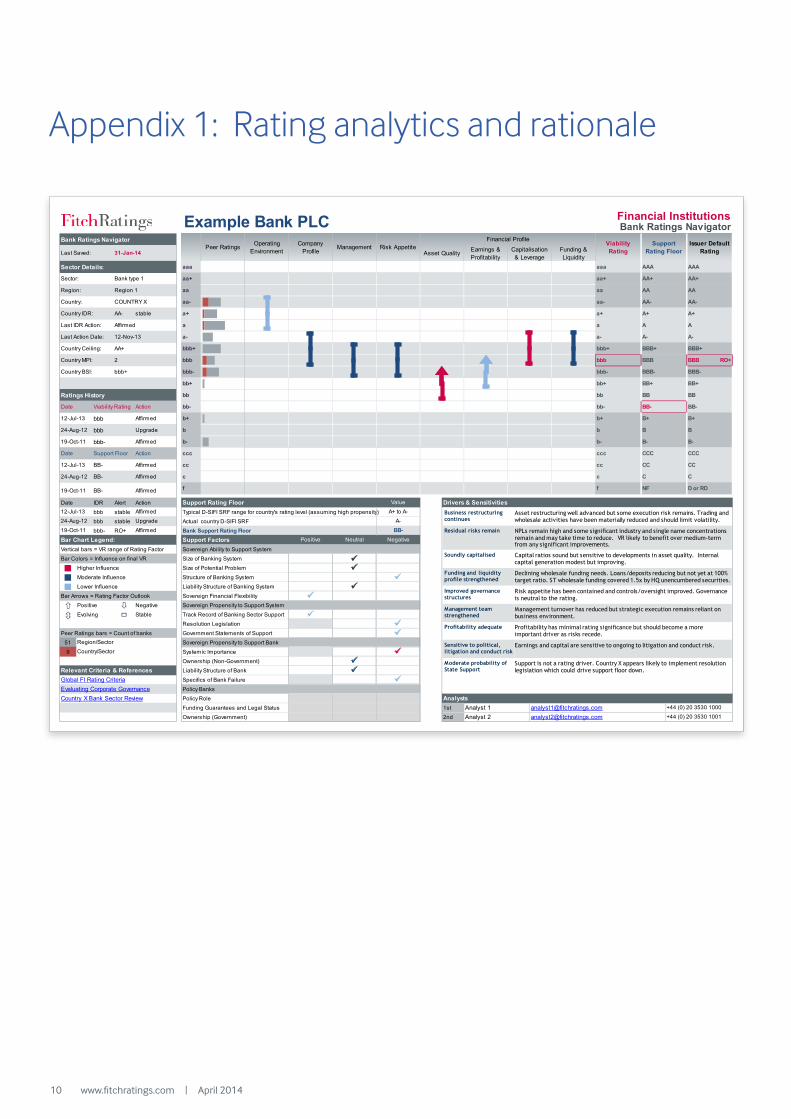
Example Bank PLC
Positive Neutral
Funding & Liquidity
Bank type 1
12-Jul-13 Affirmed
24-Aug-12
Affirmed
COUNTRY X
Region 1
Analyst 1Analyst 2
[email protected]@fitchratings.com
Affirmed
Affirmed
Affirmed
Business restructuring continues
Asset restructuring well advanced but some execution risk remains. Trading and wholesale activities have been materially reduced and should limit volatility.
Residual risks remain
Soundly capitalised
NPLs remain high and some significant industry and single name concentrations remain and may take time to reduce. VR likely to benefit over medium-term from any significant improvements.
Capital ratios sound but sensitive to developments in asset quality. Internal capital generation modest but improving.
Funding and liquidity profile strengthened
Improved governance structures
Management team strengthened
Profitability adequate
Sensitive to political, litigation and conduct risk
Moderate probability of State Support
Declining wholesale funding needs. Loans/deposits reducing but not yet at 100% target ratio. ST wholesale funding covered 1.5x by HQ unencumbered securities.
Risk appetite has been contained and controls/oversight improved. Governance is neutral to the rating.
Management turnover has reduced but strategic execution remains reliant on business environment.
Profitability has minimal rating significance but should become a more important driver as risks recede.
Earnings and capital are sensitive to ongoing to litigation and conduct risk.
Support is not a rating driver. Country X appears likely to implement resolution legislation which could drive support floor down.
Navigator Output
3
Related Research• Global Financial Institutions Rating Criteria,
January 2014• Evaluating Corporate Governance Master Criteria,
December 2012• Rating FI Subsidiaries and Holding Companies,
August 2012• Macro Prudential risk Monitor, October 2013• Country-Specific Treatment of Re-covery ratings,
June 2013
Ratings Navigator for Banks
The Ratings Navigator provides clarity and transparency around the key drivers of bank issuer ratings.
The dashboard-style tool aims to replicate the analytical thought process and present a bank’s key rating drivers, strengths and weaknesses in a standardised format. The representation also provides clarity over the combination of different components of Fitch’s unique bank rating methodology (viability rating and support).
An example of the complete output is illustrated in Appendix 1 and 2. The remainder of this document gives guidance for each component of the dashboard.
The Financial Institutions Rating FrameworkThe analytical components of the Ratings Navigator comprise a mix of qualitative and quantitative assessments which combine to form the overall Viability Rating assessment. This is complemented by a qualitative assessment of factors that drive an analysis of support to produce an IDR that will typically reflect the ‘higher of’ approach articulated in the rating criteria. The rating framework is depicted in the rating columns (Viability/Support/IDR) which indicate how each has been assessed and typically the IDR is presented as the higher of the Viability or Support assessment.
For more detailed information on Fitch’s rating framework please refer to the January 2014 Global FI Rating Criteria.
The Ratings Navigator is a visual summary of Fitch’s Global Financial Institutions Rating Criteria. Quantitative data, such as financial and risk metrics, adds context and helps to explain ratings as opposed to determining or implying a rating directly.
This guide should be read in conjunction with Fitch’s Global Financial Institutions Rating Criteria dated 31 January 2014 which provides insight into the key rating factors and why they are important in the context of bank ratings. Where relevant this guide uses illustrative examples to explain context and importance. However such examples should not be viewed as definitive or exhaustive. Note that the Ratings Navigator does not introduce a new methodology or approach to the analysis, it is not a quantitative model. The tool simply complements the analyst thought processes and represents these in a format that aids transparency around the key credit drivers.
www.fitchratings.com | April 2014 4
How should I interpret the factor assessment values?The dashboard does not calculate a rating using the factor assessments; the overall rating will reflect the broad aggregation of the individual factor scores weighted by their relative importance. The absolute positioning of each factor score together with its relative importance provides an indication of the key rating drivers and the potential rating impact of changes to each absolute or relative assessment.
How can I work out what a particular factor assessment means?Factor definitions are provided in Fitch’s rating criteria. These detail the characteristics expected to be displayed under each factor for a given rating level.
What does ‘relative importance’ mean?All factors are deemed to be of importance in determining the rating hence the relative importance indicator is showing which factors are exerting the greatest or least influence on the final rating. In the example, ‘operating environment’, which is often considered to be a constraining factor, is imparting a low importance in the rating. Capital is a rating strength compared with asset quality which is a weak point but both are key rating drivers as shown through their relative importance.
Each rating factor assessment provides three key pieces of information:
• The absolute level assessment - depicted as a 3-notch range across the ‘aaa’ scale.
• The relative importance of the factor in determining the final rating – colour-coded to show ‘higher’ (red), ‘moderate’ (dark blue) and ‘lower’ (light blue) importance.
• An indication of future trend – using arrows to denote ‘positive’, ‘negative’, ‘stable’ (no arrows) or ‘evolving’.
Viability Rating Assessment
All factors are deemed to be of importance in determining the rating...
Viability Rating (VR)(aaa scale) Based on Stand-Alone Strength
Key rating factors:• Operating Environment• Company Profile• Management• Risk Appetite• Financial Profile
StrengthSupport Rating (SR)(1-5 scale)Based on Stronger of Institutional and Sovereign Support
Support Rating Floor (SRF)(AAA scale)Based on Sovereign Support
Key rating factors:• Sovereign’s ability to support• Sovereign’s propensity to
support banking sector• Sovereign’s propensity to
support specific FI
Long-Term Issuer Default Rating (LT IDR)(AAA scale) Based on Higher of VR and Institutional/Sovereign Support
Potential LT IDR level based on institutional (shareholder) support(AAA scale)
Key rating factors:• Parent’s ability to support• Parent’s propensity to support/
subsidiary classification• Legal and regulatory obligations/
constraints
5
Ratings Navigator for Banks
Will the relative importance be the same across all banks in a given country?No. The operating environment factor assessment will be the same for all or most banks operating in the same domestic environment. Its relative importance however will be bank-specific but may be similar across many banks. All other factor assessments will be bank-specific both in terms of the absolute level and the relative importance.
Would I expect to see several higher and lower importance factors?Not necessarily. The importance indicator is issuer-specific and it may well be the case that all or most factors are of broadly equal importance in which case all factors may be indicated as ‘moderate’. It is likely that where higher importance factors are indicated there will be others of lower importance offsetting – but not necessarily on a one-for-one basis.
How are factors that exert an extremely high influence presented?These would still be indicated as ‘higher’ (red) but the extreme element would be apparent from most, if not all, other factors being of lower importance. Examples may be the operating environment in weak emerging markets.
What does the ‘trend’ indicator tell me?The trend indicator provides Fitch’s view on the likely future direction of each individual rating factor, and the net effect should correspond to an overall rating outlook.
Note however that by directional change we mean that the 3-notch range may move in the direction of the arrow. What we are not indicating is that we expect there will be an improvement in a particular metric (eg profitability) that leaves the absolute assessment unchanged ie it is an indicator of a structural change.
So how should the combination of absolute, relative and trend indicators be interpreted?This can be illustrated using the example. The example bank is operating in a strong and stable environment that does not constrain the rating and, as such, its importance to the rating is more limited than other rating factors. As noted above, asset quality is considered the key weakness and, if it improves in line with expectations, will most likely drive an improvement in the viability rating. The ‘earnings & profitability’ assessment is borderline investment grade but expected to show structural improvement. However as it is deemed to be of lower importance in the assessment the positive trend to that factor is unlikely to be a material component of the overall positive outlook and any improvement, when it occurs is likewise unlikely to drive the overall rating upwards. Capital is perceived to be a rating strength and is mitigating weak asset quality. Other factors are considered stable and in line with the overall rating.
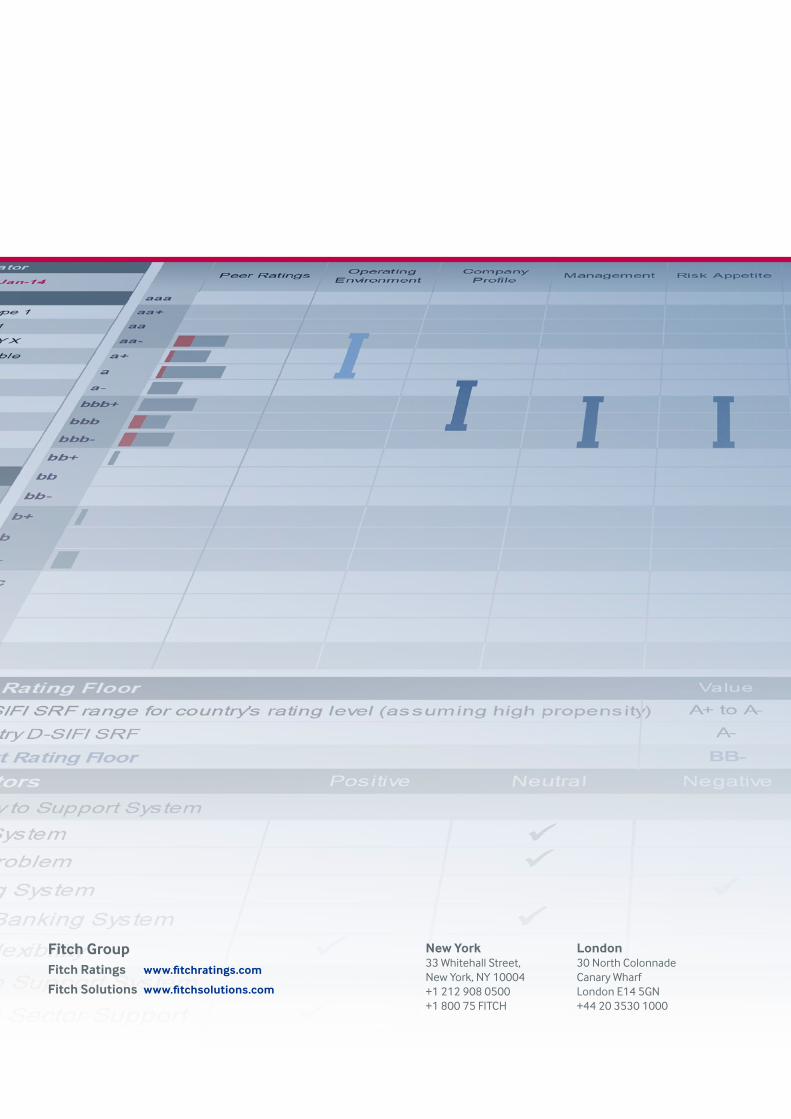
What does the ‘Peer Ratings’ data tell me?This graphic shows the existing viability ratings of banks classified as the same type/sector of bank (eg retail or universal commercial bank) in the same country as the rated bank (brown bars) and (silver bars) those of the same bank type in the same geographical region (eg Developed Markets Europe). The legend in the left hand sidebar also provides a count of the number of entities captured under each measure.
Bar Arrows = Rating Factor Outlook
Positive Negative
Evolving Stable
aaa
aa+
aa
aa-
a+
a
a-
bbb+
bbb
bbb-
bb+
bb
Peer Ratings
Peer Ratings bars = Count of banks
51
9
Region/Sector
Country/Sector
www.fitchratings.com | April 2014 6
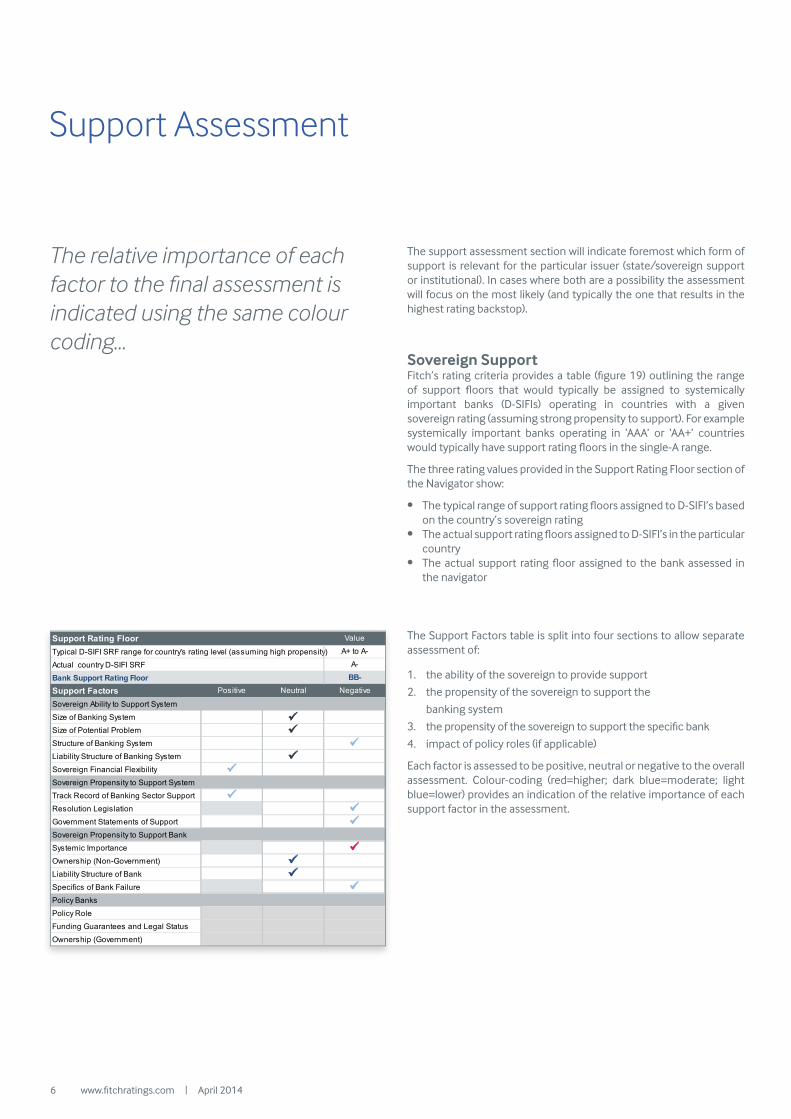
The support assessment section will indicate foremost which form of support is relevant for the particular issuer (state/sovereign support or institutional). In cases where both are a possibility the assessment will focus on the most likely (and typically the one that results in the highest rating backstop).
Sovereign SupportFitch’s rating criteria provides a table (figure 19) outlining the range of support floors that would typically be assigned to systemically important banks (D-SIFIs) operating in countries with a given sovereign rating (assuming strong propensity to support). For example systemically important banks operating in ‘AAA’ or ‘AA+’ countries would typically have support rating floors in the single-A range.
The three rating values provided in the Support Rating Floor section of the Navigator show:
• The typical range of support rating floors assigned to D-SIFI’s based on the country’s sovereign rating
• The actual support rating floors assigned to D-SIFI’s in the particular country
• The actual support rating floor assigned to the bank assessed in the navigator
The Support Factors table is split into four sections to allow separate assessment of:
1. the ability of the sovereign to provide support
2. the propensity of the sovereign to support the
banking system
3. the propensity of the sovereign to support the specific bank
4. impact of policy roles (if applicable)
Each factor is assessed to be positive, neutral or negative to the overall assessment. Colour-coding (red=higher; dark blue=moderate; light blue=lower) provides an indication of the relative importance of each support factor in the assessment.
Support Assessment
The relative importance of each factor to the final assessment is indicated using the same colour coding...
Support Rating FloorTypical D-SIFI SRF range for country's rating level (assuming high propensity)
Actual country D-SIFI SRF
Bank Support Rating FloorSupport FactorsSovereign Ability to Support System
Size of Banking System
Size of Potential Problem
Structure of Banking System
Liability Structure of Banking System
Sovereign Financial Flexibility
Sovereign Propensity to Support System
Track Record of Banking Sector Support
Resolution Legislation
Government Statements of Support
Sovereign Propensity to Support Bank
Systemic Importance
Ownership (Non-Government)
Liability Structure of Bank
Specifics of Bank Failure
Policy Banks
Policy Role
Funding Guarantees and Legal Status
Ownership (Government)
BB-
A-
A+ to A-
Value
Negative
Positive Neutral
7
Ratings Navigator for Banks
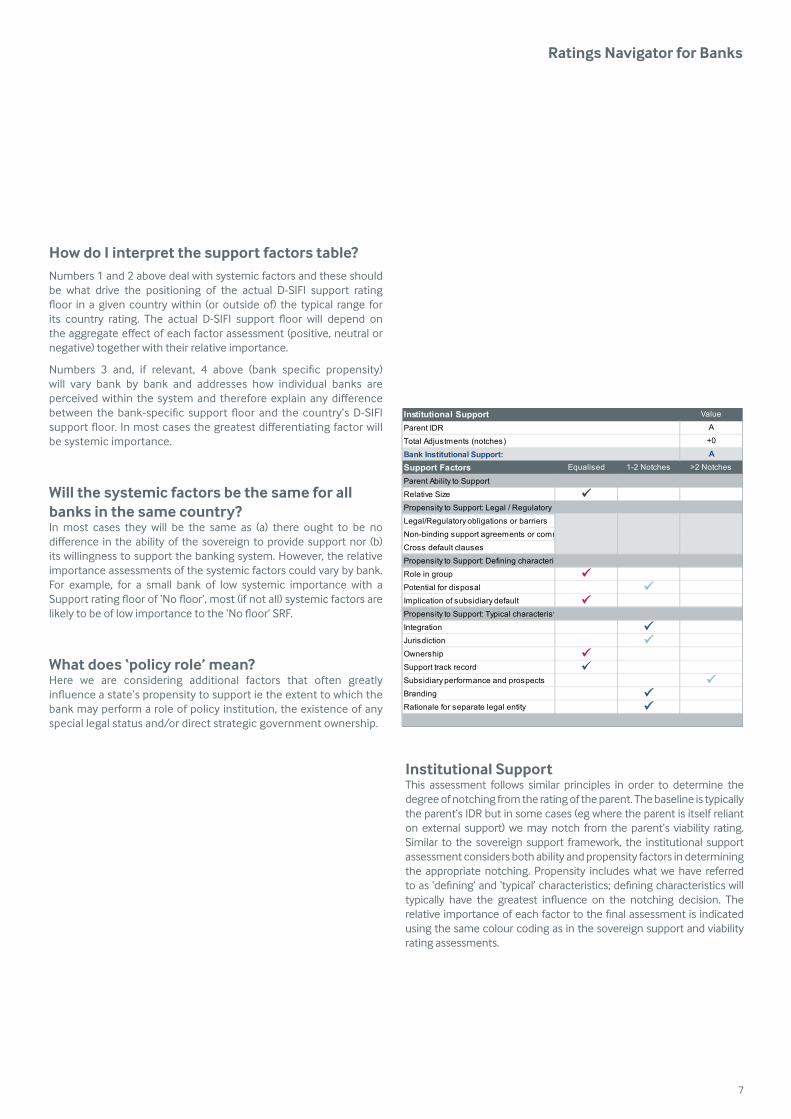
Institutional SupportParent IDR
Total Adjustments (notches)
Bank Institutional Support:Support FactorsParent Ability to Support
Relative Size
Propensity to Support: Legal / Regulatory
Legal/Regulatory obligations or barriers
Non-binding support agreements or commitments
Cross default clauses
Propensity to Support: Defining characteristics
Role in group
Potential for disposal
Implication of subsidiary default
Propensity to Support: Typical characteristics
Integration
Jurisdiction
Ownership
Support track record
Subsidiary performance and prospects
Branding
Rationale for separate legal entity
Equalised 1-2 Notches
A+0
A
Value
>2 Notches
How do I interpret the support factors table?Numbers 1 and 2 above deal with systemic factors and these should be what drive the positioning of the actual D-SIFI support rating floor in a given country within (or outside of) the typical range for its country rating. The actual D-SIFI support floor will depend on the aggregate effect of each factor assessment (positive, neutral or negative) together with their relative importance.
Numbers 3 and, if relevant, 4 above (bank specific propensity) will vary bank by bank and addresses how individual banks are perceived within the system and therefore explain any difference between the bank-specific support floor and the country’s D-SIFI support floor. In most cases the greatest differentiating factor will be systemic importance.
Will the systemic factors be the same for all banks in the same country?In most cases they will be the same as (a) there ought to be no difference in the ability of the sovereign to provide support nor (b) its willingness to support the banking system. However, the relative importance assessments of the systemic factors could vary by bank. For example, for a small bank of low systemic importance with a Support rating floor of ‘No floor’, most (if not all) systemic factors are likely to be of low importance to the ‘No floor’ SRF.
What does ‘policy role’ mean?Here we are considering additional factors that often greatly influence a state’s propensity to support ie the extent to which the bank may perform a role of policy institution, the existence of any special legal status and/or direct strategic government ownership.
Institutional Support This assessment follows similar principles in order to determine the degree of notching from the rating of the parent. The baseline is typically the parent’s IDR but in some cases (eg where the parent is itself reliant on external support) we may notch from the parent’s viability rating. Similar to the sovereign support framework, the institutional support assessment considers both ability and propensity factors in determining the appropriate notching. Propensity includes what we have referred to as ‘defining’ and ‘typical’ characteristics; defining characteristics will typically have the greatest influence on the notching decision. The relative importance of each factor to the final assessment is indicated using the same colour coding as in the sovereign support and viability rating assessments.
www.fitchratings.com | April 2014 8
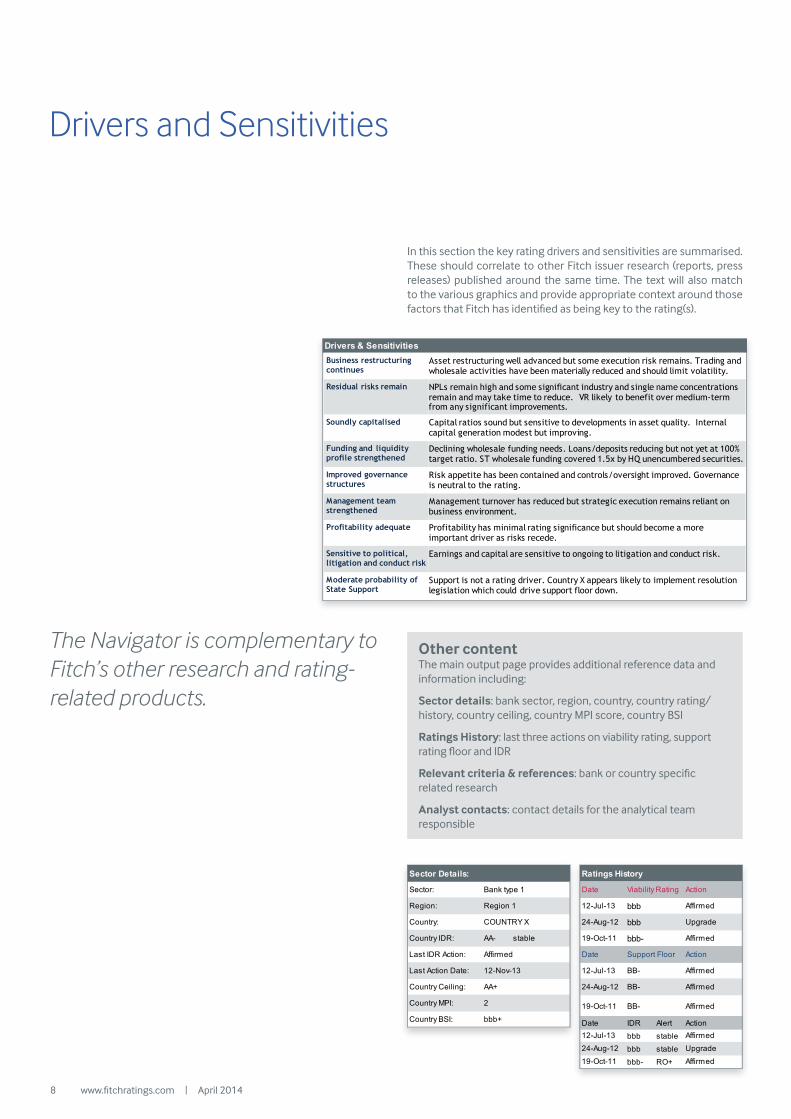
In this section the key rating drivers and sensitivities are summarised. These should correlate to other Fitch issuer research (reports, press releases) published around the same time. The text will also match to the various graphics and provide appropriate context around those factors that Fitch has identified as being key to the rating(s).
Drivers and Sensitivities
Other content The main output page provides additional reference data and information including:
Sector details: bank sector, region, country, country rating/history, country ceiling, country MPI score, country BSI
Ratings History: last three actions on viability rating, support rating floor and IDR
Relevant criteria & references: bank or country specific related research
Analyst contacts: contact details for the analytical team responsible
The Navigator is complementary to Fitch’s other research and rating-related products.
Drivers & SensitivitiesBusiness restructuring continues
Asset restructuring well advanced but some execution risk remains. Trading and wholesale activities have been materially reduced and should limit volatility.
Residual risks remain
Soundly capitalised
NPLs remain high and some significant industry and single name concentrations remain and may take time to reduce. VR likely to benefit over medium-term from any significant improvements.
Capital ratios sound but sensitive to developments in asset quality. Internal capital generation modest but improving.
Funding and liquidity profile strengthened
Improved governance structures
Management team strengthened
Profitability adequate
Sensitive to political, litigation and conduct risk
Moderate probability of State Support
Declining wholesale funding needs. Loans/deposits reducing but not yet at 100% target ratio. ST wholesale funding covered 1.5x by HQ unencumbered securities.
Risk appetite has been contained and controls/oversight improved. Governance is neutral to the rating.
Management turnover has reduced but strategic execution remains reliant on business environment.
Profitability has minimal rating significance but should become a more important driver as risks recede.
Earnings and capital are sensitive to ongoing to litigation and conduct risk.
Support is not a rating driver. Country X appears likely to implement resolution legislation which could drive support floor down.
Sector Details:
Sector:
Region:
Country:
Country IDR: AA- stable
Last IDR Action:
Last Action Date:
Country Ceiling: AA+
Country MPI: 2
Country BSI: bbb+
12-Nov-13
Bank type 1
Affirmed
COUNTRY X
Region 1
Ratings History
Date Viability Rating Action
bbb
bbb
bbb-
Date Support Floor Action
BB-
BB-
BB-
Date IDR Alert Action
bbb stable
bbb stable
bbb- RO+
Upgrade
19-Oct-11 Affirmed
19-Oct-11
24-Aug-12
12-Jul-13
12-Jul-13
24-Aug-12 Upgrade
Affirmed
19-Oct-11
Affirmed
12-Jul-13 Affirmed
24-Aug-12
Affirmed
Affirmed
Affirmed
9
Ratings Navigator for Banks
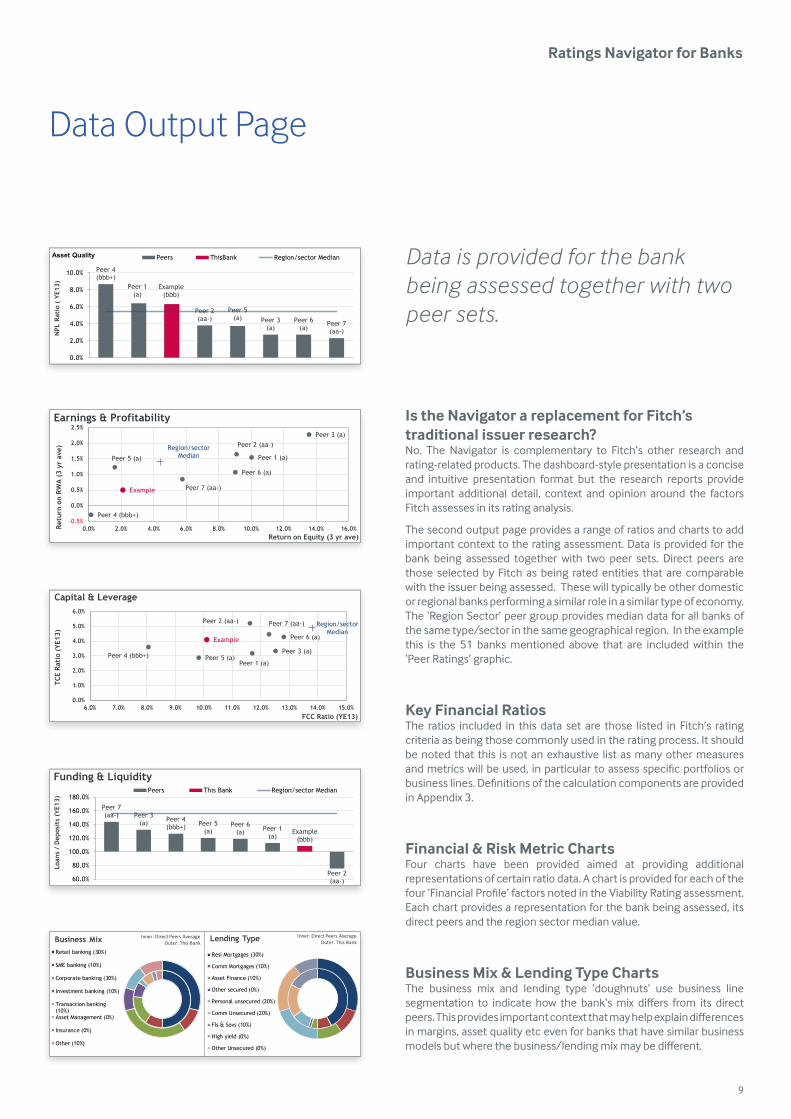
Data Output Page
Is the Navigator a replacement for Fitch’s traditional issuer research?No. The Navigator is complementary to Fitch’s other research and rating-related products. The dashboard-style presentation is a concise and intuitive presentation format but the research reports provide important additional detail, context and opinion around the factors Fitch assesses in its rating analysis.
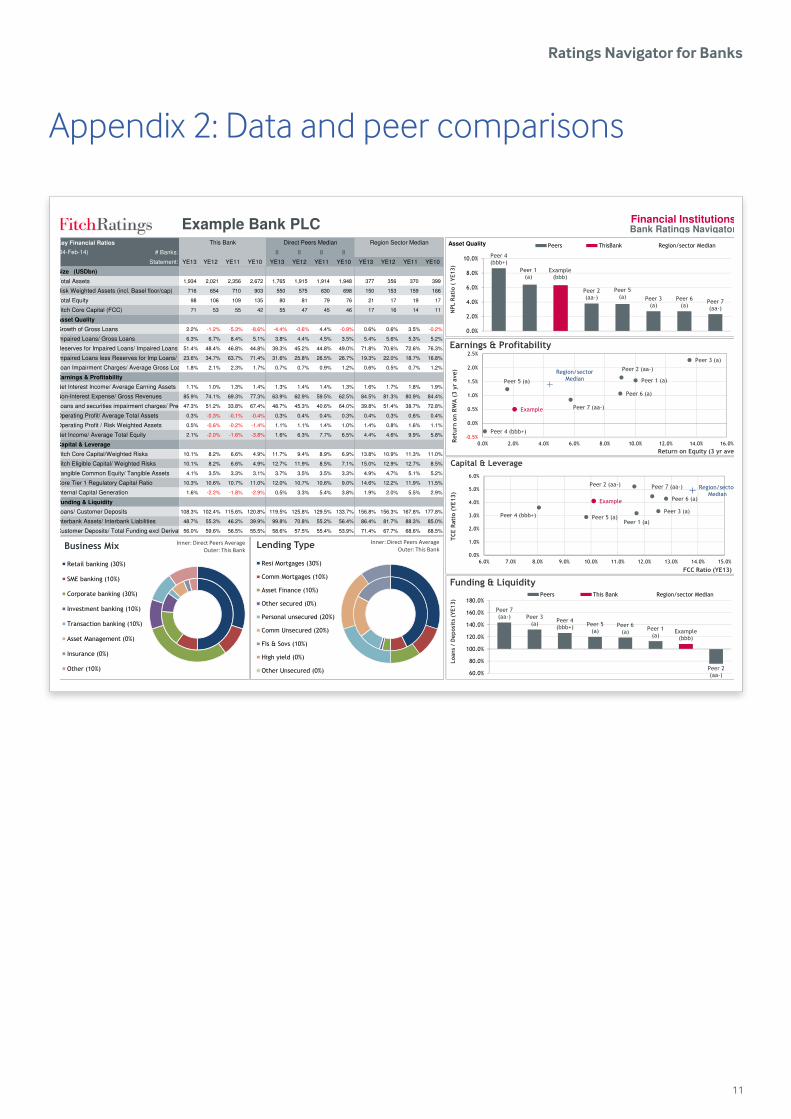
The second output page provides a range of ratios and charts to add important context to the rating assessment. Data is provided for the bank being assessed together with two peer sets. Direct peers are those selected by Fitch as being rated entities that are comparable with the issuer being assessed. These will typically be other domestic or regional banks performing a similar role in a similar type of economy. The ‘Region Sector’ peer group provides median data for all banks of the same type/sector in the same geographical region. In the example this is the 51 banks mentioned above that are included within the ‘Peer Ratings’ graphic.
Key Financial RatiosThe ratios included in this data set are those listed in Fitch’s rating criteria as being those commonly used in the rating process. It should be noted that this is not an exhaustive list as many other measures and metrics will be used, in particular to assess specific portfolios or business lines. Definitions of the calculation components are provided in Appendix 3.
Financial & Risk Metric ChartsFour charts have been provided aimed at providing additional representations of certain ratio data. A chart is provided for each of the four ‘Financial Profile’ factors noted in the Viability Rating assessment. Each chart provides a representation for the bank being assessed, its direct peers and the region sector median value.
Business Mix & Lending Type ChartsThe business mix and lending type ‘doughnuts’ use business line segmentation to indicate how the bank‘s mix differs from its direct peers. This provides important context that may help explain differences in margins, asset quality etc even for banks that have similar business models but where the business/lending mix may be different.
Data is provided for the bank being assessed together with two peer sets.
Peer 4(bbb+)
Peer 1(a)
Example (bbb)
Peer 2(aa-)
Peer 5(a) Peer 3
(a)Peer 6
(a)Peer 7(aa-)
0.0%
2.0%
4.0%
6.0%
8.0%
10.0%
NPL
Rat
io (
YE1
3)
Peers ThisBank Region/sector MedianAsset Quality
Example
Region/sector Median Peer 1 (a)
Peer 2 (aa-)Peer 3 (a)
Peer 4 (bbb+)
Peer 5 (a)
Peer 6 (a)
Peer 7 (aa-)
-0.5%
0.0%
0.5%
1.0%
1.5%
2.0%
2.5%
0.0% 2.0% 4.0% 6.0% 8.0% 10.0% 12.0% 14.0% 16.0%Retu
rn o
n RW
A (
3 yr
ave
)
Return on Equity (3 yr ave)
Earnings & Profitability
Example
Region/sector Median
Peer 1 (a)
Peer 2 (aa-)
Peer 3 (a)Peer 4 (bbb+) Peer 5 (a)
Peer 6 (a)
Peer 7 (aa-)
0.0%
1.0%
2.0%
3.0%
4.0%
5.0%
6.0%
6.0% 7.0% 8.0% 9.0% 10.0% 11.0% 12.0% 13.0% 14.0% 15.0%
TCE
Rati
o (Y
E13)
FCC Ratio (YE13)
Capital & Leverage
Peer 7(aa-) Peer 3
(a) Peer 4(bbb+) Peer 5
(a)Peer 6
(a) Peer 1(a)
Example (bbb)
Peer 2(aa-)60.0%
80.0%
100.0%
120.0%
140.0%
160.0%
180.0%
Loan
s /
Dep
osit
s (Y
E13)
Funding & LiquidityPeers This Bank Region/sector Median
Business MixRetail banking (30%)
SME banking (10%)
Corporate banking (30%)
Investment banking (10%)
Transaction banking(10%)Asset Management (0%)
Insurance (0%)
Other (10%)
Inner: Direct Peers AverageOuter: This Bank
Lending Type
Resi Mortgages (30%)
Comm Mortgages (10%)
Asset Finance (10%)
Other secured (0%)
Personal unsecured (20%)
Comm Unsecured (20%)
FIs & Sovs (10%)
High yield (0%)
Other Unsecured (0%)
Inner: Direct Peers AverageOuter: This Bank
www.fitchratings.com | April 2014 10
Financial InstitutionsBank Ratings Navigator
Bank Ratings Navigator
Sector Details: aaa aaa AAA AAA RO+
Sector: aa+ aa+ AA+ AA+ RO+
Region: aa aa AA AA RO+
Country: aa- aa- AA- AA- RO+
Country IDR: AA- stable a+ a+ A+ A+ RO+
Last IDR Action: a a A A RO+
Last Action Date: a- a- A- A- RO+
Country Ceiling: AA+ bbb+ bbb+ BBB+ BBB+ RO+
Country MPI: 2 bbb bbb BBB BBB RO+
Country BSI: bbb+ bbb- bbb- BBB- BBB- RO+
bb+ bb+ BB+ BB+ RO+
Ratings History bb bb BB BB RO+
Date Viability Rating Action bb- bb- BB- BB- RO+
bbb b+ b+ B+ B+ RO+
bbb b b B B RO+
bbb- b- b- B- B- RO+
Date Support Floor Action ccc ccc CCC CCC RO+
BB- cc cc CC CC RO+
BB- c c C C RO+
BB- f f NF D or RD RO+
Date IDR Alert Action Support Rating Floor Drivers & Sensitivitiesbbb stable Typical D-SIFI SRF range for country's rating level (assuming high propensity)
bbb stable Actual country D-SIFI SRF
bbb- RO+ Bank Support Rating FloorBar Chart Legend: Support FactorsVertical bars = VR range of Rating Factor Sovereign Ability to Support System
Bar Colors = Influence on final VR Size of Banking System
Higher Influence Size of Potential Problem
Moderate Influence Structure of Banking System
Lower Influence Liability Structure of Banking System
Bar Arrows = Rating Factor Outlook Sovereign Financial Flexibility
Positive Negative Sovereign Propensity to Support System
Evolving Stable Track Record of Banking Sector Support
Resolution Legislation
Peer Ratings bars = Count of banks Government Statements of Support
51 Sovereign Propensity to Support Bank
9 Systemic Importance
Ownership (Non-Government)
Relevant Criteria & References Liability Structure of Bank
Specifics of Bank Failure
Policy Banks
Policy Role AnalystsFunding Guarantees and Legal Status 1st
Ownership (Government) 2nd
Global FI Rating Criteria
Country X Bank Sector ReviewEvaluating Corporate Governance
Peer Ratings Operating Environment
BB-
Company Profile
Management
A-
A+ to A-
Value
Negative
+44 (0) 20 3530 1000
+44 (0) 20 3530 1001
Issuer Default RatingCapitalisation
& Leverage
Risk Appetite
Support Rating FloorEarnings &
ProfitabilityAsset Quality
Financial Profile Viability Rating
Region/Sector
Country/Sector
Upgrade
19-Oct-11 Affirmed
19-Oct-11
24-Aug-12
12-Jul-13
12-Jul-13
24-Aug-12 Upgrade
Affirmed
Last Saved:
19-Oct-11
31-Jan-14
12-Nov-13
Affirmed
Example Bank PLC
Positive Neutral
Funding & Liquidity
Bank type 1
12-Jul-13 Affirmed
24-Aug-12
Affirmed
COUNTRY X
Region 1
Analyst 1Analyst 2
[email protected]@fitchratings.com
Affirmed
Affirmed
Affirmed
Business restructuring continues
Asset restructuring well advanced but some execution risk remains. Trading and wholesale activities have been materially reduced and should limit volatility.
Residual risks remain
Soundly capitalised
NPLs remain high and some significant industry and single name concentrations remain and may take time to reduce. VR likely to benefit over medium-term from any significant improvements.
Capital ratios sound but sensitive to developments in asset quality. Internal capital generation modest but improving.
Funding and liquidity profile strengthened
Improved governance structures
Management team strengthened
Profitability adequate
Sensitive to political, litigation and conduct risk
Moderate probability of State Support
Declining wholesale funding needs. Loans/deposits reducing but not yet at 100% target ratio. ST wholesale funding covered 1.5x by HQ unencumbered securities.
Risk appetite has been contained and controls/oversight improved. Governance is neutral to the rating.
Management turnover has reduced but strategic execution remains reliant on business environment.
Profitability has minimal rating significance but should become a more important driver as risks recede.
Earnings and capital are sensitive to ongoing to litigation and conduct risk.
Support is not a rating driver. Country X appears likely to implement resolution legislation which could drive support floor down.
Appendix 1: Rating analytics and rationale
11
Ratings Navigator for Banks
Financial InstitutionsBank Ratings Navigator
Key Financial Ratios
# Banks: 8 8 8 8
Statement: YE13 YE12 YE11 YE10 YE13 YE12 YE11 YE10 YE13 YE12 YE11 YE10
Size (USDbn)
Total Assets 1,934 2,021 2,356 2,672 1,765 1,915 1,914 1,948 377 356 370 399
Risk Weighted Assets (incl. Basel floor/cap) 716 654 710 903 550 575 630 698 150 153 159 166
Total Equity 98 106 109 135 80 81 79 76 21 17 19 17
Fitch Core Capital (FCC) 71 53 55 42 55 47 45 46 17 16 14 11
Asset Quality
Growth of Gross Loans 2.2% -1.2% -5.3% -8.6% -4.4% -0.6% 4.4% -0.9% 0.6% 0.6% 3.5% -0.2%
Impaired Loans/ Gross Loans 6.3% 6.7% 8.4% 5.1% 3.8% 4.4% 4.5% 3.5% 5.4% 5.6% 5.3% 5.2%
Reserves for Impaired Loans/ Impaired Loans 51.4% 48.4% 46.8% 44.8% 39.3% 45.2% 44.8% 49.0% 71.8% 70.6% 72.6% 76.3%
Impaired Loans less Reserves for Imp Loans/ Fitch Core Capital23.6% 34.7% 63.7% 71.4% 31.6% 25.8% 26.5% 26.7% 19.3% 22.0% 18.7% 16.8%
Loan Impairment Charges/ Average Gross Loans1.8% 2.1% 2.3% 1.7% 0.7% 0.7% 0.9% 1.2% 0.6% 0.5% 0.7% 1.2%
Earnings & Profitability
Net Interest Income/ Average Earning Assets 1.1% 1.0% 1.3% 1.4% 1.3% 1.4% 1.4% 1.3% 1.6% 1.7% 1.8% 1.9%
Non-Interest Expense/ Gross Revenues 85.9% 74.1% 69.3% 77.3% 63.9% 62.9% 59.5% 62.5% 84.5% 81.3% 80.9% 84.4%
Loans and securities impairment charges/ Pre-impairment Op. Profit47.3% 51.2% 33.8% 67.4% 48.7% 45.3% 40.6% 64.0% 39.8% 51.4% 38.7% 72.8%
Operating Profit/ Average Total Assets 0.3% -0.3% -0.1% -0.4% 0.3% 0.4% 0.4% 0.3% 0.4% 0.3% 0.6% 0.4%
Operating Profit / Risk Weighted Assets 0.5% -0.6% -0.2% -1.4% 1.1% 1.1% 1.4% 1.0% 1.4% 0.8% 1.6% 1.1%
Net Income/ Average Total Equity 2.1% -2.0% -1.6% -3.8% 1.6% 6.3% 7.7% 6.5% 4.4% 4.6% 9.9% 5.8%
Capital & Leverage
Fitch Core Capital/Weighted Risks 10.1% 8.2% 6.6% 4.9% 11.7% 9.4% 8.9% 6.9% 13.8% 10.9% 11.3% 11.0%
Fitch Eligible Capital/ Weighted Risks 10.1% 8.2% 6.6% 4.9% 12.7% 11.9% 8.5% 7.1% 15.0% 12.9% 12.7% 8.5%
Tangible Common Equity/ Tangible Assets 4.1% 3.5% 3.3% 3.1% 3.7% 3.5% 3.5% 3.3% 4.9% 4.7% 5.1% 5.2%
Core Tier 1 Regulatory Capital Ratio 10.3% 10.6% 10.7% 11.0% 12.0% 10.7% 10.6% 9.0% 14.6% 12.2% 11.9% 11.5%
Internal Capital Generation 1.6% -2.2% -1.8% -2.9% 0.5% 3.3% 5.4% 3.8% 1.9% 2.0% 5.5% 2.9%
Funding & Liquidity
Loans/ Customer Deposits 108.3% 102.4% 115.6% 120.8% 119.5% 125.8% 129.5% 133.7% 156.8% 156.3% 167.8% 177.8%
Interbank Assets/ Interbank Liabilities 48.7% 55.3% 46.2% 39.9% 99.8% 70.8% 55.2% 56.4% 86.4% 81.7% 88.3% 85.0%
Customer Deposits/ Total Funding excl Derivatives56.0% 59.6% 56.5% 55.5% 58.6% 57.5% 55.4% 53.9% 71.4% 67.7% 68.6% 68.5%
(04-Feb-14)
Example Bank PLCDirect Peers MedianThis Bank Region Sector Median
Inner: Direct Peers AverageOuter: This Bank
Inner: Direct Peers AverageOuter: This Bank
Asset Quality
Appendix 2: Data and peer comparisons
www.fitchratings.com | April 2014 12
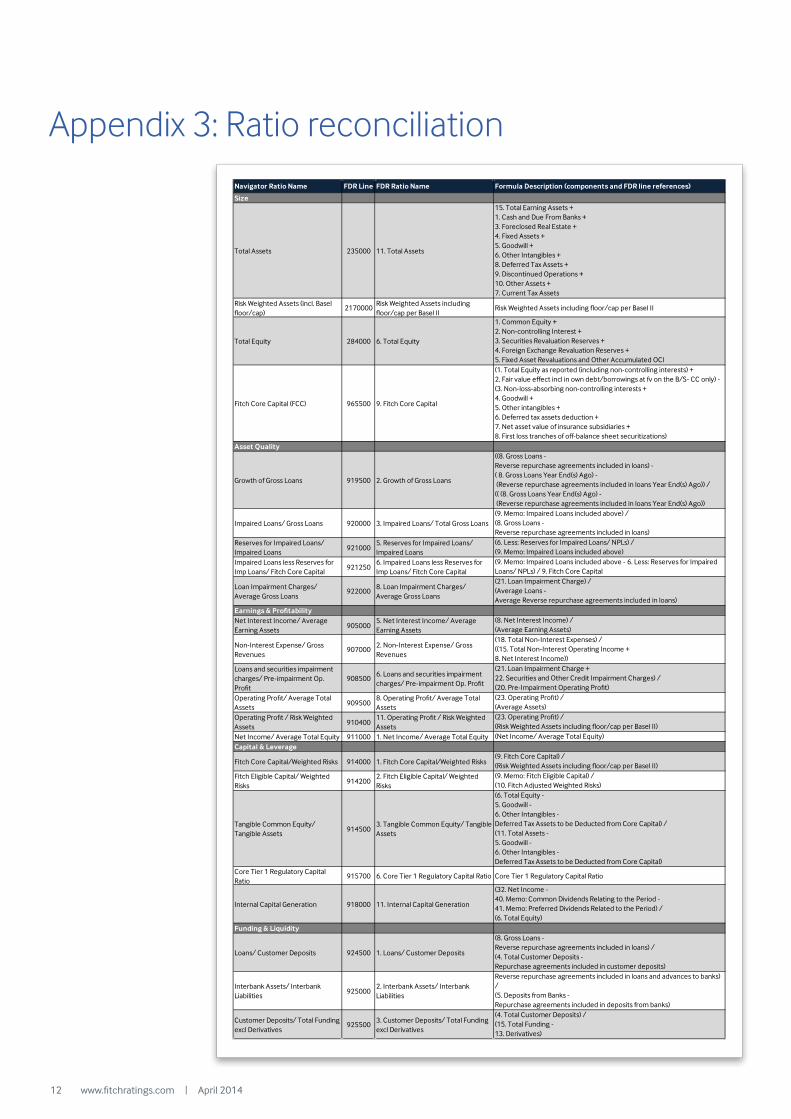
Appendix 3: Ratio reconciliation
Navigator Ratio Name FDR Line FDR Ratio Name Formula Description (components and FDR line references)
Size
Total Assets 235000 11. Total Assets
15. Total Earning Assets +1. Cash and Due From Banks +3. Foreclosed Real Estate +4. Fixed Assets +5. Goodwill +6. Other Intangibles +8. Deferred Tax Assets +9. Discontinued Operations +10. Other Assets +7. Current Tax Assets
Risk Weighted Assets (incl. Basel floor/cap)
2170000Risk Weighted Assets including floor/cap per Basel II
Risk Weighted Assets including floor/cap per Basel II
Total Equity 284000 6. Total Equity
1. Common Equity +2. Non-controlling Interest +3. Securities Revaluation Reserves +4. Foreign Exchange Revaluation Reserves +5. Fixed Asset Revaluations and Other Accumulated OCI
Fitch Core Capital (FCC) 965500 9. Fitch Core Capital
(1. Total Equity as reported (including non-controlling interests) +2. Fair value effect incl in own debt/borrowings at fv on the B/S- CC only) -(3. Non-loss-absorbing non-controlling interests +4. Goodwill +5. Other intangibles +6. Deferred tax assets deduction +7. Net asset value of insurance subsidiaries +8. First loss tranches of off-balance sheet securitizations)
Asset Quality
Growth of Gross Loans 919500 2. Growth of Gross Loans
((8. Gross Loans -Reverse repurchase agreements included in loans) -( 8. Gross Loans Year End(s) Ago) - (Reverse repurchase agreements included in loans Year End(s) Ago)) /(( (8. Gross Loans Year End(s) Ago) - (Reverse repurchase agreements included in loans Year End(s) Ago))
Impaired Loans/ Gross Loans 920000 3. Impaired Loans/ Total Gross Loans(9. Memo: Impaired Loans included above) /(8. Gross Loans -Reverse repurchase agreements included in loans)
Reserves for Impaired Loans/ Impaired Loans
9210005. Reserves for Impaired Loans/ Impaired Loans
(6. Less: Reserves for Impaired Loans/ NPLs) /(9. Memo: Impaired Loans included above)
Impaired Loans less Reserves for Imp Loans/ Fitch Core Capital
9212506. Impaired Loans less Reserves for Imp Loans/ Fitch Core Capital
(9. Memo: Impaired Loans included above - 6. Less: Reserves for Impaired Loans/ NPLs) / 9. Fitch Core Capital
Loan Impairment Charges/ Average Gross Loans
9220008. Loan Impairment Charges/ Average Gross Loans
(21. Loan Impairment Charge) /(Average Loans -Average Reverse repurchase agreements included in loans)
Earnings & ProfitabilityNet Interest Income/ Average Earning Assets
9050005. Net Interest Income/ Average Earning Assets
(8. Net Interest Income) /(Average Earning Assets)
Non-Interest Expense/ Gross Revenues
9070002. Non-Interest Expense/ Gross Revenues
(18. Total Non-Interest Expenses) /((15. Total Non-Interest Operating Income +8. Net Interest Income))
Loans and securities impairment charges/ Pre-impairment Op. Profit
9085006. Loans and securities impairment charges/ Pre-impairment Op. Profit
(21. Loan Impairment Charge +22. Securities and Other Credit Impairment Charges) /(20. Pre-Impairment Operating Profit)
Operating Profit/ Average Total Assets
9095008. Operating Profit/ Average Total Assets
(23. Operating Profit) /(Average Assets)
Operating Profit / Risk Weighted Assets
91040011. Operating Profit / Risk Weighted Assets
(23. Operating Profit) /(Risk Weighted Assets including floor/cap per Basel II)
Net Income/ Average Total Equity 911000 1. Net Income/ Average Total Equity (Net Income/ Average Total Equity)
Capital & Leverage
Fitch Core Capital/Weighted Risks 914000 1. Fitch Core Capital/Weighted Risks(9. Fitch Core Capital) /(Risk Weighted Assets including floor/cap per Basel II)
Fitch Eligible Capital/ Weighted Risks
9142002. Fitch Eligible Capital/ Weighted Risks
(9. Memo: Fitch Eligible Capital) /(10. Fitch Adjusted Weighted Risks)
Tangible Common Equity/ Tangible Assets
9145003. Tangible Common Equity/ Tangible Assets
(6. Total Equity -5. Goodwill -6. Other Intangibles -Deferred Tax Assets to be Deducted from Core Capital) /(11. Total Assets -5. Goodwill -6. Other Intangibles -Deferred Tax Assets to be Deducted from Core Capital)
Core Tier 1 Regulatory Capital Ratio
915700 6. Core Tier 1 Regulatory Capital Ratio Core Tier 1 Regulatory Capital Ratio
Internal Capital Generation 918000 11. Internal Capital Generation
(32. Net Income -40. Memo: Common Dividends Relating to the Period -41. Memo: Preferred Dividends Related to the Period) /(6. Total Equity)
Funding & Liquidity
Loans/ Customer Deposits 924500 1. Loans/ Customer Deposits
(8. Gross Loans -Reverse repurchase agreements included in loans) /(4. Total Customer Deposits -Repurchase agreements included in customer deposits)
Interbank Assets/ Interbank Liabilities
9250002. Interbank Assets/ Interbank Liabilities
(1. Loans and Advances to Banks -Reverse repurchase agreements included in loans and advances to banks) /(5. Deposits from Banks -Repurchase agreements included in deposits from banks)
Customer Deposits/ Total Funding excl Derivatives
9255003. Customer Deposits/ Total Funding excl Derivatives
(4. Total Customer Deposits) /(15. Total Funding -13. Derivatives)
13
Ratings Navigator for Banks
Disclaimer
ALL FITCH CREDIT RATINGS ARE SUBJECT TO CERTAIN LIMITATIONS AND DISCLAIMERS. PLEASE READ THESE LIMITATIONS AND DISCLAIMERS BY FOLLOWING THIS LINK: HTTP://FITCHRATINGS.COM/UNDERSTANDINGCREDITRATINGS. IN ADDITION, RATING DEFINITIONS AND THE TERMS OF USE OF SUCH RATINGS ARE AVAILABLE ON THE AGENCY'S FREE WEB SITE AT WWW.FITCHRATINGS.COM. PUBLISHED RATINGS, CRITERIA, AND METHODOLOGIES ARE AVAILABLE FROM THIS SITE AT ALL TIMES. FITCH'S CODE OF CONDUCT, CONFIDENTIALITY, CONFLICTS OF INTEREST, AFFILIATE FIREWALL, COMPLIANCE, AND OTHER RELEVANT POLICIES AND PROCEDURES ARE ALSO AVAILABLE FROM THE CODE OF CONDUCT SECTION OF THIS SITE. FITCH MAY HAVE PROVIDED ANOTHER PERMISSIBLE SERVICE TO THE RATED ENTITY OR ITS RELATED THIRD PARTIES. DETAILS OF THIS SERVICE FOR RATINGS FOR WHICH THE LEAD ANALYST IS BASED IN AN EU-REGISTERED ENTITY CAN BE FOUND ON THE ENTITY SUMMARY PAGE FOR THIS ISSUER ON THE FITCH WEBSITE. Copyright © 2014 by Fitch, Inc., Fitch Ratings Ltd. and its subsidiaries. 33 Whitehall Street, New York, NY 10004. Telephone: 1-800-753-4824, (212) 908-0500. Fax: (212) 480-4435. Fitch Australia Pty Ltd holds an Australian financial services licence (AFS licence no. 337123) which authorises it to provide credit ratings to wholesale clients only. Credit ratings information published by Fitch is not intended to be used by persons who are retail clients within the meaning of the Corporations Act 2001. Reproduction or retransmission in whole or in part is prohibited except by permission. All rights reserved. In issuing and maintaining its ratings, Fitch relies on factual information it receives from issuers and underwriters and from other sources Fitch believes to be credible. Fitch conducts a reasonable investigation of the factual information relied upon by it in accordance with its ratings methodology, and obtains reasonable verification of that information from independent sources, to the extent such sources are available for a given security or in a given jurisdiction. The manner of Fitch's factual investigation and the scope of the third-party verification it obtains will vary depending on the nature of the rated security and its issuer, the requirements and practices in the jurisdiction in which the rated security is offered and sold and/or the issuer is located, the availability and nature of relevant public information, access to the management of the issuer and its advisers, the availability of pre-existing third-party verifications such as audit reports, agreed-upon procedures letters, appraisals, actuarial reports, engineering reports, legal opinions and other reports provided by third parties, the availability of independent and competent third-party verification sources with respect to the particular security or in the particular jurisdiction of the issuer, and a variety of other factors. Users of Fitch's ratings should understand that neither an enhanced factual investigation nor any third-party verification can ensure that all of the information Fitch relies on in connection with a rating will be accurate and complete. Ultimately, the issuer and its advisers are responsible for the accuracy of the information they provide to Fitch and to the market in offering documents and other reports. In issuing its ratings Fitch must rely on the work of experts, including independent auditors with respect to financial statements and attorneys with respect to legal and tax matters. Further, ratings are inherently forward-looking and embody assumptions and predictions about future events that by their nature cannot be verified as facts. As a result, despite any verification of current facts, ratings can be affected by future events or conditions that were not anticipated at the time a rating was issued or affirmed. The information in this report is provided "as is" without any representation or warranty of any kind. A Fitch rating is an opinion as to the creditworthiness of a security. This opinion is based on established criteria and methodologies that Fitch is continuously evaluating and updating. Therefore, ratings are the collective work product of Fitch and no individual, or group of individuals, is solely responsible for a rating. The rating does not address the risk of loss due to risks other than credit risk, unless such risk is specifically mentioned. Fitch is not engaged in the offer or sale of any security. All Fitch reports have shared authorship. Individuals identified in a Fitch report were involved in, but are not solely responsible for, the opinions stated therein. The individuals are named for contact purposes only. A report providing a Fitch rating is neither a prospectus nor a substitute for the information assembled, verified and presented to investors by the issuer and its agents in connection with the sale of the securities. Ratings may be changed or withdrawn at anytime for any reason in the sole discretion of Fitch. Fitch does not provide investment advice of any sort. Ratings are not a recommendation to buy, sell, or hold any security. Ratings do not comment on the adequacy of market price, the suitability of any security for a particular investor, or the tax-exempt nature or taxability of payments made in respect to any security. Fitch receives fees from issuers, insurers, guarantors, other obligors, and underwriters for rating securities. Such fees generally vary from US$1,000 to US$750,000 (or the applicable currency equivalent) per issue. In certain cases, Fitch will rate all or a number of issues issued by a particular issuer, or insured or guaranteed by a particular insurer or guarantor, for a single annual fee. Such fees are expected to vary from US$10,000 to US$1,500,000 (or the applicable currency equivalent). The assignment, publication, or dissemination of a rating by Fitch shall not constitute a consent by Fitch to use its name as an expert in connection with any registration statement filed under the United States securities laws, the Financial Services and Markets Act of 2000 of the United Kingdom, or the securities laws of any particular jurisdiction. Due to the relative efficiency of electronic publishing and distribution. 140028
New York33 Whitehall Street, New York, NY 10004 +1 212 908 0500 +1 800 75 FITCH
London30 North Colonnade Canary Wharf London E14 5GN +44 20 3530 1000
Fitch GroupFitch Ratings www.fitchratings.com
Fitch Solutions www.fitchsolutions.com