Embed Size (px)
Citation preview

1
Introducing the Identities of GIS
The Success of GIS
GIS is enjoying a boom. It is increasingly recognized by disciplinesoutside geography, and, to many, epitomizes ‘‘modern geography.’’ Soft-ware sales exceed seven billion US dollars annually; students flock to GISclasses in colleges and universities; on-board navigation systems are themark of a luxury car; police officers are routinely trained in GIS; organdonation has been rationalized using GIS; epidemiologists use GIS toidentify clusters of infectious disease; archaeologists use it to map sites;and Starbucks1 is reputed to use GIS to site its very successful coffeeshops. Indeed, the list of GIS uses is extraordinarily comprehensive; thetechnology pervades many aspects of modern life. Technical advances inGIS have proceeded before our ability to realize and understand itspotential effects. Means of integrating the pervasive role and influenceof GIS have not kept pace with the development and proliferation of thetechnology. Indeed, many people do not recognize the acronym; theyare even less likely to be able to tell you how GIS has affected theireveryday lives. But it has.
This book is designed to inform the reader about precisely how GISaffects them as well as myriad social processes. It introduces what GIS is,how it is understood differently in different contexts, how it works, theimportance of data, how data are stored and manipulated, and whatcontemporary GIS research looks like. It surpasses a mere descriptiveaccount, however, in that it introduces and explores philosophical impli-cations of using GIS whether for research, planning, marketing, environ-mental management, or other tasks. These are complicated issues, but
Schuurman / GIS A short Introduction Nadine Schuurman Final Proof 6.1.2004 5:27pm page 1

necessary to understand the full scope of GIS. The book is unique in thatit is not a ‘‘how-to’’ guide for technically minded students. Rather it aimsto introduce the intellectual territory and practice of GIS to a widevariety of people. Indeed, its audience is catholic encompassing inter-ested physical and social geographers, GIS users, students, and anyonewho has worked with or wondered about GIS. It is designed to illustratehow GIS affects people by changing the way they do everyday tasks fromwayfinding to data collection.
Given the ubiquity of GIS, its value would seem to be undisputed.Except perhaps in the discipline of geography. Academic geographershave a love/hate relationship with GIS perhaps because we are so closeto its faults and biases. This relationship is made more complex becauseGIS represents only one lens on the physical and social world, but this isthe face to which the world has had the most exposure to, especially inthe last decade. Incoming undergraduate students routinely know of GIS,but are less likely to be familiar with qualitative research techniques usedby some human geographers, or about the use of ground-penetratingradar by geomorphologists. The ubiquity of GIS has perhaps colored theperception of geography, and this has a bearing on the identity of allgeographers.
It may be surprising then to learn that GIS does not have its ownfixed and secure identity. It suffers from the scourge of being manythings to many people. To a municipality, GIS is the software thatallows planners to identify residential, industrial, and commercialzones. It maps the exact location and survey coordinates of each taxableproperty, and provides answers to queries such as: ‘‘how many proper-ties would be affected by the addition of an extra lane to Highway1 between 170 and 194th streets?’’ To a university researcher who mustdefine the boundaries of communities that enjoy varying health out-comes, GIS is a different animal. It is not a piece of software, but ascientific approach to the problem: ‘‘how do we define crisp boundariesto demarcate fuzzy and changeable phenomena?’’ The latter is a funda-mentally philosophical issue that must be resolved through computing.These two types of questions are very different. One is interestedin ‘‘where’’ spatial entities are or might be while the other is concernedwith ‘‘how’’ we encode spatial entities (e.g., communities, urban/rural areas, forests, roads, bridges, and anything that might appear ona map), and the repercussions of different methods of analysis onanswers to geographical questions. Both are asked, however, with respectto GIS, and they point to the myriad ways that GIS can be definedand perceived – the basis of its identity problem. And identity, as acursory review of present world politics will confirm, is closelylinked to history.
2 introducing the identities of gis
Schuurman / GIS A short Introduction Nadine Schuurman Final Proof 6.1.2004 5:27pm page 2

Where Does GIS Come From? A Technical History
The roots of GIS’ identity problem date back to the 1960s when thetechnology and epistemology that underlie it were first being developed.Methods of computerizing cartographic procedures were coincident withthe realization that mapping could segue neatly into analysis. In 1962, IanMcHarg, a landscape architect introduced the method of ‘‘overlay’’ thatwas later to become the sine qua non methodology of GIS. He was search-ing for the optimal route for a new highway that would be associatedwith suburban development. His goal was to route the highway such thatits path would involve the least disruption of other ‘‘layers’’ of thelandscape including forest cover, pastoral valleys, and existing semiruralhousing. He took multiple pieces of tracing paper, one representing eachlayer, and laid them over each other on a light table. By visually examin-ing their intersections, he was able to ‘‘see’’ the only logical route. Theprocess of overlaying map layers is depicted in Figure 1.1. Ironically,
Streets
Land parcels
Land use
Bedrock
Water table
Sand and gravel
Figure 1.1 Overlay of multiple layers.
This process allows policy and decision makers to visualize possibilities and impediments associated with
location of strategic facilities.
introducing the identities of gis 3
Schuurman / GIS A short Introduction Nadine Schuurman Final Proof 6.1.2004 5:27pm page 3

none of McHarg’s initial analysis was done using a computer. Indeed,computers of the day were very primitive, and required massive physicaland human resources to run. It is the metaphor of overlay, however, thatwas integrated into early GIS, and became the basis for a range ofanalytical techniques broadly known as ‘‘spatial analysis.’’
Spatial analysis is differentiated from ‘‘mapping’’ because it generatesmore information or knowledge than can be gleaned from maps or dataalone. It is a synergestic means of extracting information from spatialdata. Mapping, however, represents geographical data, with varyingdegrees of fidelity, in a visual form. It does not create more informationthan was originally provided, but does provide a valuable means forthe brain to discern patterns, especially given that more than 50 percentof the brain’s neurons are used for visual intelligence. In the early devel-opment stages of GIS, however, few people recognized the power ofanalysis, and the technology was generically referred to as ‘‘computer-ized cartography.’’ As such, GIS made a very poor showing. Early com-puterized maps were very primitive compared to the exquisite productpossible with manual cartography. Figure 1.2 illustrates an early compu-terized map juxtaposed to a comparable map of the same area. Thiscomparison makes it easy to imagine the basis for initial resistance toGIS from geographers used to enjoying the aesthetic pleasures of mapsmanually produced by skilled cartographers.
The visual merit of traditional maps acted, however, as a decoy,a distraction from the incipient power of computerized spatial analysis.
Figure 1.2 An early computer display of differentiated spatial zones juxtaposed to a comparable map of
the same areas using present-day technology. The graphical limitations of early computerized cartography
inhibited the adoption of GIS methods for many geographers for whom the cartographic paradigm was
paramount.
4 introducing the identities of gis
Schuurman / GIS A short Introduction Nadine Schuurman Final Proof 6.1.2004 5:27pm page 4

That power was first explored in the late 1950s and early 1960s byresearchers in the United States. Harold McCarty at the University ofIowa and William Garrison at the University of Washington were bothexperimenting with computational methods for analysis of large geo-graphical data sets (N. Chrisman, 1988, personal interview). Influencedby the quantitative revolution and the development of computers, re-searchers began to develop tools that could be used to analyze anddisplay spatial data.
One of the earliest computer cartography systems was developed inCanada, the brain child of Roger Tomlinson and Lee Pratt who met whilesitting next to each other on an airplane (Tomlinson, 1988). Tomlinsonhad been using aerial photography to map forest cover in order torecommend locations for new growth. Lee Pratt worked for the CanadianMinistry of Agriculture. The Ministry wanted to compile land use mapsfor the entire country, maps that would describe multiple characteristicsincluding agriculture, forestry, wildlife, recreation areas, and censusdivisions. Tomlinson suggested that they pioneer a computerized systemin which land use zones were digitally encoded so that they could beoverlaid with other relevant layers such as urban/rural areas, soil type,and geology. This happenstance meeting led, in 1964, to the CanadaGeographical Information System (CGIS). The name of the system wasbestowed by a member of Parliament – an instance in which sheercontingency cast a long shadow!
This Canadian version of the history of GIS is paralleled by efforts inthe UK and United States during the same period. David Rhind (1988), amember of the UK Ordnance Survey has identified two streams of innov-ation in the development of GIS. The first was initiated by traditionalcartographers who (slowly) began to recognize the merits of digitizingspatial information, and creating automated maps in a cost-effectivemanner. Parallel developments among quantitative geographers wereinitially quite separate. Brian Berry, Waldo Tobler, and Duane Marblein the US, and Tom Waugh and Ray Boyle in the UK began to developalgorithms and computer code to solve spatial problems. Their workbecame the basis of spatial analysis in GIS (N. Chrisman, 1988, personalinterview.
In the US, the Harvard Graphics Laboratory was a tinderbox of theGIS revolution. Research at the lab established an efficient method forcomputerized overlay using polygon (vector) boundaries. The lab waspopulated by a host of researchers who continue to influence the devel-opment of GIS today including Nicholas Chrisman and Tom Poiker.A diaspora of researchers from the Harvard Laboratory in the 1970scontributed to the dissemination of GIS especially into the private sector.Scott Morehouse, a junior member left in 1981 to work for a company in
introducing the identities of gis 5
Schuurman / GIS A short Introduction Nadine Schuurman Final Proof 6.1.2004 5:27pm page 5

California called Environmental Research Systems Inc. (ESRI). At ESRI,Scott redeveloped the algorithm for vector overlay which became acornerstone of the program ArcInfo1. This dispersion of ideas fromthe Harvard Lab was the beginning of one GIS identity: that linkedto software packages, hardware systems, and technology in general(Chrisman, 1998).
The Messy Business of Digging For Roots: GIS’sIntellectual Antecedents
The development of GIS, however, is not rooted solely in computerlaboratories in the mid-twentieth century. It is arguably an outgrowthof attempts to automate calculation in the nineteenth century reflected inefforts, for example, to code population data for the US census in 1890.Pre-eminent GIS scholar, Michael Goodchild (1992), makes the point thatGIS was developed during a period when information was increasinglybeing translated into digital terms and disseminated widely. If geograph-ers hadn’t explored the possibilities of digital manipulation of spatialdata, other disciplines would have initiated the process. As it is, manyroots of GIS are in disciplines other than geography including landscapearchitecture and surveying. Many GIS scholars regard GIS as an inevit-able development, in the light of rapidly converging information tech-nologies in a number of disciplines, combined with a recent historyof spatially oriented, quantitative research questions in geography. Anincrease in scales of counting and analysis is part of a broader social andpolitical movement toward enumeration and control of populations. Likeall technologies, GIS is an outcome of both social and technologicaldevelopments.
All disciplines have intellectual roots, or modes of thinking aboutphenomena that explain why certain methodologies are used, and certainknowledges privileged. Given that GIS is a relative newcomer to geog-raphy, one might think that it would be easy to nail down its intellectualantecedents. But the reverse is true. Although some human geographersclaim that GIS is a direct descendant of the quantitative revolution,GIS researchers are loathe to accept this simplistic genealogy. Theyargue that its antecedents are more complex, comprising a number ofthreads which were, by circumstances of academic and technicalprogress, merged into GIS. Others regard GIS as a vehicle for quantitativemodels but profoundly more than a sum of techniques. Still otherresearchers argue that GIS transcended the quantitative revolution byincorporating visual intuition. There is a further sense that it is futileto categorize GIS’ historical relationships, especially when they arguably
6 introducing the identities of gis
Schuurman / GIS A short Introduction Nadine Schuurman Final Proof 6.1.2004 5:27pm page 6

began in the nineteenth century with the collection of statistical infor-mation about citizenry.
GIS was certainly one vehicle for the introduction of spatial techniquesinto the discipline but it piggybacked on quantitative methods. These twoapproaches were merged with the introduction of computer program-ming to solve spatial problems in the 1970s. Many geographers argue,however, that GIS is more than a vehicle to transport quantitative tech-niques into geography. According to Nancy Obermeyer, GIS bears thesame relationship to the quantitative revolution that a calculator bears tomathematics. ‘‘On one hand, the operations that are clear-cut can be donemore simply but . . . you still need to understand the models and theconceptual issues that underlie it’’ (cited in Schuurman, 1999a, 24). Inother words, GIS draws upon models developed in the quantitativerevolution but meaningful implementation still requires an understand-ing of how those models function in a spatial and algorithmic context.Having a GIS on your desk is not sufficient to implement quantitativemodels. Users are still required to understand how to frame the questionsand wager the degree to which the question is appropriate in the contextof the available data.
There is a divide between those who emphasize GIS’ links to quantita-tive analysis, and those who regard it as an extension of mapping. Muchearly GIS simply involved using the brute force of computer cartographyto map data distributions. David Rhind (1988) notes that there was adivide between people using the computer to analyze spatial data andthose using it to print data in graphical form. Waldo Tobler, a legendaryfigure in both spatial analysis and cartography, used the computer todraw and calculate projections but remained a true cartographer in thathe viewed transformation (spatial analysis) as a means to graphic repre-sentation, rather than an end in itself (Schuurman, 1999b). The argumentis increasingly moot as, since the 1970s, output from analytical operationshas been ported to printers for display – the basis of modern GIS.
Despite demonstrated antecedents of GIS in cartography and quantita-tive methods, there is an inchoate but emphatic sense, among researchers,thatGIS extends quantitative techniques. Bymaking themmore accessible,many feel that it has imbued them with a more intuitive cast. One of thechief virtues of GIS is that it allows the visualization of spatial data as wellas providing ameans of utilizing fuzzydata.While the quantitative scienceprefers clear and precise ‘‘facts,’’ GIS provides away to include data that isnot so pristine. It presents geographers with ways to visualize spatialarrangements and, in the process, recovers intuition from the wasteheapto which it was relegated during the quantitative revolution. Researchersin ‘‘scientific’’ visualization stress that it is the relation of graphical displayto communication of information that distinguishes themethodology. The
introducing the identities of gis 7
Schuurman / GIS A short Introduction Nadine Schuurman Final Proof 6.1.2004 5:27pm page 7

methodology is indeed superceded by the power of the image. This topic istreated with greater detail in Chapter four, and Figure 4.17 illustrates theinfluence that an image has in conveying information. In this example, thelarge spike in incidences of tuberculosis delivers informationmore power-fully than a table showing incidence of illness in various postal codes.
In GIS, visualization is emerging as a subspecialty that focuses on howhumans interpret visual imagery, and algorithms for data manipulationand patterns of human-computer interaction. A surface map of elevationsconveys a more easily interpreted feel for the landscape than a table thatassigns an elevation to each grid cell for the same area. Visualization isused to manufacture meaning from data, through rendering it in imageform. GIS incorporates ongoing research into geographic visualizationbut, more to the point, it is based on the very principles that have recentlybrought scientific visualization to the fore. Geographers have alwaysused graphical representations to ‘‘see’’ spatial patterns.
GIS researchers perceive its visuality as a means of increasing theaccessibility and meaning of spatial analysis. In a decision-making con-text, for instance, visual display often leads to intuitive conclusions aboutcofactors for a given incidence. This reliance on visual intuition consti-tutes a seemingly ‘‘unscientific’’ approach but it is one that finds increas-ing support in cognitive research which has demonstrated that people areable to discern information from visual display with greater facility thanfrom tables or printed text. Furthermore, many scientists report thatpeople ‘‘reason’’ using imagery. Visual images are processed by theviewer differently than numerical or textual output.
Despite recent incorporation of intuition and visualization into GIS’repertoire, it is difficult to dispute that there are ‘‘cultural affinities’’between GIS researchers and quantitative geographers. Strenuous differ-entiation of GIS from ‘‘simple’’ quantitative analysis signals perhaps areluctance to be tarnished with the same criticisms as have been leveledat mathematical modelers. It also points to a firm conviction, on thepart of developers, that GIS surpasses the limitations of conventionalanalyses through its visuality. Consistent with a tendency to distinguishGIS from other strands of geography is a recent twist on its appellation.GIS now routinely refers to geographic information science rather thansystems. The name shift points to qualities associated with the technologyas well as its disciplinary context.
What Does the Acronym GIS Stand For? The Two Faces of GIS
Definitions of GIS tend to focus on the collection of hardware and soft-ware that are associated with the technology. A standard recital of what
8 introducing the identities of gis
Schuurman / GIS A short Introduction Nadine Schuurman Final Proof 6.1.2004 5:27pm page 8

geographic information systems are might mention necessary componentssuch as: methods of data input, analysis, mapping, and output associatedwith spatial data. Such definitions focus on a collection of practices,hardware, and software that have become known as GIS. Each of thesealgorithms, bits of metal, and computer code have their own ethno-graphy, but they are so closely linked in the minds of their users as toform a ‘‘black box.’’ The term black box was promoted in the popularliterature (well, popular for academics) by Bruno Latour (1987) whoargued that new scientific knowledge is at first disputed and referencesto it use copious citations to establish its legitimacy. As the concept – ortechnology – is better established, it is simply assumed to be true andgood, and references and justification are no longer required. The termblack box is suitable for one of GIS’ identities – the systems identity. Mostusers, after all, who use a hydrological model embedded in ArcInfo1 – apopular GIS program – don’t question its legitimacy. Seldom does anyone ask how their GIS software decided on the boundaries of the coloredpolygons that illustrate areas of different income level in a city. Nor is thespatial analysis routine that determines daily delivery routes for a couriercompany likely to be disputed. GISystems are assumed by the vastmajority of users to produce true results.
Close by in a parallel universe, geographic information science is con-cerned with precisely these questions. GIScience is, in the simplest sense,the theory that underlies GISystems. It took several decades, however, forthis alternate GIS identity to emerge. By the beginning of the 1990s, asense prevailed among many academic researchers that GIS had forgednew intellectual territory. This intimation was first given substance in akeynote speech given by Michael Goodchild, Professor of Geography atthe University of California at Santa Barbara, during the July, 1990,Spatial Data Handling conference in Zurich and again at the EGIS (Euro-pean GIS) meeting in Brussels in April, 1991 (Goodchild, 1992). In each ofthese addresses, Goodchild noted that the GIS community is driven byintellectual curiosity about the nature of GIS. He argued that it behoovesresearchers in GIS to focus on fundamental precepts that underlie thetechnology rather than the application of existing technology. Further-more, he argued that there are unique characteristics of geographicaldata, and problems associated with its analysis, that differentiate GISfrom other information systems. These properties include: the need todevelop conceptual models of space; the sphericity of spatial data; prob-lems with spatial data capture; spatial data uncertainty and error propa-gation; as well as algorithms and spatial data display. Given thedistinctiveness of geographical data analysis and a growing communityof researchers dedicated to solving technical and theoretical problemsassociated with GIS, Goodchild argued that ‘‘GIS as a field contain[s] a
introducing the identities of gis 9
Schuurman / GIS A short Introduction Nadine Schuurman Final Proof 6.1.2004 5:27pm page 9

legitimate set of scientific questions’’ (cited in Schuurman, 1999b).Questions about the underlying assumptions written into the code thatcomprises GISystems are the basis of GIScience.
A GIScientist would indeed question the premises of a hydrologicalmodel. She might ask who devised the model? How well does it work ina glacial environment as opposed to a wetlands? Or, is the modeldesigned for use with vector (polygon) or raster (gridded) data? OtherGIScientists are interested in how boundaries are defined. How dodifferent input parameters or measurement systems lead to differentboundary definitions, and how do these vagaries affect the results ofGIS analysis? Network analysis routines that optimize delivery or repairroutes are also subject to deeper investigation. A GIScientist is likely totry and ascertain whether certain neighborhoods are better served thanothers, and whether travel times accurately reflect changing weather andtraffic conditions. These types of questions strike at the efficiency andlegitimacy of current GISystems algorithms, and their resolution willgreatly increase the reliability of GIS for the average user. They don’trepresent, however, the entirety of GIScience.
Every stage of GISystems from spatial data collection and input, tostorage, analysis, and, finally, output of maps is based on the translationof spatial phenomena into digital terms. At each step of GIS, data aremanipulated for use in a digital environment, and these, often subtle,changes have profound effects on the results of analysis. Each of thesetransformations involves a subtle shift in the representation of spatialentities, and accounting for these modifications and their implications isan important part of GIScience. Physical and social information about theworld, once in digital form, is often manipulated and analyzed in order tocorrespond to the researcher’s interpretation of the world. Thus, it is offundamental importance that GIScientists understand how to monitorand account for the effects that transformations have on data. Finally, GISresearchers must understand how to present analyses such that theirvisual display is consistent with database results.
The work of GIScientists begins even before data are digitally encoded.Spatial phenomena must be delineated and classified in preparation forinput to data tables. Classification systems, however, must be compatiblewith data tables, and this acts as a constraint to the development ofcategories. Many spatial phenomena manifest multiple characteristics,but not all of them can be included in a database or the data wouldbe infinite. The manipulation of data depends on the attributes that arerecorded, or the objects that are defined. Different community boundar-ies, for instance, will render different results in an assessment of popula-tion health. Visualizing GIS results is likewise vulnerable to the vagariesof the digital environment, and must be consistent with human capacity
10 introducing the identities of gis
Schuurman / GIS A short Introduction Nadine Schuurman Final Proof 6.1.2004 5:27pm page 10

for perception. At a small scale, for instance, only a limited number ofattributes can be displayed or the map becomes overcrowded. At a largerscale, a greater number of attributes can be accommodated. Each of theseissues has a bearing on how spatial data are analyzed and interpreted.
In the broadest sense, GIScience is the theoretical basis for GISystems,and its research purview is the representation of spatial data and theirrelationships – in terms of bits and bytes. Working in a digital environ-ment is akin to speaking another language that uses fundamentallydifferent building blocks. If we think of the English language as beingcomposed of 26 letters that can be combined in various ways to formwords, sentences, and ideas, then GIS is based on two letters (well, digits– zeros and ones) that can be combined and manipulated to represent andanalyze geographical phenomena and relationships. But the environmentand rules associated with manipulating geographical objects are quitedifferent from those we are accustomed to using for text and conven-tional graphics. GIScientists explore how spatial objects become digitalentities, what effect that transformation has on their ontologies, how torepresent different epistemologies within GIS, how to model relation-ships between spatial entities, and how to visualize them so that humanbeings can interpret the results. This pursuit draws on and extendsdevelopments in data modeling, computer science, cognition, scientificvisualization, and a myriad fields that have emerged in response toinformation systems.
GIScience is not limited, however, to process-oriented issues. It isengaged with how people represent their geographical environment,and who has the authority to represent space. Public Participation GIS(PPGIS) studies and engages with nonprofit groups and nongovernmen-tal organizations who use GIS to represent themselves, and advocate forchange. Other GIScientists address questions about feminism and GIS,and whether the technology is inherently gendered. Stacey Warren (2003)explains that PPGIS and feminism and GIS allow us to move the focusfrom analysis and representation in GIS to one that views the technologyas a ‘‘collaborative process that involves both people and machinery.’’This emphasis on social interactions between users, affected populations,and technology is evident in the growing number of Critical GIS scholarswho have merged emancipatory agendas and theory from human geog-raphy with GIScience.
Developers and researchers postulate that GIScience transcends mereinformation systems and allows users to ask questions about spatial rela-tions that were previously impossible to pose. Its champions argue thatgeographic information science extends spatial analysis by virtue of en-hanced processing power that allows data-intensive analyses to extendtheir geographical breadth. They claim that GIScience is a means of
introducing the identities of gis 11
Schuurman / GIS A short Introduction Nadine Schuurman Final Proof 6.1.2004 5:27pm page 11
investigating previously obscured spatial relationships and contingen-cies. There is a tension between GIS scholars who view the technology asan emergent phenomenon, capable of initiating a shift in scientific meth-odology and other geographers who view it simply as a vehicle forconcepts that emerge from geography. It is, of course, both. Moreover,GISystems are the medium for ideas that emerge from GIScience. Thistext uses the acronym GIS in most instances for simplicity to refer to bothsystems and science. This conflation of terms reflects both the interrelat-edness of two pursuits, as well as the fuzzy boundary between them. Incases where their differentiation is important, the distinction is made.
Data In, Information Out: Common Ground BetweenGIScience and GISystems
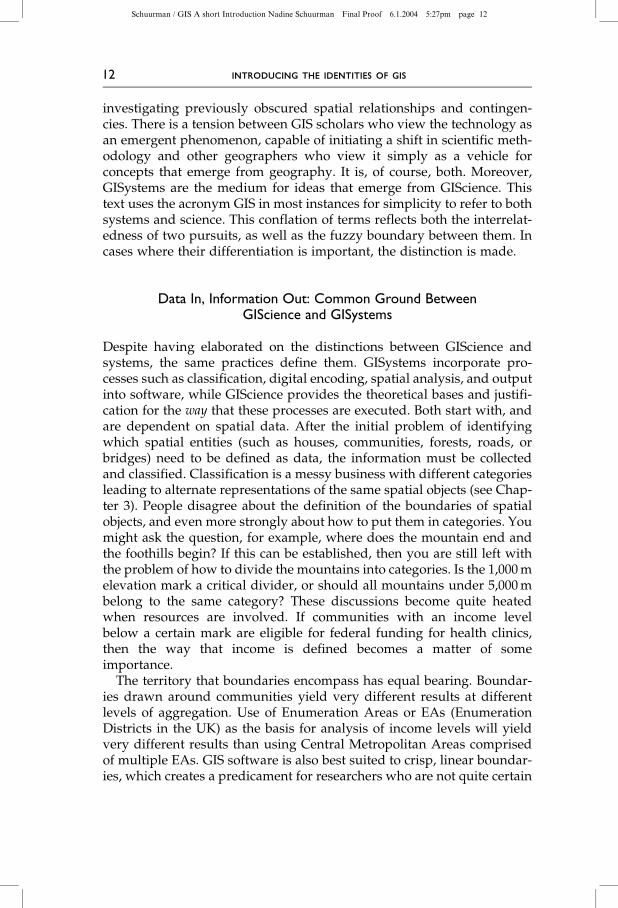
Despite having elaborated on the distinctions between GIScience andsystems, the same practices define them. GISystems incorporate pro-cesses such as classification, digital encoding, spatial analysis, and outputinto software, while GIScience provides the theoretical bases and justifi-cation for the way that these processes are executed. Both start with, andare dependent on spatial data. After the initial problem of identifyingwhich spatial entities (such as houses, communities, forests, roads, orbridges) need to be defined as data, the information must be collectedand classified. Classification is a messy business with different categoriesleading to alternate representations of the same spatial objects (see Chap-ter 3). People disagree about the definition of the boundaries of spatialobjects, and even more strongly about how to put them in categories. Youmight ask the question, for example, where does the mountain end andthe foothills begin? If this can be established, then you are still left withthe problem of how to divide the mountains into categories. Is the 1,000melevation mark a critical divider, or should all mountains under 5,000mbelong to the same category? These discussions become quite heatedwhen resources are involved. If communities with an income levelbelow a certain mark are eligible for federal funding for health clinics,then the way that income is defined becomes a matter of someimportance.
The territory that boundaries encompass has equal bearing. Boundar-ies drawn around communities yield very different results at differentlevels of aggregation. Use of Enumeration Areas or EAs (EnumerationDistricts in the UK) as the basis for analysis of income levels will yieldvery different results than using Central Metropolitan Areas comprisedof multiple EAs. GIS software is also best suited to crisp, linear boundar-ies, which creates a predicament for researchers who are not quite certain
12 introducing the identities of gis
Schuurman / GIS A short Introduction Nadine Schuurman Final Proof 6.1.2004 5:27pm page 12

how to draw the line between, for example, black bear and grizzly bearhabitats. Indeed, a fundamental challenge for GIScientists is to find waysto represent the fuzzy boundaries that characterize geographical areasand events using the crisp lines favored in GIS.
Further challenges are associated with modeling spatial phenomenausing GIS. Spatial analysis and modeling are increasingly used to predictoutcomes, and plan for future development or natural hazards. In thepast, GIS was used primarily to manage data, and map distributions. Thiscapacity has been extended by the ability to model interactions amongdifferent attributes (characteristics) of the spatial objects, and use thisinformation to predict future events. Land use managers and city plan-ners, for instance, use GIS to study future urban growth based onmultiple factors such as density, socioeconomic indicators, geographicalconstraints (e.g., is the city bounded by mountains or ocean?), roadnetworks, and present land use. Once data are classified, spatial bound-aries determined, and analysis complete, the results must be visualizedso that users can interpret the information.
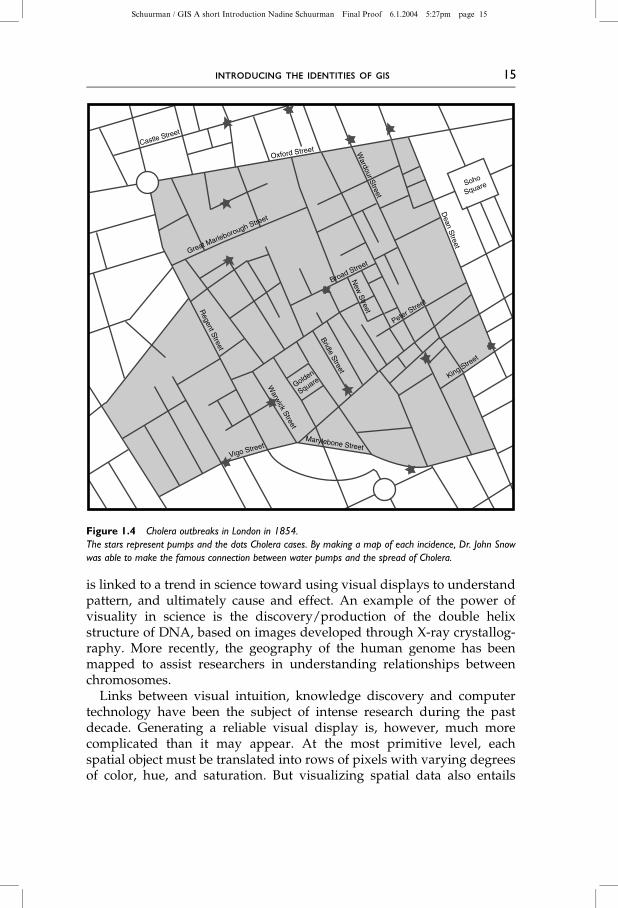
Geographic visualization refers both to traditional cartography and tothe ability to express knowledge about space and spatial relations in avisual form. The power of GIS emerges partly from its capacity to makevisual spatial relationships, and to picture spatial objects in a way thatallows users to interpret pattern. Rather than generate tables listing thecensus tracts associated with children at high risk of contracting HepatitisA in their preschool, a GIS graphically displays the census tracts, color-coded based on level of risk. The value of visual display in assessingpattern associated with the spread of disease in illustrated in Figure 1.3.At the analysis level, there is no perceptible difference between thestatistical results and GIS. The visuality of results, however, allows forintuitive or structured exploration of cofactors. The most famous exampleof visual intuition related to mapping is that of epidemiologist’s JohnSnow’s hypothesis that Cholera incidence, during the 1854 outbreak inLondon, was highest in the vicinity of public wells. Figure 1.4 illustratesthe distribution of deaths from Cholera and public water pumps in theSoho area of London in 1854. Based on this map, Dr. Snow reputedlydiscerned that the use of public wells was linked to Cholera. This conclu-sion was not straight forward as there were several buildings with highpopulation density in the vicinity of the Broad Street pump in whichthere were no deaths. Snow relied on his local knowledge to visit thePoland Street workhouse, for instance, and ask from which pump theinhabitants drew water. It turned out that the workhouse had its ownwell, and none of the 135 inmates had visited the Broad Street pump.
This story demonstrates the value of local knowledge used in conjunc-tion with maps to discern patterns. Visualization in conjunction with GIS
introducing the identities of gis 13
Schuurman / GIS A short Introduction Nadine Schuurman Final Proof 6.1.2004 5:27pm page 13

CT
# C
hild
ren
# C
hild
ren
wit
h h
epat
itis
%R
isk
23.0
025
14%
Low
24.0
017
212
%Lo
w24
.00
450
0%V
ery
low
25.0
030
27%
Low
26.0
025
624
%M
ediu
m31
.01
3011
37%
Hig
h39
.01
297
24%
Med
ium
39.0
245
1227
%H
igh
42.0
019
842
%M
ediu
m43
.01
181
6%Lo
w43
.02
201
5%Lo
w43
.02
270
0%V
ery
low
44.0
045
12%
Low
45.0
135
13%
Low
45.0
221
15%
Low
47.0
127
27%
Low
47.0
216
16%
Low
49.0
123
14%
Low
50.0
340
13%
Low
51.0
025
1352
%H
igh
52.0
136
13%
Low
52.0
224
00%
Ver
y lo
w54
.01
381
3%Lo
w57
.01
508
16%
Med
ium
57.0
219
1158
%H
igh
58.0
026
935
%M
ediu
m59
.05
381
3%Lo
w59
.06
256
24%
Med
ium
69.0
051
1122
%H
igh
Very
Low
Low
Med
ium
Hig
h
Ris
k
69.0
0
68.0
0
44.0
0
7.01
53.0
1
27.0
021
.00
25.0
0
2.01
1.02
19.0
024
.00
9.00
59.0
5
11.0
0
57.0
2
2.02
35.0
2
4.0149
.01 12
.00
030.
00
29.0
028
.00
36.0
2
20.0
0
10.0
1
36.0
1
34.0
2
5.00
10.0
215
.02
14.0
0
52.0
2
50.0
351
.00
26.0
0
52.0
1
32.0
0
48.0
0
23.0
0
17.0
1
13.0
1
33.0
0
56.0
158
.00
13.0
2
3.02
042.
00
6.02
1.01
43.0
241
.02
18.0
2
16.0
4
15.0
1
18.0
1
6.01
17.0
2
049.
0204
9.02
55.0
1
54.0
2
53.0
2
045.
02
39.0
143
.01
50.0
2
16.0
1
031.
02
16.0
3
56.0
2
55.0
2
045.
01
34.0
1
37.0
139
.02
59.0
3
038.
00
59.0
6
54.0
1
3.01
37.0
2
66.0
0
46.0
0
59.0
4
67.0
0
41.0
1
47.0
247
.01
50.0
4
40.0
2
40.0
1
57.0
1
6564
60.0
2
6163
62
60.0
1
68.0
0
59.0
6
8.00
4.02
31.0
1
35.0
1
22.0
0
Figure
1.3
GraphicdisplayofonescenarioforincidenceofHepatitisAindaycares
intheVancouverarea.N
otethatareasofhigh
incidencearemucheasier
todiscernfrom
themap
than
thetable.
Schuurman / GIS A short Introduction Nadine Schuurman Final Proof 6.1.2004 5:27pm page 14
is linked to a trend in science toward using visual displays to understandpattern, and ultimately cause and effect. An example of the power ofvisuality in science is the discovery/production of the double helixstructure of DNA, based on images developed through X-ray crystallog-raphy. More recently, the geography of the human genome has beenmapped to assist researchers in understanding relationships betweenchromosomes.
Links between visual intuition, knowledge discovery and computertechnology have been the subject of intense research during the pastdecade. Generating a reliable visual display is, however, much morecomplicated than it may appear. At the most primitive level, eachspatial object must be translated into rows of pixels with varying degreesof color, hue, and saturation. But visualizing spatial data also entails
Soho
Square
Golden
Square
Regent S
treet
Dean S
treetOxford Street
Bridle Street
Great Marleborough Street
Wardour S
treet
New
Street
Peter Stre
et
Marylebone Street
Warw
ick Street
Castle Street
King Street
Vigo Street
Broad Street
Figure 1.4 Cholera outbreaks in London in 1854.
The stars represent pumps and the dots Cholera cases. By making a map of each incidence, Dr. John Snow
was able to make the famous connection between water pumps and the spread of Cholera.
introducing the identities of gis 15
Schuurman / GIS A short Introduction Nadine Schuurman Final Proof 6.1.2004 5:27pm page 15
understanding how human beings in different contexts perceive certainsymbols, relationships between phenomena, and map representations.Does a picture of a teepee mean camping facilities to everyone in everycountry? Which colors best represent elevation on a large-scale map?Is the relationship between the bridge and the river more important tomap readers than their precise geometry? These are among the questionsthat geovisualization experts must address as part of the greater projectof GIS.
GIS in the World: Who Uses It For What?
GIS has a pervasive reach into everyday life. For users and operators, GISprovides a means to convert data from tables with locational informationinto maps. Subsequent GIS-generated maps are the basis for spatialdecision making in government agencies, businesses, community groups,universities, and hospitals. But the reach of GIS far exceeds people whouse the technology. It affects the lives of millions of people in a myriad ofways.
What you eat, where it comes from, and the route it takes to reach yourlocal supermarket are each dependent on GIS technologies. As large-scaleagribusiness has proliferated, so too has the role of GIS in food produc-tion and agriculture. Business farmers regularly combine remotelysensed imagery and soils analysis to create visualizations of ideal futurecrop locations and their relationship to local and distant markets. Quo-tidian farming is often based on ‘‘precision farming techniques’’ thatallow the farmer to respond to and analyze local conditions in the fieldwith pinpoint accuracy. For instance, a section of a wheat field mighthave blight. The area circumscribed by the blight is inventoried usingglobal positioning systems (GPS), and then combined with other layerssuch as soil type, soil chemistry, wheat variety, pesticide load, andirrigation information to determine why that particular section is underduress. Likewise, data about grazing are used to assess the number ofbeef cattle the land will support based on a given area of pasture. Cropmanagement includes planning to protect vulnerable crops from frost,fires, and over-precipitation or drought. GIS is used to model each ofthese factors and provide risk factors associated with each depending onthe crop and type of farm (e.g., organic or conventional; hand-harvestedor machine-picked). Once harvested, crops need to reach a wide range ofmarkets depending on purchase pricing, local preferences, and the cost oftransport. Finally, modern farming is sensitive to markets. GIS is used toprofile markets, pricing and related transportation costs in order todevelop an optimum model for matching crops to consumers.
16 introducing the identities of gis
Schuurman / GIS A short Introduction Nadine Schuurman Final Proof 6.1.2004 5:27pm page 16
Municipal management, like farming, has become a high-tech field thatis dependent on GIS for delivery of services. A brief inventory of spatialdata held by almost every municipality includes property outlines withsurvey points, tax assessment values, township and country boundaries,roads, waterways, public transportation routes, bicycle paths, aerial pho-tography, park lands, public buildings, and waste collection routes. Eachof these spatial entities is associated with a particular GIS functionality.For instance, tax assessment values are linked to individual houses, andare used to evaluate levels of service associated with particular neighbor-hoods – as well as to keep track of the payment of taxes. Road files,including surface material, embankment, and grade are combined withelevation, weather, and traffic volume and load data to determine whichroads are likely subject to accelerated degradation. When roads requirerepair, closures and reroutings are designed to minimize traffic disrup-tion – though this is seldom clear when you are sitting in stalled traffic.Encouraging bicycle use and green commutes is the goal of an increasingnumber of urban municipalities. Since 1993, the city of Vancouver, BritishColumbia, has designated a 135 km bicycle network throughout the city.Since Vancouver has only 5 km of dedicated bicycle path, GIS is used toestimate traffic volumes of both modes of transport during peak com-muting periods in order to determine relatively safe bicycle venues.Accessibility of different neighborhoods to parks or public servicessuch as libraries is determined through GIS queries. Waste collectionroutes are designed using GIS network analysis to reduce exposure ofpick-up trucks to traffic, and to optimize the amount of waste gatheredon each collection route. This description is an attenuated account of thedegree to which GIS has become instrumental in planning our cities.
Urban life is also reliant on GIS in more subtle ways. Pervasive andcomplex networks provide power, fuel, and water to town and citydwellers. The electrical grids that deliver power are designed and man-aged using GIS. Each circuit is mapped, and its direction recorded.Circuit can be traced down to the individual customer, and load concen-trations can be visualized on a house-by-house basis or for the entireneighborhood. When a circuit needs to be closed down, these data areused to examine all feeding directions in order to switch locations andminimize electrical outages. Specialized software is used with these datato balance transformer loads and minimize loss of power as it seepsthrough the lines. Recent trends toward privatization of public utilitiesin Europe and North America have increased pressure to achieve greaterefficiencies. GIS has played a role in this trend by offering fully functionalsystems that not only manage infrastructure, but create virtual modelsfor switching and control systems. These allow managers to testcomplex scenarios for delivery and load including incorporation of
introducing the identities of gis 17
Schuurman / GIS A short Introduction Nadine Schuurman Final Proof 6.1.2004 5:27pm page 17
‘‘cogenerators’’ or small businesses that sell spare electrical capacity backto the main grid. The water reservoir and distribution system, natural gasfuel lines, and telephone and cable lines are similarly GIS based andmanaged.
G-commerce or e-commerce facilitated by GIS has burgeoned as web-based sales proliferate. G-commerce is based on mapping and data an-alysis tools that allow businesses to construct business-to-business (B2B)and business-to-customer (B2C) portals. A typical B2C portal is illus-trated by Amazon.com which sells books, music, and even pharmaceut-ical drugs directly to consumers in their homes. B2B portals are just ascommon; they are the basis for ‘‘just-in-time’’ delivery systems in whichproduction is wed ever more closely to sales in order to avoid long shelflives for products – and delayed revenue. G-commerce also providesmarketers with the tools to analyze data on customers, sales, and per-formances using socioeconomic and ‘‘lifestyle’’ data. These data are usedto visualize consumer trends, and detect opportunities for increasedsales. This trend contributes to what Mark Poster (1996) has called thecreation of ‘digital personae’ in which each individual is incompletelydescribed in government and marketing databases based on frequentlyscanned digital data and derived consumer profiles. These data andaccompanying profiles are necessarily incomplete and result in only arough approximation of each of us. They are the basis, however, for muchmarketing and determine where new retail outlets are opened, andwhether you receive a given flyer in your letter box.
The use of digital data on individuals and communities is not used onlyby private firms; rather it constitutes the basis for e-governance or elec-tronic governance. E-governance is proliferating as federal and provincialgovernments begin to use the web to deliver services and allow publicaccess to information. E-governance has an a-spatial, administrative ringto it, but it is powered by GIS and related ‘‘spatially aware’’ software. Atthe municipal level, e-governance entails access to survey lines, propertydefinitions, and tax assessment information. Public notices are web-posted, and forms for everything from dog-licensing to tendering ofconstruction contracts are managed on-line. At the state or provinciallevel, e-governance is poised to become the vehicle for automobile regis-tration and other services including campground reservation, passportrenewal, postal services, and plebiscites. The appeal of e-governance isthe promise of more efficient and transparent delivery of services. Itssuccess is dependent, however, on high-levels of web-access which isstill not a reality in most countries. Interestingly, India is at the forefrontof e-governance technologies and implementation. This speaks to theremarkable intellectual capital the country has as well as the ability oftechnologies to ‘‘leap-frog.’’ The proliferation of cell-phone use in sub-
18 introducing the identities of gis
Schuurman / GIS A short Introduction Nadine Schuurman Final Proof 6.1.2004 5:27pm page 18

Saharan Africa by people who never owned a land-line is one example oftechnology leap-frogging. In the case of India, proponents of e-govern-ance argue that it is a means to eliminate high levels of corruption in thecivil service while optimizing the delivery of government services. De-tractors counter, however, that e-governance is a means of centralizingpower in the hands of a few, and that it lends itself to the indiscriminatecollection of digital data about individuals in the absence of privacyrestraints. These arguments aside, e-governance is being actively pursuedby almost every level of government in many countries. The technology todo so is dependent on spatial data and GIS functionality.
Clearly GIS is interwoven with the fabric of every day life. Understand-ing the computational and intellectual basis for this technology is anexcellent first step toward a better comprehension of the technologicalbases for modernity. This understanding is a starting point for insightsinto how the digital realm has come to organize and control so manyfunctions of modern society. The rest of this book sets out to accomplishthis task by examining not only GIS the technology but its intellectual anddisciplinary ties.
In Chapter 2, the relationship between GIS and human geographerswithin the discipline of geography is explored as a way of delineatingtheir shared intellectual territory. Explanations for past stormy relationsare offered from the perspectives of both disciplinary niches. Many of theinitial differences between GIS scholars and social scientists are linked toepistemology or the formal and informal perspectives that inform re-search methodologies. While epistemology of implementation and devel-opment affects GIS, there are myriad contextual factors that influence thetechnology. The second part of Chapter 2 examines ways in which thedevelopment of GISystems and GIScience have been shaped by intellec-tual traditions, language, and political pursuits.
Using GIS requires data – or information – as well as appropriatesoftware. In fact, data are the primary determinant of relevance for GISanalysis. Students and users of GIS are often captivated by the power ofthe software, and presume that data are appropriate by virtue of theirexistence. Chapter 3 is concerned with spatial data including the politicsof collection and their relationship to representation, how data are organ-ized, and the challenges of sharing data. The discussion of data rangesfrom the sociopolitical contexts of collection to the technical challenges ofinteroperability between data sets. The chapter concludes with anexample of data collection and sharing that demonstrates the constraintsof the technology, and the politics of implementation.
Data are the servant of analysis in GIS rather than ends in themselves.Chapter 4 delves into the operations that give GIS its power: the constitu-ents of spatial analysis. The early part of the chapter is necessarily
introducing the identities of gis 19
Schuurman / GIS A short Introduction Nadine Schuurman Final Proof 6.1.2004 5:27pm page 19

devoted to explaining the basis for common spatial analysis operations,their parameters, and the logic upon which they are based. The lattersection is devoted to working examples of GIS in environmental manage-ment and population health. Finally, the rationalities of GIS analysis areexamined with an eye to reinforcing the notion that GIS like statisticsstrengthens particular actors and agendas.
In the final chapter, the distinction between GISystems and GIScienceis revisited in order to afford the reader a more nuanced notion of whateveryday work in each of these niches might entail. The potential ofGIScience research to enhance the scope of representation afforded bycurrent GISystems is described by providing a brief description of twosmall, but significant areas of current research: ontologies and feminismand GIS. Both of these areas are of interest to human geographers becausethey share common literatures and ideals. In the case of ontologiesresearch, the goal is to enable GIS – as a form of representation – to bettermodel the world based on multiple perspectives. Feminism and GISincorporates and furthers the goals of feminist politics by incorporatingand changing GIS to better serve as an ally in these endeavors. Theconcluding section reiterates the interrelatedness of GISystems andGIScience, and the value of both the discipline and pursuit of geograph-ical knowledge and representation.
20 introducing the identities of gis
Schuurman / GIS A short Introduction Nadine Schuurman Final Proof 6.1.2004 5:27pm page 20