Embed Size (px)
Citation preview

AAPM 2005 AAPM 2005 -- E.F. JacksonE.F. Jackson
11
MDACC MR Research
AAPM 2005 - Continuing Education Course - MRI Physics and Technology - 4
Advanced MRI - An Overview of Techniques and Applications
Edward F. Jackson, PhDDepartment of Imaging Physics
MDACC MR Research
Introduction
Image contrast in MRI depends on an extensive list of intrinsic and extrinsic parameters.
– Intrinsic parameters include:proton density velocityspin-lattice relaxation time (T1) diffusionspin-spin relaxation time (T2) perfusionchemical environment temperature
– Extrinsic parameters include:echo time (TE) saturation pulsesrepetition time (TR) inversion pulsesflip angle (α) flow compensation pulses (GMN)contrast agents diffusion sensitization pulses
MDACC MR Research
IntroductionFour “advanced” MR applications to be discussed in this course:– Assessing changes in 1H diffusion
• Use of diffusion imaging techniques to determine the rate and principle direction of thermal (Brownian) motion of protons.
– Assessing biochemical changes non-invasively• Use of MR spectroscopy (MRS).
– Assessing the microvascular environment• Use of dynamic contrast enhanced (DCE) or dynamic susceptibility change
(DSC) MRI to assess changes in the microvascular environment.
– Assessing areas of neuronal activation• Use of blood oxygen level dependent (BOLD) MRI to determine regions of
neuronal activation based on hemodynamic response.
MDACC MR Research
Assessing changes in 1H diffusion
MDACC MR Research
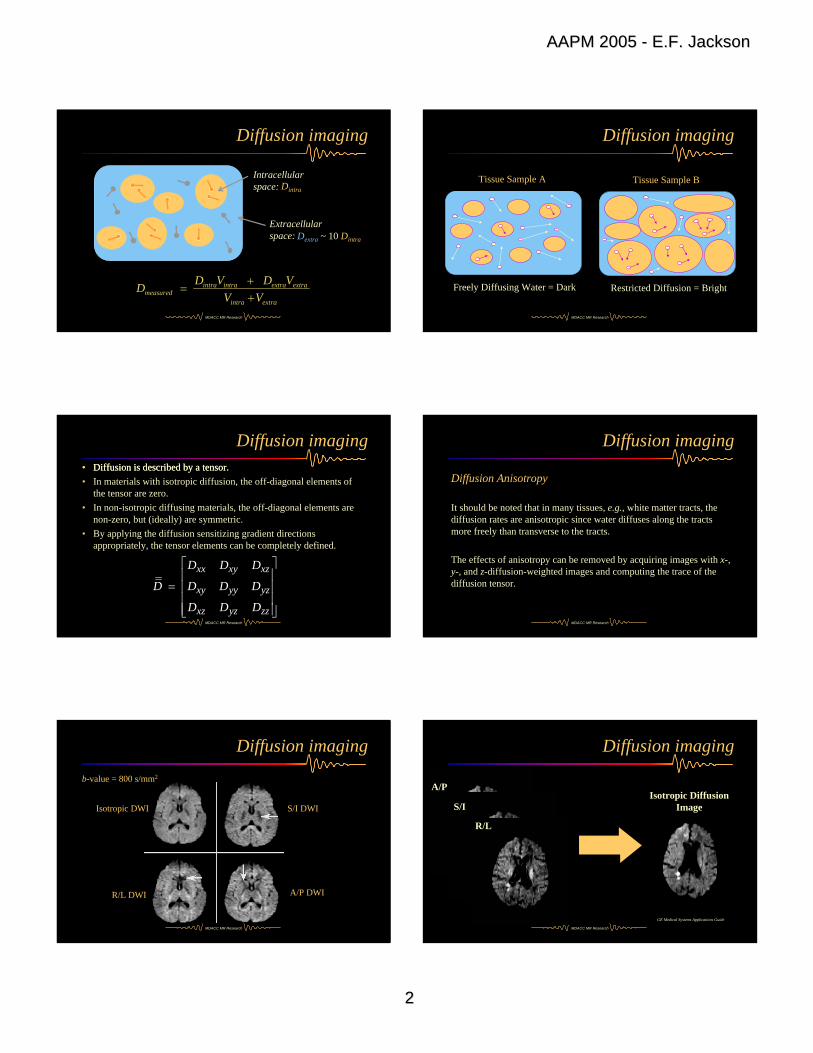
Diffusion imagingThe addition of two “diffusion-sensitizing” gradients provides a means of generating diffusion-weighted images.
In the presence of these gradients, the signal is attenuated according to S/S0 = e-bD, where D is the diffusion coefficient (mm2/s), and b is the “b-value”.
RF
Gdiff
MDACC MR Research
Diffusion imaging
Stejskal, Tanner. J Chem Physics , 1965
90o180o
DAQ
δ∆
δG
2 2 2
3b G δγ δ ⎛ ⎞= ∆ −⎜ ⎟
⎝ ⎠
AAPM 2005 AAPM 2005 -- E.F. JacksonE.F. Jackson
22
MDACC MR Research
Diffusion imaging
intra intra extra extrameasured
intra extra
D V D VDV V
+=
+
Intracellularspace:
Extracellularspace:
Dintra
Dextra ~ 10 Dintra
MDACC MR Research
Diffusion imaging
Tissue Sample B
Restricted Diffusion = Bright
Tissue Sample A
Freely Diffusing Water = Dark
MDACC MR Research
Diffusion imaging• Diffusion is described by a tensor.• In materials with isotropic diffusion, the off-diagonal elements of
the tensor are zero.• In non-isotropic diffusing materials, the off-diagonal elements are
non-zero, but (ideally) are symmetric.• By applying the diffusion sensitizing gradient directions
appropriately, the tensor elements can be completely defined.
xx xy xz
xy yy yz
xz yz zz
D D D
D D D D
D D D
⎡ ⎤⎢ ⎥
= ⎢ ⎥⎢ ⎥⎢ ⎥⎣ ⎦
• Diffusion is described by a tensor.
MDACC MR Research
Diffusion imaging
Diffusion Anisotropy
It should be noted that in many tissues, e.g., white matter tracts, the diffusion rates are anisotropic since water diffuses along the tracts more freely than transverse to the tracts.
The effects of anisotropy can be removed by acquiring images with x-, y-, and z-diffusion-weighted images and computing the trace of the diffusion tensor.
MDACC MR Research
Diffusion imaging
Isotropic DWI S/I DWI
A/P DWIR/L DWI
b-value = 800 s/mm2
MDACC MR Research
Diffusion imaging
A/P
S/I
R/L
Isotropic DiffusionImage
GE Medical Systems Applications Guide

AAPM 2005 AAPM 2005 -- E.F. JacksonE.F. Jackson
33
MDACC MR Research
Diffusion imaging
Image DisplayThere are two ways of displaying images with diffusion-based contrast:
Diffusion-weighted imaging (DWI) - areas of unrestricted diffusion appear hypointense and areas of restricted diffusion appear hyperintense.
Advantage: Very fast, no extra post-processing steps.
Disadvantage: T2 “shine through” can be problematic. (Due to T2weighting of the sequence, i.e., long TE intervals, necessary in order to obtain adequate b-values. This problem is decreased with high performance gradient subsystems.)
MDACC MR Research
Diffusion imagingApparent diffusion coefficient (ADC) imaging - areas of unrestricted diffusion appear hyperintense and areas of restricted diffusion appear hypointense. Requires the acquisition of multiple sets of DWIs with varying b-values to allow computation of ADC values on a pixel-by-pixel basis by linear regression analysis of the signal attenuation equation, ln(S/S0) = -b ∗ ADC.Advantage: T2 “shine-through” is eliminated.Disadvantage: Requires multiple b-values for regression => extra time.
MDACC MR Research
ADC vs DWI
DWI ADC (2 point) T2-weighted
MDACC MR Research
Diffusion imaging - Ischemic injury
normal tissue
Dnormal
cells swell
D < Dnormal
membranes break
D > Dnormal
MDACC MR Research
Diffusion imaging in acute stroke
PDW T2W FLAIR Diffusion
GE Medical Systems Applications Guide
MDACC MR Research
Diffusion weighted imaging
Isotropic DWI(“Trace” image)
S/I DWI
A/P DWIR/L DWI
b-value = 800 s/mm2

AAPM 2005 AAPM 2005 -- E.F. JacksonE.F. Jackson
44
MDACC MR Research
Diffusion tensor imaging (DTI)
3.0T, b=1000 s/mm2, 15 directions1.5T, b=1576 s/mm2, 6 directions
Using multiple diffusion encoding directions to determine the diffusion tensor terms, eigenvalue/eigenvector analysis can be used to determine the principle diffusion direction. This is the basis of “tractography”.
MDACC MR Research
Diffusion tensor imaging (DTI)Furthermore, fractional (or relative) anisotropy indices can be computed
to more fully characterize the white matter tract directions.
Red:Right/left
Green:Anterior/posterior
Blue:Superior/inferior
Image from X. Joe Zhou, Ph.D.
MDACC MR Research
Cell volume fraction measures
0
0.10.20.30.4
0.5
0.60.70.80.9
1
0 500 1000 1500 2000 2500 3000 3500 4000
b-value (s/mm^2)
sign
al (n
orm
aliz
ed)
S = 0.705e-b(0.0002) + 0.295e-b(0.002)
X. Joe Zhou, PhD, Rebecca Milman, MS
intra intra extra extrameasured
intra extra
D V D VDV V
+=
+MDACC MR Research
Breast diffusion MRI
Breast Diffusion Imaging @ 3T
ADC
FA (DTI)
T2W
DWI
MDACC MR Research
Assessing biochemical changes
MDACC MR Research
Introduction to spectroscopy
• The Larmor relation that relates resonant frequency to magnetic field strength:
ν = γ Βnucleus
where ν is the resonant frequency (MHz), γ is the gyromagnetic ratio, and Bnucleus is the magnetic field strength (T) at a given nucleus.
• However, the value of Bnucleus depends on the local electronic environment, i.e., it is the value of the applied field, Bo, modified by the magnetic field due to the chemical environment.

AAPM 2005 AAPM 2005 -- E.F. JacksonE.F. Jackson
55
MDACC MR Research
Introduction to spectroscopy
• Nuclei in different chemical (electronic) environments will haveslightly different resonance frequencies depending on the amountof local nuclear shielding, σ:
ν = γ Βο (1 − σ)
• It is this local shielding effect that results in spectra with multiple peaks for a given nuclear species, where the peak positions depend on the local chemical environment.
MDACC MR Research
Introduction to spectroscopy
• The position of a given spectral peak is usually given in terms of chemical shift with respect to some reference,
δx = (νx - νref) / νref
• This definition makes the separations between the peaks independent of applied field strength.
• Note, however, that the separation of the peaks (in Hz) does depend on field strength. Therefore, the spectral resolution improves as field strength increases. (So does the SNR of the spectral peaks.)
• For 1H MRS applications, the reference is usually water.
MDACC MR Research
Introduction to spectroscopy
H2O
H-C-OH
- CH2 -
- CH3
- C = C -H= C - NH
H
4 2 068Chemical Shift, δ (ppm)
MDACC MR Research
Requirements
The success of an MRS examination depends upon the following:– High quality localization
The volume from which the chemical information (spectrum) is obtained must be accurately known.
– Highly homogeneous magnetic fieldLinewidths of peaks are inversely proportional to T2*, so improved homogeneity results in narrower peaks (improved spectral resolution).
– Efficient water suppression (1H MRS)This is aided by improved homogeneity as well.
– Spectral quantitation
MDACC MR Research
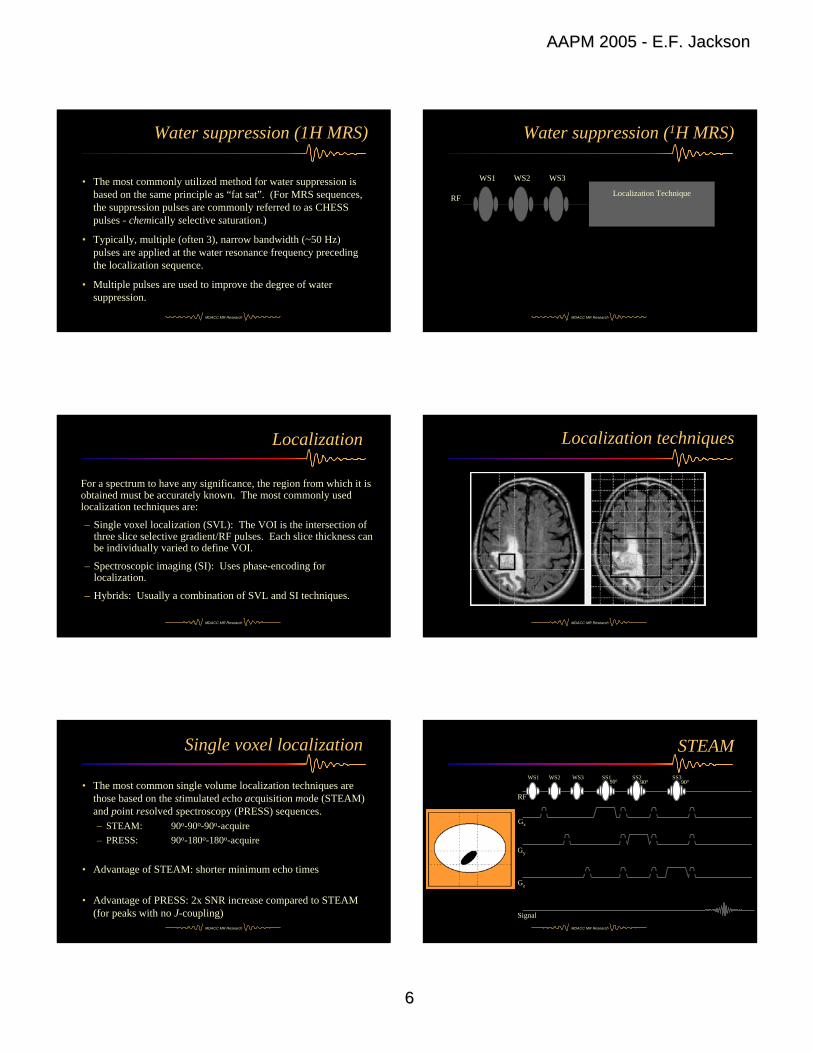
Water suppression (1H MRS)
• The metabolites of interest are usually about a factor of 8,000 less in concentration than water.
• A very efficient means of suppressing the water resonance is required in order to readily detect the metabolite resonances.
MDACC MR Research
1H MRS - Gastrocnemius muscle
Without H2O Suppression With H2O Suppression
AAPM 2005 AAPM 2005 -- E.F. JacksonE.F. Jackson
66
MDACC MR Research
• The most commonly utilized method for water suppression is based on the same principle as “fat sat”. (For MRS sequences, the suppression pulses are commonly referred to as CHESS pulses - chemically selective saturation.)
• Typically, multiple (often 3), narrow bandwidth (~50 Hz) pulses are applied at the water resonance frequency preceding the localization sequence.
• Multiple pulses are used to improve the degree of water suppression.
Water suppression (1H MRS)
MDACC MR Research
Water suppression (1H MRS)
Localization Technique
WS1 WS2 WS3
RF
MDACC MR Research
Localization
For a spectrum to have any significance, the region from which it is obtained must be accurately known. The most commonly used localization techniques are:
– Single voxel localization (SVL): The VOI is the intersection ofthree slice selective gradient/RF pulses. Each slice thickness can be individually varied to define VOI.
– Spectroscopic imaging (SI): Uses phase-encoding for localization.
– Hybrids: Usually a combination of SVL and SI techniques.
MDACC MR Research
Localization techniques
MDACC MR Research
Single voxel localization
• The most common single volume localization techniques are those based on the stimulated echo acquisition mode (STEAM) and point resolved spectroscopy (PRESS) sequences.– STEAM: 90o-90o-90o-acquire– PRESS: 90o-180o-180o-acquire
• Advantage of STEAM: shorter minimum echo times
• Advantage of PRESS: 2x SNR increase compared to STEAM (for peaks with no J-coupling)
MDACC MR Research
STEAMWS1 WS2 WS3
RF
SS1 SS2 SS3
Gx
Gy
Gz
Signal
900 900 900
AAPM 2005 AAPM 2005 -- E.F. JacksonE.F. Jackson
77
MDACC MR Research
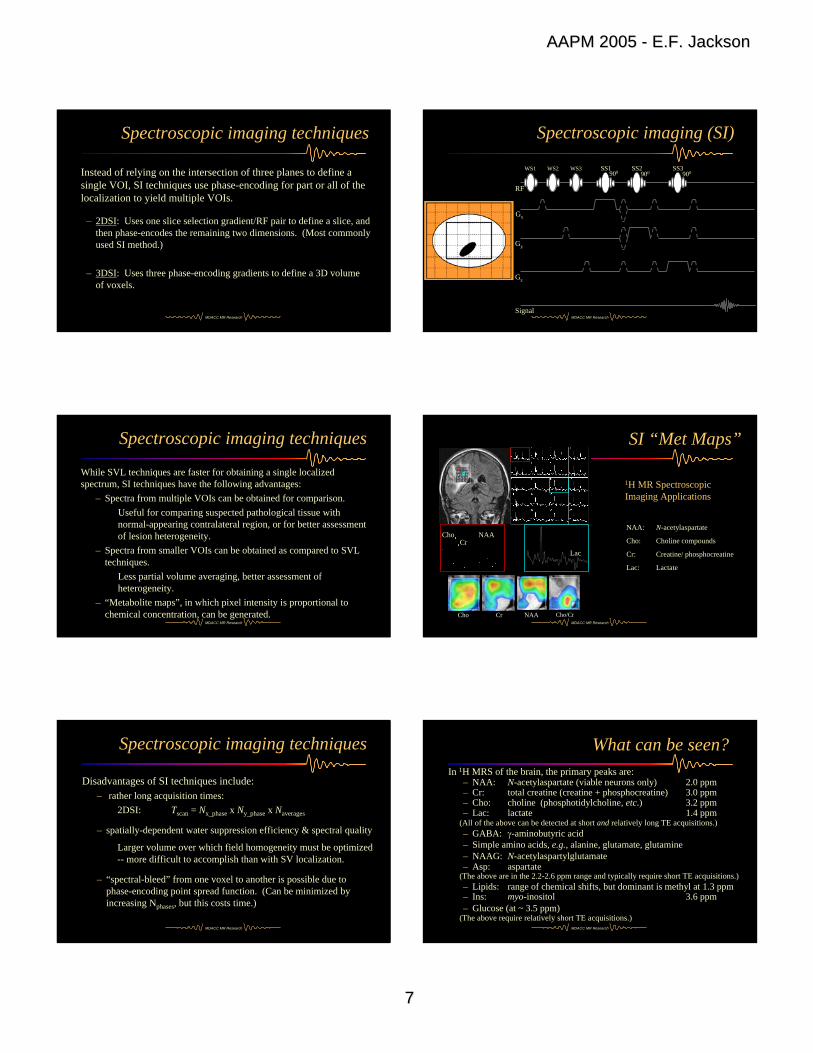
Spectroscopic imaging techniques
Instead of relying on the intersection of three planes to define a single VOI, SI techniques use phase-encoding for part or all of the localization to yield multiple VOIs.
– 2DSI: Uses one slice selection gradient/RF pair to define a slice, and then phase-encodes the remaining two dimensions. (Most commonly used SI method.)
– 3DSI: Uses three phase-encoding gradients to define a 3D volume of voxels.
MDACC MR Research
WS1 WS2 WS3
RF
SS1 SS2 SS3
Gx
Gy
Gz
Signal
900 900 900
Spectroscopic imaging (SI)
MDACC MR Research
Spectroscopic imaging techniques
While SVL techniques are faster for obtaining a single localizedspectrum, SI techniques have the following advantages:
– Spectra from multiple VOIs can be obtained for comparison. Useful for comparing suspected pathological tissue with normal-appearing contralateral region, or for better assessment of lesion heterogeneity.
– Spectra from smaller VOIs can be obtained as compared to SVL techniques.
Less partial volume averaging, better assessment of heterogeneity.
– “Metabolite maps”, in which pixel intensity is proportional to chemical concentration, can be generated.
MDACC MR Research
SI “Met Maps”
1H MR Spectroscopic Imaging Applications
NAA: N-acetylaspartate
Cho: Choline compounds
Cr: Creatine/ phosphocreatine
Lac: Lactate
Cho Cr NAA Cho/Cr
NAACr
Cho
Lac
MDACC MR Research
Spectroscopic imaging techniques
Disadvantages of SI techniques include:– rather long acquisition times:
2DSI: Tscan = Nx_phase x Ny_phase x Naverages
– spatially-dependent water suppression efficiency & spectral quality
Larger volume over which field homogeneity must be optimized -- more difficult to accomplish than with SV localization.
– “spectral-bleed” from one voxel to another is possible due to phase-encoding point spread function. (Can be minimized by increasing Nphases, but this costs time.)
MDACC MR Research
What can be seen?In 1H MRS of the brain, the primary peaks are:
– NAA: N-acetylaspartate (viable neurons only) 2.0 ppm– Cr: total creatine (creatine + phosphocreatine) 3.0 ppm– Cho: choline (phosphotidylcholine, etc.) 3.2 ppm– Lac: lactate 1.4 ppm
(All of the above can be detected at short and relatively long TE acquisitions.)– GABA: γ-aminobutyric acid– Simple amino acids, e.g., alanine, glutamate, glutamine– NAAG: N-acetylaspartylglutamate– Asp: aspartate
(The above are in the 2.2-2.6 ppm range and typically require short TE acquisitions.)– Lipids: range of chemical shifts, but dominant is methyl at 1.3 ppm– Ins: myo-inositol 3.6 ppm– Glucose (at ~ 3.5 ppm)
(The above require relatively short TE acquisitions.)

AAPM 2005 AAPM 2005 -- E.F. JacksonE.F. Jackson
88
MDACC MR Research
Short TE 1H MRS
NAA
CrPCr
ChoIns
CrGluGln
AspNAA
GABAGlu, Gln
LactateLipids
TE=20ms, TM=7.7ms, TR=3000ms - 2x2x2 cm VOIMDACC MR Research
Choice of echo time
• As you increase TE, the signal intensity from each metabolite decreases due to spin dephasing.
• Short TE: more spectral peaks means improved chances for lesion characterization or assessment of therapy. However, the examinations are more difficult to obtain reproducibly, mainly due to decreased water suppression efficiency.
• When comparing MRS data, the TE and TR values must be taken into account.
• Each metabolite has its own T1 and T2 relaxation times. Therefore, as you change TE and/or TR, the relative areas and amplitudes change for each peak. Peak or area ratios are also TE-dependent.
MDACC MR Research
TE=30ms TE=66ms
TE=136ms TE=272ms
Probe-PTR=1500ms64 averages
2:1620x15x15 mm3
Choice of echo time
MDACC MR Research
Spectral quantitation
Quantitative analysis:– Relative concentrations
• Most commonly involves taking the ratio of peak areas or amplitudes, e.g., NAA/Cr, Cho/Cr.
• Problem: Changes in ratios can be due to changes in, for example, NAA or Cr.
– Absolute concentrations• Much more difficult and requires some form of “standard”.• External standard: small container of known concentration of
reference sample from which reference spectrum is obtained.• Internal standard: most commonly taken as water.
MDACC MR Research
1H MRS - Glioma
MDACC MR Research
In Vivo 1H MRS
NAA Cho/CrGlioblastoma Multiforme
ChoCre
NAA

AAPM 2005 AAPM 2005 -- E.F. JacksonE.F. Jackson
99
MDACC MR Research
In Vivo 1H MRS
Cho/Cr Lipids
MDACC MR Research
Prostate 1H MRS
Kurhanewicz et al., JMRI 16:451, 2002
MDACC MR Research
Prostate 1H MRS
Chen et al., ISMRM 2005
3T, 0.15 cm3 voxels
1.5T, 0.30 cm3 voxels
MDACC MR Research
Breast 1H MRS
Bolan et al., MRM 50:1134, 2003
Invasive Ductal Carcinoma
MDACC MR Research
Breast 1H MRS
Bolan et al., MRM 52:1239, 2004
Frequency correction (cross-correlation) to compensate for respiratory motion.
MDACC MR Research
Breast 1H MRS
Jacobs et al., JMRI 21:23, 2005
AAPM 2005 AAPM 2005 -- E.F. JacksonE.F. Jackson
1010
MDACC MR Research
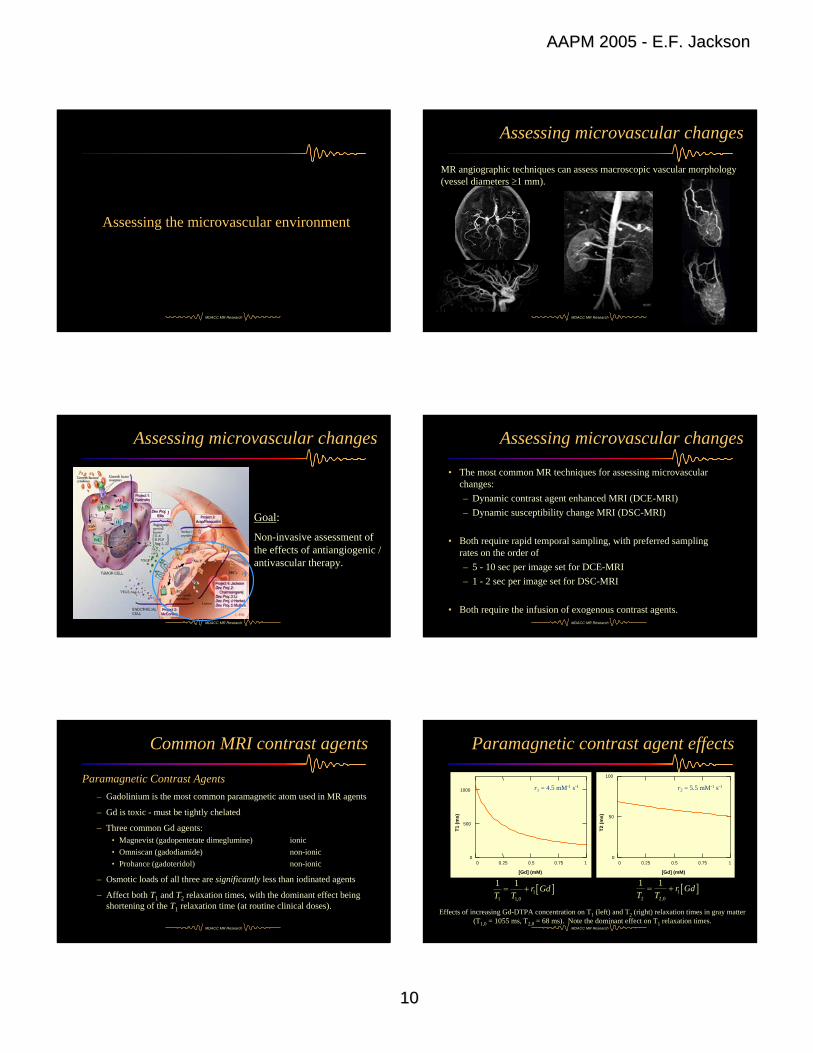
Assessing the microvascular environment
MDACC MR Research
MR angiographic techniques can assess macroscopic vascular morphology (vessel diameters ≥1 mm).
Assessing microvascular changes
MDACC MR Research
Assessing microvascular changes
1: Goal:
Non-invasive assessment of the effects of antiangiogenic / antivascular therapy.
MDACC MR Research
• The most common MR techniques for assessing microvascular changes:– Dynamic contrast agent enhanced MRI (DCE-MRI)– Dynamic susceptibility change MRI (DSC-MRI)
• Both require rapid temporal sampling, with preferred sampling rates on the order of– 5 - 10 sec per image set for DCE-MRI– 1 - 2 sec per image set for DSC-MRI
• Both require the infusion of exogenous contrast agents.
Assessing microvascular changes
MDACC MR Research
Paramagnetic Contrast Agents– Gadolinium is the most common paramagnetic atom used in MR agents
– Gd is toxic - must be tightly chelated
– Three common Gd agents:• Magnevist (gadopentetate dimeglumine) ionic• Omniscan (gadodiamide) non-ionic• Prohance (gadoteridol) non-ionic
– Osmotic loads of all three are significantly less than iodinated agents
– Affect both T1 and T2 relaxation times, with the dominant effect being shortening of the T1 relaxation time (at routine clinical doses).
Common MRI contrast agents
MDACC MR Research
Effects of increasing Gd-DTPA concentration on T1 (left) and T2 (right) relaxation times in gray matter (T1,0 = 1055 ms, T2,0 = 68 ms). Note the dominant effect on T1 relaxation times.
Paramagnetic contrast agent effects
0 0.25 0.5 0.75 10
500
1000
[Gd] (mM)
T1 (m
s)
0 0.25 0.5 0.75 10
50
100
[Gd] (mM)
T2 (m
s)
r2 = 5.5 mM-1 s-1r1 = 4.5 mM-1 s-1
[ ]11 1,0
1 1 r GdT T
= + [ ]12 2,0
1 1 r GdT T
= +

AAPM 2005 AAPM 2005 -- E.F. JacksonE.F. Jackson
1111
MDACC MR Research
Percent increase in contrast for gray matter as a function of Gd-DTPA concentration for a SE sequence with TR/TE = 400ms/18ms.
0 0.2 0.4 0.6 0.8 10
40
80
120
160
200
[Gd] (mM)
% In
crea
se in
Con
tras
t
Paramagnetic contrast agent effects
MDACC MR Research
DCE-MRI - Background
MDACC MR Research
DCE-MRI
MDACC MR Research
DCE-MRI
• DCE-MRI acquisitions typically are based on fast spoiled gradient-echo sequences (FSPGR, FLASH):– Spoiling maintains T1-weighting even with very short TRs– Trade-off between need for good temporal resolution and
adequate spatial coverage– Both 2D and 3D acquisition modes have been used
MDACC MR Research
PS1 > PS2 > PS3
PS1
PS2
PS3
DCE-MRI analysis
Two-Compartment Pharmacokinetic Model(Blood Volume Effects)
Two-Compartment Pharmacokinetic Model(Permeability or Extraction Flow Effects)
BV1
BV2
BV3
BV1 > BV2 > BV3
MDACC MR Research
DCE-MRI analysis
Choice of Analysis Methods:– Qualitative
• Visual examination of uptake curves
– Quantitative, but no physiological basis• Time to peak enhancement• Maximum uptake (maximum signal difference)• Maximum rate of uptake (maximum slope)• Area under the curve (AUC) and initial AUC
– Quantitative, with physiological basis• Pharmacokinetic modeling

AAPM 2005 AAPM 2005 -- E.F. JacksonE.F. Jackson
1212
Two Compartment Pharmacokinetic Model
CP = [Gd] in plasma (mM) = Cb / (1-Hct)CEES = [Gd] in extravascular, extracellular space (mM)
Ktrans = endothelial transfer coefficient (min-1) kep = reflux rate (min-1)
vP = fractional plasma volume, ve = fractional EES volumeStandardized parameters as proposed by Tofts et al., J Magn Reson Imaging, 10:223-232, 1999.
Ktrans
Plasma Flow
PlasmaCP, vP
EESCEES, ve
Endothelium
kep
( ')
0( ) ( ') 'ep
t k t ttransEES PC t K C t e dt− −= ∫CL(t) = vP CP(t) + CEES(t)
0 2 4 6 8 100
1
2
3
Time (min)
[GdD
TPA
] (m
M)
CP(t)
CL(t)
MDACC MR Research
Measured Measured
MDACC MR Research
Quantitative methods
Quantitative DCE-MRI data analysis– Primary model: two-compartment pharmacokinetic model
– Regimes:• Flow-limited (Kety model) - high permeability• Permeability surface area-limited - low permeability• Mixed model
– Measures:• Ktrans - endothelial transfer coefficient (min-1)• vP - fractional plasma volume• kep - reflux rate (min-1)
MDACC MR Research
Quantitative methods
• Flow-limited case:– Ktrans => EF --- the “extraction flow product”
• E = (1 - e-PS/F)• Most generally true for current FDA-approved small MW
agents!
• Permeability-limited case:– Ktrans => EF => PS
• Since E => PS / F• Typically true for contrast agents with MW > ~50 kD
MDACC MR Research
DCE-MRI T1W Image Plasma Volume Fraction Map Ktrans Map
DCE-MRI Guided Stereotactic Biopsy
DCE-MRI - Parametric mapping
MDACC MR Research
PTK787/ZD222584 – Liver Mets
J Clin Oncol, 21:3955-64, 2003
Phase I Trial26 patients
Metastatic liver lesions(Colorectal cancer)
MDACC MR Research
PTK787/ZD222584 – Liver Mets
MDACC MR Research J Clin Oncol, 21:3955-64, 2003

AAPM 2005 AAPM 2005 -- E.F. JacksonE.F. Jackson
1313
MDACC MR Research
PTK787/ZD222584 – Liver Mets
MDACC MR Research J Clin Oncol, 21:3955-64, 2003 MDACC MR Research
AG-013736 Trial (DCE-MRI and DCE-CT)
– Potent and selective inhibitor of VEGFR/PDGFR tyrosine kinases
– Preclinical activity in xenograft models (melanoma, colon, breast, and lung)
– Multicenter Phase I study in solid tumors (MDACC, University of Wisconsin, UCSF)
– Heterogeneous lesions (liver, lung, head & neck, …)
– Data analyses performed at VirtualScopics, LLC (Rochester, NY) and independently at MDACC
AG-013736 DCE-MRI Study
MDACC MR Research
AG-013736 DCE-MRI Study
McShane, Ashton, Jackson, et al., Proceedings of the ISMRM, p 154, 2004
Ktrans Data at Baseline (left) and Day 2 (right)
AG-013736 DCE-MRI Study
MDACC MR Research
N = 17
Liu et al., J Clin Oncol, in press.
MDACC MR Research
DSC-MRI techniques
• Dynamic susceptibility change (DSC) MRI techniques have also been used to assess changes in regional blood flow.
• DSC-MRI uses T2- or T2*-weighted, high speed imaging techniques, e.g., echo-planar imaging.
MDACC MR Research
DSC-MRI principles
0.2 mmol/kg gadodiamide bolus infusion at 5 cc/sec
SE-EPITE/TR = 80/1700 ms30 cm FOV, 128x128 matrix125 kHz, 5 mm slice, 1.5 mm gap65 phases, 1:52 min

AAPM 2005 AAPM 2005 -- E.F. JacksonE.F. Jackson
1414
MDACC MR Research
DSC-MRI
EPI Source Image
rCBV Map
150.0
200.0
250.0
300.0
350.0
0.0 20.0 40.0 60.0 80.0 100.0 120.0
Time (s)
Sign
al In
tens
ity (A
rb. U
nits
)Inject
-2.00
0.00
2.00
4.00
6.00
8.00
0.0 20.0 40.0 60.0 80.0 100.0 120.0
Time (s)
∆R
2* (A
rb. U
nits
)
∆R2* = -1/TE ln[S(t)/S(0)]
Extract S(t)*2
0
( )rCBV R t dtτ
= ∆∫
*2
0
*2
0
( )
( )
R t dtrMTT
R t dt
τ
τ
τ ∆=
∆
∫
∫
rCBVrCBFrMTT
=
MDACC MR Research
DSC-MRI
SE-EPI Source Images rCBV Maps
MDACC MR Research
DSC-MRI
T1-weighted Post-Gd Computed rCBV Maps
MDACC MR Research
Other MR techniques to assess microvascular changes
• There are MR-based techniques for assessing changes in regional blood flow and/or volume.
• Arterial spin labeling (ASL) techniques do not require administration of exogenous contrast agents.– Are low SNR techniques, thus 3T systems will be beneficial.– Are associated with high specific absorption rates (SAR).– Are not yet commercially available.
Direction of Arterial Flow
Imaging Plane
Labeling Plane
MDACC MR Research
Assessing areas of neuronal activation
MDACC MR Research
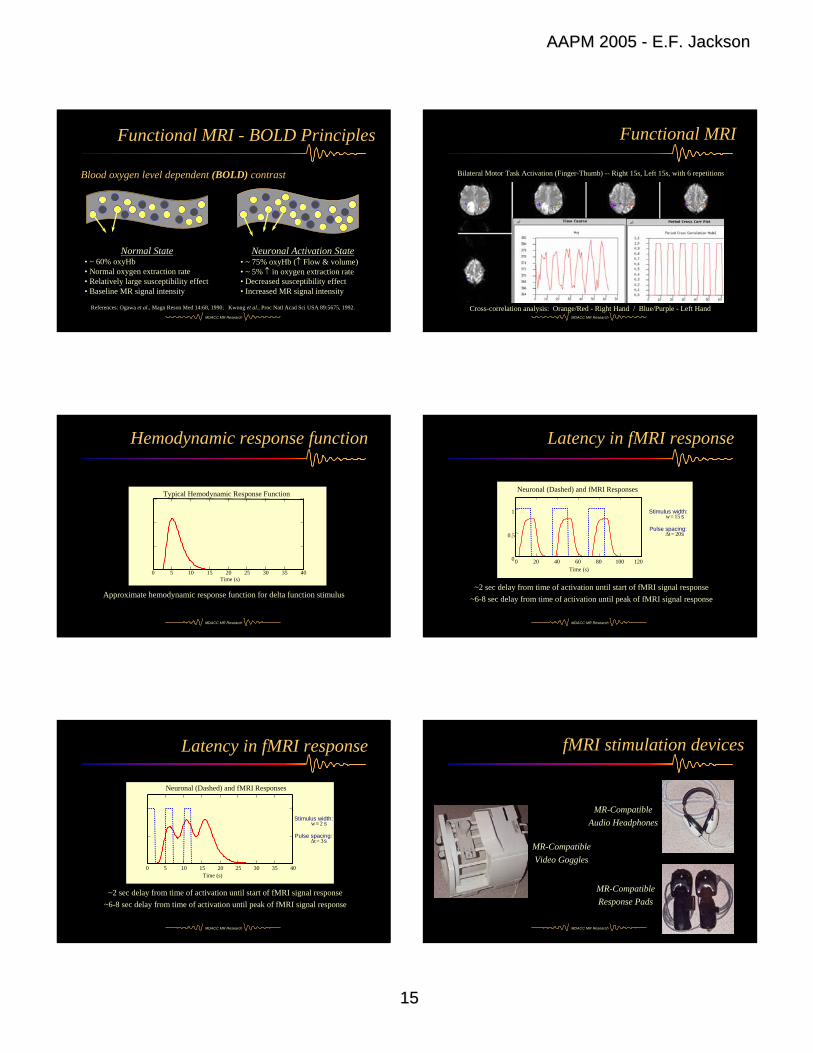
Blood oxygen level dependent (BOLD) contrast• Principle: Uses the difference in the magnetic state of
oxyhemoglobin (diamagnetic) vs deoxyhemoglobin (paramagnetic) to provide image contrast.
• Advantage: Totally noninvasive. Requires no infusion.
• Disadvantage: Much smaller change in signal intensity compared to bolus injection technique (~1-5% changes at 1.5T).
References: Ogawa et al., Magn Reson Med 14:68, 1990; Kwong et al., Proc Natl Acad Sci USA 89:5675, 1992.
BOLD functional MRI - Principles
AAPM 2005 AAPM 2005 -- E.F. JacksonE.F. Jackson
1515
MDACC MR Research
Blood oxygen level dependent (BOLD) contrast
Functional MRI - BOLD Principles
Normal State• ~ 60% oxyHb• Normal oxygen extraction rate• Relatively large susceptibility effect• Baseline MR signal intensity
Neuronal Activation State• ~ 75% oxyHb (↑ Flow & volume)• ~ 5% ↑ in oxygen extraction rate • Decreased susceptibility effect• Increased MR signal intensity
References: Ogawa et al., Magn Reson Med 14:68, 1990; Kwong et al., Proc Natl Acad Sci USA 89:5675, 1992.MDACC MR Research
Functional MRI
Cross-correlation analysis: Orange/Red - Right Hand / Blue/Purple - Left Hand
Bilateral Motor Task Activation (Finger-Thumb) -- Right 15s, Left 15s, with 6 repetitions
MDACC MR Research
Hemodynamic response function
Approximate hemodynamic response function for delta function stimulus
0 5 10 15 20 25 30 35 40
Typical Hemodynamic Response Function
Time (s)
MDACC MR Research
Latency in fMRI response
~2 sec delay from time of activation until start of fMRI signal response~6-8 sec delay from time of activation until peak of fMRI signal response
0 20 40 60 80 100 1200
0.5
1
Neuronal (Dashed) and fMRI Responses
Time (s)
Stimulus width:=w 15 s
Pulse spacing:=∆t 20s
MDACC MR Research
0 5 10 15 20 25 30 35 40
1
Neuronal (Dashed) and fMRI Responses
Time (s)
Stimulus width:=w 2 s
Pulse spacing:=∆t 3s
~2 sec delay from time of activation until start of fMRI signal response~6-8 sec delay from time of activation until peak of fMRI signal response
Latency in fMRI response
MDACC MR Research
fMRI stimulation devices
MR-CompatibleVideo Goggles
MR-CompatibleAudio Headphones
MR-CompatibleResponse Pads
AAPM 2005 AAPM 2005 -- E.F. JacksonE.F. Jackson
1616
MDACC MR Research
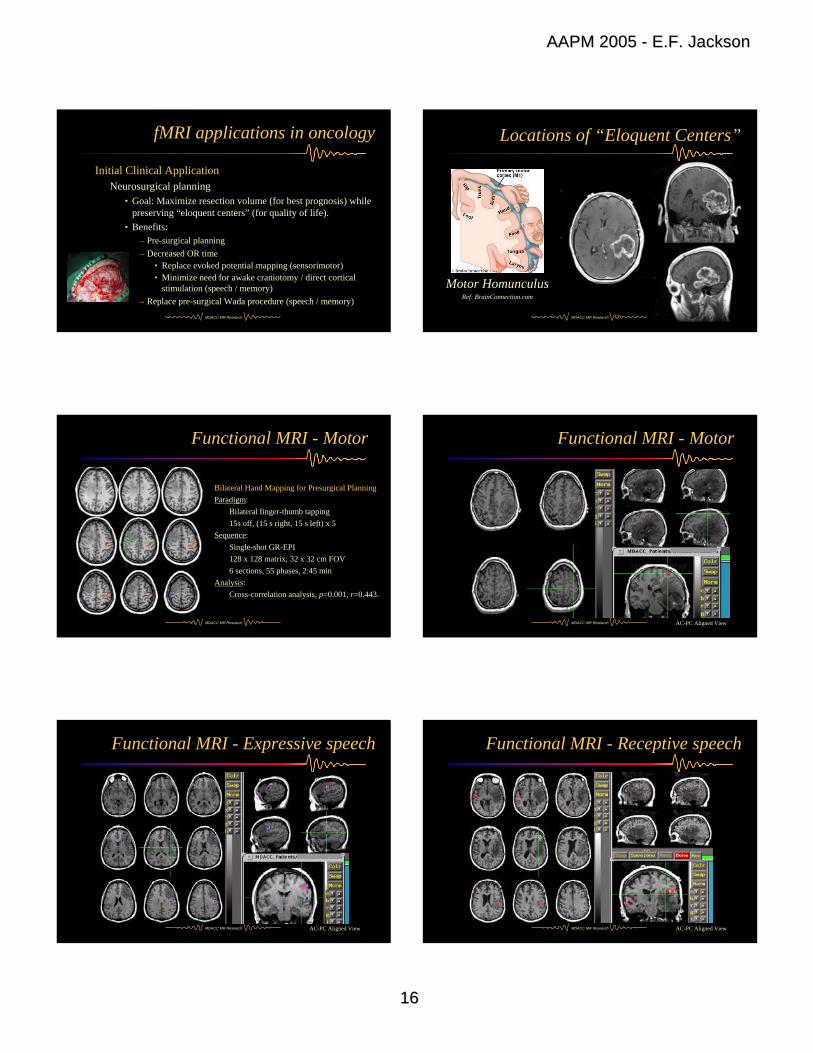
fMRI applications in oncology
Initial Clinical ApplicationNeurosurgical planning
• Goal: Maximize resection volume (for best prognosis) while preserving “eloquent centers” (for quality of life).
• Benefits:– Pre-surgical planning– Decreased OR time
• Replace evoked potential mapping (sensorimotor)• Minimize need for awake craniotomy / direct cortical
stimulation (speech / memory)– Replace pre-surgical Wada procedure (speech / memory)
MDACC MR Research
Locations of “Eloquent Centers”
Motor HomunculusRef: BrainConnection.com
MDACC MR Research
Functional MRI - Motor
Bilateral Hand Mapping for Presurgical PlanningParadigm:
Bilateral finger-thumb tapping15s off, (15 s right, 15 s left) x 5
Sequence:Single-shot GR-EPI128 x 128 matrix, 32 x 32 cm FOV6 sections, 55 phases, 2:45 min
Analysis:Cross-correlation analysis, p=0.001, r=0.443.
MDACC MR Research AC-PC Aligned View
Functional MRI - Motor
MDACC MR Research
Functional MRI - Expressive speech
AC-PC Aligned View MDACC MR Research
Functional MRI - Receptive speech
AC-PC Aligned View

AAPM 2005 AAPM 2005 -- E.F. JacksonE.F. Jackson
1717
MDACC MR Research
3D Display and Surface Vascular Mapping (3T Data)
Motor Mapping
Receptive Speech
Mapping
fMRI and surgical planning
http://www.stealthstation.com
MDACC MR Research
Evolution of MRIAnatomic
MDACC MR Research
Evolution of MRIAnatomic Angiographic
MDACC MR Research
Evolution of MRIAnatomic Angiographic
MDACC MR Research
Evolution of MRIAnatomic Angiographic Physiologic
T1-weighted Post-Gd Computed rCBV Maps
Blood Volume and Flow
AAPM 2005 AAPM 2005 -- E.F. JacksonE.F. Jackson
1818
MDACC MR Research
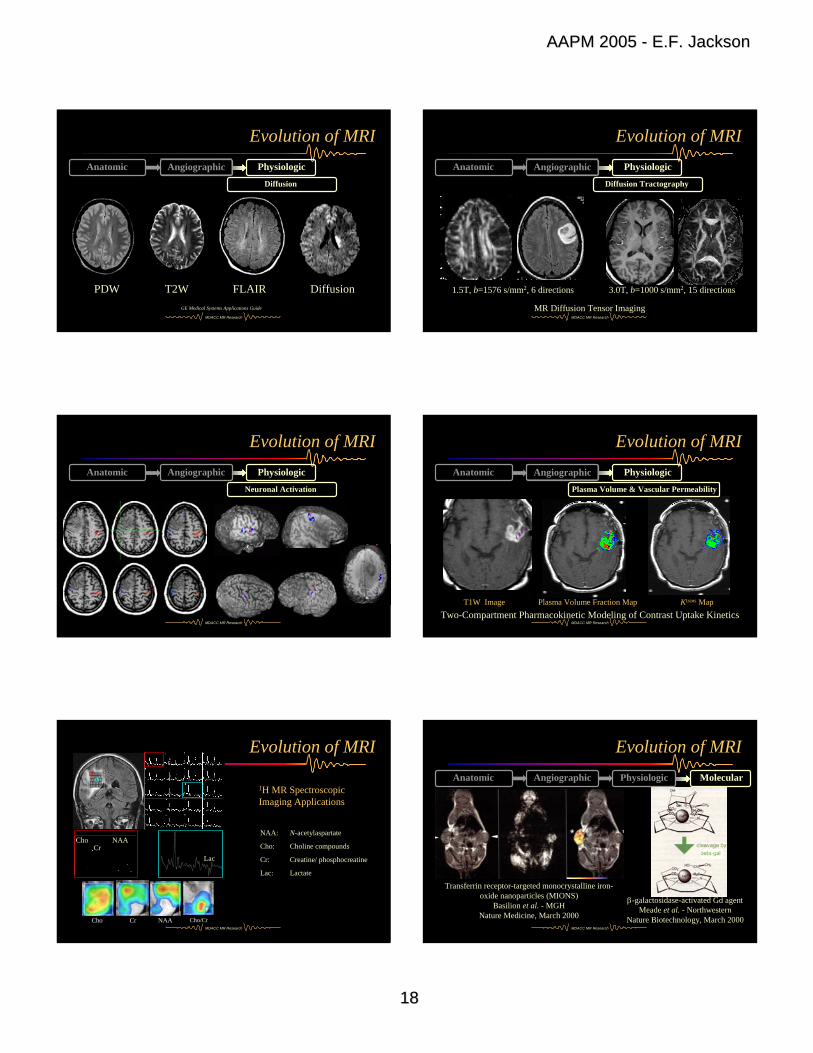
Evolution of MRIAnatomic Angiographic Physiologic
PDW T2W FLAIR Diffusion
Diffusion
GE Medical Systems Applications Guide
MDACC MR Research
Evolution of MRIAnatomic Angiographic Physiologic
MR Diffusion Tensor Imaging
Diffusion Tractography
1.5T, b=1576 s/mm2, 6 directions 3.0T, b=1000 s/mm2, 15 directions
MDACC MR Research
Evolution of MRIAnatomic Angiographic Physiologic
Neuronal Activation
MDACC MR Research
Evolution of MRIAnatomic Angiographic Physiologic
T1W Image Plasma Volume Fraction Map Ktrans MapTwo-Compartment Pharmacokinetic Modeling of Contrast Uptake Kinetics
Plasma Volume & Vascular Permeability
MDACC MR Research
Evolution of MRI
1H MR Spectroscopic Imaging Applications
NAA: N-acetylaspartate
Cho: Choline compounds
Cr: Creatine/ phosphocreatine
Lac: Lactate
Cho Cr NAA Cho/Cr
NAACr
Cho
Lac
MDACC MR Research
Evolution of MRIMolecularAnatomic Angiographic Physiologic
Transferrin receptor-targeted monocrystalline iron-oxide nanoparticles (MIONS)
Basilion et al. - MGHNature Medicine, March 2000
β-galactosidase-activated Gd agentMeade et al. - Northwestern
Nature Biotechnology, March 2000

AAPM 2005 AAPM 2005 -- E.F. JacksonE.F. Jackson
1919
MDACC MR Research
Acknowledgments• Srikanth Mahankali, M.D.• Krista McAlee, R.T., Michelle Garcia, R.T., Tim Evans, R.T.• MDACC U54 Project & Developmental Project Collaborators• Christina A. Meyers, Ph.D., Jeffrey Wefel, Ph.D., and Anne Kayl,
Ph.D. - Neuropsychology• MDACC Neurosurgery Faculty and Brian K. Law• Qing Yuan, Ph.D.• Theodore R. Steger, III, Ph.D.• Chaan Ng, M.D.• X. Joe Zhou, Ph.D., and Rebecca Milman-Marsh, M.S.