Embed Size (px)
Citation preview

INTRODUCTION TO
ENVIRONMENTAL
STUDIES
Part II
Part I already covered by
Civil Engg. Faculty

CE-102 Civil Engineering Department
Lectures: 3/week ; 21 total ; 3 credits
Evaluation : 50 marks
MTE : 40 marks
CW : 10
Tutorial, Assignments, Regularity in class
Soft copy of lectures

S.
No.
Name of Books/Author(s)/Publisher Year of
Publ.
1 Introduction to Environmental
Engineering, M.L. Davis and D.A.
Cornwell, McGraw Hill, New York 3/e
1998
2 Introduction to Environmental
Engineering and Science, G.M. Masters,
Prentice Hall of India, New Delhi. 2/e
1998
3 Environmental Engineering, H.S. Peavy,
D.R. Rowe and G. Tchobanoglous,
McGraw Hill, New York
1986
Suggested Books

Why environmental studies?
Intergovernmental Penal on Climate Change (IPCC), 1988
– 31st August 2013: 25 years
– UNEP and WMO of United Nations Organization
Substantial changes are happening to our environment
Air, water and soil being affected
2007 Nobel Peace Prize: IPCC
R.K. Pachauri and Al Gore
US Environmental Protection Agency (USEPA)
Central Pollution Control Board, New Delhi
State Pollution Control Boards
Ministry of Environment and Forests, New Delhi

Five elements
1. Water, जल2. Air, वाय3. Earth, पथवी4. Space, आकाश5. Fire, अगनि

Water
1. All the living systems need water and contain
water
2. Life on earth is due to water, 70% water cover
3. God of water, इनदर (Indra)
4. Ganga water, (Shelf life: long); BOD/COD
5. Water pollution
Coca cola, Pepsi-CSE, New Delhi : Lindane, DDT etc.
Effluents from industries and agrichemicals (Punjab hub of cancer
patients)
Ganga and Yamuna rivers
Ground water, lakes, sea water is contaminated, treatment strategies of
treatment already dealt with in first half of syllabus

Air1. Air needed by all the living systems
2. Without air no survival
3. God of air, वाय (Vayu), Prāna
4. Pranayam : oxygen transfer rate
5. 78.08% Nitrogen and 20.95% Oxygen + other gases
6. Combustion: CO2, NOx, SOx, SPM, RSPM, Hg,
arsenic, HCs, VOCs etc.
Paper industry: Dioxins 100 times lethal than cyanide
Carbon dioxide: 400 ppm (May 2, 2013)
280 ppm (1750)
Greenhouse gases: CO2, N2O, H2O, O3, CH4, CFCs

Earth
1. We eat which is grown on earth
2. Photosynthesis process: biomass
3. Goddess of earth, पथवी, Prithvi
4. Soil is getting contaminated
Pollution air/water
Mango trees near Roorkee: no fruits
Micronutrients in herbs: much lower
Sustainability ? Recent Uttarakhand
tragedy-परलय (Havoc)

Space
1. Solar energy
2. Photosynthesis process
3. Solar energy into biomass and other forms of
energy: hydro, coal, petroleum, wind etc.
4. God of space, आकाश, Aakash
5. O3 depletion: CFCs and space shuttles,
rockets etc. , UV radiations: human skin,
cataract, plant kingdom damages, buildings ?

Fire
1. Combustion
2. Carbon and Hydrogen
3. CI and SI engines, cooking, thermal power plants: steam and gas turbines, steam engine
4. Goddess of fire, अगनि , Agni
5. Because of fire air pollution
6. Every thing is getting into CO2 and H2O which are converted back by photosynthesis process to complex biomass species and the process goes on …..goes on…..

Environment
1.Atmosphere: layer of air that surrounds
our planet
2.Hydrosphere: liquid envelop that
surrounds our planet
3.Lithosphere: solid earth, including earth’s
crust and part of the upper mantle
4.Biosphere: living organisms that inhabit the
above spheres

• Atmosphere…air to breathe
• Hydrosphere …water to drink
• Lithosphere …food to eat
• Biosphere …food to eat
Minutes
without air
Days w/o
water
Months w/o food
Environment
Resources: fossil fuels,
ores, uranium, thorium

Environment

Atmosphere
Constant components (fix over time and location)
Nitrogen 78.08%
Oxygen 20.95%
Argon 0.93%
Neon, Helium, Krypton 0.0001%
Age of earth : 4.6 Billion year
Oxygen : 0% 2 Billion years ago
Total mass of atmosphere: 5*1015 Tonne
:1/1,200,000 of earth

Atmosphere
Variable components (variable with time and
location)
Carbon dioxide 0.04%
Water vapor 0-4%
Methane traces
Sulfur dioxide traces
Ozone traces
Nitrogen oxides traces
Others: dust, volcanic ash, snow and rain

Layers of the Earth's atmosphere

Atmospheric temperature: vertical structure

Vertical structure of atmospheric pressure

Atmosphere zones
The zones are not sharply delineated
and their elevation varies with both
time of year and latitude

Troposphere1.Thickness from sea level: 18 km; Everest
8848 m
2.Pressure at top is 10% of atmosphere 76
mm of Hg
3.Air movement is vertical as well horizontal
4.Weather/clouds formation/rains
5.Air cools progressively with height
6.Temperature: -6.5 oC/km
next

Tropopause
1.Thin layer between troposphere and
stratosphere: 4 km
2.Air is completely dry
3.The elevation where the temperature
no longer decreases with altitude
next

Stratosphere
1.This extends up to 50 km and comprises
of ozone
2.Ozone is 2-8 ppm
3.In the middle and upper stratosphere,
air temperature increases progressively
with height
4.Heated by ozone
next

Stratopause
The elevation where the temperature no
longer increases with altitude

Mesosphere
1.Mesosphere is from 50 to 90 km
2.Temperature again decreases here
3.Intermediate zone between stratosphere
and thermosphere
4.Air cools progressively with elevation

Mesopause
The elevation above the mesosphere where
the temperature no longer cools with altitude

Ionosphere
1.Next is thermosphere or ionosphere
extending to 350 km
2. Oxygen is in ionic form heat is absorbed
3. Temperate rises again

Outer limit of atmosphere
1. Difficult to define
2. At 32,000 km, the Earth’s gravitation pull equals
centrifugal force of the Earth’s rotation

Ozone measurementDeveloped by G.M.B. Dobson, 1920s; Professor at Oxford University
1 DU = 0.01 mm thickness of ozone at oC and 1 atm (STP)
US sky : 300 DU
Minimum at Antarctica : 200 DU
Dobson Ozone Spectrophotometer
Total ozone mapping spectrometer (TOMS)
Ozone holes: when concentration of ozone reduces more than 50%
Antarctica: 25 million km2 in 2001
All the ozone over a certain
area is compressed to oC
and 1 atm and forms a 3 mm
thick slab corresponding to
300 DU

Antarctic ozone
Total Ozone Mapping Spectrometer

Hydrosphere
1. 70.8% earth’s surface is covered by water
2. 60-70% of living world
3. Physiological reactions in aqueous phase
4. Total quantum of water : 1.4 B km3
5. Salty sea water : 97.6%
6. Fresh water : 2.4%
7. Renewable in nature next
8. Important food source
9. Easily polluted
10. Must be treated (already dealt in I part)
11. Major industrial and agriculture input

Rain harvesting

Distribution of fresh water
Location % of total Snow, ice, glaciers 86.9
Accessible ground water 12.0
Lakes, reservoirs, ponds 0.37
Saline lakes 0.31
Soil moisture 0.19
Moisture in living organisms 0.19
Atmosphere 0.039
Wetlands 0.011
Rivers, streams, canals 0.0051

Freshwater as a resource in India
Renewable through evaporation from
the seas and precipitation (solar powered)
Demands for freshwater include:
Agriculture & livestock (79.6%)
Power generation (13.6%)
Domestic(3.5%)
Industry (3.3%)
Demands increase with increasing population
Unequal distribution of freshwater
Interlinking of rivers: solution of water problem

Lithosphere

Lithosphere
1.Land area: 26%
2.Supports all the living systems and provides
a wealth of raw materials which has made
the civilization to develop

Lithosphere: India
2.4% of world’s land
15% of world’s population
Per capita land availability, ha
Russia 8.43
USA 7.39
Australia 6.60
China 0.98
India 0.48

Lithosphere: India
Land use categories, Mha
Cultivable land 142 (46%)
Forest land 67 (22%)
Nonagricultural land 20 (6.5%)
Barren and pasture land 55 (17.8%)
Fallow land 25 (8.0%)
Mineral exploration
Rich in coal, crude, bauxite, copper, gold,
nickel, uranium, thorium etc.

Lithosphere: India
Food resource
Self sufficient in agriculture produce
I in world in sugar production
I in milk production, 97 million tonnes
Live stock, 25% of world
Forest resource
21.68 % forest cover
reduction in global warming

What is Ecology?
Study of interactions between organismsand their environment.
Ernst Haeckel – coined term
Ecology in 1866
Greek word οἶκος, "house"; λογία,
study of

Levels of Organization Ecologists study
organisms ranging from the various levels of organization:
– Species/individuals
– Population
– Community
– Ecosystem
– Biome
– Biosphere

Species
Group of similar organisms that can breed and produce fertile offspring

group of organisms, all of the same species, which interbreed and live in the same area.
Population

Community an assemblage of different populations that live
together

Ecosystem
Collection of organisms that live in a place with the nonliving environment

Biome Group of ecosystems with the same climate and
dominant communities
Tropical rain forest
Tropical dry forest
Tropical savanna Temperate woodland
and shrubland
Desert
Temperate grassland
Boreal forest
(Taiga)
Northwestern
coniferous forest
Temperate forest
Mountains and
ice caps
Tundra

Organization Hierarchy

Characteristics of ecosystems
• All ecosystems have a constant source of
energy ( sun)
• Cycles to reuse raw materials
Water, nitrogen, carbon, phosphorus cycles
An ecosystem comprises of the biotic or living
( viz. plants and animals)
and the abiotic or non-living components
( viz. air, water, minerals, soil)

Autotrophs vs. Heterotrophs
Autotrophs – make
their own food so
they are called
PRODUCERS
Heterotrophs – get
their food from
another source so
they are called
CONSUMERS

Main forms of energy for autotrophs
Sunlight
– The main source of energy for
life on earth
– Photosynthesis: leaf a chemical
reactor
Chemical
– Inorganic compounds
– Chemosynthesis : opium,
ginseng, garlic (selenium)

Types of ConsumersHerbivores- only eat plants Carnivores - only eat meat Omnivores
Eat plants and meat
Detritivores and
Decomposers
Feed on plant and animal
remains
wildebeest

Decomposers /detritivores
Polythene/plastics: no decomposition; banning of PB by States,
Uttarakhand, Choking of sewer lines; agriculture sector: moisture,
nitrogen fixation, Spills of crude in oceans.
Vultures vanished from India, Pakistan (DDT - cow/buffalos)

Energy flow through an ecosystem
Energy flows through
an ecosystem in ONE
direction,
– Sun
– Autotrophs
– Heterotrophs
Synthetic fertilizers: N, P, K

Energy flow in ecosystems


Energy flow in ecosystems
Photosynthesis
6CO2 + 6H2O + energy → C6H12O6 + 6O2
Respiration
Stored energy is released in the reverse reaction
C6H12O6 + 6O2 → 6CO2 + 6H2O + energy
Released energy is available to drive other reactions,
e.g. cell metabolism and growth
I. C. engines/combustion processes same reaction
Difference: temperature

Feeding relationships
Food Chain – steps of organisms transferring energy by eating & being eaten
Food Web – network
of all the food chains in
an ecosystem

Food web

Ecological pyramids
Energy Pyramid
Biomass Pyramid
Number Pyramid
Trophic Level – each step in a food chain or food web


Trophic levels

Trophic levels

Why are nutrients important ?
95% of our body is made of…
1) OXYGEN
2) CARBON
3) HYDROGEN
4) NITROGEN
Every living organism needs nutrients to build tissues and carry out essential life functions.

Availability of nutrients
If a nutrient is in short supply, it will limit
organisms growth. It is called a limiting
nutrient and is in accordance of Leibig’s Law
When a limiting nutrient is dumped into a lake
or pond, an algal bloom occurs and this can
disrupt the ecosystem

Matter movement through an ecosystem
Unlike the one way flow of energy, matter is recycledwithin & between ecosystems
Nutrients are passed between
organisms & the environment through biogeochemical cycles
Biogeochemical Cycles
– Bio –life
– Geo – Earth
– Chemi – chemical
1. WATER CYCLE
2. NUTRIENT CYCLES
a) CARBON CYCLE
b) NITROGEN CYCLE
c) PHOSPHORUSCYCLE

WATER CYCLE

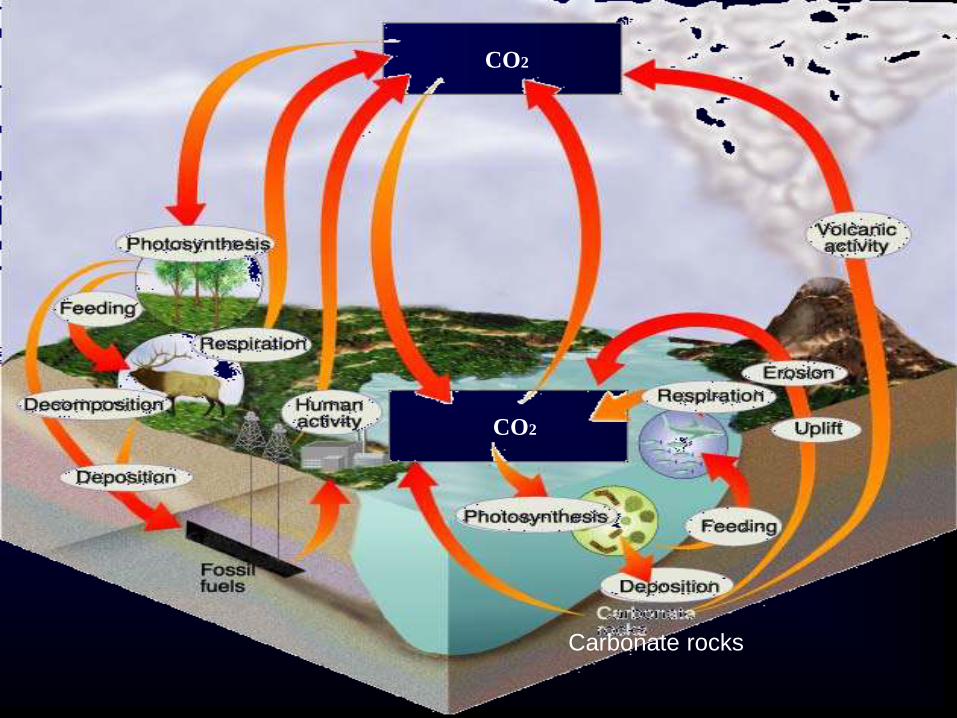
CARBON CYCLE
4 PROCESSES MOVE
CARBON THROUGH
ITS CYCLE:
1) Biological
2) Geochemical
3) Mixed biochemical
4) Human Activity
CO2
CO2
CO2
CO2
Carbonate rocks

GLOBAL CARBON CYCLE(All values are in Billion Metric Tons Carbon)

NITROGEN CYCLE
Nitrogen-containing nutrients in
the biosphere include:
1) Ammonia (NH3)
2) Nitrate (NO3-)
3) Nitrite (NO2-)
ORGANISMS NEED
NITROGEN TO MAKE
AMINO ACIDS FOR
BUILDING PROTEINS!!!
N2
in Atmosphere
NH3
N03- &
N02-

N2
in Atmosphere
NH3
N03- &
N02-
Haber process: 1918
Nobel Prize

PHOSPHORUS CYCLEPHOSPHORUS FORMS PART OF IMPORTANT LIFE-SUSTAINING
MOLECULES (ex. DNA & RNA)
Cold drinks; pH: 3
phosphoric acid
Phosphatic
fertilizers

Natural succession
Well Balanced Ecosystem changes over time
Lake Shallow Lake (deposition of Silt)
Marsh Meadow Hardwood Forest
Takes place long period of time and not
visible in human lifespan
Can be affected by human activities such as
pollution

ACCUMULATION OF POLLUTANTS IN ENVIRONMENT
1.Conservative Pollutants:
Pesticides, polychlorinated biphenyls (PCBs),
polynuclear aromatic hydrocarbons (PAHs),
cynide, selenium etc.
heavy metals (mercury, copper, cadmium,
chromium, lead, nickel, zinc, tin etc. )
2. Nonconservative pollutants:
biodegradable organics, human waste,
animal waste

ACCUMULATION OF POLLUTANTS
Bioaccumulation/Bioconcentrationincrease in concentration of a pollutant
from the environment to the first
organism in a food chain: a pesticide in a crop
Biomagnificationincrease in concentration of a
pollutant from one link in a
food chain to another: a pesticide in a crop
Conditions: long life
soluble in fats: animal life/human life
biologically active
chicken
human

Biomagnification
Case study: Long Island Estuary, New York, USA
Levels of DDT, 1967 study, EPA
water to zooplankton 800x
zooplankton to fish #131x
fish #1 to fish #2 1.7x
fish #2 to gull4.8x
Overall202,368x

The level at which a given substance is bioaccumulated depends on : The rate of uptake
The mode of uptake (through the gills of a fish, ingested
along with food, contact with epidermis (skin) etc. …)
How quickly the substance is eliminated from the organism,
transformation of the substance by metabolic processes, the
lipid (fat) content of the organism, the hydrophobicity of the
substance, environmental factors etc.
Biomagnification

Conservative pollutants:
Biomagnification Biomagnification is the
bioaccumulation of a substance up the food chain by transfer of residues of the substance in smaller organisms that are food for larger organisms in the chain.
Sequence of processes that results in higher concentrations in organisms at higher levels in the food chain (at higher trophic levels).
These processes result in an organism having higher concentrations of a substance than is present in the organism’s food.

Biomagnification
When partitioning concentrates a chemical in one
phase that is the food for a higher phase, the chemical
can further concentrate as we move up the food chain

Bioconcentration / Bioaccumulation
Bioconcentration of a substance is correlated to the octanol-
water partitioning coefficient (or Haunsch partitioning
Coefficient) KOW of the substance.
The octanol/water partition coefficient (KOW) is defined as
the ratio of a chemical's concentration in the octanol phase
to its concentration in the aqueous phase of a two-phase
octanol/water system.
KOW = Concentration in octanol phase / Concentration in
aqueous phase.
Values of KOW can be considered to have some meaning in
themselves, since they represent the tendency of the
chemical to partition itself between an organic phase (e.g., a
fish) and an aqueous phase.

Bioconcentration / Bioaccumulation
Chemicals with low KOW values (e.g., less than 10) may
be considered relatively hydrophilic; they tend to have
high water solubilities, small soil/sediment adsorption
coefficients, and small bioconcentration factors for
aquatic life.
Conversely, chemicals with high KOW values (e.g., greater
than 104) are very hydrophobic.

Bioconcentration / Bioaccumulation
Bioconcentration factor (BCF) is the concentration of a
particular chemical in a tissue per concentration of
chemical in water (reported as l/kg). This physical
property characterizes the accumulation of pollutants
through chemical partitioning from the aqueous phase
into an organic phase, such as fish.
BCF = [Concentration of X in Organism, mg/kg ] /
[Concentration of X in Environment, mg/l]
High potential BCF>1000; Moderate Potential
1000>BCF>250; Low potential 250>BCF.
BCF is also related to the Haunsch Partition Coefficient
by
log BCF = 0.79 x log KOW - 0.4

Example
Hexachlorobenzene (HCB) has a water to
plankton partition coefficient of 200,000; a
plankton to smelt (fish) magnification factor of
7.5; and a smelt to lake trout magification factor
of 3.5. If the concentration of HCB in the water
is 1.0 ppt, will either fish exceed the fish
consumption standards:
5 ppm for general consumption
1 ppm for pregnant and nursing women

Solution
kg
mg2.0
kg
ng10 x 2
L
ng1
kg
L10 x 2 55
plankton
water
plankton
p/w
C
C
CK
kg
mg5.1
kg
mg2.05.75.7 planktonsmelt
CC
kg
mg25.5
kg
mg5.15.35.3 smelttrout
CC

Interpretation
The lake trout exceed the general
consumption standard and both species
exceed the standard for pregnant and
nursing women
Both could easily argued on the basis of
uncertainty

PCB
PCB (Polychlorinated Biphenyls): Insulating materials in transformers: impair thyroid functions and neurotoxins.
General Electric Released during 1947-1977 in Hudson River, 300 km of Hudson River polluted
Concentrated in bottom sediments—Consumed by riverbed microorganisms-eaten by fish 2 ppm conc.
Contaminated sediments are removed, extensive dredging & proper disposed off

Dichloro Diphenyl Trichloroethne (DDT)
Half life 15 years
Year Amount Remaining
0 100 kg
15 50 kg
30 25 kg
45 12.5 kg
60 6.25 kg
75 3.13 kg
90 1.56 kg
105 0.78 kg
120 0.39 kg

DDT Dichloro-Diphenyl-Trichloroethne
Used for malaria control and to protect crops from insects
Biomagnification, not very toxic to human but adverse impact of egg hatching by birds.
Banned in 1972 and many bird population have recovered.
In India thousands of tons of DDT was used to control malarial mosquitoes between 1995 and 1996.
Large numbers of vultures dying and have high levels of DDT in their carcasses.
Vultures are at the same level of the food chain as humans and serve as sentinels warning of greater pesticide hazards through indirect effects unless there is a change in the Indian government's pesticide policy.

Birds provide a valuable service to growers and to the public through controlling insects.
In 1950 Chinese officials grew concerned that flocks of birds were allegedly devouring large amounts of grain.
Citizens killed over 800,000 sparrow birds. As a consequence there were major outbreaks of insect pests.
Realizing their mistake the leaders changed course and removed small birds from the list of scourges.
It is difficult to know precisely how the killing of birds by pesticides relates to pest insect populations. However, the estimated bird losses due to pesticides 67 million per year, far exceeds the 800,000 bird deaths in China that resulted in greater insect numbers.

EnvironmentIf gases concentration Increase
by our activities , What happens
to our Ecosystem ???
If we add heavy metals, What
happens to our Ecosystem ???
If we add large biodegradable
pollutants & Nutrients, What
happens to our Ecosystem ???
If we add large amount of
garbage, What happens to
our Ecosystem ???
If we cut lot of trees, What
happens to our Ecosystem ???
If we add DDT or other
pesticides, What happens to
food chain/food web of our
Ecosystem ???
OBJECTIVE: HOW CAN WE PREVENT THE DISTURBANCE OF
ECOSYSTEM
OR HOW WE CAN RESTORE OUR ECOSYSTEM