Embed Size (px)
Citation preview
Introduction and R
Timothy Hanson
Department of Statistics, University of South Carolina
Stat 506: Introduction to Experimental Design
1 / 25
Course logistics
Book is A First Course in Design and Analysis of Experimentsby Gary Oehlert. Free PDF file on webpage.
Grading based solely on homeworks; mostly data analyses butsome thought problems.
Lecture notes will be notes taken from text melded w/ Dr.Oehlert’s notes and my own experience; posted the nightbefore.
We will follow the text pretty much in order, covering about15 pages per lecture. Keep up!
Computing will be done in R; I will show you how to install Rand some necessary packages today.
Let’s first go through the syllabus.
2 / 25
Prerequisites
The official requirements are one of:
MATH 122 - Calculus for Business Administration & SocialSciences
MATH 142 - Calculus II
MATH 201 - Elementary Statistics
For this course, calculus is not needed at all. However, I am hopingthat you have had some statistics and probability, somewhere.Otherwise there is too much to introduce up front. In particularyou should have seen, e.g., the normal distribution, simplehypothesis testing, and p-values.
If you have not and still want to take this course, I suggest takinga morning or afternoon and reading through some of my STAT 205notes; see the syllabus.
The homework will mostly be data analyses and projects using thecomputing, so having a great math/stat background is notnecessary to get something out of the course and do well.
3 / 25
1.1 Why experiment?
Researchers use experiments to answer questions.
Example: what type of fertilizer grows the biggest radishes ina month? Three treatments: Miracle Grow, organic compostjuice, or nothing. Why include nothing?
An experiment is comprised of treatments, experimental units,and responses.
Experimental units here are radish plants.
The response could be many measurements; for this exampleit was the weight of each plant after four weeks.
4 / 25
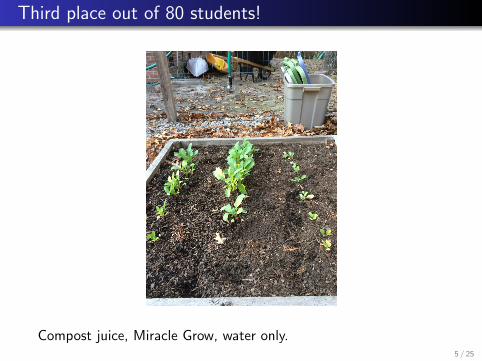
Third place out of 80 students!
Compost juice, Miracle Grow, water only.5 / 25
Advantages of experiments
1 Experiments allow us directly compare the affects of thetreatment(s) of interest.
2 Experiments can be designed to minimize bias in thecomparisons.
3 Experiments can be designed so that error in makingcomparisons among treatments is small, e.g. high precision.
4 Experiments allow us to (carefully) infer causation.
6 / 25
Experiment vs. observational study
An observational study also has treatments, units, and responses.However, the treatments are not controlled by us, theexperimentor. Example 1.1 (p. 2) Does spanking hurt?
Observational study useful in that data are cheap and easy to get;often starts as anecdotal evidence. Observational studies often leadot prospective studies and/or experiments.
Example: kava and lung cancer.http://www.healthtalk.umn.edu/2014/01/07/u-m-research-finds-kava-plant-may-prevent-cigarette-smoke-induced-lung-cancer/ Whymice?
Highlights importance of ethics (p. 4). Cannot ethically inducelung cancer in humans.
7 / 25
Establishing causal relationship
Mosteller and Tukey (1977) suggest that causation can be ascribedwhen 1 and 2 below are satisfied:
1 Consistency: relationship is roughly same strength anddirection across populations.
2 Responsiveness: changing causal variable changes response asexpected.
Experiment allows changing causal variable.
May want to hypothesize a mechanism behind the causalrelationship.
8 / 25
1.2 Components of an experiment
An experimental design has treatments, experimental units, and amethod to assign treatments to units.
Should keep a statistical model in mind when designing anexperiment. NIH/NSF grant proposals expect this.
Good design avoids systematic error, is precise, allows estimationof pure error, and has broad validity.
9 / 25
1.2 Components of an experiment
Systematic error is reduced through randomization oftreatments, measuring devices, doctors, etc.
Precision is increased by increasing the sample size.
Estimation of pure error is possible by considering anappropriate statistical model for analyzing the experiental datawith appropriate sample size.
Broad validity is accomplished by sampling as large anddiverse population as possible, e.g. both men and women,different ages, etc. Kava example has population of mice.
10 / 25
1.3 Terms and concepts
Treatments are what we manipulate, or control in the experiment:types and/or amounts of fertilizer; amount of kava extract,temperature of an industrial process, etc.
The treatments are applied to experimental units: radish plants,mice, humans, lightbulbs, etc. When humas are the experimentalunits they are called subjects.
Responses are what is measured on the experimental unit andrecorded as data: weight of radish plant, how long cancer is inremission, how long light bulb works, etc. The responses (data)will let us explain differences among treatments and performstatistical inference.
11 / 25
1.3 Terms and concepts
Randomization is the use of a given probabilistic mechanism forthe assignment of treatments, measureing devices, laboratories,etc. to experimental units.
Experimental error is random variation present in all responsesbeyond the treatment. Different experimental units will givedifferent responses to the same treatment; even repeatedlymeasuring the same unit will often result in different responses,e.g. DPOAE testing.
Blinding occurs when the evaluators of a response do not knowwhich treatment was given to which unit; double blinding occurswhen both the evaluators and the subjects do not know theassignment of treatments. Reduces bias.
12 / 25
1.3 Terms and concepts
The Control treatment is “standard” treatment used as baselineor basis of comparison for the other treatments. Might betreatment in common use, or might be no treatment.
Placebo is a control treatment used when the act of simplyapplying a treatment affects the response. Examples: reduction inheadache pain when given a sugar pill, sham surgery, tractorcompressing soil.
A treatment level may be comprised of several factors, e.g. timeand temperature baking bread. Various fixed settings for eachfactor are called levels.
13 / 25
1.3 Terms and concepts
Confounding occurs when the effect of one factor or treatmentcannot be distinguished from that of another factor or treatment.The two factors or treatments are said to be confounded.
Consider planting red burgundy okra in fields in Richland Countyand silver queen okra in Charleston County. Location effectscannot be distinguished from from variety effects: the varietyfactor and the location factor are confounded.
14 / 25
1.4 Outline of course
Chapter 2: randomization.
Chapters 3–7: completely randomized designs.
Chapters 8–10: factorial treatment structure (more than onetreatment).
Chapters 11–12: random effects designs.
Chapter 13: complete block designs.
Chapter 14: incomplete block designs.
Chapters 15–16: incomplete block designs with multipletreatments, split plots.
Chapter 17: adding covariates (ANCOVA).
Chapter 18: fractional factorials .
Chapter 19: response surfaces (we may not get to).
15 / 25
1.5 More on experimental units
An experimental unit is often made up of measurement units.An experimental unit can receive any of the treatments underconsideration.
Radish experiment: each row of radishes (about 5 to 10 radishes ineach row) was given one of the three fertilizer treatments from awatering can. A row of radishes (often called a “plot” inagricultural experiments) is an experimental unit; each radish is ameasurement unit.
Mice: mice are caged together, with different cages receivingdifferent nutritional supplements. The cage is the experimentalunit, and the mice are the measurement units.
Sometimes all measurement units from an experimental unit arecombined into an overall summary, e.g. mean, median, max, etc.
16 / 25
1.5 More on experimental units
Prof. Oehlert discusses a few more issues concerning units:
Figuring out a size or shape of the experimental unit.
Not all units are equivalent: edge effects, grabbing mouseclosest to cage door, timing of measurement, etc.
How to split up experimental unit into measurement units?
Independence? Measurement units need to be well-separatedin time or space so that treatments don’t overlap.
Sample size?
17 / 25
1.6 More on responses
May be several primary responses of interest, each answeringa different question.
Often primary response not measurable, e.g. lifetime.Surrogate response is proxy for primary response, e.g.proportion of those who lived past 5 years. Another term:biomarkers.
Another example: CD4, viral load counts for HIV patients;article Comparison of CD4 Cell Count, Viral Load, and OtherMarkers for the Prediction of Mortality among HIV-1InfectedKenyan Pregnant Women athttps://www.ncbi.nlm.nih.gov/pmc/articles/PMC2758232/
Predictive responses are related to the primary response (orsurrogate), called “covariates.”
Audit responses: were treatments applied correctly?
18 / 25
R computing & graphics package
R is a powerful, free statistical computing and graphicspackage.
Popular with many researchers due to contributed packages:R functions to do specialized, advanced, & often complexstatistical analyses.
R can also do many important, routine calculations, analyses,and provide common graphical displays used in this course.
Installed in several of the computing labs across campus, e.g.Sloan 108 & 109, Gambrell 003.
You can download it and install it from CRAN:http://cran.r-project.org/
19 / 25
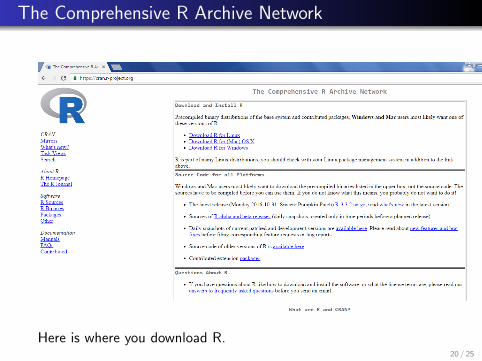
The Comprehensive R Archive Network
Here is where you download R.20 / 25
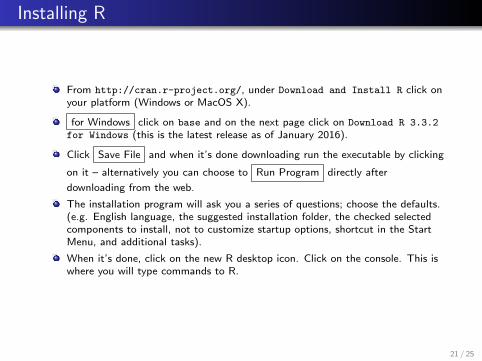
Installing R
From http://cran.r-project.org/, under Download and Install R click onyour platform (Windows or MacOS X).
for Windows click on base and on the next page click on Download R 3.3.2
for Windows (this is the latest release as of January 2016).
Click Save File and when it’s done downloading run the executable by clicking
on it – alternatively you can choose to Run Program directly after
downloading from the web.
The installation program will ask you a series of questions; choose the defaults.(e.g. English language, the suggested installation folder, the checked selectedcomponents to install, not to customize startup options, shortcut in the StartMenu, and additional tasks).
When it’s done, click on the new R desktop icon. Click on the console. This iswhere you will type commands to R.
21 / 25
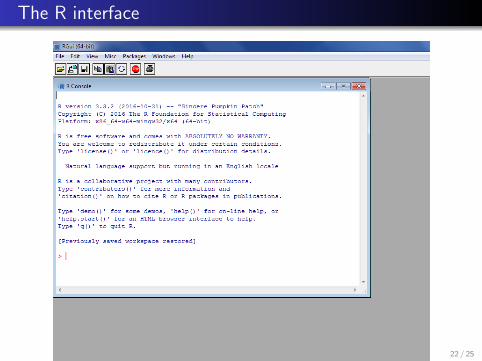
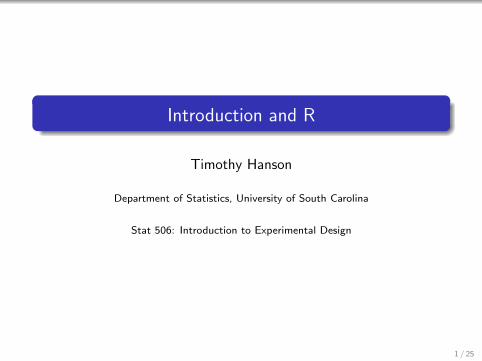
The R interface
22 / 25
Some code to try
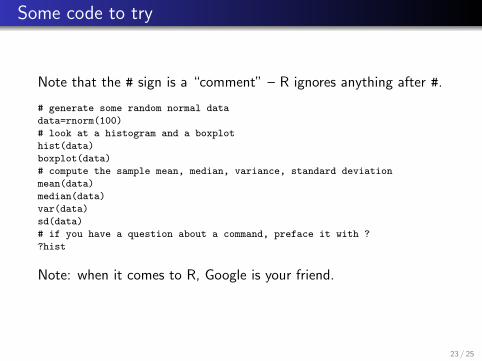
Note that the # sign is a “comment” – R ignores anything after #.
# generate some random normal data
data=rnorm(100)
# look at a histogram and a boxplot
hist(data)
boxplot(data)
# compute the sample mean, median, variance, standard deviation
mean(data)
median(data)
var(data)
sd(data)
# if you have a question about a command, preface it with ?
?hist
Note: when it comes to R, Google is your friend.
23 / 25
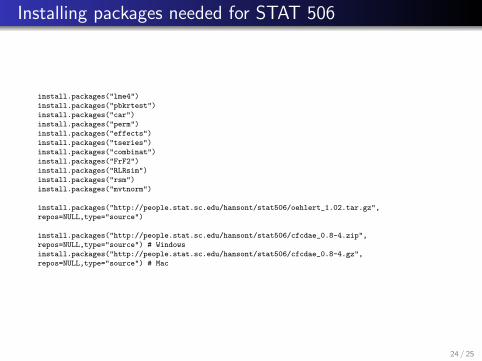
Installing packages needed for STAT 506
install.packages("lme4")
install.packages("pbkrtest")
install.packages("car")
install.packages("perm")
install.packages("effects")
install.packages("tseries")
install.packages("combinat")
install.packages("FrF2")
install.packages("RLRsim")
install.packages("rsm")
install.packages("mvtnorm")
install.packages("http://people.stat.sc.edu/hansont/stat506/oehlert_1.02.tar.gz",
repos=NULL,type="source")
install.packages("http://people.stat.sc.edu/hansont/stat506/cfcdae_0.8-4.zip",
repos=NULL,type="source") # Windows
install.packages("http://people.stat.sc.edu/hansont/stat506/cfcdae_0.8-4.gz",
repos=NULL,type="source") # Mac
24 / 25
More on R
R will allows you to do all analyses covered in this course, andbeyond.
There are some tutorials, both installed in R and on the web.Under Help choose Manuals (in PDF) and choose An
introduction to R. This can get you started.
For homework, I’ll give you a skeleton set of commands to getthe basic job done with no frills.
R’s error messages can be cryptic and therefore R is not as“user friendly” as some other packages such as Minitab.
However it is free; now being used by millions of people.
25 / 25