Embed Size (px)
Citation preview
Advanced Rooftop Unit Control (ARC) Retrofit Technology:General Measurement and Verification Plan
National Renewable Energy laboratory
August 15, 2014
Internal Report Prepared for
Building Technologies Office
DOE/EERE
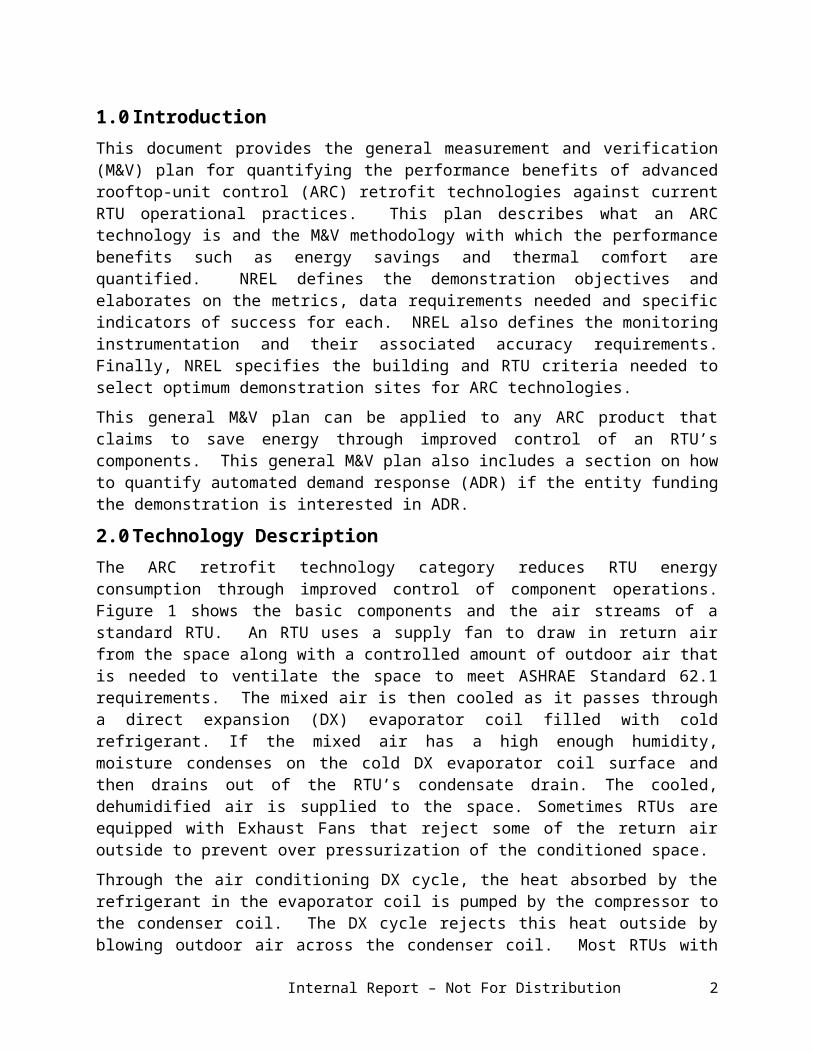
1.0 Introduction This document provides the general measurement and verification (M&V) plan for quantifying the performance benefits of advanced rooftop-unit control (ARC) retrofit technologies against current RTU operational practices. This plan describes what an ARC technology is and the M&V methodology with which the performance benefits such as energy savings and thermal comfort are quantified. NREL defines the demonstration objectives and elaborates on the metrics, data requirements needed and specific indicators of success for each. NREL also defines the monitoring instrumentation and their associated accuracy requirements. Finally, NREL specifies the building and RTU criteria needed to select optimum demonstration sites for ARC technologies.
This general M&V plan can be applied to any ARC product that claims to save energy through improved control of an RTU’s components. This general M&V plan also includes a section on how to quantify automated demand response (ADR) if the entity funding the demonstration is interested in ADR.
2.0 Technology DescriptionThe ARC retrofit technology category reduces RTU energy consumption through improved control of component operations. Figure 1 shows the basic components and the air streams of a standard RTU. An RTU uses a supply fan to draw in return air from the space along with a controlled amount of outdoor air that is needed to ventilate the space to meet ASHRAE Standard 62.1 requirements. The mixed air is then cooled as it passes through a direct expansion (DX) evaporator coil filled with cold refrigerant. If the mixed air has a high enough humidity, moisture condenses on the cold DX evaporator coil surface and then drains out of the RTU’s condensate drain. The cooled, dehumidified air is supplied to the space. Sometimes RTUs are equipped with Exhaust Fans that reject some of the return air outside to prevent over pressurization of the conditioned space.
Through the air conditioning DX cycle, the heat absorbed by the refrigerant in the evaporator coil is pumped by the compressor to the condenser coil. The DX cycle rejects this heat outside by blowing outdoor air across the condenser coil. Most RTUs with over 7.5 tons of cooling capacity operate with two compressors that can be “staged” to operate one or two compressors at a time. Some RTUs are large enough, typically over 20 tons, to have 4 stages of cooling with four compressors.
Internal Report – Not For Distribution 2

Figure 1. RTU schematic
ARC technologies achieve energy savings through the following advanced control features. All ARC technologies convert the supply fan from constant speed to multi-speed or variable speed. The availability of the other features varies based on the ARC product.
Constant to Multi-Speed or Variable-Speed Supply Fan Operation. RTUs are typically configured with a constant speed fan which moves more air than necessary for most of the year with the constant air flow rate sized to meet the most demanding heating or cooling conditions. ARC systems control the supply fan speed based on the operation of the RTU such as ventilation mode, stage 1 cooling stage 2 cooling, or heating (stage 1 or 2). Field monitoring of CAV RTUs has shown that the supply fan annual energy can well exceed the compressor annual energy usage for most US climates. Consequently, this control feature typically delivers most of the ARC technology’s energy savings.
Outdoor air damper control. Outdoor air dampers are often not operated properly and sometimes set at a fixed position by the maintenance staff. Additionally, outside air dampers are notoriously leaky. ARC technologies ensure that the outdoor air damper is closed during non-occupied hours to minimize outdoor air intake during unoccupied operation when no ventilation is needed. ARC technologies also provide improved economizer operation to use outdoor air for non-compressor based cooling when the ambient conditions are suitable – most ARC enable integrated economizer operation. Depending on the condition of the outside air damper (it may be severely rusted at some fixed position), replacement may be necessary to ensure both proper operation as well as low leakage when shut.
Demand controlled ventilation (DCV). RTUs are configured with an outdoor airflow rate based on the expected maximum number of occupants. Yet most spaces typically experience a number of occupants well below this number throughout most of the year. ARC technologies will have DCV capability that uses some measurement to determine how much ventilation to provide in order to meet ASHRAE Standard 62.1 requirements. ARC technologies typically use a carbon dioxide sensor in the return air stream to infer ventilation needs of the space. ARC technologies could also use an occupancy sensor. Through either measurement method, ARC technologies adjust the ventilation rate to meet the needs of the space real-time. Significant cooling and heating energy is a result of reducing the ventilation rates provided throughout the year.
Differential dry-bulb temperature or Differential enthalpy economizing. Most RTUs that have an operable outdoor air damper use fixed dry-bulb temperature economizing. ARC technologies can provide improved economizer operation through differential dry-bulb temperature or differential enthalpy economizing to increase the hours of the year when the RTU can leverage ambient air for cooling. Some ARC technologies provide anticipatory economizing by determining when a space will need cooling later in the day and leveraging the current time’s cooler ambient conditions to “charge” the space – the entire goal being offsetting the initial time that the first stage DX cooling will need to initiate.
Demand Response. Peak demand charges are accounting for a larger percentage of a utility bill. Furthermore, utilities are becoming more interested in using ADR capability to shed building load. In particular, HVAC represents one of the most significant end-use influences on peak grid demand. An increasing number of ARC technologies are integrating ADR to reduce overall
Internal Report – Not For Distribution 3

HVAC power draw. While this capability does not lend itself to energy savings, it can be an enticing feature to utilities for providing additional installation rebates that then improve the overall return on investment (ROI). Additionally, reducing a building’s demand charges improves ROI.
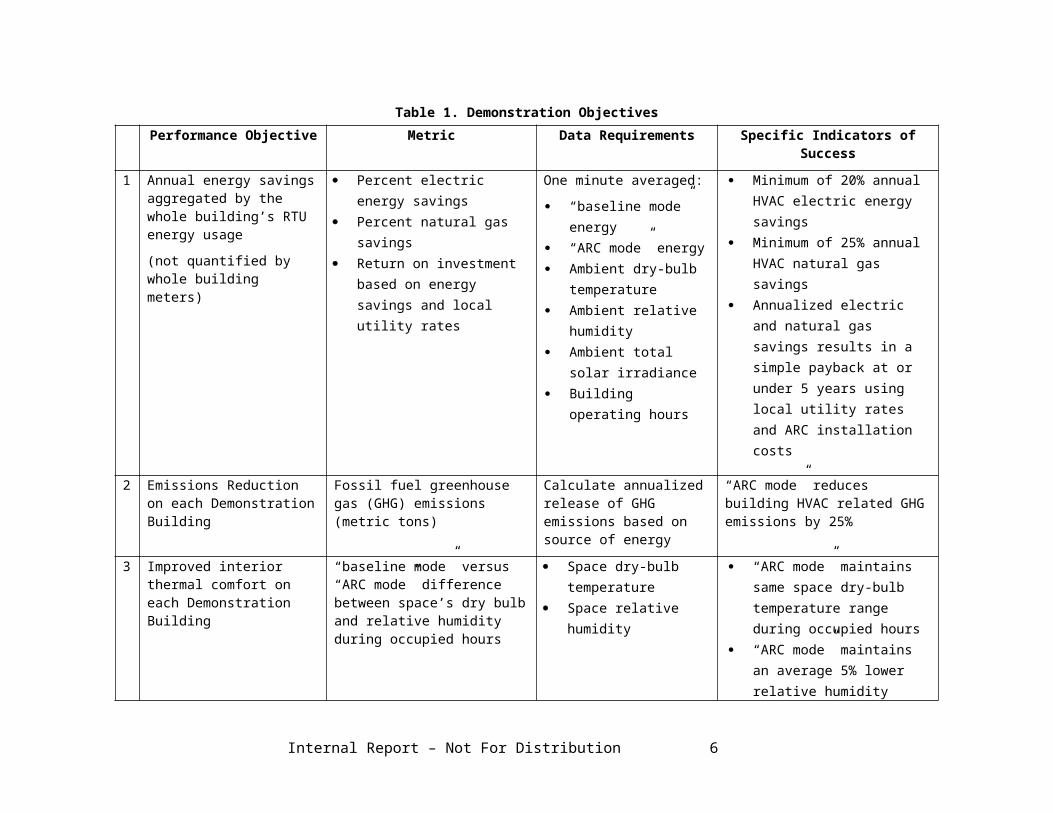
3.0 Demonstration ObjectivesBeyond quantifying electric and natural gas energy savings (and ADR if the funding entity is interested), NREL has included the following demonstration objectives: ROI, impact to thermal comfort, meeting ventilation requirements and source emissions reductions. Table 1 outlines the performance objectives and how NREL defines success for each.
Internal Report – Not For Distribution 4

Table 1. Demonstration ObjectivesPerformance Objective Metric Data Requirements Specific Indicators of Success
1 Annual energy savings aggregated by the whole building’s RTU energy usage
(not quantified by whole building meters)
Percent electric energy savings
Percent natural gas savings Return on investment based
on energy savings and local utility rates
One minute averaged:
“baseline mode” energy “ARC mode” energy Ambient dry-bulb
temperature Ambient relative
humidity Ambient total solar
irradiance Building operating
hours
Minimum of 20% annual HVAC electric energy savings
Minimum of 25% annual HVAC natural gas savings
Annualized electric and natural gas savings results in a simple payback at or under 5 years using local utility rates and ARC installation costs
2 Emissions Reduction on each Demonstration Building
Fossil fuel greenhouse gas (GHG) emissions (metric tons)
Calculate annualized release of GHG emissions based on source of energy
“ARC mode” reduces building HVAC related GHG emissions by 25%
3 Improved interior thermal comfort on each Demonstration Building
“baseline mode” versus “ARC mode” difference between space’s dry bulb and relative humidity during occupied hours
Space dry-bulb temperature
Space relative humidity
“ARC mode” maintains same space dry-bulb temperature range during occupied hours
“ARC mode” maintains an average 5% lower relative humidity during occupied hours
4 Ventilation meets ASHRAE 62.1 requirements and minimal damper leakage when outdoor air damper closed
“baseline mode” versus “ARC mode” difference between ventilation rates provided during occupied and unoccupied hours
Outdoor air flow rate at all combinations of supply fan speeds and outdoor air damper positions within the sequence of operation
Both modes meet ASHRAE 62.1 for all operational modes
10% or under outdoor air damper leakage rate
Internal Report – Not For Distribution 5
4.0 Demonstration DesignTwo completed DOE national laboratory field demonstrations of an ARC technology were referenced for defining the (1) instrumentation and monitoring and (2) baseline methodology. Pacific Northwest National Laboratory (PNNL) conducted an ARC field demonstration (Wang et al 2013) on 66 RTUs on 8 different buildings across 4 different climate zones with funding from the DOE and Bonneville Power Administration (BPA). NREL conducted the other ARC field demonstration (Doebber et al 2014) on 11 RTUs on 3 different buildings in Hawaii with funding from the Naval Facilities Engineering Command (NAVFAC). NREL used the lessons learned from both demonstrations in subsections 4.1 and 4.2
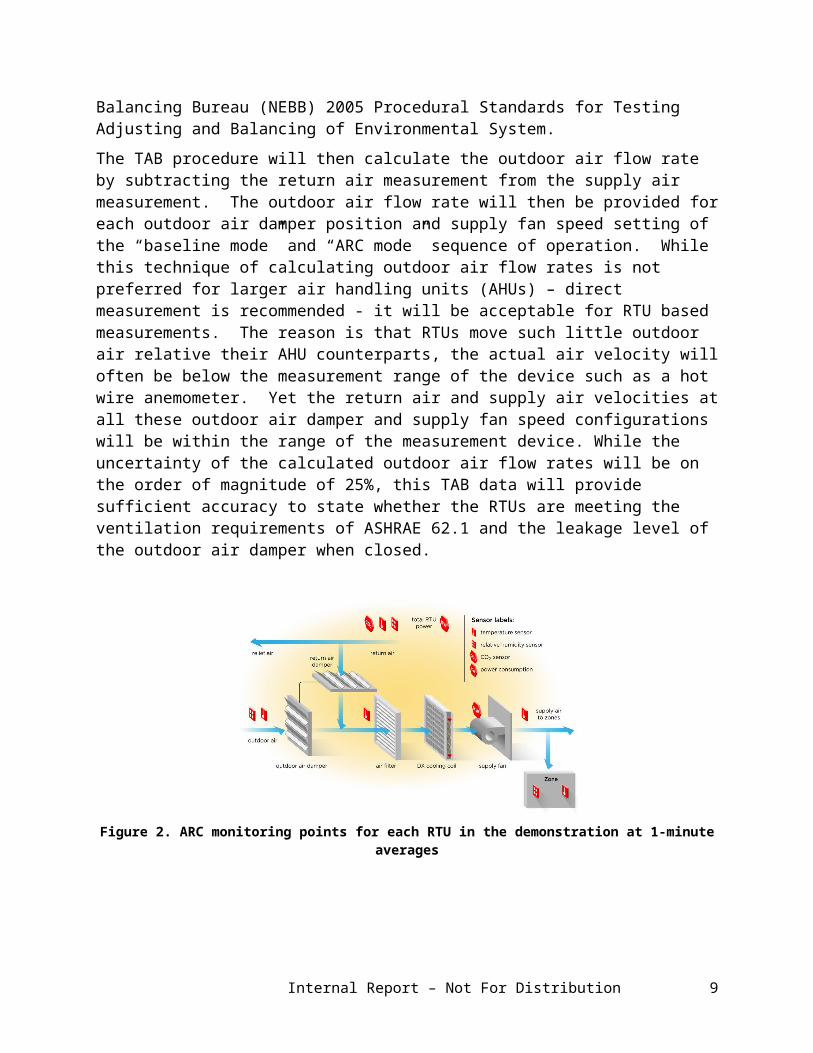
4.1 Instrumentation and MonitoringBoth the PNNL and NREL field demonstrations used the same monitoring points on each RTU shown in Figure 2 and Table 2. In additional to the monitoring points on each RTU, Table 3 shows the required monitoring point for a weather station at each building location. If multiple buildings are located within 10 miles of each other, then one weather station can be used for those buildings. Beyond the 10 mile diameter, each building should have its own weather station. As summarized in Section5, the RTU energy usage across the building is being normalized against statistically significant weather parameters. Knowing the localized climate for each building is therefore important to establishing regression models with low uncertainty. In other words, using National Oceanographic and Atmospheric Adminstration (NOAA) weather may not be representative of the actual weather experienced at the building. This would result in regression models with larger uncertainty that reduces the confidence in the annualized energy savings (and ADR peak power reduction if included in the demonstration).
For the ventilation and outdoor air damper leakage performance objective 4 in Table 1 above, a detailed testing, adjusting and balancing (TAB) procedure will need to be conducted. The supply air flow and return air flow for all the “baseline mode” and “ARC mode” combinations of outdoor air damper and supply fan speed will need to be measured according to the National Environmental Balancing Bureau (NEBB) 2005 Procedural Standards for Testing Adjusting and Balancing of Environmental System.
The TAB procedure will then calculate the outdoor air flow rate by subtracting the return air measurement from the supply air measurement. The outdoor air flow rate will then be provided for each outdoor air damper position and supply fan speed setting of the “baseline mode” and “ARC mode” sequence of operation. While this technique of calculating outdoor air flow rates is not preferred for larger air handling units (AHUs) – direct measurement is recommended - it will be acceptable for RTU based measurements. The reason is that RTUs move such little outdoor air relative their AHU counterparts, the actual air velocity will often be below the measurement range of the device such as a hot wire anemometer. Yet the return air and supply air velocities at all these outdoor air damper and supply fan speed configurations will be within the range of the measurement device. While the uncertainty of the calculated outdoor air flow rates will be on the order of magnitude of 25%, this TAB data will provide sufficient accuracy to state whether the RTUs are meeting the ventilation requirements of ASHRAE 62.1 and the leakage level of the outdoor air damper when closed.
Internal Report – Not For Distribution 6
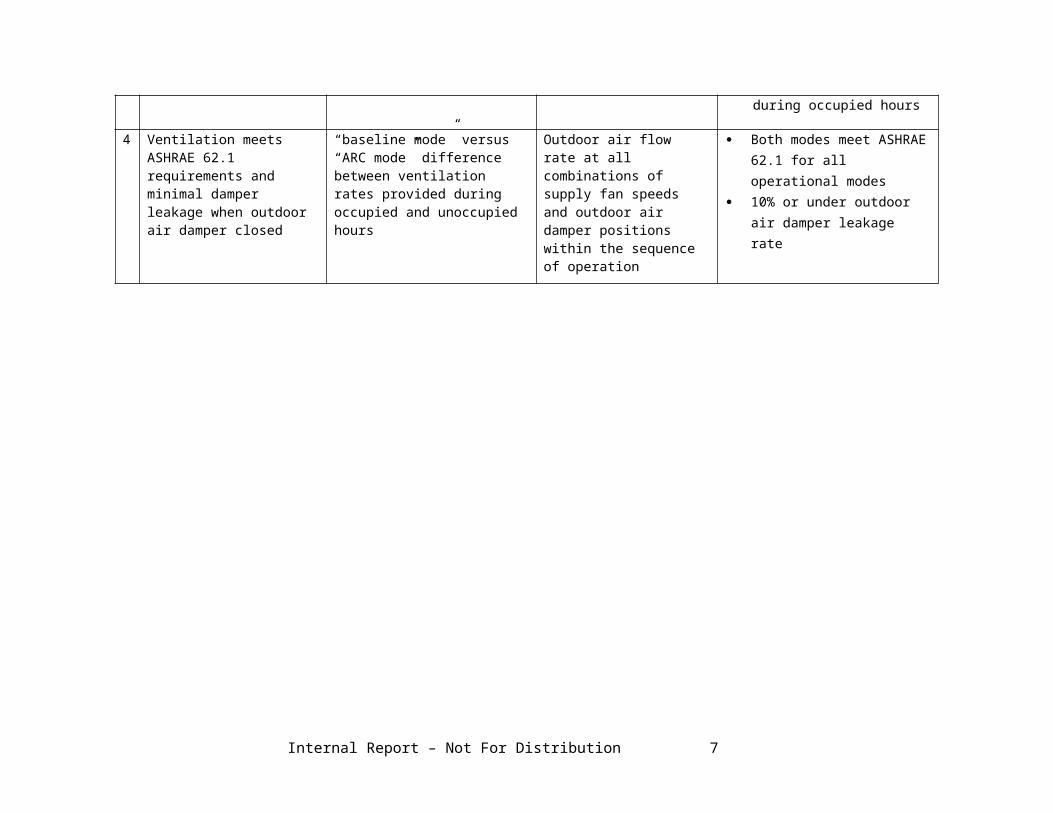
Figure 2. ARC monitoring points for each RTU in the demonstration at 1-minute averagesTable 2. ARC monitoring points for each RTU in the demonstration at 1-minute averages
Monitoring Point Sensor Accuracy Units Notes
Occupied Status N/A N/A Signal from programmable thermostat or BMS
First Stage Cooling N/A N/A Signal from programmable thermostat or BMS
Second Stage Cooling N/A N/A Signal from programmable thermostat
or BMS
First Stage Heating N/A N/A Signal from programmable thermostat or BMS
Second Stage Heating N/A N/A Signal from programmable thermostat
or BMS
Supply Fan Speed N/A N/A Internal ARC command to supply fan motor
OA Damper Position N/A N/ASignal provided from ARC controller to the OA damper actuator; Based on 0-100% opening
Supply Fan Power Under 3% accuracy kW
Measuring true power based on voltage and current measurements on each phase
Total RTU Power Under 3% accuracy kW Measuring true power with voltage and
current measurements on each phase
RA Temp SensorLess than +/-1°F accuracy from 41°F to 104°F
degrees FLocated at least 1 duct diameter into the return air duct, away from the return air duct connection to the RTU
SA Temp SensorLess than +/-1°F accuracy from 41°F to 104°F
degrees FLocated at least 1 duct diameter into the supply air duct after the heating coil
RA CO2 Sensor +/- 30 PPM ppm (parts per million)
CO2 sensor positioned in return air ductwork
Space Dry-Bulb Temperature
Less than +/-1°F accuracy from 41°F to 104°F
degrees F Space temperature provided by the thermostat
Space Relative Humidity
+/- 3%, 0-100% Range % RH
Space relative humidity provided by the humidistat even if no humidistat is needed for humidity control
Internal Report – Not For Distribution 7

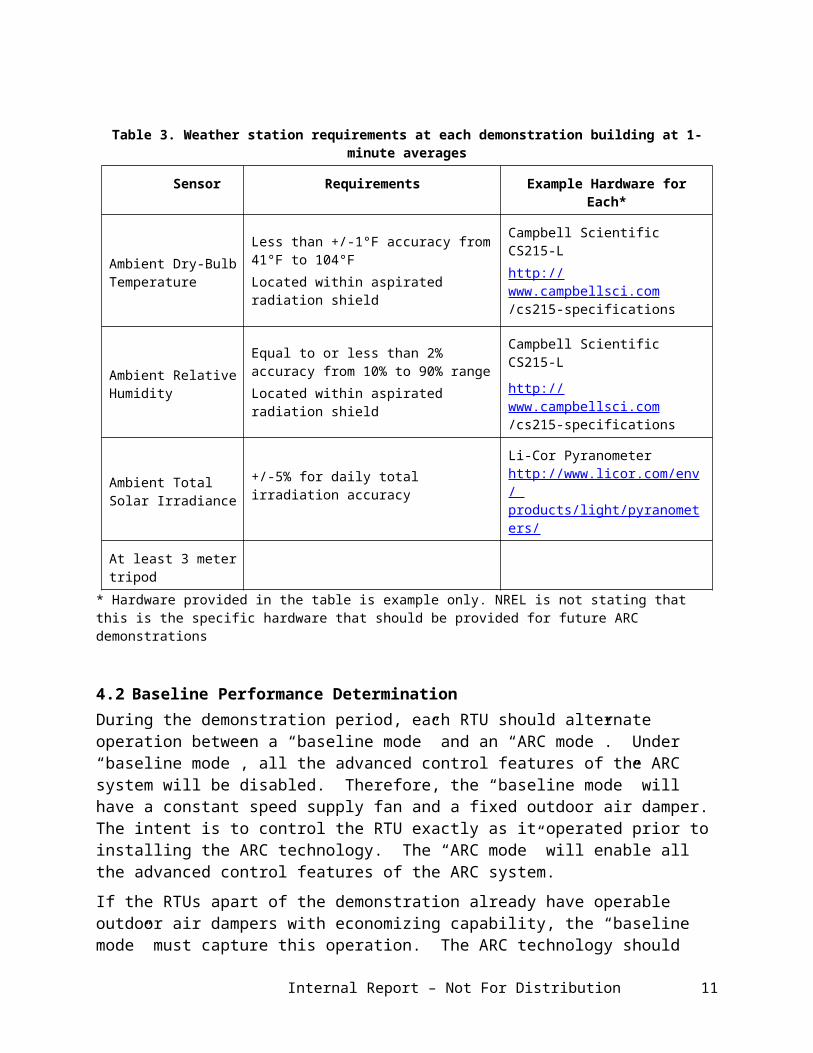
Table 3. Weather station requirements at each demonstration building at 1-minute averages
Sensor Requirements Example Hardware for Each*
Ambient Dry-Bulb Temperature
Less than +/-1°F accuracy from 41°F to 104°FLocated within aspirated radiation shield
Campbell Scientific CS215-Lhttp://www.campbellsci.com /cs215-specifications
Ambient Relative Humidity
Equal to or less than 2% accuracy from 10% to 90% rangeLocated within aspirated radiation shield
Campbell Scientific CS215-L
http://www.campbellsci.com /cs215-specifications
Ambient Total Solar Irradiance
+/-5% for daily total irradiation accuracyLi-Cor Pyranometer http://www.licor.com/env/ products/light/pyranometers/
At least 3 meter tripod
* Hardware provided in the table is example only. NREL is not stating that this is the specific hardware that should be provided for future ARC demonstrations
4.2 Baseline Performance DeterminationDuring the demonstration period, each RTU should alternate operation between a “baseline mode” and an “ARC mode”. Under “baseline mode”, all the advanced control features of the ARC system will be disabled. Therefore, the “baseline mode” will have a constant speed supply fan and a fixed outdoor air damper. The intent is to control the RTU exactly as it operated prior to installing the ARC technology. The “ARC mode” will enable all the advanced control features of the ARC system.
If the RTUs apart of the demonstration already have operable outdoor air dampers with economizing capability, the “baseline mode” must capture this operation. The ARC technology should then be configured to control the outdoor air damper exactly as it was operated before its installation. Most likely this economizer operation would be based on a fixed dry-bulb lock out sequence. If the ARC technology does not control the outdoor air damper, then the outdoor air damper should not be controlled during the demonstration. Yet the outdoor air damper position should still be monitored based on Table 2.
Alternating between “baseline mode” and “ARC mode” will be weekly or daily depending on the climate. For humid climates within ASHRAE climate “A” categories, the alternation should be weekly. For all other climates, the alternation should be daily.
NREL recommends weekly operation for humid climate because of the experience demonstrating the ARC system in Hawaii’s humid climate (Doebber et al 2014). NREL found that alternating daily resulted in one day’s “baseline mode” operation impacted the next day’s “ARC mode” operation. The “baseline mode” operation was “piggy-backing” on the “ARC mode” improved dehumidification. NREL defined the phenomena as latent cross-talk. “Baseline mode” was using less energy because it was handed a drier space from the previous day’s “ARC mode”. Visa versa, “ARC mode” needed to use more energy to dry out the additional latent load left from “baseline operation”. NREL found that alternating weekly provided a clearer performance distinction for humid climates.
Internal Report – Not For Distribution 8
For non-humid climates, NREL still recommends using daily alternation because this will provide more similar climate conditions between both modes across the demonstration period. For example, operating under a daily alternation will expose both modes to a several day heat wave. Consequently, the resultant measured data set will have similar ranges in weather conditions with which each mode gets normalized. The PNNL demonstration alternated on a daily basis.
5.0 Performance Analysis and AssessmentIn this section, NREL presents how to process the raw monitored data. Subsection 5.1 summarizes the annualized energy savings procedure. Subsection 5.2 summarizes how to quantify the impacts of ADR on a building’s peak power demand.
5.1 Annualized Energy SavingsSince field demonstration often do not last a full year and are exposed to weather abnormalities such as heat waves or cold spells, the raw data should be normalized against statistically significant weather variables. These normalizations come in the form of regression models. The following step-by-step process summarizes the procedure of use raw monitored data to calculate annualized ARC energy savings.
Step 1. Aggregate the 1-minute raw data into Daily Total Electrical Energy, Daily Total Natural Gas and Daily Average Weather Conditions (ambient dry-bulb, ambient humidity ratio, ambient solar irradiance).
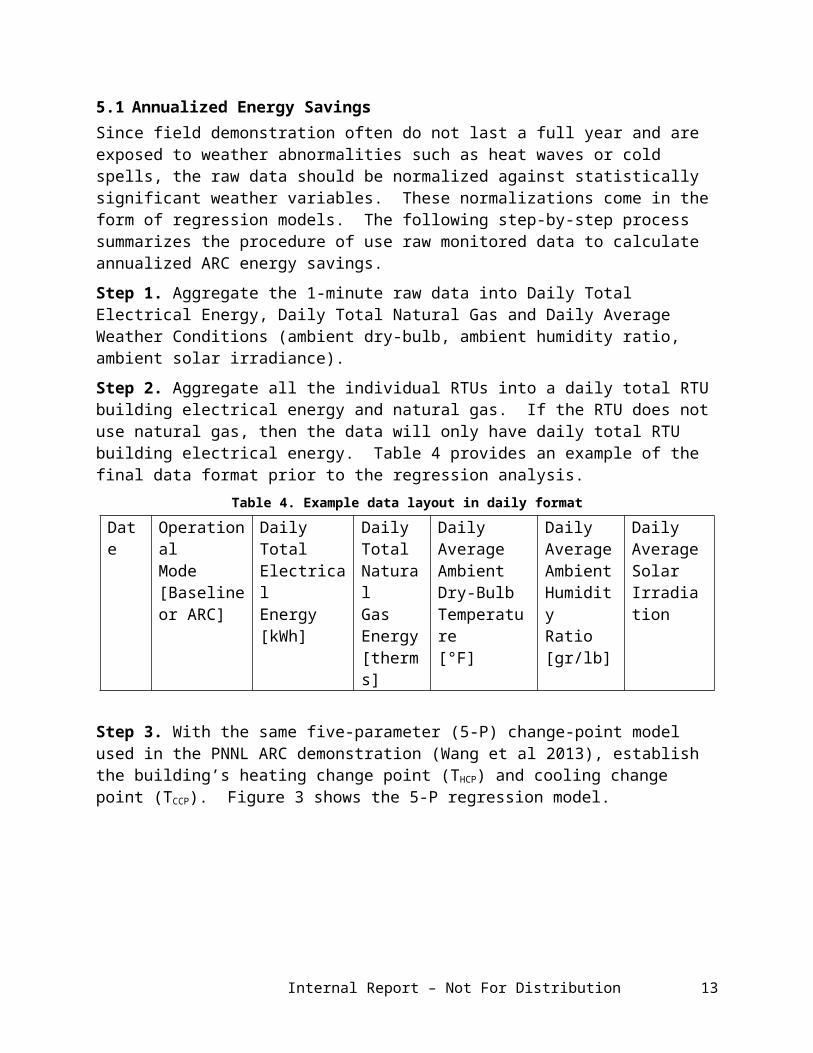
Step 2. Aggregate all the individual RTUs into a daily total RTU building electrical energy and natural gas. If the RTU does not use natural gas, then the data will only have daily total RTU building electrical energy. Table 4 provides an example of the final data format prior to the regression analysis.
Table 4. Example data layout in daily formatDate Operational
Mode[Baselineor ARC]
DailyTotalElectricalEnergy[kWh]
DailyTotalNaturalGasEnergy[therms]
DailyAverageAmbientDry-BulbTemperature[°F]
DailyAverageAmbientHumidityRatio[gr/lb]
DailyAverageSolarIrradiation
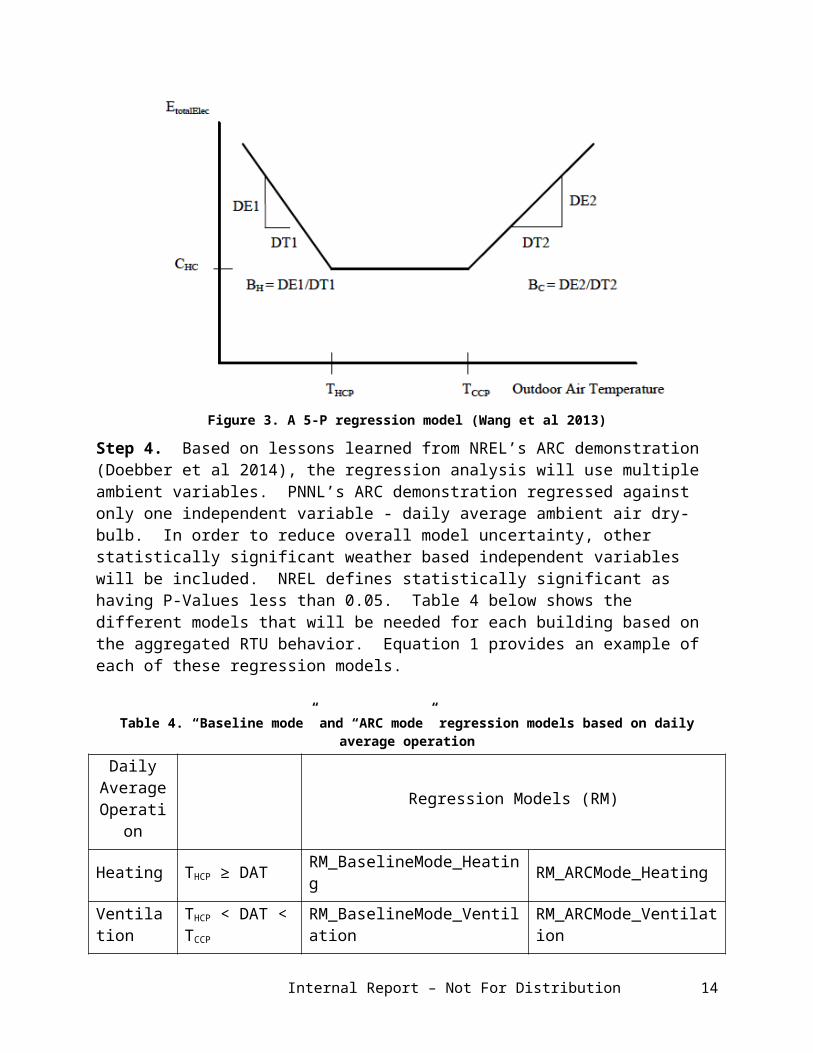
Step 3. With the same five-parameter (5-P) change-point model used in the PNNL ARC demonstration (Wang et al 2013), establish the building’s heating change point (THCP) and cooling change point (TCCP). Figure 3 shows the 5-P regression model.
Internal Report – Not For Distribution 9
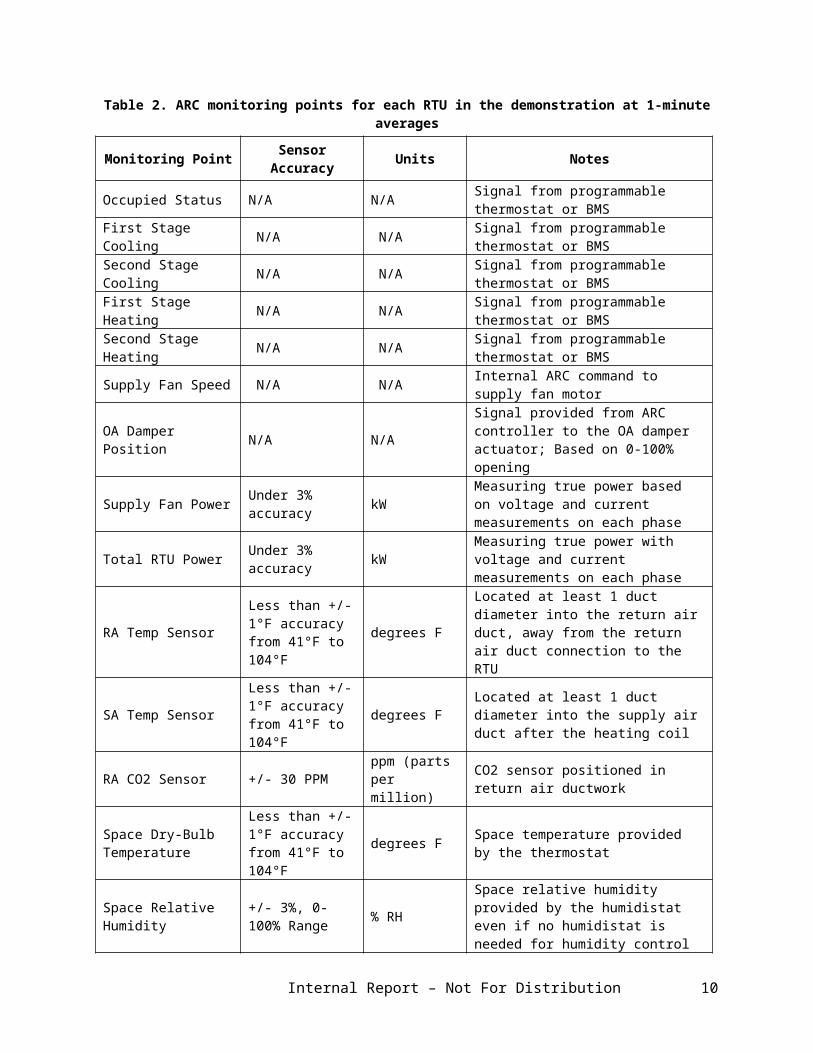
Figure 3. A 5-P regression model (Wang et al 2013)
Step 4. Based on lessons learned from NREL’s ARC demonstration (Doebber et al 2014), the regression analysis will use multiple ambient variables. PNNL’s ARC demonstration regressed against only one independent variable - daily average ambient air dry-bulb. In order to reduce overall model uncertainty, other statistically significant weather based independent variables will be included. NREL defines statistically significant as having P-Values less than 0.05. Table 4 below shows the different models that will be needed for each building based on the aggregated RTU behavior. Equation 1 provides an example of each of these regression models.
Table 4. “Baseline mode” and “ARC mode” regression models based on daily average operation Daily
Average Operation
Regression Models (RM)
Heating THCP ≥ DAT RM_BaselineMode_Heating RM_ARCMode_Heating
Ventilation THCP < DAT < TCCP
RM_BaselineMode_Ventilation RM_ARCMode_Ventilation
Cooling DAT ≥ TCCP RM_BaselineMode_Cooling RM_ARCMode_Cooling
DAT = daily average ambient dry-bulb temperature
Equ 1 RMBaselineModeHeating( kWh
day )=c0+(c1 ∙OAT DB )+( c2∙ OAT DP )+ (c3 ∙ SolarIrradiation )+c4 …
Step 5. These regression models in Table 4 are then applied to the appropriate typical meteorological year TMY3 weather file. By appropriate, NREL means the TMY3 weather file that is for the location of the buildings within the demonstration. TMY3 weather is used since it
Internal Report – Not For Distribution 10
represents a 30 year normalized period that mitigates impacts of abnormal weather behavior that is characteristic of actual meteorological year (AMY) weather data.
5.2 Peak Demand ReductionThe following subsection shall be used if the funding entity wants to include ADR in the demonstration. During days of a demand response event, the actual 15-minute averaged whole building RTU power will be compared against two references (baselines) to quantify the DR achieved for each event. Whole building RTU power is the aggregated 15-minute power draw across all the RTUs on the building.
Both these baseline references will be based on typical ARC operation which will already include some permanent load reduction benefits of its advanced control capabilities. In other words, both of the following references will not be based on the “baseline mode” RTU operation with the supply fan at constant speed and no DCV operation.
1. The first reference will be the 10-day rolling average which is a typical comparison made by current DR programs (Mathieu 2011). This reference provides a raw data comparison - eliminating any reliance on a regression based model. This reference does not account for weather such that DR events on extreme weather events will most likely experience different daily power profiles compared to the 10-day rolling average. For example, during an extremely hot day, there may be an increase in the building demand during the DR event compared to the 10-day rolling average. The increase would be due to the influence of extremely hot OAT’s on the HVAC power demand which the 10-day rolling average would not account for.
2. The second reference will be a linear regression of the building’s power consumption based on time of day, day of the week and OAT using the load prediction model developed by LBNL (Piette 2013; Mathieu 2011). The raw data used to develop the regression model will be based on days when no DR event occurred – use at least 30 days of historic data to create the models. During DR event days, this predictive model will calculate real-time what the building power profile would have been if no DR event occurred.
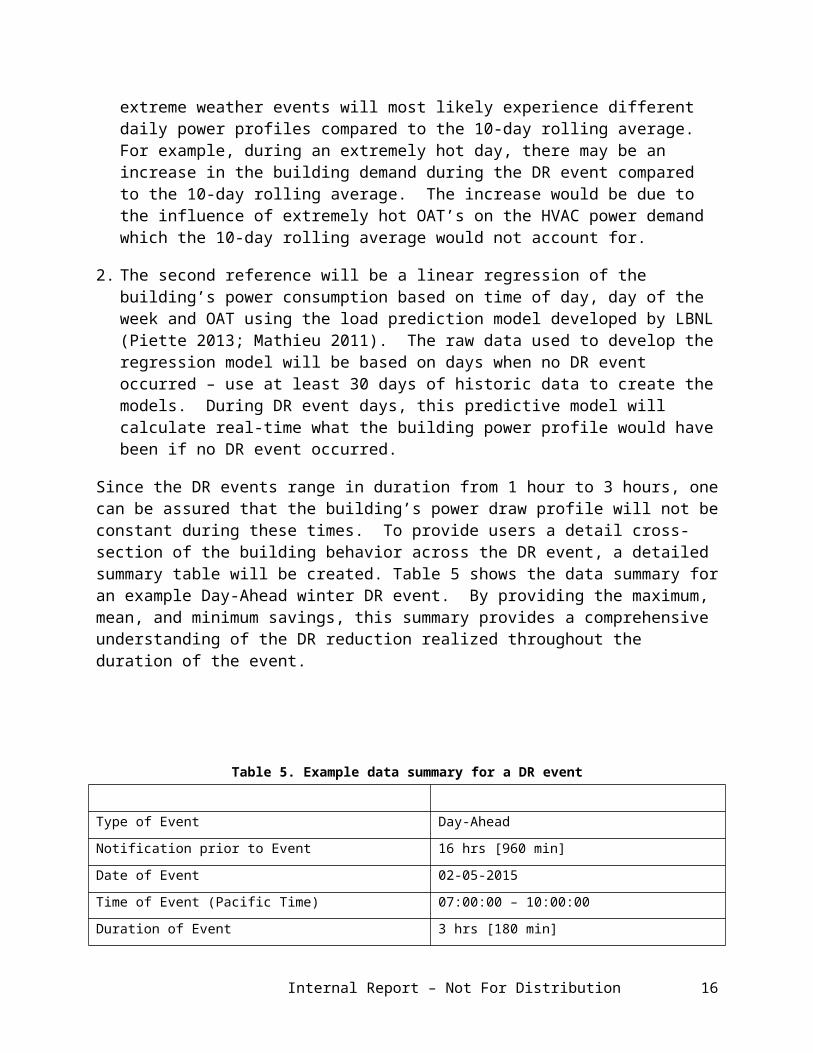
Since the DR events range in duration from 1 hour to 3 hours, one can be assured that the building’s power draw profile will not be constant during these times. To provide users a detail cross-section of the building behavior across the DR event, a detailed summary table will be created. Table 5 shows the data summary for an example Day-Ahead winter DR event. By providing the maximum, mean, and minimum savings, this summary provides a comprehensive understanding of the DR reduction realized throughout the duration of the event.
Table 5. Example data summary for a DR eventDemonstration Site Mors Furniture-Marysville
Type of Event Day-Ahead
Internal Report – Not For Distribution 11
Notification prior to Event 16 hrs [960 min]
Date of Event 02-05-2015
Time of Event (Pacific Time) 07:00:00 – 10:00:00
Duration of Event 3 hrs [180 min]
Target DR reduction 1.7 W/ft2 x 16,000 ft2 = 27 kW
Mean DR from Weather Normalized Baseline 27 kW [1.7 W/ft2]
Mean DR from 10-day Rolling Avg 22 kW [1.4 W/ft2]
Actual 10-day Rolling Avg Comparison
Weather Normalized Baseline Comparison
Max. Power 49 kW 72 kW 76 kW
Mean Power 44 kW 66 kW 71 kW
Min. Power 42 kW 63 kW 69 kW
Max. DR 23 kW 27 kW
Mean DR 22 kW 27 kW
Min. DR 21 kW 27 kW
Max. Normalized Power 3.1 W/ft2 4.5 W/ft2 4.8 W/ft2
Mean Normalized Power 2.8 W/ft2 4.1 W/ft2 4.4 W/ft2
Min. Normalized Power 2.6 W/ft2 3.9 W/ft2 4.3 W/ft2
Max. Normalized DR 1.4 W/ft2 1.7 W/ft2
Mean Normalized DR 1.4 W/ft2 1.7 W/ft2
Min. Normalized DR 1.3 W/ft2 1.7 W/ft2
6.0 ScheduleThe demonstration period must be at least 9 months to capture all the seasonal impacts of the ARC technology. Based on the weather based regression models presented in Section 5, the demonstration period must capture the full temperature range that each of the demonstration building’s will experience in their climate. This will ensure that the performance normalized against weather conditions will cover the entire range of typical ambient conditions.
Internal Report – Not For Distribution 12
7.0 Selecting Optimum Demonstration SitesThe following bulleted lists identify the high priority and preferred characteristics for selecting buildings and roof-top units (RTUs) for ARC demonstrations. Table 6 below states the building and RTU information that should be provided for each potential site. The High Priority and Preferred criteria can then be used for a down select process.
High Priority RTUs must have constant speed supply fans (not variable or multi-speed fans) RTU must have 3 phase electrical service
Preferred RTU unit size at least 7.5 tons as the larger the RTU the larger the energy savings and the
better the ROI. Multiple RTU serving the same building; some ARC technologies have fixed costs per
site regardless of how many RTUs there are. The more RTUs can be retrofitted on a single building in order to increase the overall energy savings, the more diluted the per site costs become, increasing overall ROI.
Age of RTUs 10 years or under; ARC’s are a retrofit that is best applied to equipment that has at least 5 years of life left (typical RTUs last approximately 15 years).
Building hours of operation – at least 10 hours per day but the more the better – ideal is 24 hour operation.
Table 6. Initial Information Needed for Each Candidate Building for Use in Site Selection
RTU 1 RTU 2 RTU …System(s) AgeConstant Speed Supply Fan?Fixed or Variable OA DamperBMS system or not; if BMS is it web based such that there is internet access?3 phase? - ? VoltageMake/Model of systemHours of operationTypical Thermostat Set-point (if have this info)Area Type being served by the RTU (ie Office, retail etc)Approximate Square footage served by each RTU (based on diffuser layout)
Internal Report – Not For Distribution 13
8.0 References ASHRAE (2014). Standard Methods of Determining, Expressing, and Comparing Building Energy Performance and Greenhouse Gas Emissions. ANSI/ ASHRAE Standard 105–2014. Atlanta, GA: American Society of Heating, Refrigerating and Air-Conditioning Engineers.
Doebber, I.; Dean, J.; Dominick, J.; Holland, G. (2014) RM12-2703 Advanced Rooftop Unit Control Retrofit Kit Field Demonstration: Hawaii and Guam Energy Improvement Technology Demonstration Project. NREL-61072. Accessed from www.nrel.gov/docs/fy14osti/61072.pdf.
Mathieu, J.L.; Price, P.N.; Kiliccote, S.; and Piette, M.A. (September 2011) “Quantifying Changes in Building Electricity Use, with Application to Demand Response. ” IEEE Transactions on Smart Grid 2; pp. 507-518. Accessed on February 10, 2014 from http://eetd.lbl.gov/sites/all/files/LBNL-4944E.pdf.
Wang, W.; Katipamula, S.; Ngo, H.; Underhill; R., Taasevigen, D.; Lutes, R. (2013). Advanced Rooftop Control (ARC) Retrofit: Field-Test Results. PNNL-22656. Accessed from www.pnl.gov/main/publications/external/technical_reports/PNNL-22656.pdf.
Internal Report – Not For Distribution 14

Appendix A Technology Performance Exchange IntegrationAs part of a cohesive, step-by-step strategy to move newly commercialized technologies to full scale adoption, this work will use a defined process to address many of the gaps identified by DOE, including gaps in the following areas:
Data transparency and consistency Inter-program and stakeholder input pathway coordination 3rd party performance verification Operations and maintenance strategies and data Demonstration of non-energy benefits
Specifically, for relevant technologies being demonstrated through the HIT Catalyst program, this work will identify the intrinsic, product-specific energy performance parameters necessary to support robust analysis and extrapolate anticipated energy consumption and savings well beyond the technology demonstrations to applicable nationwide building stock. Even though implementation of the robust analysis is not part of FY15 scope, identifying and capturing these parameters now maximizes the value of these demonstrations and provides a pathway to understanding the overarching impact of the demonstrated technologies. Once these requisite parameters have been identified, the project performer will work with the technology manufacturer to obtain data for the identified parameters, even if such data are not normally made publically available. These data will eventually be stored on the Technology Performance Exchange so that they are accessible to a wide array of end-users and to ensure that data for similar technologies can also be uploaded and the performance of many different products easily compared.
The M&V plans developed for field demonstrations will focus on characterizing those conditions that are not easily characterized in a laboratory setting, primarily use patterns, operation-related parameters, and other non-energy benefits. However, where possible, validation of the manufacturer-provided intrinsic performance data will also be gathered and will serve as 3rd party performance verification of the manufacturer’s claims. M&V plans will not be focused on characterizing the intricacies of how the product performs in the field, as the many uncontrollable and building-specific characteristics unique to each demonstration site make it extremely difficult to apply those results to alternative installation scenarios. The M&V plans will, however, be designed to provide enough data to allow for robust comparative field analysis (e.g., regression analysis) of the energy benefits/penalties of the HIT Catalyst demonstration technologies.
A.1 Energy Performance Parameter Identification For each hardware-based HIT Catalyst demonstration technology, provided it is economically feasible, identify the qualitative and quantitative foundational energy performance criteria necessary to predict energy performance in a detailed simulation environment. This effort will support a transparent, collaborative and consistent method for directed decision-making, including two-way communication between internal staff, federal agencies, market stakeholders, and manufacturers. This task does not apply to software-based HIT Catalyst demonstrations.
Internal Report – Not For Distribution 15
A.2 Laboratory or Subsystem Model Data GatheringTo the extent that the manufacturer will provide the data, obtain input data from the HIT Catalyst technology manufacturer for each of the parameters identified in the Energy Performance Parameter Identification task. In the future, once the technology has been added to the Technology Performance Exchange (not part of this project), the manufacturer-provided data can be uploaded to increase the transparency and consistency of data exchange.
A.3 M&V Plan DevelopmentDevelop a comprehensive M&V plan for each HIT Catalyst demonstration technology. The primary focus will be on monitoring use patterns, operation-related parameters, and non-energy impacts. When deciding which parameters will be included in the M&V data collection plan, field-measurable parameters that correspond to parameters identified during the Energy Performance Parameter Identification task will be given priority. This will allow for the validation of manufacturer claims. However, at a minimum, the M&V plan will provide enough data to allow for a robust comparative field analysis (e.g., regression analysis) of the energy benefit/penalty of the HIT Catalyst demonstration technology.
Internal Report – Not For Distribution 16