Embed Size (px)
Citation preview

1 | P a g e
Daniel K. Inouye Solar Telescope (DKIST) 2014 HCP State Fiscal Year Report
H. Chen, C. Ganter, J. Panglao, A. Ryon July 2014
INTRODUCTION:
This annual report is being submitted by the DKIST Resource Management Team, in accordance with the DKIST Habitat Conservation Plan (HCP) and the Final Biological Opinion (BO) of the US Fish and Wildlife Service (USFWS, 1-2-2011-F-0085). The purpose of this report is to summarize the results of mitigation and monitoring activities being implemented for the DKIST project.
Background of the DKIST Project
The Daniel K. Inouye Solar Telescope (DKIST) was renamed from the Advanced Technology Solar Telescope (ATST) in remembrance of the late Senator Daniel K. Inouye on December 15th, 2013. The DKIST is located within the 18.166-acre University of Hawai‘i Institute for Astronomy (IfA) Haleakalā High Altitude Observatory (HO) site at the summit of Haleakalā, County of Maui, Hawai‘i. The DKIST facilities will include a 136-foot (ft.) (41.5-meter (m)) tall building housing the telescope, an attached support and operations building, and a utility building. Construction is funded by the National Science Foundation (NSF) and began on December 1st, 2012.
As the largest and most capable solar telescope in the world, the DKIST will provide researchers with 17.4-mile (28-kilometer) resolution images of the Sun’s surface. The primary goals of the DKIST Project are to understand solar magnetic activities and variability, both because the Sun serves as a key resource for understanding the underpinnings of astrophysics and our understanding of magnetic plasmas, and because activity on the Sun drives space weather which can create hazards for communications to and from satellites, as well as for astronauts and air travelers. Furthermore, and perhaps most importantly, the variability in solar energy induced by solar activity affects the Earth’s climate. The key to understanding solar variability and its direct impact on the Earth rests with understanding all aspects of solar magnetic fields, which in turn control the fluctuating Sun.
DKIST Habitat Conservation Plan (HCP) / Biological Opinion (BO)
The DKIST Habitat Conservation Plan (HCP), which was approved by the State of Hawai‘i Board of Land and Natural Resources (BLNR) in January 2011, addresses anticipated impacts to state and federal threatened, endangered, and listed species from the construction of the DKIST at HO, pursuant to Chapter 195D, Hawai‘i Revised Statutes (HRS 195D). The Biological Opinion (BO) was published on June 15, 2011 by the U.S. Fish and Wildlife Service. The species of focus in both the HCP and BO is the Hawaiian Petrel (Pterodroma sandwichensis)
Incidental Take License
The State of Hawai‘i Board of Land and Natural Resources (BLNR) issued an Incidental Take License (ITL), No. ITL-13, to the NSF on November 30, 2011. The ITL grants permission of take, if such take is incidental to and not the purpose of the carrying out of an otherwise lawful activity, for 35 Hawaiian Petrel individuals: 30 fledglings and 5

2 | P a g e
adults. Once construction of the DKIST is complete, the operations of the DKIST facility are not expected to result in incidental take of listed species under HRS 195D.
FAA/Coastguard Communication Tower Monitoring
Because of concern that the DKIST facility may interfere with Federal Aviation Administration’s (FAA) ground-to-air signal conveyance, NSF, through AURA/NSO, funded necessary tower upgrades on two of the existing FAA towers located on FAA property adjacent to HO. These tower upgrades were completed October 8, 2012. By agreement between NSF and FAA, the DKIST Resource Management Team also monitors the FAA tower site to collect baseline petrel-tower collision information.
Hawaiian Petrels
Status of the Species
The endangered Hawaiian Petrel (Pterodroma sandwichensis) is a medium-sized seabird in the family Procellariidae (shearwaters, petrels, and fulmars). The Hawaiian Petrel formerly was treated as a subspecies of P. phaeopygia, with the nominate subspecies occurring in Galapagos (P. p. phaeopygia). Based on differences in morphology and vocalization, the two subspecies were reclassified as full species in 1993 (Monroe and Sibley, 1993) and genetic analysis confirmed the split several years later (Browne, et al., 1997).
Listing Status The Hawaiian Petrel was listed as endangered on March 11, 1967 (32 FR 4001).
Threats and Distribution Hawaiian Petrels were abundant and widely distributed in prehistory; their bones have been found in archaeological sites throughout the archipelago (Olson and James, 1982). Introduced avian diseases (Warner, 1968), collection for use as food (Harrison 1990), and introduction of dogs (Canis lupus familiaris), pigs (Sus scrofa domesticus), cats (Felis silvestris catus), rats, and mongoose (Herpestes javanicus) predators have resulted in substantial declines in the distribution and numbers of this species and has led to small relict colonies of Hawaiian Petrels in high-elevation, remote locations. This species has no natural terrestrial predators other than the Hawaiian Owl (Pueo, Asio flammeus sandwichensis).
Aside from these threats, other significant anthropogenic sources of Hawaiian Petrel mortality are light attraction and collision with communications towers, power transmission lines and poles, fences, and other structures (Simons, 1983). The Hawaiian Petrels fly over 30 miles/hour (48 km/hour) (Day and Cooper, 1995), which likely reduces the ability to detect obstacles in the dark and avoid them. This problem is likely to be exacerbated by the continuing development and urbanization throughout Hawai‘i.
Hawaiian Petrels are currently known to nest on at least five islands (Simons and Hodges, 1998), but their distribution is limited to high elevation sites where predation pressure is lower. Maui may harbor as much as one quarter of the breeding population, and most of Maui’s petrels nest along the rim of Haleakalā Crater (Simons and Hodges, 1998) in Haleakalā National Park (HALE) and in the vicinity of the DKIST action area. The most recent estimate of breeding petrel numbers in these areas is roughly 400 to 600 breeding pairs (Simons and Hodges, 1998; Bailey 2006, personal communication). A primary reason for the relatively large numbers of

3 | P a g e
petrels and their successful breeding around Haleakalā summit today is likely due to the fencing and intensive predator control maintained by Haleakalā National Park since about 1982. The petrel’s habitat is destroyed or severely compromised by feral ungulates such as goats, and by pigs in wetter and more vegetated environments than the summit of Haleakalā. In addition to collapsing burrows and compacting the substrate, these animals provide vectors for non-native invasive plants that alter the vegetation structure and may hinder the birds' access to traditional nesting areas (Simons, 1985).An accurate estimate of total numbers of Hawaiian Petrels is not available; however, estimates range from the thousands to about 34,000 (e.g., Spear, et al., 1995; Ainley, et al., 1995). Spear, et al. (1995) estimated the at-sea population size of adult and sub-adult Hawaiian Petrels of 19,000 birds (with a 95 percent confidence interval of 11,000 to 34,000). Ainley, et al. (1997) estimates a breeding population of about 1,600 pairs on Kaua‘i and Ainley (USFWS, unpublished field notes) estimates that there are a few thousand pair occurring on Lana‘i and 1,500 on Haleakalā. Darcy Hu (2009, personal communication) located 115 active burrows within the Hawai‘i Volcanoes National Park (HAVO) in 2006. Jay Penniman estimated that between 1,000 and 6,000 Hawaiian Petrels come to shore each year on all islands (2009, personal communication).
Nesting Habitat Although historically the species may have nested at lower elevations (USFWS, 1983), the current nesting habitat of Hawaiian Petrels on Maui is at elevations above 7,200 ft (2,195 m).
The largest known nesting colony of Hawaiian Petrels is located in and around the National Park (Simons and Hodges, 1998). Approximately 30 known burrows were located along the southeastern perimeter of HO, several burrows were northwest of HO, and additional burrows have been found northeast of the DKIST Project site (NPS, 2003). Hawaiian Petrels are present at Haleakalā from February through October and are absent from November through January. The Hawaiian Petrel nests on Haleakalā in high elevation burrows located beneath rock outcrops, under boulders and cliff faces, along talus slopes or along edges of lava flows where there is suitable soil underlying rock substrate for excavation of tunnels. Most of the nests on Haleakalā are in rock crevices in sparsely vegetated, xeric habitat (Simons and Hodges, 1998). Burrows are excavated by the Petrel to a depth of three to six ft (one to 1.8 m), but sometimes reach a length of 15 ft (4.6 m) or more. The birds spend much of their time at sea where they are known to feed on squid, small fish, and crustaceans displaced to the surface by schools of tuna (Larson, 1967; Simons, 1985). Hawaiian Petrels have been tracked taking single trips exceeding 6,200 mi (10,000 km) circumnavigating the north Pacific during the nestling stage (Adams, et al., 2006), and has been recorded in the Philippines (Rabor, et al., 1970), Japan (Nakamura, 1979), the Gulf of Alaska (Bourne, 1965), and off the coast of Oregon and California (Pyle, et al., 1993).
The majority of known Hawaiian Petrel burrows are located along the western rim of the Haleakalā Crater, where this habitat is most abundant and also where predator control is afforded. Using survey efforts from 1990-1996, previous estimates of burrow density, including part of the mitigation area, range from 5 to 15 burrows per ha, compared to 15 to 30 burrows per ha along the western crater rim. Similarly, in 2004 and 2005, Hawaiian Petrel passage rates, collected using ornithological radar, were 4 to 7 times greater during summer and fall at the Visitor’s Center (Western rim), when compared to the Haleakalā Observatory complex, suggesting bird numbers are lower in areas encompassing the DKIST mitigation site. Importantly, the population trend at Haleakalā is increasing, which suggests that additional recruitment into this site is possible (Holmes, 2010b).

4 | P a g e
There are four Hawaiian Petrel burrow clusters, and a number of isolated burrows, within approximately 1,250 ft (381 m) of the DKIST Project site, totaling approximately 31 individual burrows. Burrow clusters and individual burrows to the west and the northwest of the construction site historically have not been highly used by nesting Hawaiian Petrels (Bailey, 2009, personal communication); approximately 5 to 10 burrows (mostly inactive) are 500 to 800 ft (244 m) from the construction site to the west.
Similar to other members of its family, the Hawaiian Petrel has a well-defined, highly synchronous nesting season (Simons, 1985), albeit there is clear evidence of intra-island variation in breeding phenology within Hawai‘i, with Haleakalā breeders initiating, and completing, breeding approximately one month earlier than Kaua‘i, Lana‘i, and Hawai‘i Island. At the Haleakalā site, birds arrive in their colonies in late February. After a period of burrow maintenance and social activity they return to sea until late April when egg-laying commences. Non-breeding birds visit the colony from February until late July (Simons and Hodges, 1998). Many of these may be young birds seeking mates and prospecting for nest sites, but some proportion is thought to be mature adults that do not elect to breed.
Hawaiian Petrels are thought to begin breeding at about five or six years of age, and roughly 90 percent of breeders attempt to breed each year (Simons and Hodges, 1998). Beginning in mid-February to early March, after a winter absence from Hawai‘i, breeding and non-breeding birds visit their nests regularly at night, for a period of social activity and burrow maintenance work. Pairs are site tenacious, returning to the same burrow year after year. From mid-March to mid-April, birds visit their burrows briefly at night on several occasions. Then breeding birds return to sea until late April or early May, when they return to lay and incubate their eggs.
Both adults participate in incubating the egg and feeding the chick; after a brief brooding period, both adults are foraging at sea and will have absences from the nest (Simons, 1985). Male and female birds alternate incubation attendance, and total incubation period ranges from 45 to 58 days (Simons, 1985). Egg temperature and evaporative water loss are controlled by the incubating adult. Because the metabolism of awake, resting birds is almost twice that of sleeping birds (Simons, 1985), disturbance of incubating birds’ sleep could potentially result in more rapid weight loss and an inability of the adult to stay on the egg until its mate relieves it.
During the incubation period, many non-breeding birds also inhabit the colony. Many of these are young birds gaining experience seeking mates and prospecting for nest sites; the remaining portions are experienced breeders that did not elect to breed. Non-breeders and failed breeders typically begin leaving the colony once the eggs have hatched. The non-breeders continue to visit their burrows at night through early August (Simons, 1985). By September, the only birds visiting the colony are adults returning to feed their chicks (Simons, 1985). Chicks do not appear to require much brooding from their parents. Adults depart from the nest to forage at sea within one to six days after the chick hatches (Simons, 1985). Chicks spend 66 percent of their time alert, resting quietly, 26 percent of their time sleeping, 6 percent of their time preening or stretching, and 2 percent of their time walking around (Simons, 1985). Nocturnal feeding by one parent occurs approximately every other day until the chick is 90 days old. After 90 days, adults appear to continue to feed chicks until the chick refuses food. Chicks fledge between late September and late October, after an average of 111 days after hatching (Simons, 1985, though our data shows fledging goes into the first week of November). Although adults are occasionally observed to remain after fledglings depart, colonies generally are empty by the end of November.
5 | P a g e
A hiatus of only about three months occurs between the end of one breeding season and the beginning of the next.
DKIST HCP CONSERVATION AREA AND CONTROL SITE
The DKIST HCP Conservation Area includes observatory facilities, broadcast facilities, communication towers, and the portion of Skyline Trail dividing the area from the northeast to the southwest. Adjacent lands include the Kula Forest Reserve, Kahikinui Forest Reserve, NPS, Department of Hawaiian Home Lands (DHHL), and private land. The conservation/mitigation site contains a number of cinder cones, of which Pu‘u Kolekole is the highest in elevation. This cone is about 0.3 mi (0.5 km) from the highest point on the mountain, Pu‘u ‘Ula‘ula (Red Hill) Overlook, which is in the Park and outside of state land (Figure 1). Based on the State of Hawai‘i website published TMK GIS layer, the area was estimated to be 328 ac (133 hc), however after the ground survey using existing metes and bounds was completed, it was determined the area covers an area of 321.79 ac (130.22 hc) and is depicted in Figure 1.
The HCP Conservation Area is located between approximately 8,800 to 10,000 ft (2,686 to 3,048 m) in elevation, where snow and hail can occur. The annual average total precipitation on the Haleakalā summit, in the vicinity of the mitigation area, between 1949 and 2005, was 52.92 inches (in) (134 centimeters (cm). At or near the summit, sustained wind speeds of 50 miles per hour are not unusual. The greatest wind speed recorded at the summit is over 125 miles (mi) per hour (201 km per hour). The topography within the Conservation Area is rugged and barren, and the elevation drops with an average slope greater than 30 percent (DKIST 2010). Temperatures at the summit of Haleakalā can range between below freezing to highs of 65°F (18°C, HNP 2011).
The Control Site (Figure 1) is one kilometer west of the west boundary of the Conservation Area, just north of the Skyline Trail, at an elevation of 8,700 to 9,300 ft. (2652 to 2835 m). The topography within the Control Site is similar to that of the Conservation Area. This Control Site encompasses 80 acres and is used to compare and evaluate the DKIST Resource Management Team’s conservation efforts within the HCP Conservation Area.

6 | P a g e
DKIST HCP COMPLIANCE
Resource Biologist/Team DKIST resource biologist, Huisheng Chen, was hired on June 1st, 2011 and the resource management team was formed on August 8, 2011, comprised of three additional seasonal technicians.
Site Boundary, Conservation Fence Line Surveying/Marking The DKIST Conservation Area boundary survey and marking was completed by Akamai Land Surveying Inc. on July 3rd, 2013 using the approved DKIST HCP area maps, the Hawai’i Government published GIS TMK map, and existing metes and bounds as guidance. Based on the survey, the Conservation Area covers an area of 130.22 hc (321.79 ac, Figure 1). To ensure the proposed fence was within the DKIST Conservation Area boundary and to avoid disturbance of any known Hawaiian Petrel burrows and cultural resource sites, a second survey to mark the fence route was conducted on August 15th, 2013 by a team including personnel from the Rock N H Fencing Company, an archeologist from the International Archaeological Research Institute Inc., and the DKIST resource management team.

7 | P a g e
Hawaiian Petrel Burrow/Reproductive Success Monitoring Hawaiian Petrel burrow/reproductive success monitoring has been conducted annually since the 2011 breeding season by DKIST’s resource management team, in both the Conservation Area and Control Site (Figure 1). Due to the acute angle shapes of petrel burrows and the volcanic rock, utilizing a burrow scope of current design in the Haleakalā summit area has not been feasible to-date. Therefore, data on the number of petrel pairs that laid eggs is not available, and for the purpose of this report, we are using “fledgling success” as a measurement of reproductive success in this area. This measurement is described in the HCP in Holm’s Leslie model and Bailey’s recommendation. According to this model, “Fledgling success” is estimated by dividing the total number of burrows that fledged one petrel chick by the number of active burrows within the same season.
Control Site Selection and Setup In order to fulfill the monitoring obligations of the HCP, a Control Site was selected in 2011 based on GIS research and the DKIST resource management teams’ ground search data in the Haleakalā summit area (Figure 1). A DLNR Permit for Access was issued on 05/31/2012 in order to conduct monitoring activities in this area.

8 | P a g e
Birdstrike Monitoring Birdstrike monitoring has been underway since 2011 between February 1st and November 30th (2011 was an exception, for which monitoring began on June 7th). In 2011 and 2012, prior to the start of construction of the DKIST, only the two FAA communication towers were monitored. An area equal to a seventy-five foot radius of the FAA towers (Figure 2) was delineated, and this radius is 1.25 the height of the two FAA towers (60 ft.). The site was monitored every morning, seven days a week from 2011 to 2013. In 2014, the team reduced the monitoring schedule to match the HCP required frequency of twice a week. In 2013, search areas A and B were added. (Figure 2) The perimeter boundary of Area A and B is approximately 1.25 x the height of the DKIST observatory (136 ft.) extending from the perimeter of the DKIST observatory site. DKIST resource management team members, trained by the DKIST resource biologist responsible for monitoring, conduct birdstrike monitoring within these two sites. Due to the cultural sensitivity in the summit area, no additional marking was allowed, and therefore the resource management team only uses existing landmarks to mark search routes and systematically search these two sites.
Area A (3.3 ac (1.3 ha)) lies on the DKIST plateau and includes other observatories. This area includes roads, pathways and roofs of buildings, plus open rocky habitat with little obstruction for detecting bird carcasses. No restriction on this search area exists, and all monitoring of Area A is done by systematical foot search.
Area B (1.4 ac (0.6 ha)) lies on the steep slopes south and east below the DKIST plateau, in an existing Hawaiian Petrel habitat. Monitoring of Area B is done via use of binoculars to scan through the areas, as frequent monitoring by foot search is not recommended because it could degrade breeding habitat there. Searchers are able to access the edge of the cliff at the demarcation between Area A and Area B for visual scanning (binocular-assisted) of Area B. However, because Area B includes rocks and boulders of various sizes that would obstruct simple observation of bird carcasses, it cannot be covered adequately enough to accurately count downed birds. Visual scanning, however, is useful in detecting and recovering any downed birds in the open, so that they do not become a predator attraction.
In 2014, we added monitoring of the conservation fence (Figure 1) twice a week. On July 6th, USFWS notified us that such monitoring could be reduced to once every other week, and an adaptive management amendment to the BO confirming this was issued on July 29, 2014.
Results to date show no collision events were detected in 2011 (154 person-days), 2012 (304 person-days), 2013 (304 person-days), and no collisions have been reported thus far in 2014 (181 person-days) at the DKIST construction site (Areas A and B), the FAA/Coastguard towers, or along the conservation fence. If any collisions were to have occurred, the protocol is to record the following information: date, time, location coordinates, species, photo of the bird in question, and person attending. This information would be included in a report that would be forwarded to the U.S. Fish and Wildlife Service, HCP and Law Enforcement departments, and DOFAW. The downed birds or carcasses would be handled according to the official State of Hawai’i Downed Wildlife and the USGS Wildlife Health Center, Honolulu office protocols, and if still alive, injured individuals would be delivered to appropriate local Maui veterinarians. DKIST would fund any acute care and the bird’s transport, if necessary, to a permitted wildlife rehabilitation center (currently located on O’ahu and the island of Hawai’i).

9 | P a g e
Noise and Vibration Monitoring Hawaiian Petrel burrows nearest to construction are monitored for vibration and noise, to ensure the agreed upon thresholds documented in the HCP and BO are not exceeded during construction activities. Noise and vibration monitoring of the construction site is conducted by a third party, KC Environmental Inc. (KCE), and has been underway since December 1st, 2012, the first day of construction.
To measure vibration, measuring stations are equipped with seismometers; depending on the location of the vibration source, one or more of 6 measuring stations are used to monitor ground disturbance. Two seismometers have been consistently deployed at the two burrows nearest to construction (station 4 and 6 on Figure 3). As required by the HCP, noise producing activity is also monitored at the closest burrow to the construction footprint (SC-40 at map station 4, Figure 3); both at the burrow entrance, and at a distance of 5 meters from the burrow. Preliminary results show that as of June 30th, 2014, no construction activity has resulted in vibration meeting or exceeding the threshold of 0.12 in/sec.
KCE reported that noise levels at the burrow entrance have averaged about 56dBA during construction, which is not above ambient environmental level and about 10 dBA five meters closer to the source of noise. Most often, noise has not been above ambient wind levels at the burrow entrances, which can range up to 70+ dBA.
Figure 3. DKIST HCP Locations of Seismographs

10 | P a g e
Long-term Rodent Control Grid
In order to meet the minimum Special Local Need Supplemental Label (SLN) label requirements, a 50 meter grid layout plan was initially submitted by the DKIST team. However, after consultations with USFWS, it was agreed that the project would implement a denser 48-meter bait box grid of 51 stations. The newer 48 meter grid layout plan was approved by USFWS in March 2013, and the implementation of the grid was completed April 2, 2013.
Each station is equipped with a Protecta ™ tamper-resistant rat bait box and a mouse box. Due to the ongoing DKIST construction activities, 44 of the planned 51 stations are in place at this time (Figure 4). Each rat bait box was deployed with eight 1-oz Ramik™ diphacinone blocks, for a total of 22 pounds of diphacinone. The stations were checked after one week and then again in two weeks to evaluate the diphacinone take. However, the diphacinone SLN label expired on 05/30/2013. Thus, the use of diphacinone had to be discontinued, and the blocks were removed May 28, 2013. T-Rex rat and mouse snap traps baited with peanut butter have been deployed since then.
Resulting data from the diphacinone grid implemented from April 2, 2013 to May 28, 2013 showed only 6.6 oz. of diphacinone bait was taken. The snap traps used for the remainder of 2013 removed 18 field mice (Mus

11 | P a g e
musculus), 10 roof rats (Rattus rattus) and 2 unidentifiable rats (Rattus spp.). In 2014, 2 field mice and 3 unidentifiable rats were caught prior to June 30th.
The requirements in the new SLN label published in December 2013 have prohibited future diphacinone use in the Conservation Area due to boundary issues, because the label calls for the grid to be extended 225 meters past the resource to be protected, which crosses the neighboring boundaries of the National Park, the Air Force and Department of Hawaiian Homelands. We are working closely with USFWS and DOFAW to develop a new long-term rodent control grid methodology that is not regulated by an SLN label.
Conservation Fence and Ungulate Eradication A Conservation District Use Permit (CDUP) for the conservation fence was issued on May 17th, 2013. On July 25th, 2013 Rock N H Fencing Company was awarded the contract to construct the conservation fence. The construction started on September 1st, 2013 and was completed on November 18th. A total of 4.23 km (2.63 mi) of fence was built and 126.53 hc (312.66 ac) of Conservation Area was enclosed, which included 0.66 hc (1.64 ac) of Haleakala National Park land outside of the park fence (Figure 1). Installation of three strands of Poly-tape was completed on the fence on March 13, 2014 in compliance with HCP and BO requirements to prevent bird collision with the conservation fence.
As a result of the fence construction process and the intensive monitoring / conservation activities that were being implemented during the fence construction, all ungulates left the Conservation Area before the fence was completed. Based on footage from our ten long-term predator/ungulate monitoring camera traps and six additional ungulate monitor camera traps, no ungulates have been detected within the Conservation Area since September 12th, 2013.
Searcher Efficiency Trial (SEEF) In order to accurately evaluate the overall efficiency of carcass detection in the DKIST project area, searcher efficiency trials are conducted annually, beginning in 2013.
In accordance with the requirements of the HCP, these trials are to be conducted by a third party contractor, and are to take place unbeknownst to the searcher(s). KCE was the Maui-based third party contractor selected to conduct the 2013 & 2014 SEEF Trials on behalf of DKIST, in coordination with the Project’s resource biologist. The SEEF trials were undertaken between May 28th and August 26th, 2013 and between March 27th and June 5th, 2014 within the birdstrike monitoring Search Area A of DKIST’s approved Conservation Area, (Figure 2). As noted, search Area B, (Figure 2), is non-searchable on the ground by personnel due to extremely steep terrain, and instead is monitored via binoculars. For the trials, the DKIST resource management team operated as a sub-permittee of KC Environmental’s Migratory Bird Permit (USFWS 02/27/2013) and Protected Wildlife Permit (DLNR 03/04/2013). The procedure during SEEF trials is similar to birdstrike monitoring, except that surrogate Wedge Tailed Shearwater (Puffinus pacificus) carcasses are returned to a cooler after discovery at the site and events are reported only to KC Environmental, with photos, bird tag numbers and coordinates included in the report.
For the trials, twenty carcasses were placed on the ground for each trial on random days and in random quantities. Of the 20 placed during the 2013 trial period, 17 carcasses were found, resulting in a searcher

12 | P a g e
efficiency rate of 85%. In the 2014 trial, 18 of the 20 dropped carcasses were found, resulting in a searcher efficiency rate of 90% for the DKIST Resource Management team. (Fein and Allan 2013a, 2014a).
Carcass Removal Trial (CARE)
Figure 5. DKIST HCP CARE Trial Location
Pursuant to the HCP and BO, multiple CARE trials are to be conducted each year, for an estimated mitigation period of 6 years. Carcass removal trials are undertaken to determine the DKIST scavenging rate by cats, rats and mongoose or other scavengers of any birds killed via birdstrike. This information will be used to guide search intervals for birdstrike monitoring for the DKIST project, and these trials are to be conducted by a third party contractor. The 2013 fall and 2014 spring CARE trials were undertaken by KC Environmental, Inc. between September 30th and October 30th, 2013 and between May 18th and June 15th, 2014 in approved locations within the Conservation Area that were at least 50 meters from a Hawaiian petrel burrow and 30 meters from baited traps (Figure 5).
Carcasses were placed in a variety of positions including two that were exposed (thrown), one hidden to simulate a crippled bird and one partially hidden.
The 2013 fall CARE trial yielded zero scavenging rates at three of the four carcass locations over a period of thirty days. One bird was removed from a partially concealed location within two weeks of placement, with only feathers left behind. None of the 2014 spring CARE trial carcasses were scavenged. The results of the 2014

13 | P a g e
spring CARE trial are consistent with the experience of the DKIST Resource Management team, in that we have found carcass remains in the Conservation Area that are often more than a year old. The CARE trials showed further evidence that scavenging rates at these higher altitudes is extremely low. Indeed, after two such trials, only one surrogate bird showed any sign of scavenging. These outcomes and corroborating field experience all continue to suggest that the 10% carcass removal rate used in the calculation of unobserved take for DKIST may be too high. We believe that almost all carcasses are recorded in the search areas for DKIST, because the predation rate is very low, and even the rare predation that takes place does not seem to remove all evidence of bird mortality for as long as a year or more. The longevity of carcasses in the field also indicates that searches for downed birds at the elevations of the Conservation Area may not have to be as frequent as thought before evidence from these CARE trials and field experience became available. (Fein and Allan 2013b, 2014b).
Rodent and Predator Population Monitoring While these efforts are not required by the HCP, the DKIST resource management team has implemented invasive mammal monitoring programs, in addition to the control program noted above, to help achieve net recovery benefit through an adaptive management approach. Rodent population monitoring grids and predator/ungulate population monitoring camera traps in the Conservation Area and Control Site are part of these efforts.
Table 1. 2013 Rodents Caught in DKIST Rodent Monitoring Grids 2013
Season Spring Summer Fall Winter Spp./location Control Conservation Control Conservation Control Conservation Control Conservation
Roof Rat 0 1 0 0 0 1 1 1 Norway Rat 0 0 0 0 0 0 0 0 Polynesian Rat 0 0 0 0 0 0 0 0 Field Mouse 0 0 1 0 1 0 0 1 Unidentifiable 0 0 0 0 0 0 0 0
2014 Roof Rat 2 0 2 0
n/a n/a Norway Rat 0 0 0 3 Polynesian Rat 0 0 0 0 Field Mouse 0 0 0 0 Unidentifiable 1 0 0 0
Using the existing Long-Term Rodent Control Grid discussed above, rodent monitoring involves a 48 m grid system consisting of twenty stations in the Conservation Area, and twenty stations in the Control Site. These two rodent population monitoring grids are 2,030 meters apart to ensure the independence of the Control Site grid from our Long-Term Rodent Control Grid treatment. For this monitoring, each Station was equipped with a T-Rex rat and a T-Rex mouse trap housed in Protecta tamper-resistant bait boxes. Peanut butter was used as bait and the traps were pre-baited one week before the traps were set. Each monitoring period consisted of two trap nights. The rodent population was monitored seasonally in March, June, September and December of each year (Figure 6). Table 1 summarizes the rodent monitoring results. The capture rate is low; at most only three rodents were caught during each season in each grid.
14 | P a g e
Ungulate/predator population monitoring data was collected with camera traps. Twenty Bushnell Trophy Cam HD camera traps, ten at each site (Conservation Area and Control Site), were installed at random locations generated by ArcGIS 10.0 on 04/23/2013 in the Conservation Area and on 04/24/2013 in the Control Site (Figure 6). Six additional camera traps were mounted at six selected fence posts along the fence line between 12/03/2013 and 02/11/2014, where previous goat tracks were detected, to monitor whether ungulate eradication was needed (Figure 6).
Predator Control In 2012, after examining footage from surveillance cameras, the presence of a feral cat below MEES Observatory was discovered. Camera footage revealed that the feral cat had visited five different burrows and entered at least one. A Havahart trap was set near burrow SC37 just below MEES Observatory on September 13, 2012. Friskies brand cat food was used as bait. The trap was labeled (CT001) along with the GPS coordinates of the trap location. The cat was captured and removed from the site.
After consulting with USFWS, a 125-meter Predator control grid system was installed consisting of 18 Havahart traps (for cats) and 19 A-24 automatic traps (New Zealand Goodnature Company, for mongoose) that cover the northern part (the lower portion with higher risk of predation) of the Conservation Area. This grid is not as

15 | P a g e
uniform as it appears in plan -- in the actual on-ground layout of the grid; we avoided placing traps within 50 meters of any known petrel burrow to avoid attracting predators into petrel colonies. Each Havahart trap was equipped with a Telonics TBT-600NH trapsite transmitter to allow the traps to be monitored at least every other day to avoid petrel by-catch and to ensure the welfare of the trapped animals. The installation of the northern trap grid was completed on 09/16/2013, and was operational until 11/18/2013, when all known petrels left the Conservation Area.
In order to improve the predator control efficiency, USFWS predator control experts recommended that the project employ a more unified predator control grid system. Based on this recommendation, the DKIST resource management team installed twenty two additional cat traps and twenty three new mongoose traps, and relocated the traps in the northern half in 2014. The new grid of forty cat traps and forty-two mongoose traps was completed on June 19th, 2014 (Figure 6).
No cats or Indian small mongoose have been caught since the predator grid became operational. The A-24 traps killed three roof rats and the Havahart traps caught two roof rats.
HAWAIIAN PETREL REPRODUCTIVE SUCCESS MONITORING METHODS
Personnel Training All current members of the DKIST Resource Management Team received extensive training in 2011. This training included both field and administrative training. Members were trained on petrel carcass search and handling, petrel burrow identification, classification of burrow status based on signs of petrel activity, and avoidance of cultural resources during field work. In addition, the Predator Control Technician is certified for Commercial Applicators of Restricted Pesticides and each member was trained in handling rodenticide and rodent carcasses. Two of the team members were either State of Hawai’i Hunter Education certified or NRA firearm certified. All members were previously trained in the use of GPS and ArcGIS software and all completed First Aid/First Responder and CPR certifications.
Petrel Burrow Search The DKIST Resource Management Team began monitoring known burrows and searching for new burrows in the HCP Conservation Area and Control site on August 10th in 2011, on February 22nd in 2012, on May 7th in 2013 and on May 7th in 2014. Monitoring ended on November 16th in 2011, on November 10th in 2012 and on October 24 in 2013, when the petrel chick from the last known burrow fledged. The team begins annual monitoring by visiting all the burrows that were recorded from previous breeding seasons. Any newly identified burrows are documented as they are discovered and a systematic search of the Conservation Area and Control Site is also conducted. Coordinates of the newly discovered burrows are recorded with handheld Garmin Oregon 450 and 550 GPS units. Signs of petrel activity (feathers, droppings, egg shells, footprints, regurgitation, odor and other body parts) and GPS coordinates at each burrow were recorded. Toothpicks were placed vertically along the entrance of each burrow to monitor petrel movement in and out of burrows; fallen or height-altered toothpicks suggested current activity, while undisturbed toothpicks denoted no activity (Hodges 1994, Hodges & Nagata 2001).

16 | P a g e
Monitoring Hawaiian Petrel Reproductive Success Breeding success was classified based initially on signs at the entrance, status of placed toothpicks, and the latest date of activity. Burrows that were classified as “Active” were then re-checked weekly until signs of a successful or failed fledging were observed. Using the same methodology as employed by the Haleakalā National Park (Hodges 1994, Hodges & Nagata 2001), a burrow was defined to be “successful” by the presence of petrel chick down feathers at the burrow entrance, and disturbed toothpicks after mid -September of each year. Burrows classified as “failed” showed signs of activity during initial search, but no further signs were found while conducting the subsequent rechecks, which suggested these burrows were either occupied by non-breeders, the nest was abandoned, or the chicks did not reach fledgling age.
In addition to mechanical means of monitoring, cable surveillance video cameras were also installed to monitor petrel activities at 18 active burrows adjacent to the MEES Observatory. In 2013, 16 Bushnell “Trophy Cam HD™” camera traps were installed between 10/15 and 11/07/2013 at 16 burrows outside of the cable accessible area that were still active in mid-October to monitor the Hawaiian Petrel reproductive success. In 2014 KC Environmental resumed surveillance by video monitoring of the burrows on February 1st.
HAWAIIAN PETREL REPRODUCTIVE SUCCESS MONITORING RESULTS AND DISCUSSION
Petrel Burrow Search Table 2 summarizes the number of burrows recorded in the past four seasons.
Table 2. Hawaiian Petrel Burrows Found in the DKIST HCP Conservation Area and Control Site on Haleakala, Maui, Hawaii. Year 2011 2012 2013 2014*** Status New Old New Old New Old New Old Conservation Area* 117 91 22 259 6 281 5 295 Control Site 21 0** 4 21 1 25 3 26 *Due to the newly marked boundary, the numbers of burrows included in our monitoring results varied annually before the conservation fence was built in 2013. In addition, the NPS identification of burrows was often duplicated for a single burrow, or a burrow identified singly might have multiple entrances. **New site that year. *** Ongoing, not finalized.
Burrow Status and Fledging Success Based on our monitoring data, Hawaiian Petrel burrows were classified as “Active”, “Not Active” and “Not A Burrow” (collapsed burrow). In our analysis, only burrows that were either “Active” or “Not Active” and were inside the boundary were included.
Due to adverse weather conditions in 2013, we were unable follow up on fledging events at six burrows in the Conservation Area. However, based on our previous experience and signs of activity at the burrow entrances, we postulated these to be possible successful burrows, as was the case in 2011.
Note that the numbers of burrows included after the 2013 status is different from reports of previous years, due to the newly marked boundary, and therefore there are burrows that are now outside of DKIST’s Conservation

17 | P a g e
Area. Table 3 summarizes the adjusted status of burrows found between 2011 and 2014, and the success/failure statistics. Since DKIST’s Conservation Area boundary was redefined based on the certified surveyors’ marking in 2013, the data from the following burrows is no longer being included in this or future data analysis: Five failed burrows, one possible successful burrow and four not active burrows that were found in 2011; one failed burrow and thirteen not active burrows found in 2012.
In order to evaluate whether the DKIST conservation fence and predator/rodent control grids have promoted recovery for the Hawaiian Petrel in the Conservation Area, we compared the trends of active burrow numbers and successful burrow numbers between the Conservation Area and Control Site. Although the number of successful burrows and fledgling success rate fluctuated in the Conservation Area and remained at zero in the Control Site during the last three seasons, the number of active burrows steadily declined in both the Conservation Area (by 22%) and Control Site (by 38%). The overall decline of 23% is somewhat troubling, in that almost one quarter of the potential breeders did not return to the colonies during this period of time. It’s important to note that these declines were both in the Conservation Area and Control Sites.
The preliminary data for 2014 shows signs of a rebound in the Conservation Area, with an increase from 126 active burrows in 2013 to 168 active burrows at the time of this report (data is still ongoing for the 2014 season). However, the active burrow numbers in the Control Site continue to decline (Table 3 and Figure 7). During this period of time, the only changes were the erection of the conservation fence and implementation of the predator/rodent control grids in the Conservation Area.
“Nesting Activity” (the proportion of burrows surveyed that show signs of burrow activity) and “Nesting or Fledgling Success” (the proportion of active burrows that show signs of fledging chicks) (Hodges & Nagata 2001), was also compared between the Conservation Area and Control Site, as shown in Table 3. A significantly (p<0.05) higher percent of Nesting Activity in the Conservation Area is apparent in three out of the four years compared to the Control Site. Due to 0 % Nesting (Fledging) Success recorded in the Control Site, Chi Square statistical analysis was not appropriate. The percent of Nesting Success in the Conservation Area decreased from 2011 to 2012, then rebounded and surpassed the 2011 level in 2013. The percent Nesting Success data for 2014 was not available at the time this report was written.
In 2011 and 2013, some burrows were classified as “Possibly Successful”. We performed two calculations; the first calculation included both “Successful” and “Possibly Successful” burrows, while the second calculation was performed using only the “Successful” burrows while the “Possibly Successful” were designated as failed. These two calculations reflect both the worst case and best case possible scenarios, based on our interpretation of the data collected during the previous breeding seasons (Table 3).
Of additional note is that 2013 was the first year that any burrow successfully fledged a chick below 9,300 ft. elevation. This was likely due to the implementation of the predator control grid in the northern part of the Conservation Area and the ungulate fence construction was underway (Figure 8).
The analyses of active burrow number/% and Nest Success trends in the Conservation Area and Control Site suggest that the DKIST conservation fence and predator/rodent control grids implemented in the Conservation Area not only stopped the decline in the natural Hawaiian Petrel population as recorded in the Control Site, but that these measures also facilitated the petrel population and Nesting Success increase in the Conservation Area.
18 | P a g e
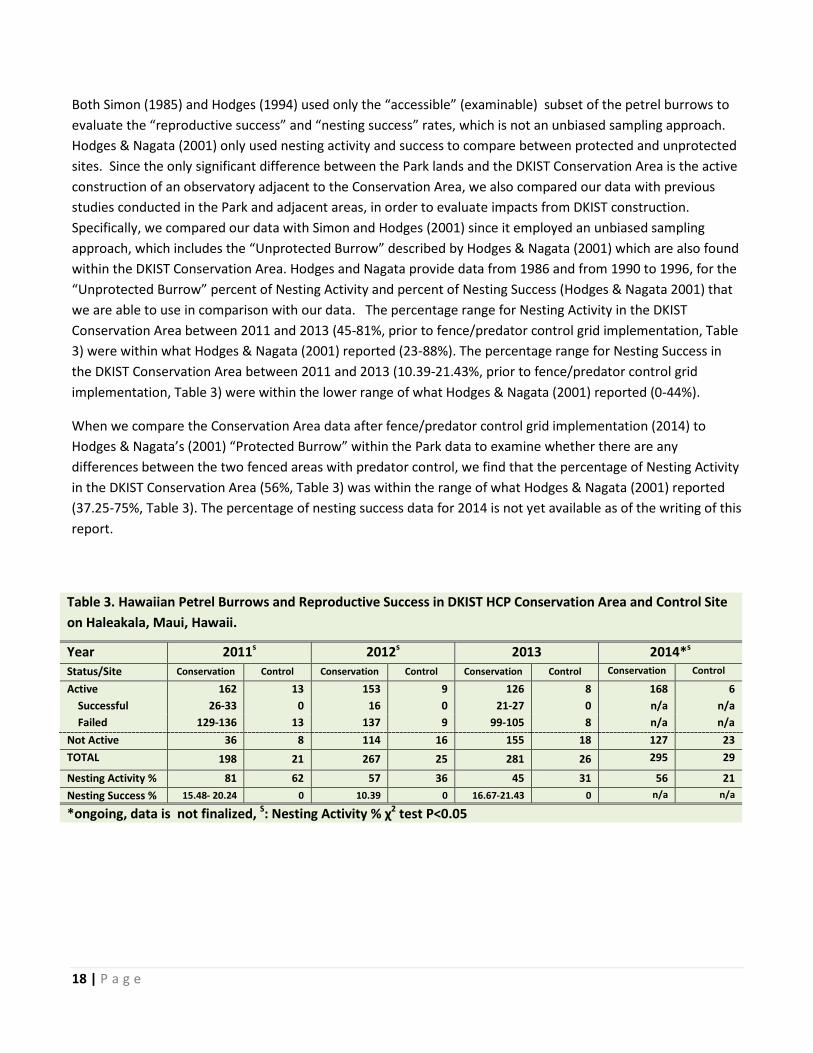
Both Simon (1985) and Hodges (1994) used only the “accessible” (examinable) subset of the petrel burrows to evaluate the “reproductive success” and “nesting success” rates, which is not an unbiased sampling approach. Hodges & Nagata (2001) only used nesting activity and success to compare between protected and unprotected sites. Since the only significant difference between the Park lands and the DKIST Conservation Area is the active construction of an observatory adjacent to the Conservation Area, we also compared our data with previous studies conducted in the Park and adjacent areas, in order to evaluate impacts from DKIST construction. Specifically, we compared our data with Simon and Hodges (2001) since it employed an unbiased sampling approach, which includes the “Unprotected Burrow” described by Hodges & Nagata (2001) which are also found within the DKIST Conservation Area. Hodges and Nagata provide data from 1986 and from 1990 to 1996, for the “Unprotected Burrow” percent of Nesting Activity and percent of Nesting Success (Hodges & Nagata 2001) that we are able to use in comparison with our data. The percentage range for Nesting Activity in the DKIST Conservation Area between 2011 and 2013 (45-81%, prior to fence/predator control grid implementation, Table 3) were within what Hodges & Nagata (2001) reported (23-88%). The percentage range for Nesting Success in the DKIST Conservation Area between 2011 and 2013 (10.39-21.43%, prior to fence/predator control grid implementation, Table 3) were within the lower range of what Hodges & Nagata (2001) reported (0-44%).
When we compare the Conservation Area data after fence/predator control grid implementation (2014) to Hodges & Nagata’s (2001) “Protected Burrow” within the Park data to examine whether there are any differences between the two fenced areas with predator control, we find that the percentage of Nesting Activity in the DKIST Conservation Area (56%, Table 3) was within the range of what Hodges & Nagata (2001) reported (37.25-75%, Table 3). The percentage of nesting success data for 2014 is not yet available as of the writing of this report.
Table 3. Hawaiian Petrel Burrows and Reproductive Success in DKIST HCP Conservation Area and Control Site on Haleakala, Maui, Hawaii.
Year 2011s 2012s 2013 2014*s Status/Site Conservation Control Conservation Control Conservation Control Conservation Control
Active 162 13 153 9 126 8 168 6 Successful 26-33 0 16 0 21-27 0 n/a n/a Failed 129-136 13 137 9 99-105 8 n/a n/a Not Active 36 8 114 16 155 18 127 23 TOTAL 198 21 267 25 281 26 295 29
Nesting Activity % 81 62 57 36 45 31 56 21 Nesting Success % 15.48- 20.24 0 10.39 0 16.67-21.43 0 n/a n/a
*ongoing, data is not finalized, S: Nesting Activity % χ2 test P<0.05

19 | P a g e
Based on the preliminary comparison of the published data, no signs of negative impacts on the Hawaiian petrel population and reproductive performance can be detected from the DKIST construction activities as interpreted from these trend fluctuation range comparisons. To conduct further year to year statistical Chi Square analysis,
0
5
10
15
20
25
30
35
2011 2012 2013
Num
ber
Year
Figure 7. Number of Successful Hawaiian Petrel Burrows From 2011 to 2013 in DKIST HCP Monitored Areas on the Summit of Haleakala Volcano, Maui
Successful Burrows inConservation Area High Estimate
Successful Burrows inConservation Area Mean Estimate
Successful Burrows inConservation Area Low Eastimate
Successful Burrows in Control Site
y = 0.0009x - 8.0213 R² = 0.6
-0.2
0
0.2
0.4
0.6
0.8
1
1.2
8800 9000 9200 9400 9600 9800 10000 10200
burr
ows/
hect
are
elevation (ft)
Figure 8. Successful Hawaiian Petrel Burrow Density at Different Elevations in DKIST HCP Conservation Area From 2011 to 2013
density of successfull burrows2011
density of successfull burrows2012
density of successfull burrows2013
density of successfull burrows total
Construction Started in 12/2012
Note: Not including possible successful burrows

20 | P a g e
we will consult with NPS Haleakalā biologist Cathleen Bailey, to acquire the percent of “Protected Burrow” Nesting Activity and the percent of Nesting (Fledgling) Success from 2011 to 2014. Use of “Fledgling Success / Nesting Success “versus “Reproductive Success” Of additional note in this discussion of fledgling success, the term “reproductive success” is typically monitored in Procellariiformes through the use of burrow scopes. However, due to the topography of the burrows at the summit area of Haleakalā, this is not a viable option. The burrows in the summit area have many acute angles and a burrow scope is not able to be inserted fully, and possibly not to the location of the nest. In addition, because of the angles within the burrows, there is a significant chance of damaging the burrows and contributing to nest failure with the use of a scope. Such reduced reproductive success in intensively monitored Procellariiformes (Oceanodroma and Pterodroma) burrows has been reported in Marks & Leasure (1992), Boersma et. al. (1980), Blackmera et. al. (2004) and Bester et. al. (2007). Carey (2009) summarized the short and long term impact on Procellariiformes from monitoring activities. Although burrow scopes were initially attempted, in subsequent years, such methodology was deemed unsuitable for this project for the reasons described above, and this fact has been addressed in previous reports to DOFAW and USFWS. As a result, the actual number of petrel nest burrows that contained an egg is unavailable. With this consideration, and after discussing this situation with other biologists who have worked in this area and encountered the same limitations, it was determined it would be best to use and compare (Chi Square test) “fledgling success” or “nesting success” (Hodges 1994, Hodges & Nagata 2001, Bailey personal communication 2014) with the same outcomes from the Park, instead of using the “reproductive success” Tetra Tech 7-stage matrix model stated in the BO to evaluate DKIST construction impacts and net benefits. “Fledgling success” is estimated by dividing the total number of burrows that fledged one petrel chick by the number of active burrows of the same season, while in “reproductive success” this number is divided by the number of burrows that contained an egg. The HCP states that ‘Two metrics will be used to assess levels of take resulting from the project: burrow breeding status (active versus inactive) and fledging success. We note that this measurement of fledging success is the methodology most appropriate for this site (which is better known now than at the time the HCP and BO were written), though there is wording in the original HCP and BO matrix, that also refers to ‘reproductive success’. Therefore, in view of the disparity between the models in the BO and HCP, and the practical limitations described above, we have initiated a request for further discussions with DOFAW and USFWS to find a way forward with compliance. We believe that an amendment to the documents will be required in order for the project to be in full compliance as we move forward. We present a further discussion of the use of models for DKIST compliance in the next section. Use of Models After four years of the biological fieldwork, we propose to re-assess reliance on the models used prior to the start of the DKIST Project to judge the success of mitigation. For example, Holmes’s Leslie model in the HCP and both Holmes’s Leslie model and Laura Nagy’s 7-stage matrix model in the BO were used to predict population growth, and thus to evaluate the Net Recovery Benefit from DKIST conservation measures (ungulate fence and predator/rodent control), or impacts from construction activities. More than 60% of a petrels’ life is spent on the open ocean, yet these two models don’t account for the effects of global environmental changes on the

21 | P a g e
petrel survival rate and reproductive potential. These factors include such variables as global weather change, Fukushima debris and radiation pollution in the North Pacific Ocean, over-fishing of pelagic fish, etc.
These two population models reflect the product of only two factors: (a) the impact from DKIST construction (if there is no other environmental impact on the summit), and (b) predator control. However, there is no consideration of the third variable of (c) natural population trends and overall outside impacts.
Our data during the past three years has shown that many “Not Active” or “Not A Burrow” burrows from previous years could become “Active” another year. Previously “Active” burrows could be “Not Active” in one year and become “Active” again during another year. We also record several natural death events each year, and would assume that some individuals also perish at sea. These observations indicate that frequent petrel emigration, immigration, or new recruitment and mortality occur in this sub-population, and breeding adults might not breed every year. Several researchers (e.g. Berman et. al. 2009) also found patterns of an increase in reproductive performance with age in Procellariiformes. These facts help us better understand that the petrels monitored in the Conservation Area are part of a very dynamic population, and not a closed population. Since both the HCP and BO assumptions in the population estimate matrices are suspect, they could be quite misleading with respect to accurately estimating the petrel population.
Estimating actual petrel survival rate also requires long term large banding/recovery data, which is very difficult to acquire (Simons only recaptured 15 out of 36 banded adult petrels during his 3-year study period) and not available (HALE doesn’t have the data to compare with either). The population models in the HCP and BO require both “reproductive success” and annual “survival rate” data, neither of which is available from empirical data. This is not a unique situation to our project; all parties monitoring Hawaiian Petrel populations face the same challenge.
With these limitations, we believe that the most appropriate approach to demonstrate ultimate Net Recovery Benefit is to compare population trends (active burrow number) and fledging success between the Control Site and the Conservation Area, and the most suitable approach to detect impacts from DKIST construction is to compare population trends and fledging success between the adjacent National Park and Conservation Area, as stated in the HCP. This approach is the basis of our request for further discussions with DOFAW and USFWS. Hawaiian Petrel Mortality Table 4 summarizes all mortality events recorded between the 2011 and 2013 breeding seasons. Invasive mammalian predators were the cause of 68.2% of all detected petrel mortality in DKIST’s HCP encompassed area.
In 2014, prior to June 30th, only one predated, deceased adult was discovered in front of a burrow, not likely related to DKIST activities.
We recorded the smallest fraction (1/3) and number (3) of predation induced mortalities in 2013. According to our findings from 2011 to 2013, predation was more likely to occur in the lower portion of the DKIST HCP monitored area. In order to standardize the impact of predation at different elevations, we used predation/trampling density (events/hectare) as the metric in this analysis. We found a strong negative correlation (R2>0.49) between predation/trampling events density and elevation in 2011, 2013 and the sum of

22 | P a g e
all three years in the DKIST Conservation Area, and no predation/trampling event was recorded above 9,800 ft. elevation, closest to DKIST active area (Figure 9). This result suggests a reduced predation event density nearest to the DKIST construction site. Concentrated human activity during the day at the summit area may have reduced predator activities or predation frequency.
Table 4. Hawaiian Petrel Mortality Events Recorded between 2011 and 2013 in DKIST HCP Conservation Area and Control Site Year 2011 2012 2013*
Age/Site Conservation Area Control Site Conservation
Area Control Site Conservation Area Control Site
Other
Egg 4 0 1 0 1 0
Chick 2 0 0 0 2 0
Adult 1 0 0 0 3 0 Predation**
Egg 1 0 2 0 0 0
Chick 6 3 1 0 3 0
Adult 1 9 3 1 0 0 TOTAL 15 12 7 1 9 0
* Not including a burrow trampled by ungulates in the early stage of breeding season, and an adult and a chick mortality event that occurred prior to 2013. ** including burrows trampled by ungulates
The overall petrel mortality events recorded in our monitoring area underwent a steady decline; from 27 in 2011 down to nine in 2013, and predation/trampling events, from 20 in 2011 down to three in 2013, in both the
R² = 0.5243
R² = 0.4909
R² = 0.4278
R² = 0.5586
-0.4
-0.2
0
0.2
0.4
0.6
0.8
1
1.2
1.4
8800 9000 9200 9400 9600 9800 10000 10200
even
t/he
ctar
e
Elevation (ft)
Figure 9. The Densities of Predation/Trampling Events at Different Elevations Recorded in DKIST HCP Conservation Area From 2011 to 2013
# of predation/trampling 2011
# of predation/trampling 2012
# of predation/trampling 2013
# of predation/trampling total
Linear (# of predation/trampling2011)Linear (# of predation/trampling2012)Linear (# of predation/trampling2013)

23 | P a g e
Conservation Area and Control Site (table 4). This may coincide with the feral goat reduction that occurred with the building of the fence in the Conservation Area--possibly just the construction, intensive monitoring and predator control activities were sufficient to reduce predator presence and predation on Hawaiian Petrel in both the Conservation Area and Control Site.
In order to understand whether DKIST construction activities resulted in the decline of active Hawaiian Petrel burrow numbers, we examined the trend of active burrow numbers adjacent to the DKIST construction site (Figure 10). We found that the number of active petrel burrows actually increased in this area (Figure 11).
Based on the trend of reduced predation events (which was assumed to help increase the active burrow number), increased active burrows adjacent to DKIST site, and decreased overall active burrow numbers between 2011 and 2013, we speculate that the decline of active petrel burrows recorded in the larger DKIST HCP monitoring area probably occurred outside of the breeding colonies or during nonbreeding season, when they were travelling on the open ocean, and not while the petrels were in the breeding colonies. DKIST construction did not begin until December of 2012, making it unlikely that construction activities were the cause of the decline between 2011 and 2013.

24 | P a g e
Fledgling Dates
Figure 12 presents the overall fledging date from 2011-2013 in weekly intervals. Simon (1985) reported the Hawaiian Petrel fledging date as: the fledging period extended from 8 October to 30 October during the three
0
5
10
15
20
25
2011 2012 2013*
Figure 11. Number of Active Hawaiian Petrel Burrows Adjacent to DKIST Construction Site at the Summit Area of Haleakala Volcano, Maui in 2011-2013
Successful
Failed
0
5
10
15
20
25
before 2ndweek*
2nd week 3rd week 4th week 5th week 1st weekNov
October November
Figure 12. Hawaiian Petrel Fledging Dates Observed at the Summit Area of Haleakala Volcano, Maui in 2011-2013 by ATST resource Management Team
2013
2012
2011
*Construction started
25 | P a g e
years of the study. The median fledging date was 23 October ±6.5 days in 1979, 19 October ±6.7 days in 1980, and 19 October ±6.1 days in 1981. In 2011, eight of the 17 burrows being monitored by cameras were successful. Based on the video recordings of the eight successful burrows around MEES Observatory, the earliest fledging date was on 10/19 and the latest date was on 10/25 (median date: 10/22). In 2012, six of the 18 burrows being monitored by cameras were successful. Based on the video recordings of the six successful burrows around MEES Observatory, the earliest fledging date was on October 12, 2012 and the latest date was on October 19, 2012 (median date 10/17). In 2013, seven of the 19 burrows being monitored by cameras were successful in fledging petrels. We also placed 16 camera traps at active burrow sites outside of the MEES Observatory area. Among these 16 additional camera traps, we recorded fledging dates at 10 burrows. Based on 17 image recordings, the fledging dates were between 10/10 and 10/24 (median date: 10/19). The fledging date collected from 2011 to 2013 was within the range of what Simons (1985) reported, such that no impact on petrel fledging dates from DKIST construction activities could be detected.

26 | P a g e
Silversword Monitoring
A cluster of 12 different age groups and 2 individual seedling Silversword (Argyroxiphium sandwicense macrocephalum) plants were located within the Conservation Area in the last four seasons (Figure 13 & 14). Four of the plants are flowering this year. We also observed natural Silversword regeneration at the Air Force Observatory site. These plants suggest that there is a viable seed bank in local soil and future natural regeneration is possible. We will contract with certified botanist to collect and propagate seeds when seeds are ready later this year for future outplanting.

27 | P a g e
Figure 14. Cluster of 12 Haleakala Silversword (Argyroxiphium sandwicense macrocephalum) Found Within DKIST Fenced Conservation Area as Shown in Figure 13
Summary of Results Above: Petrel Collision: DKIST didn’t detect any Hawaiian Petrel collisions with any DKIST related structures between June 7th, 2011 and June 30th, 2014. Predation Mortality: DKIST mitigation measures have reduced predation mortality by 80% (15 to 3) within the Conservation Area (62.5% overall) in the last three years. Impact on Nesting Activity and Fledgling Success: Hawaiian Petrel nesting activity and fledging success range were within the fluctuation range of published data collected within and around HALE. The results also demonstrate that conservation measures implemented in the Conservation Area have prevented petrel population decline, and also showed signs of net benefits, when compared to the Control Site. Fledging Dates: No obvious fledging date changes could be detected in the last three years, when compared to published data collected within and around HALE. FOR FURTHER DISCUSSION: FUTURE HCP COMPLIANCE ISSUES
1) Exploring the Need to Implement the Following Measures: o Hawaiian Petrel Social Attraction/Artificial Burrows
The purpose of these two measures was to recruit non-breeders into managed vacant areas to compensate for the effects of lack of suitable burrows. However, since 150+ non active burrows have been recorded in the Conservation Area each year, it would seem artificial burrows may not be necessary due to an excess of unoccupied burrows. We also have recorded 120-160 active breeding pairs exhibiting courtship behavior in the last three seasons, suggesting that there are more “real

28 | P a g e
petrels” attracting other petrels into a “hospitable habitat” than recordings/decoy birds can accomplish. Another aspect to consider is that predation of live Hawaiian petrels is still a threat in the Conservation Area, and broadcasting courtship sounds might attract predators into the area. We are also concerned that broadcasting petrel sounds might disturb the behavior of the local population. These may be future adaptive management measures to be implemented if net recovery benefit does not meet annual objectives; however, it appears that net recovery benefit can be achieved without implementing social attraction/artificial burrows.
o Silversword Outplanting The DKIST resource management team is planning to contract with certified botanists to collect part of the seeds and propagate the seeds from the Conservation Area population when seeds are ready later this year for future outplanting. We will also carefully monitor whether natural Silversword regeneration has occurred in the coming seasons within the fenced area. However, if it does occur, this may suggest that a viable natural seed bank is already in place, suggesting additional efforts may not be warranted.
o Monitoring Burrow Structures in the Impact Area KC Environmental has been developing a new burrow scope with a remote directional control capacity for this purpose. Once and if it passes the initial test period, monitoring impact to burrow structures adjacent to DKIST construction site will be implemented. This burrow scope will only be used for this purpose during the non-breeding season due to concern of causing burrow damage during the breeding season.
o Landscape Scale Rodent Control This landscape scale short term rodent control 50 m grid was required only in the BO. The largest landscape scale rodent control grid in Hawaii is at the 20-ha Ka’ena Point Natural Area Reserve. The world’s largest 307-ha Orokonui Ecosanctuary of New Zealand employed aerial broadcasts (which is still illegal in Hawaii). Both sites were equipped with “predator-proof” fences to prevent rodent re-ingress. Without a predator proof fence, rodent re ingress will be constant. We would like USFWS to reconsider this requirement.
2. Changes in Reproductive Success Monitoring: Noting the limitations in monitoring reproductive success and survival rates, we suggest the following changes to the models being used:
o To demonstrate HCP Net Recovery Benefit: Compare population trends and fledging success between the Control Site and Conservation Area, (as opposed to the current HCP and BO methods of using population predicting matrices). Compare number of predation events to demonstrate impact of predator control.
o To evaluate DKIST Construction Impacts: Compare population trends and fledging success between Control Site and HNP data (same as stated in HCP, as opposed to BO methods of 7-stage population matrix).

29 | P a g e
REFERENCES
Adams, J. 2006. Hawaiian Petrel- ‘Ua‘u. Oikonos. http://www.oikonos.org/projects/uau.htm
Advanced Technology Solar Telescope. 2010. Habitat Conservation Plan for Construction of the at the Haleakalā High Altitude Observatory Site Maui, Hawai‘i. Maui.
Ainley, D. G., R. Podolsky, L. de Forest, G. Spencer, and N. Nur. 1995. The ecology of Dark-rumped Petrels and Newell’s Shearwater on the island of Kaua‘i, Hawai‘i. Kaua‘i Endangered Seabird Study Vol. 2.
Ainley, D. G. Podolsky, R. DeForest, L. Spencer, G. 1997.New Insights into the Status of the Hawaiian Petrelon Kauai. Colonial Waterbirds, 20( ):24-30.
Berman, M., J.-M. Gaillard and H. Weimerskirch. 2009. Contrasted patterns of age-specific reproduction in long-lived seabirds. Proc. R. Soc. B 2009: 375-382
Bester, A.J., D. Priddel, N. I. Klomp, N. Carill and L. E. O’NEILL. 2007. Reproductive success of the Providence Petrel Pterodroma solandri on Lord Howe Island, Australia. Marine Ornithology 35: 21–28.
Blackmera A. L., J. T. Ackermanb and G. A. Nevitta. 2004. Effects of investigator disturbance on hatching success and nest-site fidelity in a long-lived seabird, Leach's storm-petrel. Biological Conservation 116(1): 141–148.
Boersma, P. D., N. T. Wheelwright, M. K. Nerini, and E. S. Wheelwright. 1980. The Breeding Biology of Fork-Tailed Storm-Petrels (Oceanodroma furcata). Auk 97(2): 268-282.
Bourne, W. R. P. 1965. Observations of Seabirds. Sea Swallow 17:10-39.
Browne, R. A., D. J. Anderson, J. N. Houser, F. Cruz, K. J. Glasgow, C. N. Hodges and G. Massey. 1997. Genetic Diversity and Divergence of Endangered Galápagos and Hawaiian PetrelPopulations. Condor, 99(3): 812-815.
Carey M. J. 2009. The effects of investigator disturbance on procellariiform seabirds: a review. New Zealand Journal of Zoology 36: 367-377.
Chen, H., C. Ganter, J. Panglao, and B. Rogers. 2011. ATST 2011 Hawaiian PetrelMonitoring Report. ATST.
Chen, H., C. Ganter and J. Panglao. 2012. ATST 2012 Hawaiian PetrelMonitoring Report. ATST.
Chen, H., C. Ganter and J. Panglao. 2013. ATST 2013 Hawaiian PetrelMonitoring Report. DKIST.
Day, R. H. and B. A. Cooper. 1995. Patterns of Movement of Dark-Rumped Petrels and Newell's Shearwaters on Kauai. Condor, 97(4):1011-1027.
Fein, C and L. Allan. 2013a. Advanced Technology Solar Telescope (ATST) 2013 Searcher Efficiency Trial (SEEF) Report.
Fein, C and L. Allan. 2013b. Advanced Technology Solar Telescope (ATST) 2013 Fall Carcass Removal Trial (CARE) Report.

30 | P a g e
Fein, C and L. Allan. 2014a. DKIST 2014 Searcher Efficiency Trial (SEEF) Report.
Fein, C and L. Allan. 2014b. DKIST 2013 Fall Carcass Removal Trial (CARE) Report.
Haleakalā National Park. 2011. Weather. http://www.nps.gov/hale/planyourvisit/weather.htm.
Harrison, C. S. 1990. Seabirds of Hawaii: Natural History and Conservation. Cornell University Press, Ithaca and London.
Hodges, C. S. N. and R. J. NAGATA Sr. 2001. Effects of Predator Control on the Survival and Breeding Success of the Endangered Hawaiian Dark-rumped Petrel. Studies in Avian Biology 22:308-318.
Hodges, C. S. N. 1994. Effects of Introduced Predators on the Survival and Fledging Success of the Endangered Hawaiian Dark-rumped Petrel (Pterodroma phaeopygia sandwichensis). Master Thesis, University of Washington.
Holmes, N. 2010b. Impacts of the Advanced Technology Solar Telescope Construction on Hawaiian PetrelsPterodroma sandwichensis, Haleakala: Recommendations for mitigation.
Larson, J. W. 1967. The Dark-rumped Petrel in Haleakala Crater, Maui, Hawaii. Report to the National Park Service, U.S. Dept. Interior.
Marks, J. S. and S. M. Leasure. 1992. Breeding Biology of Tristram’s Storm-petrel on Laysan Island. Wilson Bull. 104(4): 719-731.
Monroe, B. L. Jr. and C. G. Sibley. 1993. A World Checklist of Birds. Yale University Press, New Haven and London.
Nakamura, K. (1979) Systematics and Distribution of the Genus Pterodroma in Japan and the Adjacent Waters [日本近海産シロハラミズナギドリ類の分類と分布]. Kaiyo to Seibutsu (Ocean and Life) 1 (1): 24 - 31. (in Japanese).
National Park Service. 2003. Hawaiian PetrelsNear the Haleakalā Observatories: A Report to the K.C Environmental, Co. Inc. for Preparation of a Long-Range Development Plan. Cathleen Natividad Bailey, Wildlife Biologist, Endangered Species Management.
Olson, S. L. and H. F. James. 1982. Fossil Birds From the Hawaiian Islands: Evidence for Wholesale Extinction by Man Before Western Contact. Science 217(4560): 633-635.
Pyle, P., L. B. SPEAR, and D. G. AINLEY 1993. Observations of Dark-rumped Petrels off Oregon and California. Western Birds 24:110-112.
Rabor, D. S., A. C. Alcala, and R. B. Gonzales. 1970. A list of the land vertebrates of Negros Island, Philippines. Silliman Journal, 17: 297-316.
Simons, T.R. 1983. Biology and Conservation of the Endangered Hawaiian Dark-rumped Petrel (Pterodroma phaeopygia sandwichensis). National Park Service, Cooperative Park Studies Unit, University of Washington, CPSU/UW83-2, Seattle.

31 | P a g e
Simons, T. R. 1984. A population model of the endangered Hawaiian Dark-rumped Petrel. J. Wildl. Manage. 48(4): 1065-1076.
Simons, T.R. 1985. Biology and behavior of the endangered Hawaiian Dark-rumped Petrel. Condor 87(2): 229–245.
Simons, T.R. & C. N. Hodges. 1998. Dark-rumped Petrel (Pterodroma phaeopygia). In The birds of North America 345:1-24(Poole, A. & Gill, F. eds.). The birds of North America Inc., Philadelphia.
Spear, L. B., D. G. Ainley, N. Nur and S. N. G. Howell. ., 1995. Population Size and Factors Affecting At-Sea Distributions of Four Endangered Procellariids in the Tropical Pacific. Condor, 97(3): 613-638.
US Fish and Wildlife Service. 1967. 32 FR 4001, Federal Register. 32(48).
US Fish and Wildlife Service. 1983. Hawaiian Dark-rumped Petrel and Newell's Manx Shearwater Recovery Plan. US Fish and Wildlife Service, Portland.
US Fish and Wildlife Service. 2011. Biological Opinion of the US Fish and Wildlife Service for Construction and Operation of the Advanced Technology Solar Telescope (ATST) at the Haleakala High Altitude Observatory Site. 1-2-2011-F-0085
WARNER, R. E. 1968. The Role of Introduced Diseases in the Extinction of the Endemic Hawaiian Avifauna. Condor 70(2): 101–120.