Embed Size (px)
Citation preview
CORPORATE FINANCE FINANCIAL ADVISORY SERVICES FINANCIAL RESTRUCTURING STRATEGIC CONSULTING
HL.com
Unlocking Value: Timing Profitable Growth Initiatives for Optimal Impact
February 3, 2015

Introduction
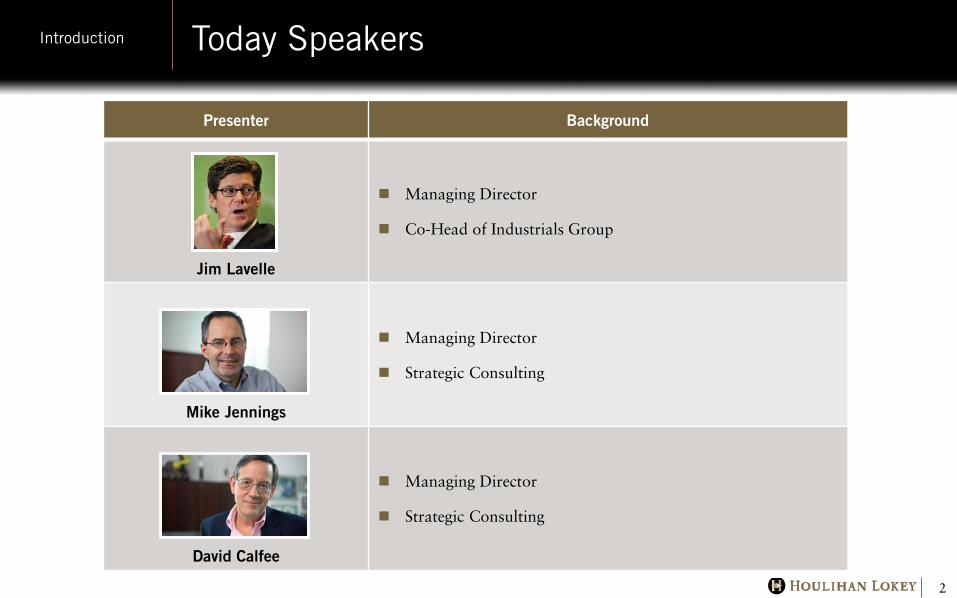
Today Speakers Introduction
2
Presenter Background
Jim Lavelle
Managing Director
Co-Head of Industrials Group
Mike Jennings
Managing Director
Strategic Consulting
David Calfee
Managing Director
Strategic Consulting
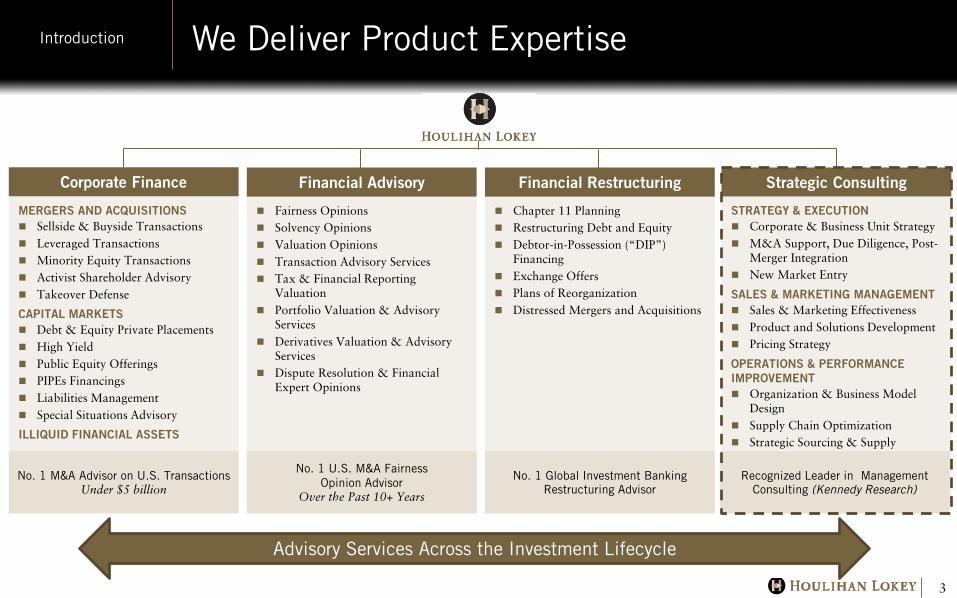
We Deliver Product Expertise Introduction
3
MERGERS AND ACQUISITIONS Sellside & Buyside Transactions Leveraged Transactions Minority Equity Transactions Activist Shareholder Advisory Takeover Defense
CAPITAL MARKETS Debt & Equity Private Placements High Yield Public Equity Offerings PIPEs Financings Liabilities Management Special Situations Advisory
ILLIQUID FINANCIAL ASSETS
Fairness Opinions Solvency Opinions Valuation Opinions Transaction Advisory Services Tax & Financial Reporting
Valuation Portfolio Valuation & Advisory
Services Derivatives Valuation & Advisory
Services Dispute Resolution & Financial
Expert Opinions
Chapter 11 Planning Restructuring Debt and Equity Debtor-in-Possession (“DIP”)
Financing Exchange Offers Plans of Reorganization Distressed Mergers and Acquisitions
Corporate Finance Financial Advisory Financial Restructuring
No. 1 M&A Advisor on U.S. Transactions Under $5 billion
No. 1 U.S. M&A Fairness Opinion Advisor
Over the Past 10+ Years
No. 1 Global Investment Banking Restructuring Advisor
Strategic Consulting
STRATEGY & EXECUTION Corporate & Business Unit Strategy M&A Support, Due Diligence, Post-
Merger Integration New Market Entry
SALES & MARKETING MANAGEMENT Sales & Marketing Effectiveness Product and Solutions Development Pricing Strategy
OPERATIONS & PERFORMANCE IMPROVEMENT Organization & Business Model
Design Supply Chain Optimization Strategic Sourcing & Supply
Management
Recognized Leader in Management Consulting (Kennedy Research)
Advisory Services Across the Investment Lifecycle

Market Update
244%
136%
126% 131%
0%
50%
100%
150%
200%
250%
US EurozoneJapan Emerging Markets
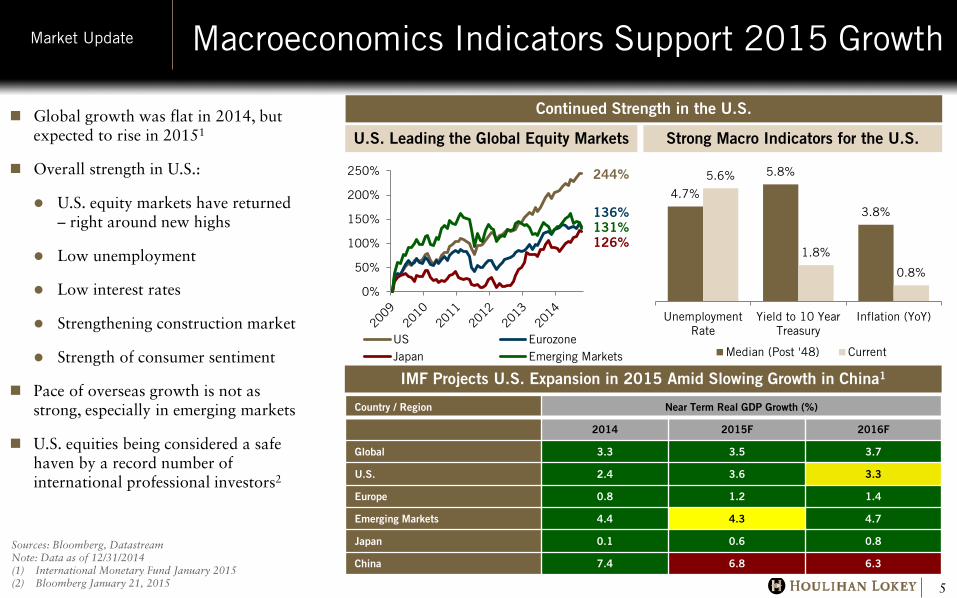
Macroeconomics Indicators Support 2015 Growth Market Update
5
Continued Strength in the U.S.
IMF Projects U.S. Expansion in 2015 Amid Slowing Growth in China1
Global growth was flat in 2014, but expected to rise in 20151
Overall strength in U.S.:
U.S. equity markets have returned – right around new highs
Low unemployment
Low interest rates
Strengthening construction market
Strength of consumer sentiment
Pace of overseas growth is not as strong, especially in emerging markets
U.S. equities being considered a safe haven by a record number of international professional investors2
U.S. Leading the Global Equity Markets
Country / Region Near Term Real GDP Growth (%)
2014 2015F 2016F
Global 3.3 3.5 3.7
U.S. 2.4 3.6 3.3
Europe 0.8 1.2 1.4
Emerging Markets 4.4 4.3 4.7
Japan 0.1 0.6 0.8
China 7.4 6.8 6.3
4.7%
5.8%
3.8%
5.6%
1.8%
0.8%
UnemploymentRate
Yield to 10 YearTreasury
Inflation (YoY)
Median (Post '48) Current
Strong Macro Indicators for the U.S.
Sources: Bloomberg, Datastream Note: Data as of 12/31/2014 (1) International Monetary Fund January 2015 (2) Bloomberg January 21, 2015
U.S. Purchasing Managers Index
Manufacturing Reports Indicate U.S. Industrial Strength
U.S. Industrials Continues Growth Trajectory Market Update
6
60%
64%
68%
72%
76%
80%
96 100 102
109 111 112
121 123 123 124
80859095
100105110115120125130
Higher costs
-15
-10
-5
50
+5
+10
+15
Manufacturing Expansion
Manufacturing Contraction
Largest Exporters by Cost Competitiveness3
U.S. Manufacturing Utilization
U.S. has shown growth in manufacturing for 19 consecutive months1
U.S. capital goods orders are at a 20+ year high
Utilization for the industrial sector increased to 78%, a rate equal to its 40-year average2
U.S. is leveraging advantages in innovation and productivity and is projected to be a lower-cost manufacturer than China by 20183
Increasing U.S. Manufacturing Utilization
Sources: U.S. Federal Reserve, Institute for Supply Management, Investment Strategy Group, BCG (1) Institute for Supply Management (2) Board of Governors of the Federal Reserve System (3) BCG’s Global Manufacturing Cost-Competitiveness Index, April
2014
40-year Average
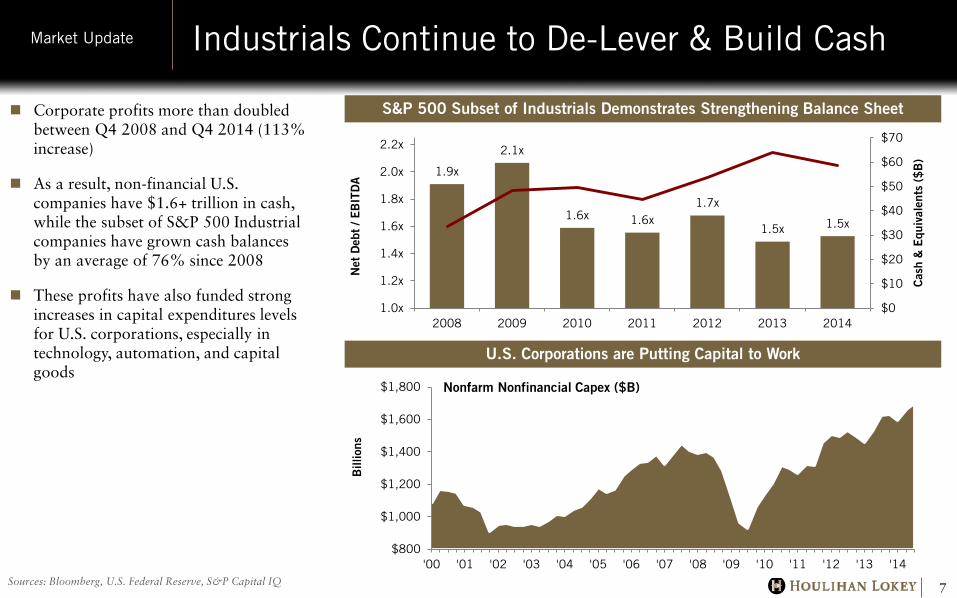
U.S. Corporations are Putting Capital to Work
S&P 500 Subset of Industrials Demonstrates Strengthening Balance Sheet
Industrials Continue to De-Lever & Build Cash Market Update
7
$800
$1,000
$1,200
$1,400
$1,600
$1,800
'00 '01 '02 '03 '04 '05 '06 '07 '08 '09 '10 '11 '12 '13 '14
Bill
ions
Nonfarm Nonfinancial Capex ($B)
Sources: Bloomberg, U.S. Federal Reserve, S&P Capital IQ
Corporate profits more than doubled between Q4 2008 and Q4 2014 (113% increase)
As a result, non-financial U.S. companies have $1.6+ trillion in cash, while the subset of S&P 500 Industrial companies have grown cash balances by an average of 76% since 2008
These profits have also funded strong increases in capital expenditures levels for U.S. corporations, especially in technology, automation, and capital goods
1.9x
2.1x
1.6x 1.6x 1.7x
1.5x 1.5x
$0
$10
$20
$30
$40
$50
$60
$70
1.0x
1.2x
1.4x
1.6x
1.8x
2.0x
2.2x
2008 2009 2010 2011 2012 2013 2014
Cas
h &
Equ
ival
ents
($
B)
Net
Deb
t / E
BIT
DA
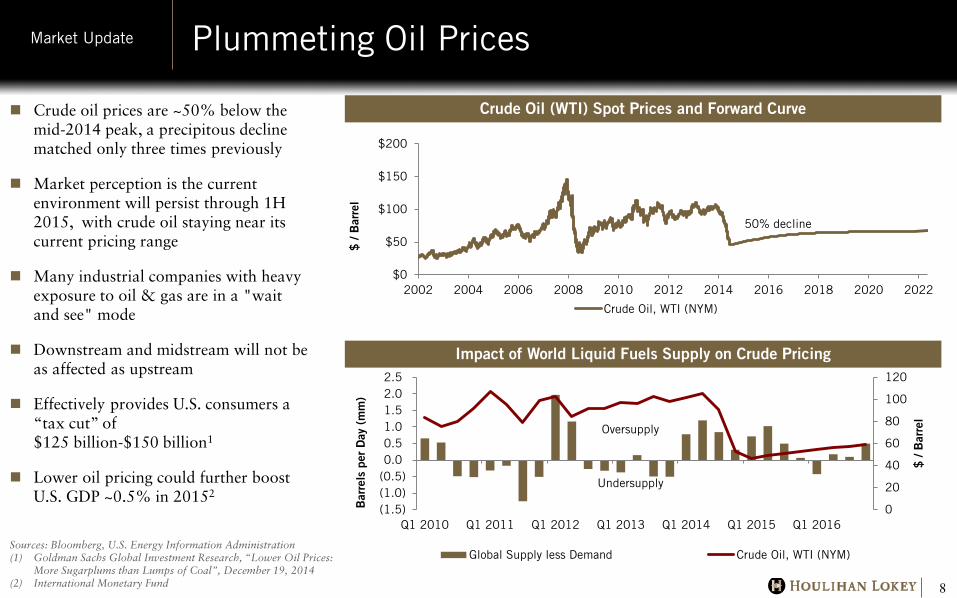
Crude Oil (WTI) Spot Prices and Forward Curve
Impact of World Liquid Fuels Supply on Crude Pricing
Plummeting Oil Prices Market Update
8
Sources: Bloomberg, U.S. Energy Information Administration (1) Goldman Sachs Global Investment Research, “Lower Oil Prices:
More Sugarplums than Lumps of Coal”, December 19, 2014 (2) International Monetary Fund
Crude oil prices are ~50% below the mid-2014 peak, a precipitous decline matched only three times previously
Market perception is the current environment will persist through 1H 2015, with crude oil staying near its current pricing range
Many industrial companies with heavy exposure to oil & gas are in a "wait and see" mode
Downstream and midstream will not be as affected as upstream
Effectively provides U.S. consumers a “tax cut” of $125 billion-$150 billion1
Lower oil pricing could further boost U.S. GDP ~0.5% in 20152
$0
$50
$100
$150
$200
2002 2004 2006 2008 2010 2012 2014 2016 2018 2020 2022
$ /
Bar
rel
Crude Oil, WTI (NYM)
0
20
40
60
80
100
120
(1.5)(1.0)(0.5)0.00.51.01.52.02.5
Q1 2010 Q1 2011 Q1 2012 Q1 2013 Q1 2014 Q1 2015 Q1 2016
$ /
Bar
rel
Bar
rels
per
Day
(m
m)
Global Supply less Demand Crude Oil, WTI (NYM)
Oversupply
Undersupply
50% decline
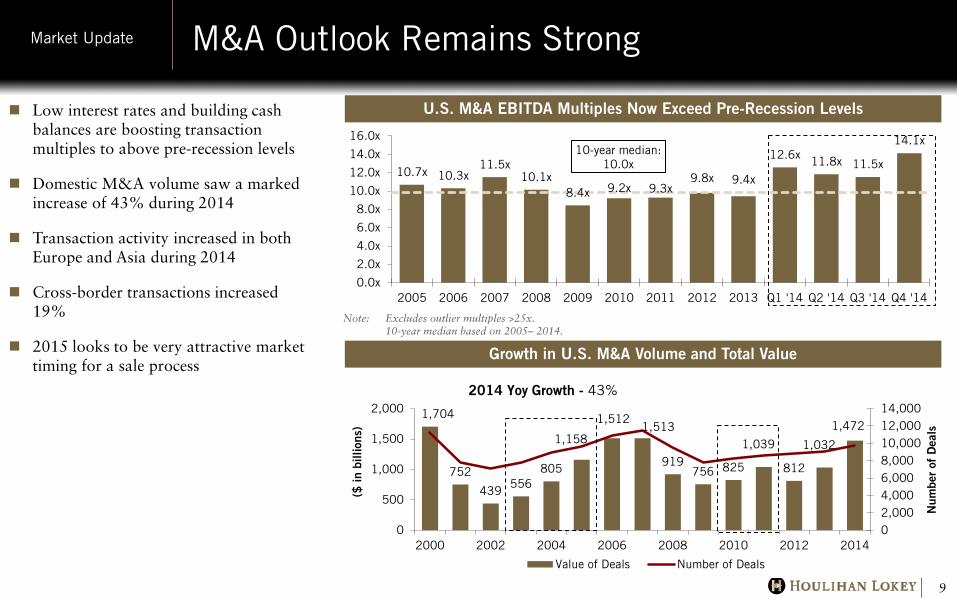
Growth in U.S. M&A Volume and Total Value
U.S. M&A EBITDA Multiples Now Exceed Pre-Recession Levels
M&A Outlook Remains Strong Market Update
9
1,704
752
439 556
805
1,158
1,512 1,513
919 756 825
1,039
812
1,032
1,472
02,0004,0006,0008,00010,00012,00014,000
0
500
1,000
1,500
2,000
2000 2002 2004 2006 2008 2010 2012 2014
Num
ber
of D
eals
($ in
bill
ions
)
Value of Deals Number of Deals
Note: Excludes outlier multiples >25x. 10-year median based on 2005– 2014.
Low interest rates and building cash balances are boosting transaction multiples to above pre-recession levels
Domestic M&A volume saw a marked increase of 43% during 2014
Transaction activity increased in both Europe and Asia during 2014
Cross-border transactions increased 19%
2015 looks to be very attractive market timing for a sale process
2014 Yoy Growth - 43%
10.7x 10.3x 11.5x
10.1x 8.4x 9.2x 9.3x
9.8x 9.4x
12.6x 11.8x 11.5x
14.1x 10-year median:
10.0x
0.0x
2.0x
4.0x
6.0x
8.0x
10.0x
12.0x
14.0x
16.0x
2005 2006 2007 2008 2009 2010 2011 2012 2013 Q1 '14 Q2 '14 Q3 '14 Q4 '14
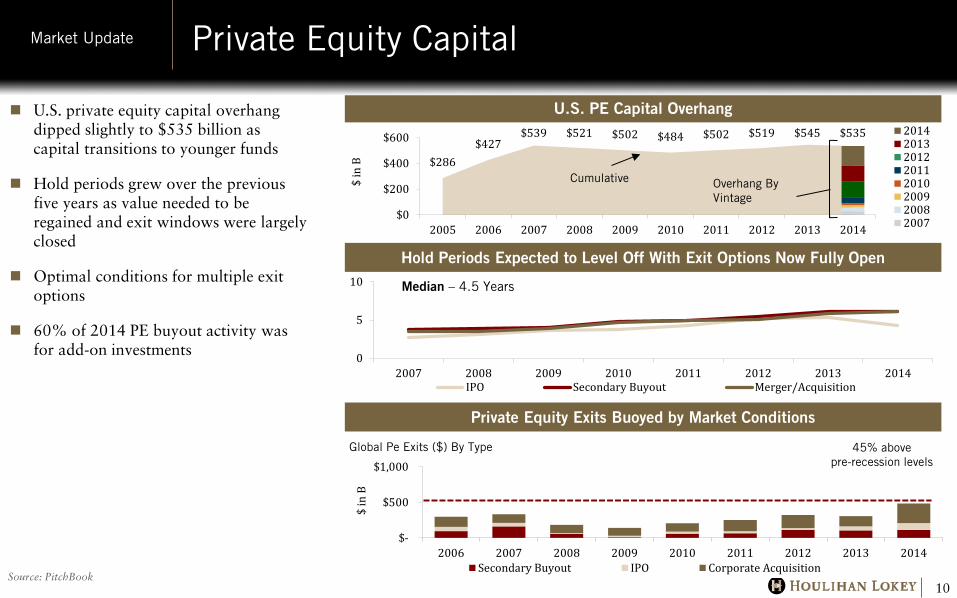
U.S. PE Capital Overhang
Private Equity Capital Market Update
10
$286 $427
$539 $521 $502 $484 $502 $519 $545 $535
$0
$200
$400
$600
2005 2006 2007 2008 2009 2010 2011 2012 2013 2014
$ in
B
20142013201220112010200920082007
Cumulative Overhang By Vintage
0
5
10
2007 2008 2009 2010 2011 2012 2013 2014IPO Secondary Buyout Merger/Acquisition
$-
$500
$1,000
2006 2007 2008 2009 2010 2011 2012 2013 2014
$ in
B
Global Pe Exits ($) By Type
Secondary Buyout IPO Corporate Acquisition
Hold Periods Expected to Level Off With Exit Options Now Fully Open
Private Equity Exits Buoyed by Market Conditions
Source: PitchBook
Median – 4.5 Years
U.S. private equity capital overhang dipped slightly to $535 billion as capital transitions to younger funds
Hold periods grew over the previous five years as value needed to be regained and exit windows were largely closed
Optimal conditions for multiple exit options
60% of 2014 PE buyout activity was for add-on investments
45% above pre-recession levels
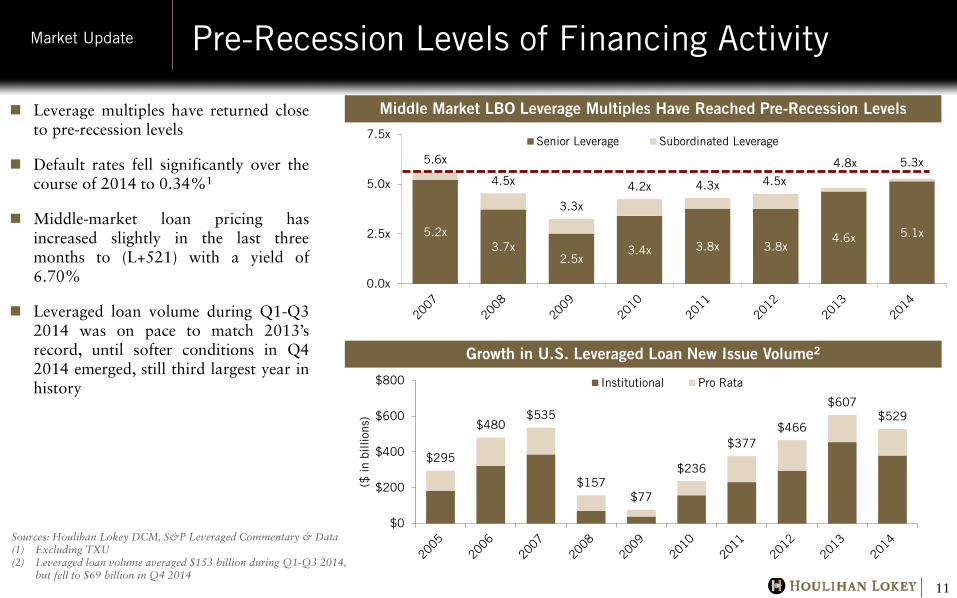
Pre-Recession Levels of Financing Activity Market Update
11
5.2x 3.7x
2.5x 3.4x 3.8x 3.8x
4.6x 5.1x
5.6x
4.5x
3.3x
4.2x 4.3x 4.5x
4.8x 5.3x
0.0x
2.5x
5.0x
7.5xSenior Leverage Subordinated Leverage
Middle Market LBO Leverage Multiples Have Reached Pre-Recession Levels
Growth in U.S. Leveraged Loan New Issue Volume2
Leverage multiples have returned close to pre-recession levels
Default rates fell significantly over the course of 2014 to 0.34%1
Middle-market loan pricing has increased slightly in the last three months to (L+521) with a yield of 6.70%
Leveraged loan volume during Q1-Q3 2014 was on pace to match 2013’s record, until softer conditions in Q4 2014 emerged, still third largest year in history
$295
$480 $535
$157 $77
$236
$377 $466
$607 $529
$0
$200
$400
$600
$800($
in b
illio
ns)
Institutional Pro Rata
Sources: Houlihan Lokey DCM, S&P Leveraged Commentary & Data (1) Excluding TXU (2) Leveraged loan volume averaged $153 billion during Q1-Q3 2014,
but fell to $69 billion in Q4 2014
Key Takeaways Market Update
12
Strength in the U.S. economy during 2015
Industrial companies are financially healthy and spending money
Leverage multiples at historical highs, coupled with low interest rates
M&A volume and valuations are increasing
Private equity has numerous exit options
Lower crude oil prices are expected throughout 2015
Preparation well in advance of a sale is key to achieving a premium valuation…Mike and David can speak to some key ideas for your consideration
2015 looks to be an excellent time for an exit

Value Creation
Strategic and Operational Initiatives Drive Value Creation and Shareholder Return
Value Creation
14
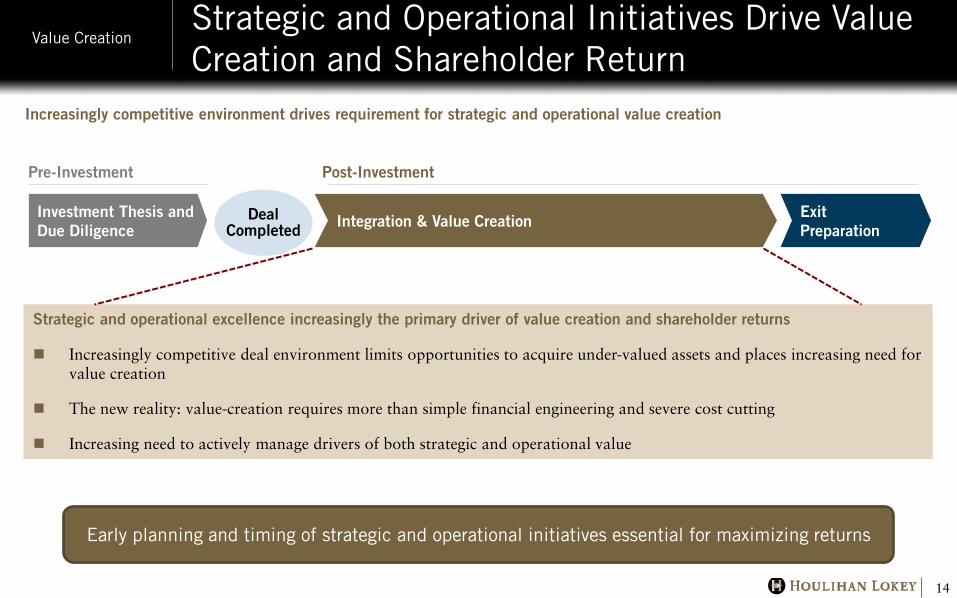
Increasingly competitive environment drives requirement for strategic and operational value creation
Investment Thesis and Due Diligence Integration & Value Creation Deal
Completed
Post-Investment Pre-Investment
Exit Preparation
Strategic and operational excellence increasingly the primary driver of value creation and shareholder returns
Increasingly competitive deal environment limits opportunities to acquire under-valued assets and places increasing need for value creation
The new reality: value-creation requires more than simple financial engineering and severe cost cutting
Increasing need to actively manage drivers of both strategic and operational value
Early planning and timing of strategic and operational initiatives essential for maximizing returns
Value Creation Opportunities Value Creation
15
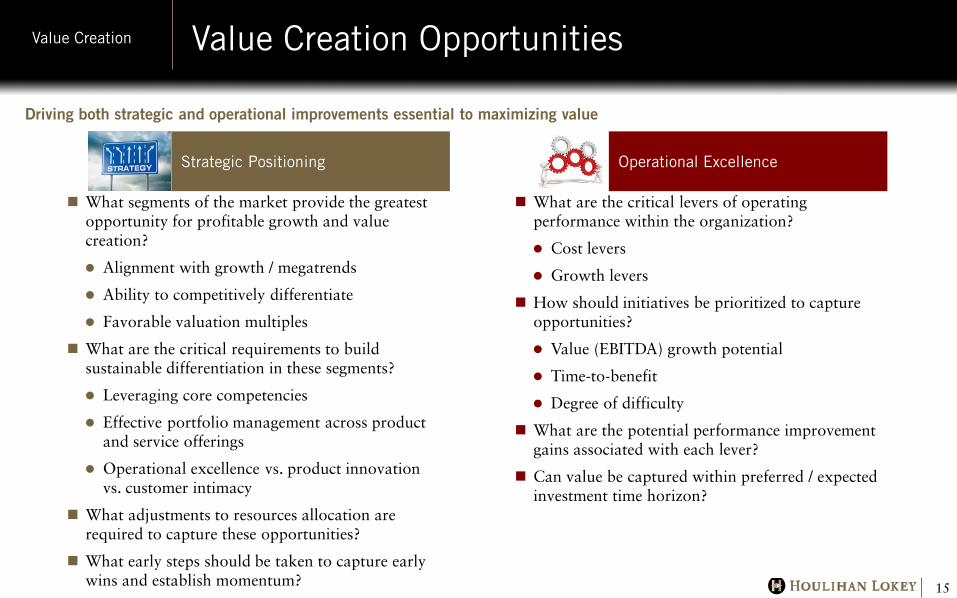
Driving both strategic and operational improvements essential to maximizing value
Strategic Positioning Operational Excellence
What segments of the market provide the greatest opportunity for profitable growth and value creation?
Alignment with growth / megatrends
Ability to competitively differentiate
Favorable valuation multiples
What are the critical requirements to build sustainable differentiation in these segments?
Leveraging core competencies
Effective portfolio management across product and service offerings
Operational excellence vs. product innovation vs. customer intimacy
What adjustments to resources allocation are required to capture these opportunities?
What early steps should be taken to capture early wins and establish momentum?
What are the critical levers of operating performance within the organization?
Cost levers
Growth levers
How should initiatives be prioritized to capture opportunities?
Value (EBITDA) growth potential
Time-to-benefit
Degree of difficulty
What are the potential performance improvement gains associated with each lever?
Can value be captured within preferred / expected investment time horizon?
Market-Based Approach for Value Creation Value Creation
16
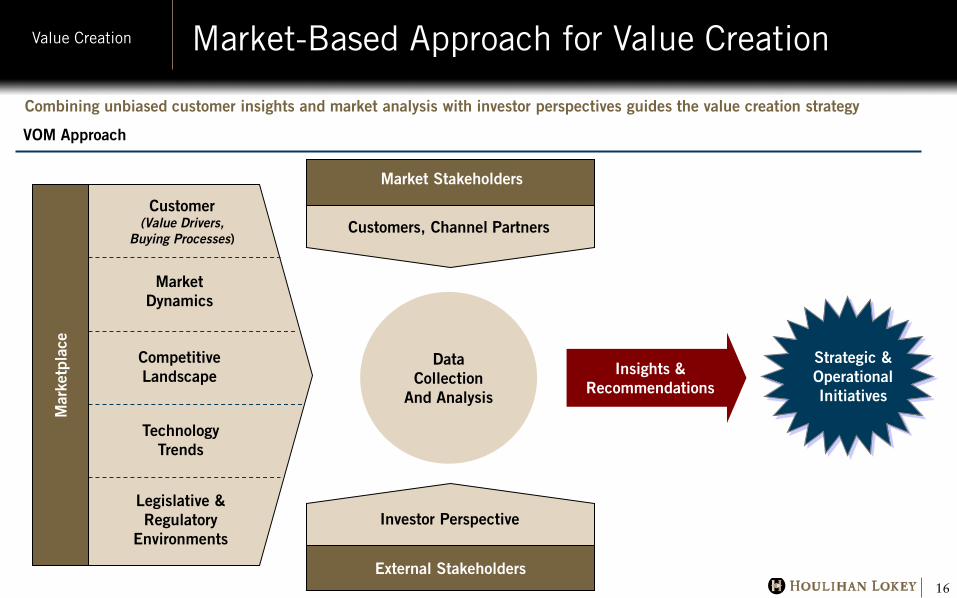
Combining unbiased customer insights and market analysis with investor perspectives guides the value creation strategy
VOM Approach
Customer (Value Drivers,
Buying Processes)
Market Dynamics
Competitive Landscape
Technology Trends
Legislative & Regulatory
Environments
Mar
ketp
lace
Customers, Channel Partners
Market Stakeholders
External Stakeholders
Investor Perspective
Data Collection
And Analysis
Strategic & Operational Initiatives
Insights & Recommendations
Building the Analytical Foundation to Drive Strategic Decision-Making
Value Creation
17
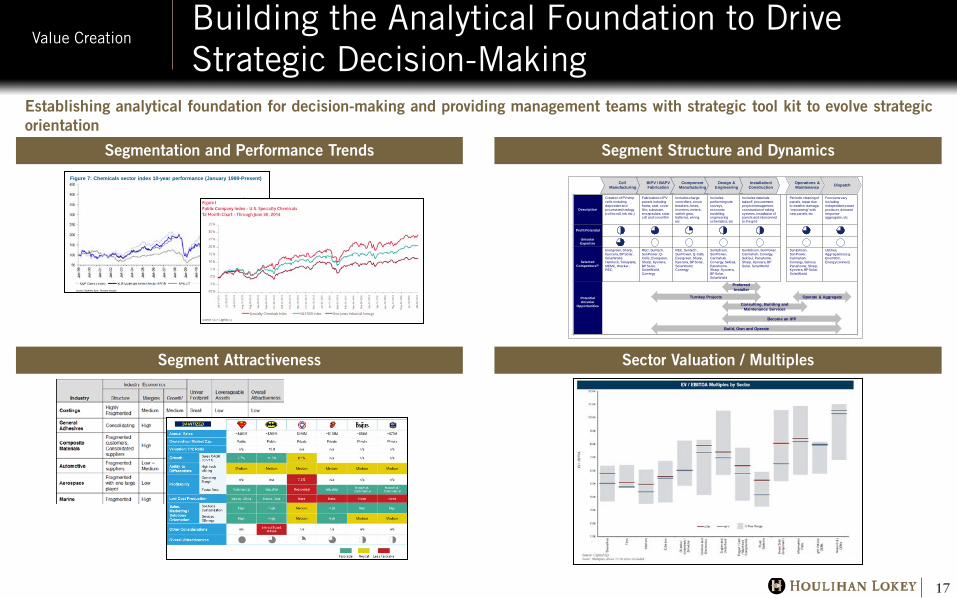
Establishing analytical foundation for decision-making and providing management teams with strategic tool kit to evolve strategic orientation
Figure 7: Chemicals sector index 10-year performance (January 1999-Present)Cell
ManufacturingBIPV / BAPV Fabrication
Component Manufacturing
Design & Engineering
Installation/ Construction
Operations & Maintenance Dispatch
Description
Creation of PV strip cells including deposition and process technology (roll-to-roll, ink, etc.)
Fabrication of PV panels including frame, seal, cover film, substrate, encapsulant, solar cell and cover film
Includes charge controllers, circuit breakers, fuses, inverters, meters, switch gear, batteries, wiring, etc
Includes performing site surveys, economic modeling, engineering schematics, etc
Includes materials takeoff, procurement, project management, construction of raking systems, installation of panels and interconnect to the grid
Periodic cleaning of panels, repair due to weather damage, “repowering” with new panels, etc
Functions vary including independent power producer, demand response aggregator, etc
Profit Potential
Unisolar Expertise
Selected Competitors(2)
Evergreen, Sharp, Kyocera, BP Solar, SolarWorld, Hemlock, Tokuyama, MEMC, Wacker, REC,
REC, Suntech, SunPower, Q-Cells, Evergreen, Sharp, Kyocera, BP Solar, SolarWorld, Conergy
REC, Suntech, SunPower, Q-Cells, Evergreen, Sharp, Kyocera, BP Solar, SolarWorld, Conergy
SunEdison, SunPower, Carmahah, Conergy, Sekisui, Panahome, Sharp, Kyocera, BP Solar, SolarWorld
SunEdison, SunPower, Carmahah, Conergy, Sekisui, Panahome, Sharp, Kyocera, BP Solar, SolarWorld
SunEdison, SunPower, Carmahah,Conergy, Sekisui, Panahome, Sharp, Kyocera, BP Solar, SolarWorld
Utilities,Aggregators (e.g. EnerNOC, EnergyConnect)
Potential Unisolar
Opportunities
Preferred Installer
Turnkey Projects
Consulting, Building and Maintenance Services
Become an IPP
Build, Own and Operate
Operate & Aggregate
Segmentation and Performance Trends Segment Structure and Dynamics
Segment Attractiveness Sector Valuation / Multiples
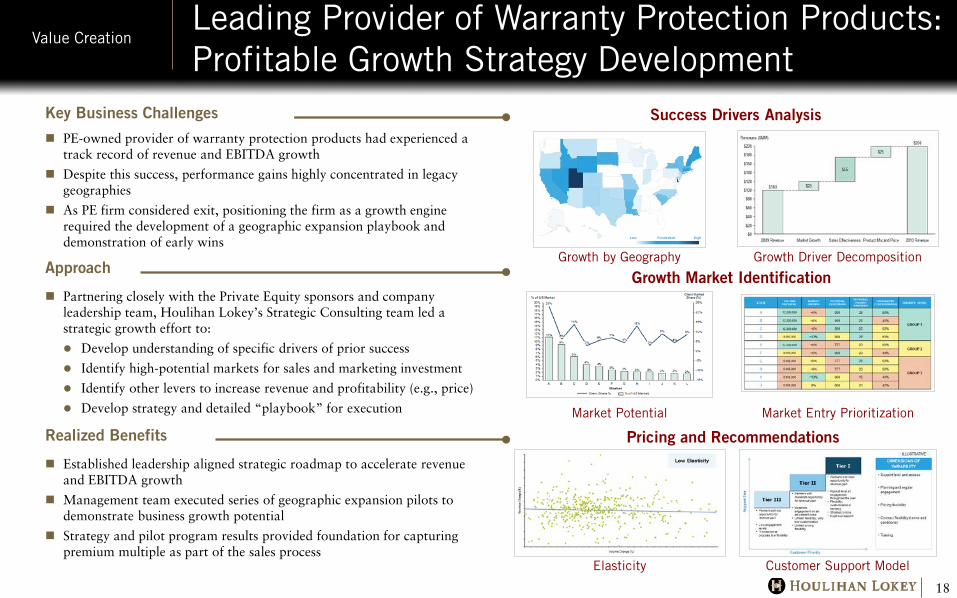
Leading Provider of Warranty Protection Products: Profitable Growth Strategy Development
Value Creation
18
Key Business Challenges
PE-owned provider of warranty protection products had experienced a track record of revenue and EBITDA growth
Despite this success, performance gains highly concentrated in legacy geographies
As PE firm considered exit, positioning the firm as a growth engine required the development of a geographic expansion playbook and demonstration of early wins
Approach
Partnering closely with the Private Equity sponsors and company leadership team, Houlihan Lokey’s Strategic Consulting team led a strategic growth effort to:
Develop understanding of specific drivers of prior success
Identify high-potential markets for sales and marketing investment
Identify other levers to increase revenue and profitability (e.g., price)
Develop strategy and detailed “playbook” for execution
Realized Benefits
Established leadership aligned strategic roadmap to accelerate revenue and EBITDA growth
Management team executed series of geographic expansion pilots to demonstrate business growth potential
Strategy and pilot program results provided foundation for capturing premium multiple as part of the sales process
Growth Market Identification
Pricing and Recommendations
Success Drivers Analysis
Growth by Geography Growth Driver Decomposition
Market Potential
Customer Support Model Elasticity
Market Entry Prioritization
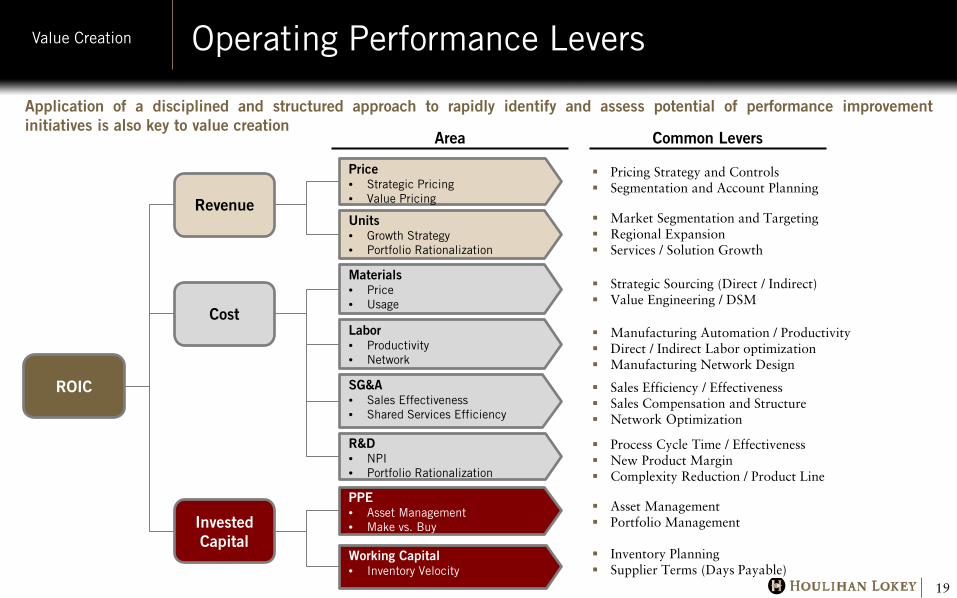
Operating Performance Levers Value Creation
19
Application of a disciplined and structured approach to rapidly identify and assess potential of performance improvement initiatives is also key to value creation
Strategic Sourcing (Direct / Indirect) Value Engineering / DSM
ROIC
Revenue
Cost
Invested Capital
Price • Strategic Pricing • Value Pricing
Units • Growth Strategy • Portfolio Rationalization
Materials • Price • Usage
Labor • Productivity • Network
SG&A • Sales Effectiveness • Shared Services Efficiency
R&D • NPI • Portfolio Rationalization
PPE • Asset Management • Make vs. Buy
Working Capital • Inventory Velocity
Inventory Planning Supplier Terms (Days Payable)
Manufacturing Automation / Productivity Direct / Indirect Labor optimization Manufacturing Network Design
Asset Management Portfolio Management
Process Cycle Time / Effectiveness New Product Margin Complexity Reduction / Product Line
Pricing Strategy and Controls Segmentation and Account Planning
Market Segmentation and Targeting Regional Expansion Services / Solution Growth
Sales Efficiency / Effectiveness Sales Compensation and Structure Network Optimization
Area Common Levers
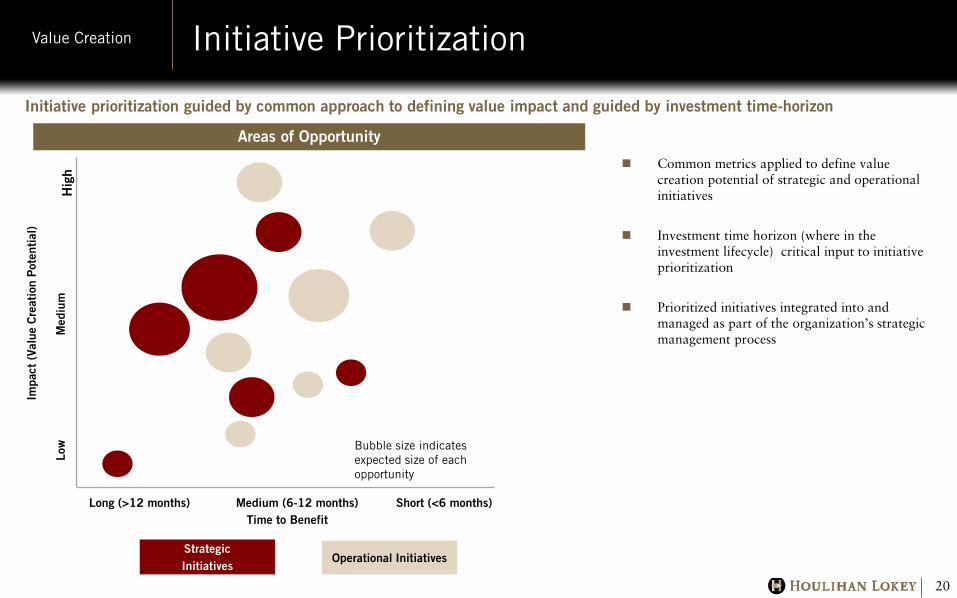
Initiative Prioritization Value Creation
20
Initiative prioritization guided by common approach to defining value impact and guided by investment time-horizon
Hig
h
Strategic Initiatives
Operational Initiatives
Time to Benefit Long (>12 months) Medium (6-12 months) Short (<6 months)
Low
M
ediu
m
Impa
ct (
Valu
e C
reat
ion
Pot
enti
al)
Bubble size indicates expected size of each opportunity
Common metrics applied to define value creation potential of strategic and operational initiatives
Investment time horizon (where in the investment lifecycle) critical input to initiative prioritization
Prioritized initiatives integrated into and managed as part of the organization’s strategic management process
Areas of Opportunity
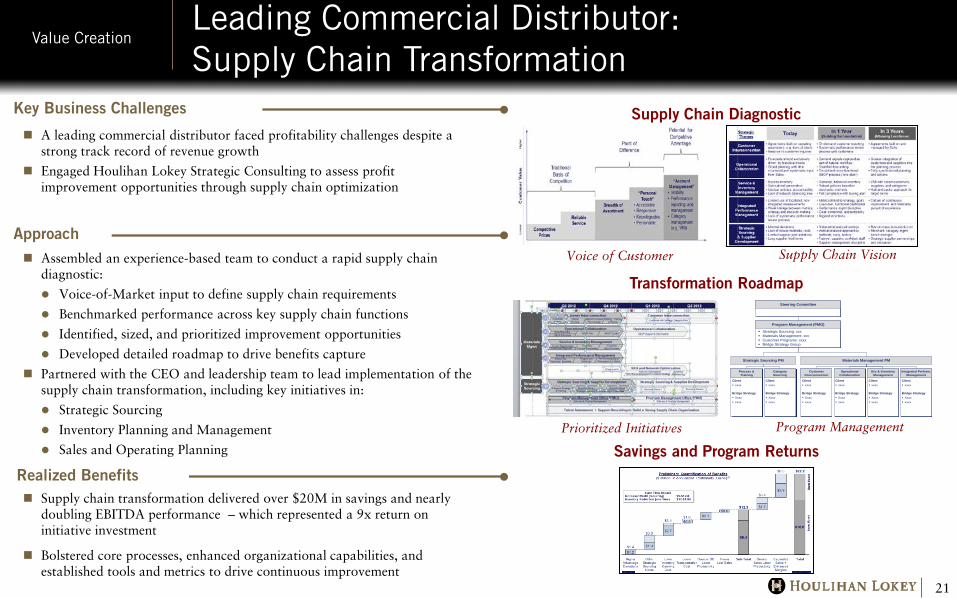
Leading Commercial Distributor: Supply Chain Transformation
Value Creation
21
Key Business Challenges
A leading commercial distributor faced profitability challenges despite a strong track record of revenue growth
Engaged Houlihan Lokey Strategic Consulting to assess profit improvement opportunities through supply chain optimization
Approach Assembled an experience-based team to conduct a rapid supply chain
diagnostic:
Voice-of-Market input to define supply chain requirements
Benchmarked performance across key supply chain functions
Identified, sized, and prioritized improvement opportunities
Developed detailed roadmap to drive benefits capture
Partnered with the CEO and leadership team to lead implementation of the supply chain transformation, including key initiatives in:
Strategic Sourcing
Inventory Planning and Management
Sales and Operating Planning
Realized Benefits Supply chain transformation delivered over $20M in savings and nearly
doubling EBITDA performance – which represented a 9x return on initiative investment
Bolstered core processes, enhanced organizational capabilities, and established tools and metrics to drive continuous improvement
Supply Chain Diagnostic
Transformation Roadmap
Savings and Program Returns
Client xxxx
Bridge Strategy Xxxx
xxxx
Process &Training
Steering Committee
Strategic Sourcing: xxx Materials Management: xxx Customer Programs: xxxx Bridge Strategy Group
Program Management (PMO)
Materials Management PM
Client xxxx
Bridge Strategy Xxxx
xxxx
CategorySourcing
Client xxxx
Bridge Strategy Xxxx
xxxx
Customer Interconnection
Client xxxx
Bridge Strategy Xxxx
xxxx
Operational Collaboration
Client xxxx
Bridge Strategy Xxxx
xxxx
Svc & Inventory Management
Client xxxx
Bridge Strategy Xxxx
xxxx
Integrated Perform. Management
Strategic Sourcing PM
Voice of Customer Supply Chain Vision
Prioritized Initiatives Program Management
Summary Value Creation
22
A disciplined approach to value creation – one that goes beyond financial engineering and pure cost cutting – is necessary
That approach should judiciously balance initiatives focused on operational excellence and strategic positioning
Such approaches and initiatives should be planned (and executed) earlier in the investment cycle rather than being shoe-horned in right before exit
Well-executed set of initiatives can deliver significant and differentiated value to key stakeholders and shareholders
Exiting corporate investments now is attractive
One wants to be as ready as possible prior to any harvesting event
Advancing new initiatives can drive incremental value

Appendix
Leading Advisor in Industrials Sector Appendix
24
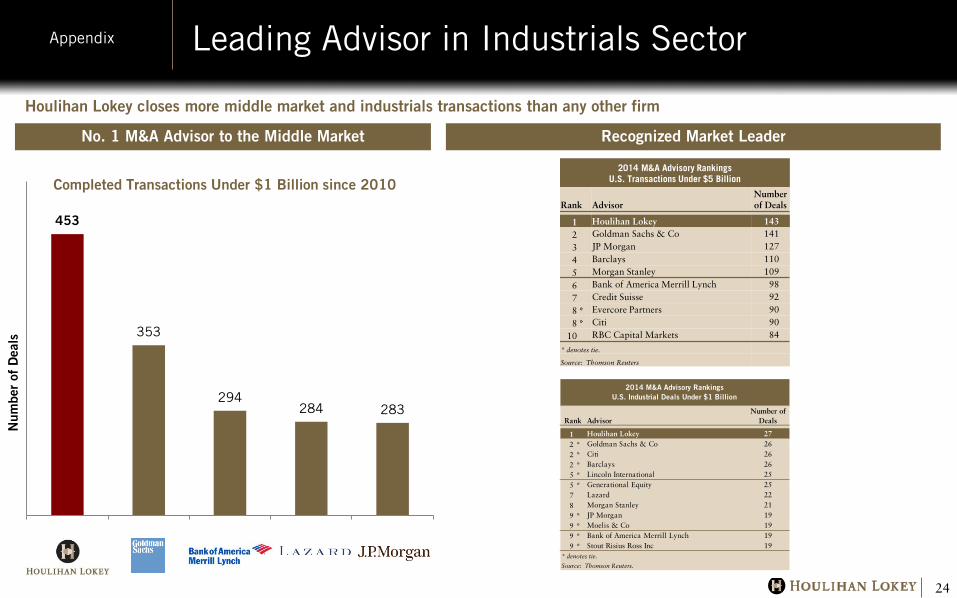
Houlihan Lokey closes more middle market and industrials transactions than any other firm
453
353
294 284 283
200
250
300
350
400
450
500
Num
ber
of D
eals
No. 1 M&A Advisor to the Middle Market Recognized Market Leader
Completed Transactions Under $1 Billion since 2010 2014 M&A Advisory Rankings
U.S. Transactions Under $5 Billion
Rank AdvisorNumber of Deals
1 Houlihan Lokey 1432 Goldman Sachs & Co 141
3 JP Morgan 127
4 Barclays 110
5 Morgan Stanley 109
6 Bank of America Merrill Lynch 98
7 Credit Suisse 92
8 * Evercore Partners 90
8 * Citi 90
10 RBC Capital Markets 84
* denotes tie.
Source: Thomson Reuters
AdvisorNumber of
Deals
1 Houlihan Lokey 272 * Goldman Sachs & Co 262 * Citi 262 * Barclays 265 * Lincoln International 255 * Generational Equity 257 Lazard 228 Morgan Stanley 219 * JP Morgan 199 * Moelis & Co 199 * Bank of America Merrill Lynch 199 * Stout Risius Ross Inc 19
* denotes tie.
Source: Thomson Reuters.
2014 M&A Advisory RankingsU.S. Industrial Deals Under $1 Billion
Rank
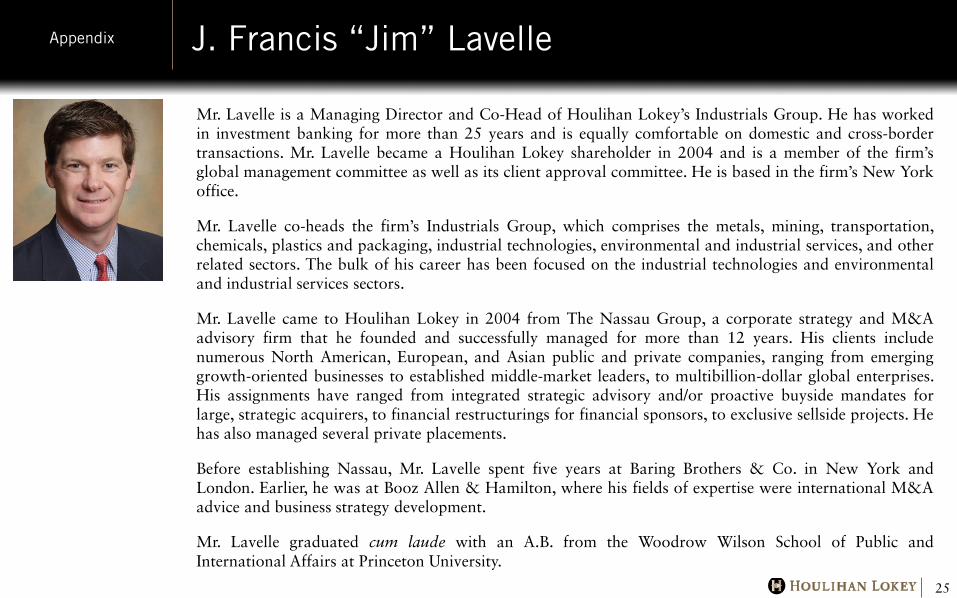
J. Francis “Jim” Lavelle Appendix
25
Mr. Lavelle is a Managing Director and Co-Head of Houlihan Lokey’s Industrials Group. He has worked in investment banking for more than 25 years and is equally comfortable on domestic and cross-border transactions. Mr. Lavelle became a Houlihan Lokey shareholder in 2004 and is a member of the firm’s global management committee as well as its client approval committee. He is based in the firm’s New York office.
Mr. Lavelle co-heads the firm’s Industrials Group, which comprises the metals, mining, transportation, chemicals, plastics and packaging, industrial technologies, environmental and industrial services, and other related sectors. The bulk of his career has been focused on the industrial technologies and environmental and industrial services sectors.
Mr. Lavelle came to Houlihan Lokey in 2004 from The Nassau Group, a corporate strategy and M&A advisory firm that he founded and successfully managed for more than 12 years. His clients include numerous North American, European, and Asian public and private companies, ranging from emerging growth-oriented businesses to established middle-market leaders, to multibillion-dollar global enterprises. His assignments have ranged from integrated strategic advisory and/or proactive buyside mandates for large, strategic acquirers, to financial restructurings for financial sponsors, to exclusive sellside projects. He has also managed several private placements.
Before establishing Nassau, Mr. Lavelle spent five years at Baring Brothers & Co. in New York and London. Earlier, he was at Booz Allen & Hamilton, where his fields of expertise were international M&A advice and business strategy development.
Mr. Lavelle graduated cum laude with an A.B. from the Woodrow Wilson School of Public and International Affairs at Princeton University.
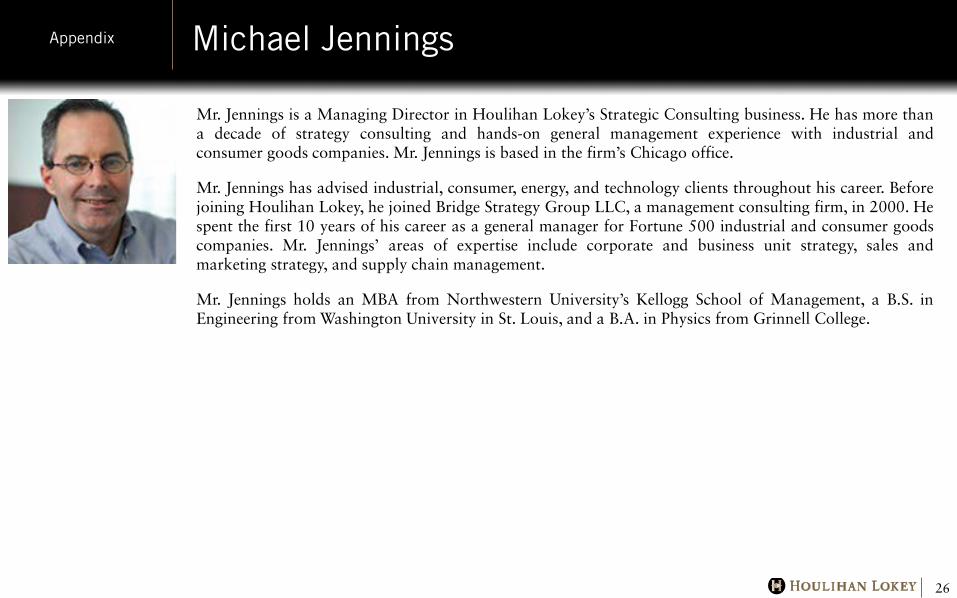
Michael Jennings Appendix
26
Mr. Jennings is a Managing Director in Houlihan Lokey’s Strategic Consulting business. He has more than a decade of strategy consulting and hands-on general management experience with industrial and consumer goods companies. Mr. Jennings is based in the firm’s Chicago office.
Mr. Jennings has advised industrial, consumer, energy, and technology clients throughout his career. Before joining Houlihan Lokey, he joined Bridge Strategy Group LLC, a management consulting firm, in 2000. He spent the first 10 years of his career as a general manager for Fortune 500 industrial and consumer goods companies. Mr. Jennings’ areas of expertise include corporate and business unit strategy, sales and marketing strategy, and supply chain management.
Mr. Jennings holds an MBA from Northwestern University’s Kellogg School of Management, a B.S. in Engineering from Washington University in St. Louis, and a B.A. in Physics from Grinnell College.

David Calfee Appendix
27
Mr. Calfee is a Managing Director in Houlihan Lokey’s Strategic Consulting business. He is an expert in strategy, human capital, and change management. Mr. Calfee is based in the firm’s Chicago office.
Before joining Houlihan Lokey, Mr. Calfee was a founder of Bridge Strategy Group LLC, a management consulting firm. He was also a leader of Renaissance Worldwide, CSC Index, and McKinsey & Co. Mr. Calfee’s expertise covers a wide variety of industries, including consumer, commercial, and industrial goods and services organizations, coupled with functional experience in strategy development and execution, human resources management, and change leadership.
Mr. Calfee holds an MBA with distinction from Northwestern University’s Kellogg School of Management, a J.D. from the University of Chicago Law School, and an A.B. cum laude from Harvard College.
Disclaimer Appendix
28
© 2014 Houlihan Lokey. All rights reserved. This material may not be reproduced in any format by any means or redistributed without the prior written consent of Houlihan Lokey.
Houlihan Lokey is a trade name for Houlihan Lokey, Inc. and its subsidiaries and affiliates which include: Houlihan Lokey Capital, Inc., a California corporation, a registered broker-dealer and SIPC member firm, which provides investment banking, capital markets, private placement, merger, acquisition and divestiture services; Houlihan Lokey Financial Advisors, Inc., a California corporation, which provides financial advisory, fairness opinion, solvency opinion, valuation opinion, restructuring advisory and portfolio management services; Houlihan Lokey Consulting, Inc., a California corporation, which provides strategic consulting services; and Houlihan Lokey (Europe) Limited, a company incorporated in England which is authorized and regulated by the U.K. Financial Conduct Authority and Houlihan Lokey (China) Limited, a company incorporated in Hong Kong SAR which is licensed in Hong Kong by the Securities and Futures Commission to conduct Type 1, 4 and 6 regulated activities to professional investors only, which provide investment banking, restructuring advisory, merger, acquisition and divestiture services, valuation opinion and private placement services and which may direct this communication within the European Economic Area and Hong Kong, respectively, to intended recipients including professional investors, high-net-worth companies or other institutional investors.
Houlihan Lokey gathers its data from sources it considers reliable; however, it does not guarantee the accuracy or completeness of the information provided within this presentation. The material presented reflects information known to the authors at the time this presentation was written, and this information is subject to change. Houlihan Lokey makes no representations or warranties, expressed or implied, regarding the accuracy of this material. The views expressed in this material accurately reflect the personal views of the authors regarding the subject securities and issuers and do not necessarily coincide with those of Houlihan Lokey. Officers, directors and partners in the Houlihan Lokey group of companies may have positions in the securities of the companies discussed. This presentation does not constitute advice or a recommendation, offer or solicitation with respect to the securities of any company discussed herein, is not intended to provide information upon which to base an investment decision, and should not be construed as such. Houlihan Lokey or its affiliates may from time to time provide investment banking or related services to these companies. Like all Houlihan Lokey employees, the authors of this presentation receive compensation that is affected by overall firm profitability.


![IN THE UNITED STATES BANKRUPTCY COURT FOR THE …€¦ · Objection to Retention of Houlihan Lokey [Dkt. No. 347, Aug. 6, 2009] (“The Official Committee believes that the Debtors’](https://img.pdfslide.net/doc/110x75/5f0b75717e708231d4309eaf/in-the-united-states-bankruptcy-court-for-the-objection-to-retention-of-houlihan.jpg)