Embed Size (px)
Citation preview

International Journal of Scientific & Engineering Research, Volume 6, Issue 4, April-2015 1977 ISSN 2229-5518
IJSER © 2015 http://www.ijser.org
An Electronic nose with LabVIEW using SnO2 Based Gas Sensors: Application to test
freshness of the fruits M.S. Kasbe*1, S.L.Deshmukh1, T.H.Mujawar1, V.D.Bachuwar1,
L.P. Deshmukh1 and A.D. Shaligram2
Abstract: In this paper, various ripening stages (under-ripe, ripe and over-ripe) of banana and guava are studied. The present work is
an electronic nose, which consists of a semiconductor gas sensor array and an artificial neural network (ANN). An electronic nose is
used to detect the freshness of non-destructive fruits. A gas sensor array (SnO2 type) detects aroma which is emitted from the fruits in
the different ripening stages of the fruits. The typical gases emitted from the fruits, e.g alcohol, methane, carbon dioxide, ammonia and
carbon monoxide, have been detected by the sensor array. An artificial neural network is designed in LabVIEW software. A
comparison is also made between the various ripening stages of both the fruits. We claim the novel system which is of low cost and
requires minimum space. DAQ card is used to interface an array of MQ-gas sensors and (computer) LabVIEW software.
Keywords: artificial neural network (ANN), banana and guava, DAQ-card, GUI, LabVIEW software, SnO2 gas sensor array, stand alone application.
—————————— ————————— 1 Introduction: Now a day’s a variety of methods and techniques are developed for preservation and determination of the freshness of the destructive or non-destructive fruits and vegetables. The freshness of the fruits is usually detected by the skin colour sensing, optical methods and some other methods that determine the changes in shape, size, aroma, fruit opening, leaf changes, abscission, firmness, sugar content, protein content, starch content, acidity, flavour and so on. In majority of the cases fruits loose their usefulness or eatable form. The traditional methods used to assess fruit ripeness are destruction of the fruits and thus cannot be systematically applied and are cost involving [1]. Further, these rely on the measurement of fruit firmness (penetromy), or chemical tests related to ripeness such as pH, acidity (titration), soluble solids (refractometry), or ethylene (chromatography) [2]. More recently, non-destructive methods such as nuclear magnetic resonance (NMR) [3], proton magnetic resonance (PMR) [4], vision systems (skin
colour) [5] and acoustic methods [6], have been proposed.
However, NMR and PMR methods generally require expensive equipments and related process control and are cost involving. Olfaction system (sense of smell by the nose) is one of the chemoreceptor systems of human; two others are gustation (sense of taste by the tongue) and trigeminal (sense of irritation) systems. The olfaction is used to detect volatile compounds and compared to the two others; the most contribution in the perception of flavour is by the olfaction [7]. Gas sensors based on solid-state semiconductor materials offer considerable advantages compared to other gas sensing methods. Semiconductor sensors are inexpensive to fabricate, easy to miniaturize, rugged, reliable and can be designed to operate over a range of conditions including high temperatures. Semiconductor sensors can be fabricated in arrays to allow sensing of multiple species simultaneously and with advances in sensitivity and detectivity limits approaching part-per-million (ppm) levels for some species. Tin dioxide semiconductor gas sensors were first proposed [8, 9], and since then stannic oxide gas sensors have undergone extensive research and development due to its potential use in domestic, commercial and industrial settings. These are the devices operating at low temperature, having high sensitivities, mechanical simplicity of design and low manufacturing costs [9–12]. Millions of carbon monoxide (CO) alarms utilizing SnO2 as the active sensing element have been produced and have demonstrated the long term (>10 years) dependable performance. In the past 15 years, considerable research has been conducted on understanding the chemical and electronic mechanisms that govern the semiconductor sensor performance and extending SnO2 sensors to the detection of other gases, including trace amounts of toxic gases [11, 13, 14]. However,
———————————————— • M. S. Kasbe is currently Assistant Professor in Solapur University, Solapur,
India, 413255, PH-+917385638507. E-mail: [email protected] • S.L.Deshmukh, Department of Electronics (Commun.Sci.), School of
Physical Sciences, Solapur University, Solapur 413 255, M.S, India. • T. H. Mujawar, is currently Assistant Professor in Solapur University,
Solapur, India, Department of Electronics (Commun.Sci.), School of Physical Sciences, Solapur University, Solapur 413 255, M.S, India.
• V D. Bachuwar is currently Assistant Professor in Solapur University, Solapur, India,Department of Electronics (Commun.Sci.), School of Physical Sciences, Solapur University, Solapur 413 255, M.S, India.
• Dr L.P.Deshmukh, Department of Electronics (Commun.Sci.), School of Physical Sciences, Solapur University, Solapur 413 255, M.S, India.
• Dr. A.D.Shaligram is currently Professor and Head, Department of Electronic-Science, University of Pune, Pune, India, 411007, PH-+919373318687. E-mail: [email protected]
IJSER

International Journal of Scientific & Engineering Research, Volume 6, Issue 4, April-2015 1978 ISSN 2229-5518
IJSER © 2015 http://www.ijser.org
many challenges remained unsolved which prevent full realization of the diagnostic potential of SnO2 sensors including the need to improve selectivity, sensitivity, and stability and time response of the sensors. Tin dioxide is an n-type semiconductor, where the sensor conductivity increases in the presence of reducing gases (such as CO) and decreases in the presence of the oxidizing gases (such as O2); the sensor response being due to the surface interactions between the tin oxide and the surrounding gases [15]. E-noses have stimulated the development of several measurement methods and techniques for various gases monitoring systems; in particular, gas sensors are highly attractive for particular detection and measurement gases because they are compact, portable and versatile and provide quick data analysis with high resolution [16]. In the present gas sensing system, an electronic nose consists of a SnO2 type semiconductor gas sensor array and an artificial neural network (ANN). MQ-series gas sensors array having MQ-3, MQ-5, MQ-7, MQ-9 and MQ-135 gas sensors were used to sense various gases. The GUI for ANN is designed in LabVIEW software. LabVIEW is highly interactive and user friendly software that gives real time responses and visual monitoring. The system is used for the study of various ripening stages of banana and guava. This study is a comparative study of gas concentration emitted from the banana and guava with respect to time. In many cases human nose has so many limitations; e-nose is answer to them. 2 System Developments:
An autonomous experimental setup consists of a gas chamber (an air tight food grade box), semiconductor material based SnO2 gas sensors array (MQ-series), DAQ-card and ANN designed in LabVIEW software. The gas sensors detect various gases which are emitted from the fruits. All the gases are collected in a gas chamber. An air tight food grade box was used for collection of the gases which are emitted from the fruit. A gas sensor array is set in a gas chamber. A block diagram of experimental setup of electronic nose is shown in figure1. LabVIEW receives the voltage form of the gases from hardware setup through NImyDAQ. Figure 2 shows the structure and configuration of the basic measurement circuit of the gas sensors. A and B terminals show two ports of the gas sensors. H-terminal defines the coil which is heated with supply.
2.1 The sensor specifications: MQ-3: MQ-3 gas sensor has high sensitity to alcohol and has good resistance to disturb gasoline, smoke and vapour. The sensor could be used to detect alcohol with different concentrations. It is low cost and suitable for different applications. MQ-5: This has high sensitivity to LPG, natural gas, and town gas. It also has small sensitivity to alcohol and smoke. It is a fast, stable and long life sensor.
MQ-7: MQ-7 is highly sensitive for carbon monoxide. Resistance value of MQ-7 is the difference to various kinds and various concentration gases. So, when using these components, sensitivity adjustment is very necessary. MQ-9: Sensitive material of MQ-9 gas sensor is SnO2, which operates at lower conductivity in clean air. It makes detection of CO at low temperature (heated by 1.5V). The sensor’s conductivity can be raised higher with the gas concentration rising. At high temperature, (heated by 5.0V), it detects methane, propane etc combustible gases and cleans the other gases adsorbed under low temperature. In these investigations simple circuit to convert change of conductivity into voltage is used. MQ-9 gas sensor has high sensitivity to carbon monoxide, methane and LPG. The sensor could be used to detect different gases that contain CO and combustible gases. It costs low and is suitable for different applications. MQ – 135: MQ - 135 is simple-to-use ammonia (NH3) gas sensor, suitable for sensing ammonia concentrations in the air. The MQ - 135 can detect ammonia gas concentrations up to 100 ppm. It has high sensitivity for ammonia, sulfides and benzene having long term stability and is low cost sensor. The surface resistance of the sensor (Rs) is obtained through effective voltage signal output of the load resistance (RL) which is a series-wound. The relationship between them is,
RS\RL = (Vc -VRL) / VRL where, VC is the loop voltage or circuit voltage, VRL is detected voltage and RL is the load resistance. 2.2 The NImyDAQ: The DAQ hardware acts as the interface between the computer and the outside world. It primarily functions as a device that digitizes incoming analog signals so that the computer can interpret them. The DAQ device is external and connects the computer through an existing port, such as serial port or Ethernet port, i.e. we can quickly and easily place measurement nodes near the sensor. 2.3 LabVIEW software: Laboratory Virtual Engineering Workbench is a graphical programming environment which has become prevalent to throughput research laboratory, academia and industries. It is a powerful and versatile analysis tool and instrumentation software system for the measurement and automation. LabVIEW offers more flexibility than standard laboratory instruments. 2.4 Artificial Neural Networking (ANN): Human body automatically and instantly replies when any unwanted smell or odour is present in the environment because of the sensing elements and sharp brain. Human brain works with the help of neural network, which is the big network present in our body. It controls all the human activities. Gas sensors work like sensing elements and in LabVIEW software, GUI is designed for ANN. The details of the designed ANN are already reported [16].
IJSER

International Journal of Scientific & Engineering Research, Volume 6, Issue 4, April-2015 1979 ISSN 2229-5518
IJSER © 2015 http://www.ijser.org
2.5 Stand-alone application: A stand-alone application allows the user to run GUI without installing the LabVIEW software. User can include LabVIEW Run-Time Engine, which is necessary for running stand-alone application. Our graphical code (G-Code) will secure and protect the stand-alone application. It provides other users with executable version VIs. Once stand-alone application is created, designer or any user cannot change GUI code.
Figure1. Experimental setup of an E-nose.
Figure2. Structure and configuration of a basic measurement circuit of a
gas sensor.
Figure3. Practical setup of the system
3 Observations and results: The system collects all the given data for banana and guava from the hardware and stores in excel file using LabVIEW GUI. Front panel, for ten days observations, is shown in the following figures. Front panel shows two different plots; first
plot shows the variation of gas concentration for different stages of banana i.e. under-ripe, ripe and over-ripe. When the gas concentration of a particular gas is increased in the gas chamber, the voltage across the load resistor is also increased. Whereas the second plot indicates the variation of selected gas sensor. Figure 4 shows the front panel of the gas sensor response for banana when MQ-7 gas sensor was selected. Voltage values for a particular gas sensor are displayed in numeric array indicator. When we select another gas sensor e.g. MQ-135, the second plot in figure 5 shows the response for MQ-135 gas sensor and numeric indicator displays the numeric values for that particular gas sensor. Likewise figure 6 shows the response for MQ-3 sensor.
Figure4. Front panel showing gas sensor response for banana (in volt):
(MQ-7)
Figure5. Front panel showing gas sensor response for banana (in volts):
(MQ-135)
IJSER
International Journal of Scientific & Engineering Research, Volume 6, Issue 4, April-2015 1980 ISSN 2229-5518
IJSER © 2015 http://www.ijser.org
Figure6. Front panel showing gas sensor response for banana (in volts):
(MQ-3) MQ-3 gas sensor detects the alcohol concentration present in the present environment. The concentration of alcohol in the chamber increased initially (first two days) and then it decreased till the last day of the experiment. When the banana was in under-riped and over-riped stages, the concentration of alcohol was less (or minimum) as compared to the ripened banana. When banana was fresh and ripened, the concentration of alcohol gas was high (maximum). MQ-7 gas sensor was used to detect carbon monoxide (CO) gas. The concentration of CO gas increased with time. The gas concentration increased when banana was fresh and over-ripened. MQ-5 gas sensor was used to detect the natural gases and LPG gas. The concentration of natural gases increased with time. When banana was in under-riped stage, percentage of natural gases was less (minimum), and when it was over-ripened stage, the concentration of natural gases was high (maximum). MQ-135 gas sensor detects ammonia emitted from the banana. Violet line shows the variations of ammonia gas concentration from first day to the end of the experiment MQ-9 sensor detects methane and propane gases. The concentration of these gases was constant from starting to the end of the experiment. Figure 7 shows the front panel of the gas sensor response for guava when no gas sensor was selected. When a gas sensor was selected (for example MQ-3), the variation of sensor response is displayed in the second plot. Numeric indicator displays the numeric values on the front panel.
Figure7. Front panel showing sensor response for guava (in volts):
(no gas sensor selected).
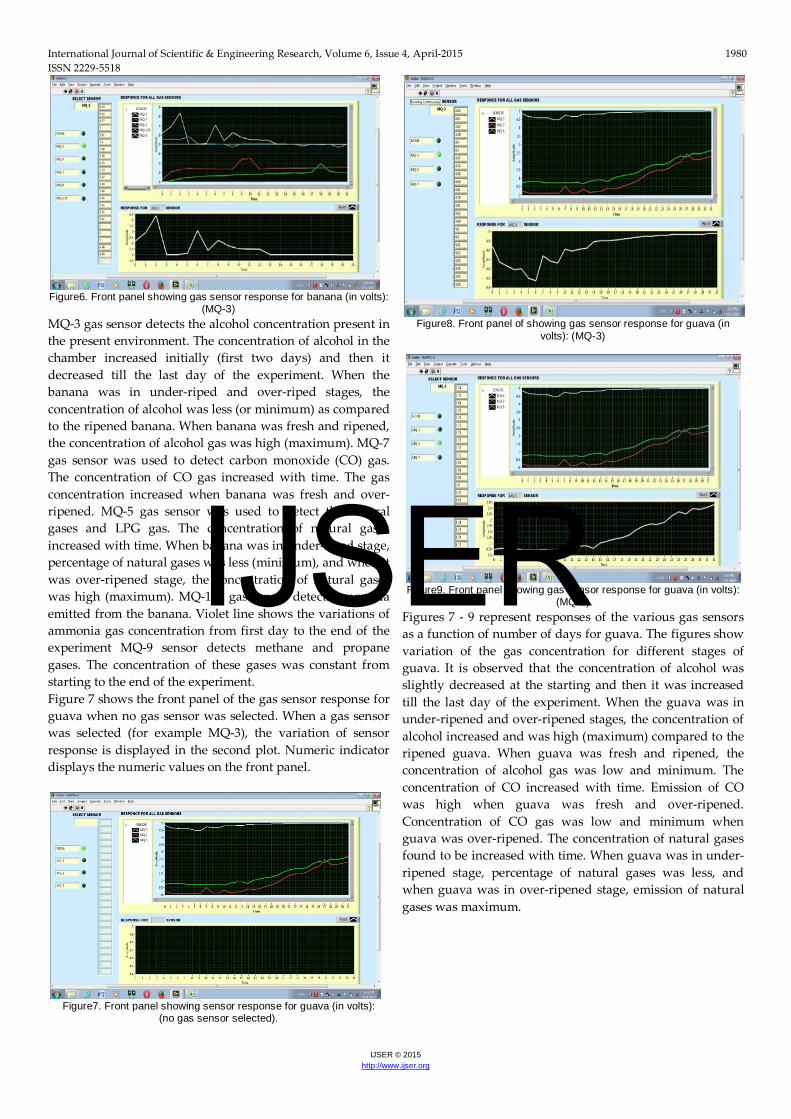
Figure8. Front panel of showing gas sensor response for guava (in
volts): (MQ-3)
Figure9. Front panel showing gas sensor response for guava (in volts): (MQ-5)
Figures 7 - 9 represent responses of the various gas sensors as a function of number of days for guava. The figures show variation of the gas concentration for different stages of guava. It is observed that the concentration of alcohol was slightly decreased at the starting and then it was increased till the last day of the experiment. When the guava was in under-ripened and over-ripened stages, the concentration of alcohol increased and was high (maximum) compared to the ripened guava. When guava was fresh and ripened, the concentration of alcohol gas was low and minimum. The concentration of CO increased with time. Emission of CO was high when guava was fresh and over-ripened. Concentration of CO gas was low and minimum when guava was over-ripened. The concentration of natural gases found to be increased with time. When guava was in under-ripened stage, percentage of natural gases was less, and when guava was in over-ripened stage, emission of natural gases was maximum.
IJSER

International Journal of Scientific & Engineering Research, Volume 6, Issue 4, April-2015 1981 ISSN 2229-5518
IJSER © 2015 http://www.ijser.org
Figure10. Front panel and block diagram for given system
Figure11. LabVIEW GUI for artificial neural network
Figures 10 and 11 respectively represent the front panel, block diagram and LabVIEW GUI for ANN of the system. It is a simple G-code used to display the various gas concentrations at a particular time.
4 Conclusions: Various types of fruits emit various gases in various concentrations. An electronic nose is a non-destructive method of testing the quality of the fruits and is an efficient and easy technique to determine the freshness of the fruits. Developed system is an unique and novel sensor based technique that points out the different stages of banana and guava; the under-ripened, ripened and over ripened. Even, properly time monitored and controlled system can awake the customer for edible state of the fruits. The technique requires a simple and costless gas chamber like tight plastic box or a closed metallic chamber. The system can be modified and made many fold to determine the state of the art for other fruits also (work underway). The experiment was performed in a close tight chamber; instead it is required to be conducted in open atmosphere, which can difficult challenge task. Acknowledgments: We are very much thankful to the School of Physical Sciences, Solapur University, Solapur for providing the laboratory facilities to carry out this type of work. Authors thank Dr.U.K.H.Bangi for her co-operation and help. Encouragement by our T.F. and SSR group (Physics) is highly acknowledged.
REFERENCES [1] E.L. Hines, E. Llobet and J.W. “Neural network based electronic nose for apple ripeness determination Gardner Authorized licensed use
limited to: WARWICK UNIVERSITY.” Downloaded on January 7, 009 at 07:04 from IEEE Xplore. [2] PARE, J.R.J., and BELENGER, I.M.R. (Eds.): ‘InStIUmental techniques in food analysis’ (Elsevier, Amsterdam, 1997) [3] CHO, s.I., KRUTZ, G.w., GIBSON, H.G., and HAGHIGHI, K.: “Magnet console design of an NMR-based sensor to detect ripeness of fruit”, Trans. ASAE, 1990, 33, (4), pp. 1043-1050 [4] WAI, w.K., STROSHINE, R.L., and KRUTZ, G.w.: “Modified Hahn echo pulse sequence for proton magnetic resonance (1H-MR) measurements of percent soluble solids of fruits”, Trans. ASAE, 1995, 38, (3), pp. 849-855 [5] WARD, G., and NUSSINOVITCH, A.”Peel gloss as a potential indicator of banana ripeness”, Lebensm.- Wiss. u.-Technol., 1996,29, pp. 289-294 [6] GALILI, N., SHMULEVICH, I., and BENICHOU, N.”Acoustic testing of avocado for fruit ripeness evaluation” Trans. ASAE, 1998, 41, (2), pp, 399407 [7] Shyam Gopal Sharma EMIL/ISTC, CSIO/CSIR, Chandigarh “IMPLEMENTATION OF ARTIFICIAL NEURAL NETWORK FOR ODOR IDENTIFICATION USING E-NOSE [email protected], NCCI 2010 -National Conference on Computational Instrumentation CSIO Chandigarh, INDIA, 19-20 March 2010 187 [8] T. Seiyama, A. Kato, K. Fujiishi, and M. Nagatani, “ A new detector for gaseous components using semiconducting thin films” Anal. Chem. 34, 1502 (1962). [9] K. Ihokura and J. Watson,“The Stannic Oxide Gas Sensor— Principles and Applications.” CRC Press, Boca Raton, FL, 1994. [10]. N. Yamazoe, Sens. Actuators B 6, 9 (1992). [11] W. Göpel in “Sensors: A Comprehensive Survey” (Göpel, Hesse,and Zemel, Eds.), Weinheim: VCH, 1992. [12] V. M. Jiménez, A. R. González-Elipe, J. P. Espinós, A. Justo, andA. Fernández, Sens. Actuators B 31, 29 (1996). [13] W. Göpel and K. D. Schierbaum, Sens. Actuators B 26, 1 (1995) [14] N. Yamazoe, Sens. Actuators B 5, 7 (1991). [15] Functional Nanomaterials (Hardcover) by Kurt E Geckeler (Editor), Edward Rosenberg (Editor) American Scientific Publishers, 10/2005, ISBN: 1588830675/ ISBN-13: 9781588830678 [16] M.S.Kasbe1, T.H.Mujawar1, V.D.Bachuwar1, L.P. Deshmukh1, A.D. Shaligram2 “Freshness study of non-destructive papaya by using an electronic nose “IJCAES - VOL-V – SI – CCSN – 2014
IJSER

International Journal of Scientific & Engineering Research, Volume 6, Issue 4, April-2015 1982 ISSN 2229-5518
IJSER © 2015 http://www.ijser.org
IJSER