Embed Size (px)
Citation preview
Introduction
Living Up to Your Potential
Knowing the state of your industry, both nationally and locally creates opportunities for better, more objective business plan-ning. Both complacency and over-eagerness can stem from false assumptions about what your home health care agency should achieve. Knowing the state of your industry and the census of your competi-tion will inform the process of setting goals for your business. In the Home Health Care U.S. Review, Brazzell Marketing Agency uses Medicare cost reports and other government sources to create a data-based picture of America’s home health industry. In addition, Brazzell Marketing Agency offers The Brazzell Report (www.TheBrazzellReport.com) so home health agencies and allied businesses can evaluate their own, local markets. Copyright Brazzell Marketing Agency www.TheBrazzellReport.com [email protected] 621 Nuckolls Curve Rd Galax, VA 24333 (866) 272-3799
1 Brazzell Marketing Agency www.TheBrazzellReport.com
Contents Is Your Agency Average . . . . . . . . . . . . 2
Where Your Agency Stands Nationwide 3
Competition Growth Slows . . . . . . . . . . . 4
What Percentage of My Census
Should be Medicare . . . . . . . . . . . . . 5
How Big is the Hospital
Marketing Advantage . . . . . . . . . . . 6
How Many Visits Patients Get . . . 7
How Much is Medicare Paying . . . . 8
How Big is the Home Health Market . . . . 9
What are the Most Competitive States . . 10
Focusing Marketing Efforts . . . . . . . . . . . . 11
Placing a New Home Health Agency . . . . 11
The Top Ten Agencies . . . . . . . . . . . . . . . . 12
Special Feature: Making a Tangible
Difference . . . . . . . . . . . . . . . . . . . . . . 15
Appendix I: The Brazzell Report . . . . . . . . 17
Appendix II: Why Market Metrics . . . . . . . 18
Appendix III: Branding Excellence . . . . . . . 19
Resources . . . . . . . . . . . . . . . . . . . . . . . . . . 20
Is Your Agency Average?
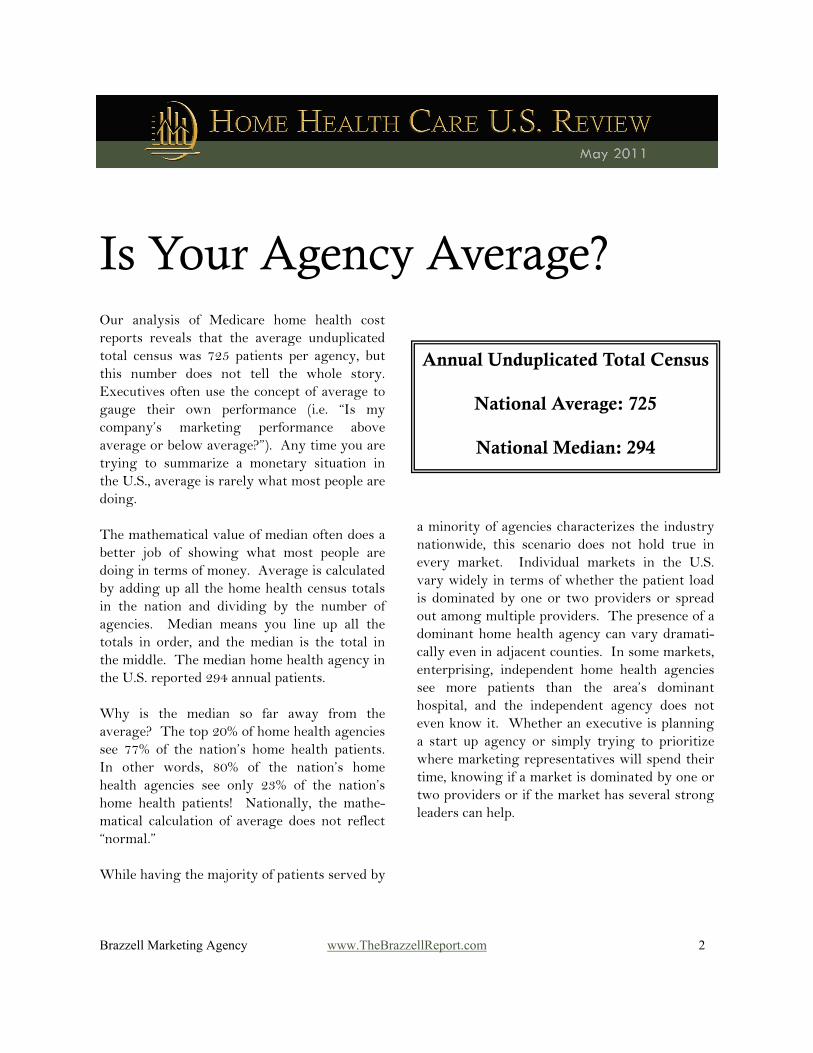
Our analysis of Medicare home health cost reports reveals that the average unduplicated total census was 725 patients per agency, but this number does not tell the whole story. Executives often use the concept of average to gauge their own performance (i.e. “Is my company’s marketing performance above average or below average?”). Any time you are trying to summarize a monetary situation in the U.S., average is rarely what most people are doing. The mathematical value of median often does a better job of showing what most people are doing in terms of money. Average is calculated by adding up all the home health census totals in the nation and dividing by the number of agencies. Median means you line up all the totals in order, and the median is the total in the middle. The median home health agency in the U.S. reported 294 annual patients. Why is the median so far away from the average? The top 20% of home health agencies see 77% of the nation’s home health patients. In other words, 80% of the nation’s home health agencies see only 23% of the nation’s home health patients! Nationally, the mathe-matical calculation of average does not reflect “normal.” While having the majority of patients served by
2 Brazzell Marketing Agency www.TheBrazzellReport.com
a minority of agencies characterizes the industry nationwide, this scenario does not hold true in every market. Individual markets in the U.S. vary widely in terms of whether the patient load is dominated by one or two providers or spread out among multiple providers. The presence of a dominant home health agency can vary dramati-cally even in adjacent counties. In some markets, enterprising, independent home health agencies see more patients than the area’s dominant hospital, and the independent agency does not even know it. Whether an executive is planning a start up agency or simply trying to prioritize where marketing representatives will spend their time, knowing if a market is dominated by one or two providers or if the market has several strong leaders can help.
Annual Unduplicated Total Census
National Average: 725
National Median: 294

Where Your Agency Stands Nationwide
To help executives get a better idea of where their home health agencies stand nationwide, we have divided the entire nation into five groups ranked by number of patients seen. Below we show the range of annual census in each group.
3 Brazzell Marketing Agency www.TheBrazzellReport.com
If your agency sees 300 patients per year, your agency is in the middle of the national spectrum. If your agency sees 1,000 patients each year, your agency is in the top 20%. This stratification suggests a cautionary note for entrepreneurs seeking to start a Medicare certified home health agency. Notice that 20% of Medicare certified home health agen-cies see fewer than 98 patients per year. Building a home health agency requires earn-ing the trust and respect of the community, especially the medical community. This can be slow going. While it is interesting to know how an agency stands in the national rankings, ex-ecutives can learn more from local data. The average and median census varies widely from county to county. There are multiple markets where the top providers are not even in the nation’s top 20%. There are other markets where the average provider is in the top 20%! For a home health executive to know how many patients her or his agency could and should be seeing, that executive must know the norms for the specific county or counties they serve. To know the census of your competition, visit www.TheBrazzellReport.com.
Top 20% of Home Health Agencies 1st to 20th Percentile Annual Census Range: 917 to 85,906
21st to 40th Percentile Annual Census Range: 406 to 916
The Middle 41st to 60th Percentile Annual Census Range: 209 to 406
61st to 80th Percentile Annual Census Range: 98 to 209
Bottom 20% of Agencies 81st to 100th Percentile Annual Census Range: 1 to 98

Competition Growth Slows Most home health agencies have experi-enced downward pressure on their census, and executives often blame increased competition. National data provides mild support for this assumption. As a measure of the growing competition in Medicare certified home health, below we show the number of home health agency cost reports submitted each year (hospital cost reports and nursing home cost reports not included). While the rate of increase has cooled off roughly 30% in the latter years, the number of active home health agencies still seems to be rising sharply each year.
4 Brazzell Marketing Agency www.TheBrazzellReport.com
While the number of patients seen by all home health agencies actually went down 1%, the average census fell 6% from 2008 to 2009. The median census fell 10%. As a group, the top 1,000 agencies and the top 2000 agencies saw 2% fewer patients, comparing 2009 to 2008. This suggests that the increasing number of home health agencies has reduced the size of the average home health agency. It also suggests that the increased competition is having a greater affect on average size home health agencies than it is on top 20% home health agencies. However, keep in mind that many new home health agencies do not make it or struggle for many years. A large portion of home health agencies do not report any census on their cost reports, typically because their census was so low that they were not required to submit that worksheet. Roughly 10% of all cost reports show no census and were from agencies more than one year old. One should not assume that the new agency in their area is what’s affecting the agency census. Only the local data can help executives know if it’s the new or the old agencies gaining market share. Knowing which agencies are achieving marketing success can help a great deal when strategizing about how to win those referrals back or defend against new competition. *Calculated after throwing out all the cost reports that did not show a census or showed zero.
0
1000
2000
3000
4000
5000
6000
7000
8000
9000
10000
2002
2003
2004
2005
2006
2007
2008
2009
Year
Num
ber
of H
HA
Cos
t Re
port
s
Number of Home Health Cost Reports
Submitted Each Year
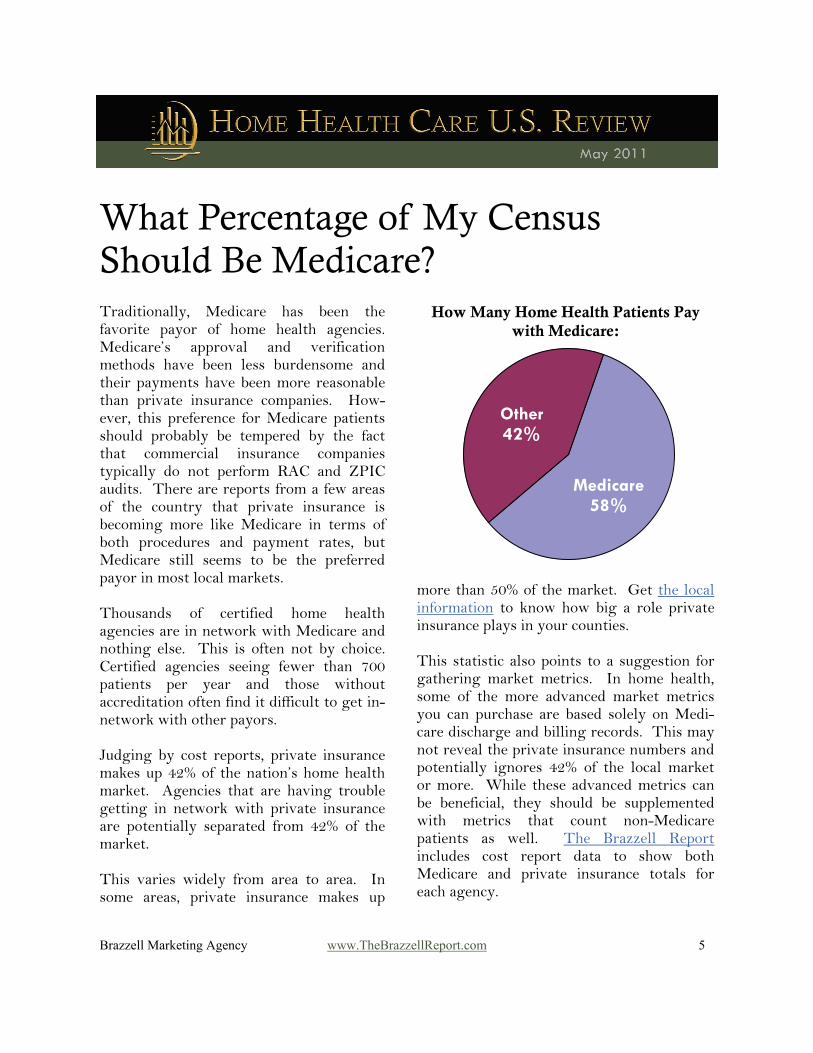
What Percentage of My Census Should Be Medicare? Traditionally, Medicare has been the favorite payor of home health agencies. Medicare’s approval and verification methods have been less burdensome and their payments have been more reasonable than private insurance companies. How-ever, this preference for Medicare patients should probably be tempered by the fact that commercial insurance companies typically do not perform RAC and ZPIC audits. There are reports from a few areas of the country that private insurance is becoming more like Medicare in terms of both procedures and payment rates, but Medicare still seems to be the preferred payor in most local markets. Thousands of certified home health agencies are in network with Medicare and nothing else. This is often not by choice. Certified agencies seeing fewer than 700 patients per year and those without accreditation often find it difficult to get in-network with other payors. Judging by cost reports, private insurance makes up 42% of the nation’s home health market. Agencies that are having trouble getting in network with private insurance are potentially separated from 42% of the market. This varies widely from area to area. In some areas, private insurance makes up
5 Brazzell Marketing Agency www.TheBrazzellReport.com
more than 50% of the market. Get the local information to know how big a role private insurance plays in your counties. This statistic also points to a suggestion for gathering market metrics. In home health, some of the more advanced market metrics you can purchase are based solely on Medi-care discharge and billing records. This may not reveal the private insurance numbers and potentially ignores 42% of the local market or more. While these advanced metrics can be beneficial, they should be supplemented with metrics that count non-Medicare patients as well. The Brazzell Report includes cost report data to show both Medicare and private insurance totals for each agency.
How Many Home Health Patients Pay with Medicare:
Other 42%
Medicare 58%
How Big is the Hospital Marketing Advantage?
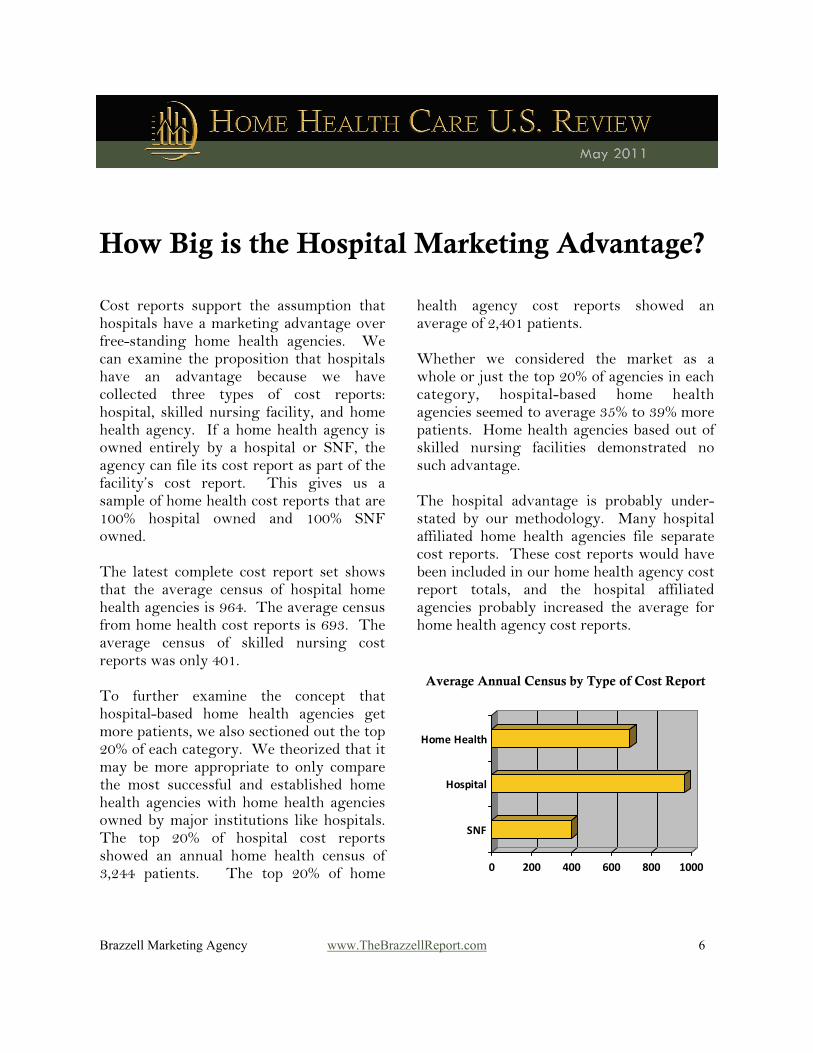
Cost reports support the assumption that hospitals have a marketing advantage over free-standing home health agencies. We can examine the proposition that hospitals have an advantage because we have collected three types of cost reports: hospital, skilled nursing facility, and home health agency. If a home health agency is owned entirely by a hospital or SNF, the agency can file its cost report as part of the facility’s cost report. This gives us a sample of home health cost reports that are 100% hospital owned and 100% SNF owned. The latest complete cost report set shows that the average census of hospital home health agencies is 964. The average census from home health cost reports is 693. The average census of skilled nursing cost reports was only 401. To further examine the concept that hospital-based home health agencies get more patients, we also sectioned out the top 20% of each category. We theorized that it may be more appropriate to only compare the most successful and established home health agencies with home health agencies owned by major institutions like hospitals. The top 20% of hospital cost reports showed an annual home health census of 3,244 patients. The top 20% of home
6 Brazzell Marketing Agency www.TheBrazzellReport.com
health agency cost reports showed an average of 2,401 patients. Whether we considered the market as a whole or just the top 20% of agencies in each category, hospital-based home health agencies seemed to average 35% to 39% more patients. Home health agencies based out of skilled nursing facilities demonstrated no such advantage. The hospital advantage is probably under-stated by our methodology. Many hospital affiliated home health agencies file separate cost reports. These cost reports would have been included in our home health agency cost report totals, and the hospital affiliated agencies probably increased the average for home health agency cost reports.
0 200 400 600 800 1000
SNF
Hospital
Home Health
Average Annual Census by Type of Cost Report
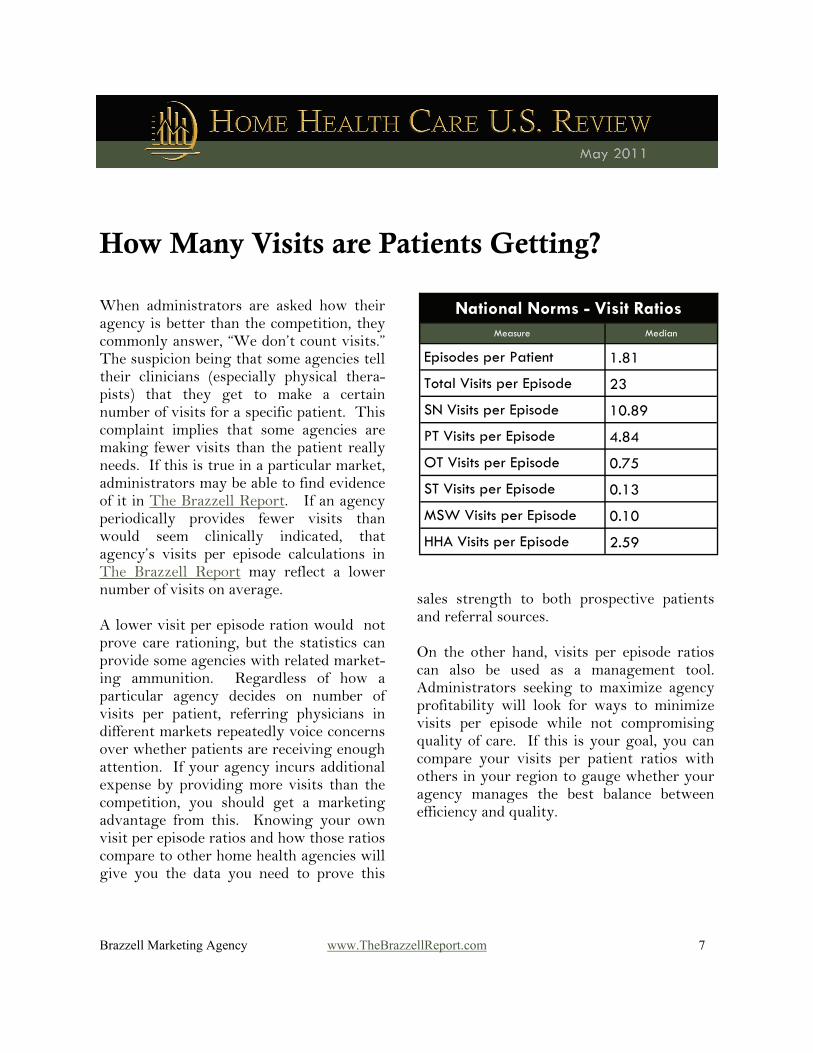
National Norms - Visit Ratios Measure Median
Episodes per Patient 1.81
Total Visits per Episode 23
SN Visits per Episode 10.89
PT Visits per Episode 4.84
OT Visits per Episode 0.75
ST Visits per Episode 0.13
MSW Visits per Episode 0.10
HHA Visits per Episode 2.59
How Many Visits are Patients Getting?
When administrators are asked how their agency is better than the competition, they commonly answer, “We don’t count visits.” The suspicion being that some agencies tell their clinicians (especially physical thera-pists) that they get to make a certain number of visits for a specific patient. This complaint implies that some agencies are making fewer visits than the patient really needs. If this is true in a particular market, administrators may be able to find evidence of it in The Brazzell Report. If an agency periodically provides fewer visits than would seem clinically indicated, that agency’s visits per episode calculations in The Brazzell Report may reflect a lower number of visits on average. A lower visit per episode ration would not prove care rationing, but the statistics can provide some agencies with related market-ing ammunition. Regardless of how a particular agency decides on number of visits per patient, referring physicians in different markets repeatedly voice concerns over whether patients are receiving enough attention. If your agency incurs additional expense by providing more visits than the competition, you should get a marketing advantage from this. Knowing your own visit per episode ratios and how those ratios compare to other home health agencies will give you the data you need to prove this
7 Brazzell Marketing Agency www.TheBrazzellReport.com
sales strength to both prospective patients and referral sources. On the other hand, visits per episode ratios can also be used as a management tool. Administrators seeking to maximize agency profitability will look for ways to minimize visits per episode while not compromising quality of care. If this is your goal, you can compare your visits per patient ratios with others in your region to gauge whether your agency manages the best balance between efficiency and quality.
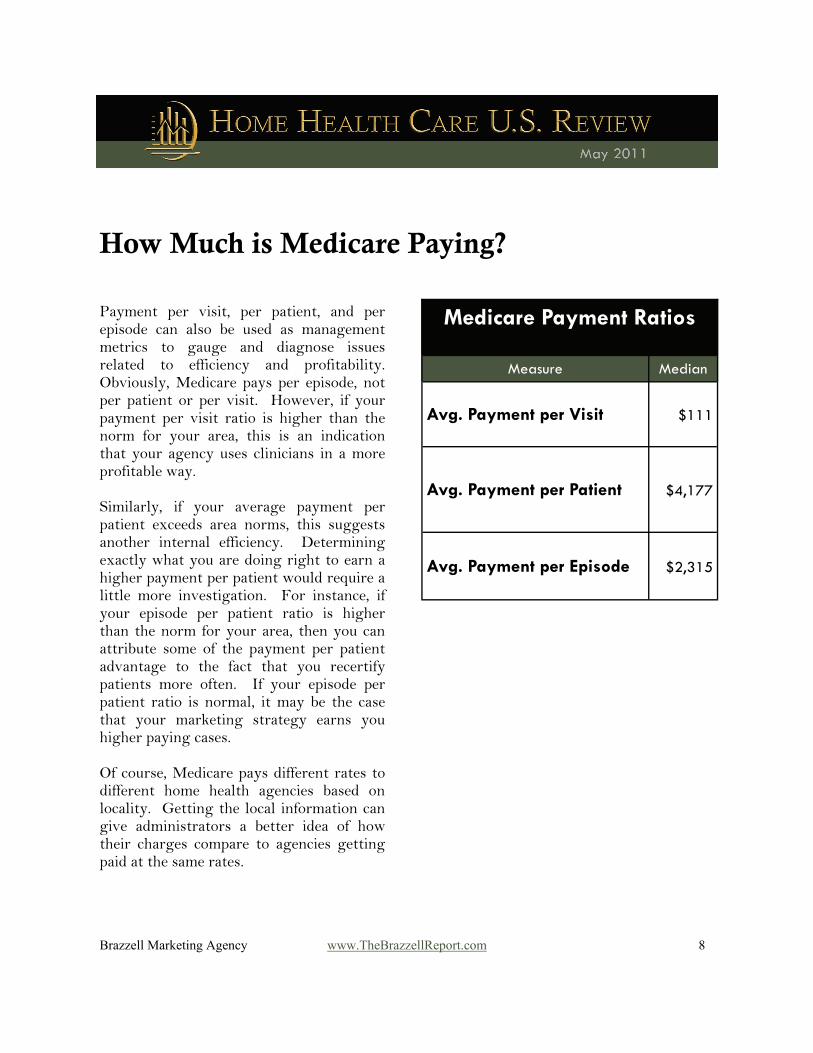
Medicare Payment Ratios
Measure Median
Avg. Payment per Visit $111
Avg. Payment per Patient $4,177
Avg. Payment per Episode $2,315
How Much is Medicare Paying?
Payment per visit, per patient, and per episode can also be used as management metrics to gauge and diagnose issues related to efficiency and profitability. Obviously, Medicare pays per episode, not per patient or per visit. However, if your payment per visit ratio is higher than the norm for your area, this is an indication that your agency uses clinicians in a more profitable way. Similarly, if your average payment per patient exceeds area norms, this suggests another internal efficiency. Determining exactly what you are doing right to earn a higher payment per patient would require a little more investigation. For instance, if your episode per patient ratio is higher than the norm for your area, then you can attribute some of the payment per patient advantage to the fact that you recertify patients more often. If your episode per patient ratio is normal, it may be the case that your marketing strategy earns you higher paying cases. Of course, Medicare pays different rates to different home health agencies based on locality. Getting the local information can give administrators a better idea of how their charges compare to agencies getting paid at the same rates.
8 Brazzell Marketing Agency www.TheBrazzellReport.com
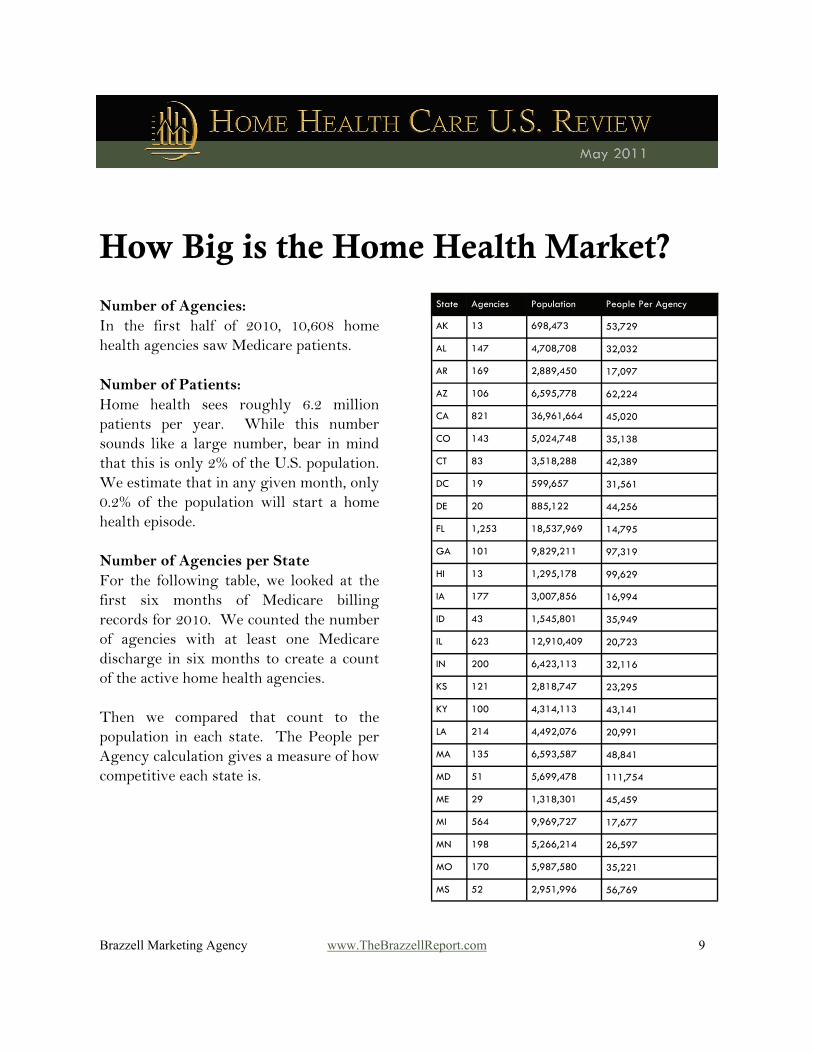
How Big is the Home Health Market? Number of Agencies: In the first half of 2010, 10,608 home health agencies saw Medicare patients. Number of Patients: Home health sees roughly 6.2 million patients per year. While this number sounds like a large number, bear in mind that this is only 2% of the U.S. population. We estimate that in any given month, only 0.2% of the population will start a home health episode. Number of Agencies per State For the following table, we looked at the first six months of Medicare billing records for 2010. We counted the number of agencies with at least one Medicare discharge in six months to create a count of the active home health agencies. Then we compared that count to the population in each state. The People per Agency calculation gives a measure of how competitive each state is.
9 Brazzell Marketing Agency www.TheBrazzellReport.com
State Agencies Population People Per Agency
AK 13 698,473 53,729
AL 147 4,708,708 32,032
AR 169 2,889,450 17,097
AZ 106 6,595,778 62,224
CA 821 36,961,664 45,020
CO 143 5,024,748 35,138
CT 83 3,518,288 42,389
DC 19 599,657 31,561
DE 20 885,122 44,256
FL 1,253 18,537,969 14,795
GA 101 9,829,211 97,319
HI 13 1,295,178 99,629
IA 177 3,007,856 16,994
ID 43 1,545,801 35,949
IL 623 12,910,409 20,723
IN 200 6,423,113 32,116
KS 121 2,818,747 23,295
KY 100 4,314,113 43,141
LA 214 4,492,076 20,991
MA 135 6,593,587 48,841
MD 51 5,699,478 111,754
ME 29 1,318,301 45,459
MI 564 9,969,727 17,677
MN 198 5,266,214 26,597
MO 170 5,987,580 35,221
MS 52 2,951,996 56,769

What are the Most Competitive States? As a measure of competitiveness, we compared the number of active home health agencies to the population in each state (see previous page for beginning of table). The ten most competitive home health states are: 1. Texas 2. Florida 3. Oklahoma 4. Iowa 5. Arkansas 6. Michigan 7. Illinois 8. Wyoming 9. Louisiana 10. Ohio The ten least competitive states are: 1. New Jersey 2. Washington 3. Maryland 4. New York 5. Hawaii 6. Georgia 7. Oregon 8. South Carolina 9. Arizona 10. Mississippi
10 Brazzell Marketing Agency www.TheBrazzellReport.com
State Agencies Population People Per Agency
MT 33 974,989 29,545
NC 170 9,380,884 55,182
ND 21 646,844 30,802
NE 68 1,796,619 26,421
NH 34 1,324,575 38,958
NJ 50 8,707,739 174,155
NM 69 2,009,671 29,126
NV 95 2,643,085 27,822
NY 189 19,541,453 103,394
OH 543 11,542,645 21,257
OK 236 3,687,050 15,623
OR 55 3,825,657 69,557
PA 336 12,604,767 37,514
RI 22 1,053,209 47,873
SC 67 4,561,242 68,078
SD 37 812,383 21,956
TN 141 6,296,254 44,654
TX 2,274 24,782,302 10,898
UT 81 2,784,572 34,377
VA 196 7,882,590 40,217
VT 12 621,760 51,813
WA 58 6,664,195 114,900
WI 123 5,654,774 45,974
WV 56 1,819,777 32,496
WY 26 544,270 20,933

Focusing Your Marketing Efforts Placing a New Home Health Agency Focusing Marketing Efforts: With limited resources and wide possibili-ties for service area, many home health agencies often try to decide if one geo-graphic area is better than another for focusing marketing efforts. Just like the previous pages showed which states are the most competitive, a customized Brazzell Report can show which counties and zip codes are the most competitive relative to the county’s population. In general, focusing marketing efforts in lesser competitive counties, tends to yield better results. Focusing on the right competition also proves beneficial. Customers (in this case physicians and case managers) will ask for many things, but not everything they request will make them more loyal or more active referral sources. Marketing execu-tives and home health administrators need to know what referral sources are respond-ing to. The Brazzell Report assists with this analysis. By identifying the more successful agencies, The Brazzell Report shows executives which agencies to focus on. Knowing which agencies are succeed-ing and which agencies are shrinking* will help executives determine which competi-tor’s have marketing plans worth emulat-
11 Brazzell Marketing Agency www.TheBrazzellReport.com
ing and which competitors might be losing referral sources. Placing a New Agency: If you are looking to start a new home health agency anywhere in the nation, the previous two pages can point executives to the states that are the least competitive. However, this information should be supplemented by local reports (i.e. customized Brazzell Reports). Within each state, the level of competition varies widely from county to county. Even Texas has several counties that are only moderately competitive. Even Mississippi has counties that are highly competitive. *To trend growth patterns, an agency would need to order more than one Brazzell Report in subsequent years / editions.
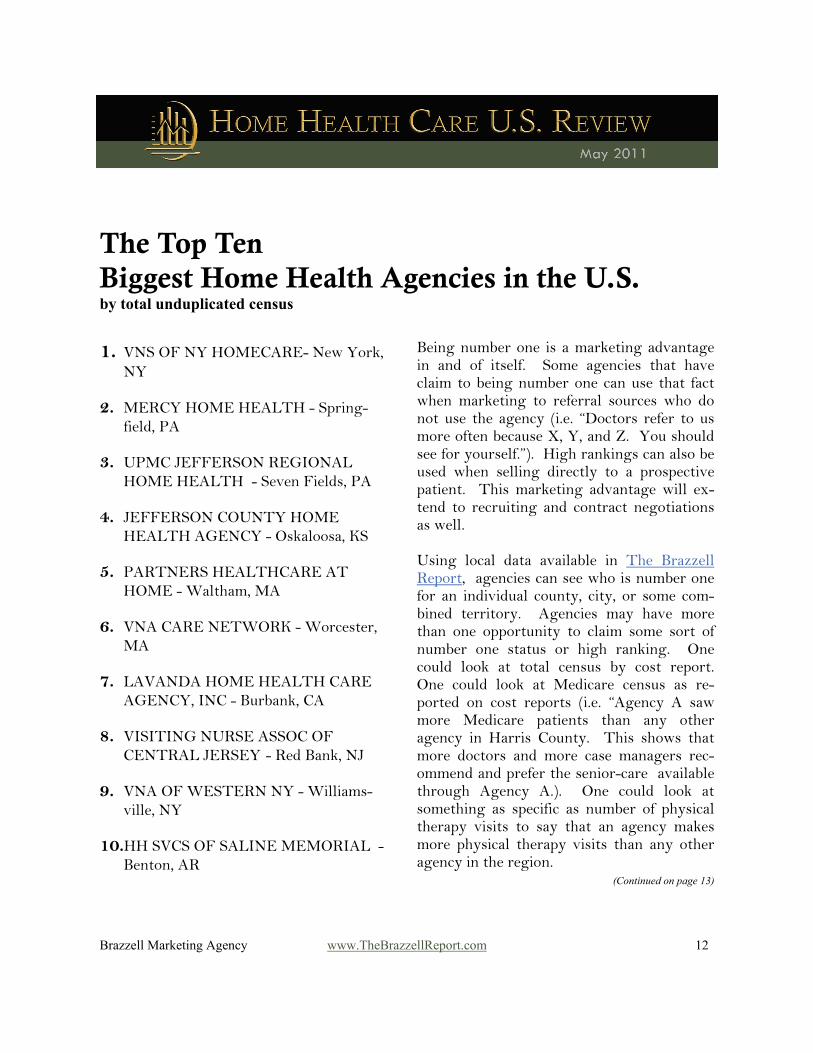
The Top Ten Biggest Home Health Agencies in the U.S. by total unduplicated census
1. VNS OF NY HOMECARE- New York, NY
2. MERCY HOME HEALTH - Spring-field, PA
3. UPMC JEFFERSON REGIONAL HOME HEALTH - Seven Fields, PA
4. JEFFERSON COUNTY HOME HEALTH AGENCY - Oskaloosa, KS
5. PARTNERS HEALTHCARE AT HOME - Waltham, MA
6. VNA CARE NETWORK - Worcester, MA
7. LAVANDA HOME HEALTH CARE AGENCY, INC - Burbank, CA
8. VISITING NURSE ASSOC OF CENTRAL JERSEY - Red Bank, NJ
9. VNA OF WESTERN NY - Williams-ville, NY
10.HH SVCS OF SALINE MEMORIAL - Benton, AR
12 Brazzell Marketing Agency www.TheBrazzellReport.com
Being number one is a marketing advantage in and of itself. Some agencies that have claim to being number one can use that fact when marketing to referral sources who do not use the agency (i.e. “Doctors refer to us more often because X, Y, and Z. You should see for yourself.”). High rankings can also be used when selling directly to a prospective patient. This marketing advantage will ex-tend to recruiting and contract negotiations as well. Using local data available in The Brazzell Report, agencies can see who is number one for an individual county, city, or some com-bined territory. Agencies may have more than one opportunity to claim some sort of number one status or high ranking. One could look at total census by cost report. One could look at Medicare census as re-ported on cost reports (i.e. “Agency A saw more Medicare patients than any other agency in Harris County. This shows that more doctors and more case managers rec-ommend and prefer the senior-care available through Agency A.). One could look at something as specific as number of physical therapy visits to say that an agency makes more physical therapy visits than any other agency in the region.
(Continued on page 13)
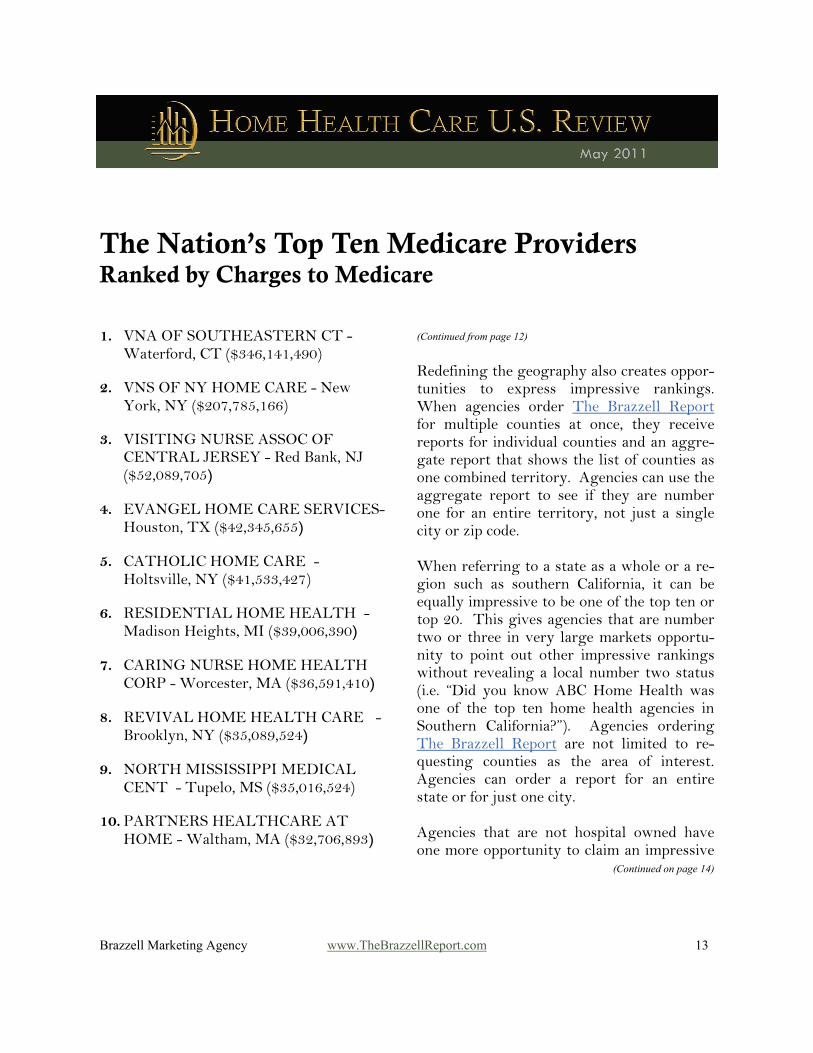
The Nation’s Top Ten Medicare Providers Ranked by Charges to Medicare
1. VNA OF SOUTHEASTERN CT - Waterford, CT ($346,141,490)
2. VNS OF NY HOME CARE - New York, NY ($207,785,166)
3. VISITING NURSE ASSOC OF CENTRAL JERSEY - Red Bank, NJ ($52,089,705)
4. EVANGEL HOME CARE SERVICES- Houston, TX ($42,345,655)
5. CATHOLIC HOME CARE - Holtsville, NY ($41,533,427)
6. RESIDENTIAL HOME HEALTH - Madison Heights, MI ($39,006,390)
7. CARING NURSE HOME HEALTH CORP - Worcester, MA ($36,591,410)
8. REVIVAL HOME HEALTH CARE - Brooklyn, NY ($35,089,524)
9. NORTH MISSISSIPPI MEDICAL CENT - Tupelo, MS ($35,016,524)
10. PARTNERS HEALTHCARE AT HOME - Waltham, MA ($32,706,893)
13 Brazzell Marketing Agency www.TheBrazzellReport.com
Redefining the geography also creates oppor-tunities to express impressive rankings. When agencies order The Brazzell Report for multiple counties at once, they receive reports for individual counties and an aggre-gate report that shows the list of counties as one combined territory. Agencies can use the aggregate report to see if they are number one for an entire territory, not just a single city or zip code. When referring to a state as a whole or a re-gion such as southern California, it can be equally impressive to be one of the top ten or top 20. This gives agencies that are number two or three in very large markets opportu-nity to point out other impressive rankings without revealing a local number two status (i.e. “Did you know ABC Home Health was one of the top ten home health agencies in Southern California?”). Agencies ordering The Brazzell Report are not limited to re-questing counties as the area of interest. Agencies can order a report for an entire state or for just one city. Agencies that are not hospital owned have one more opportunity to claim an impressive
(Continued from page 12)
(Continued on page 14)
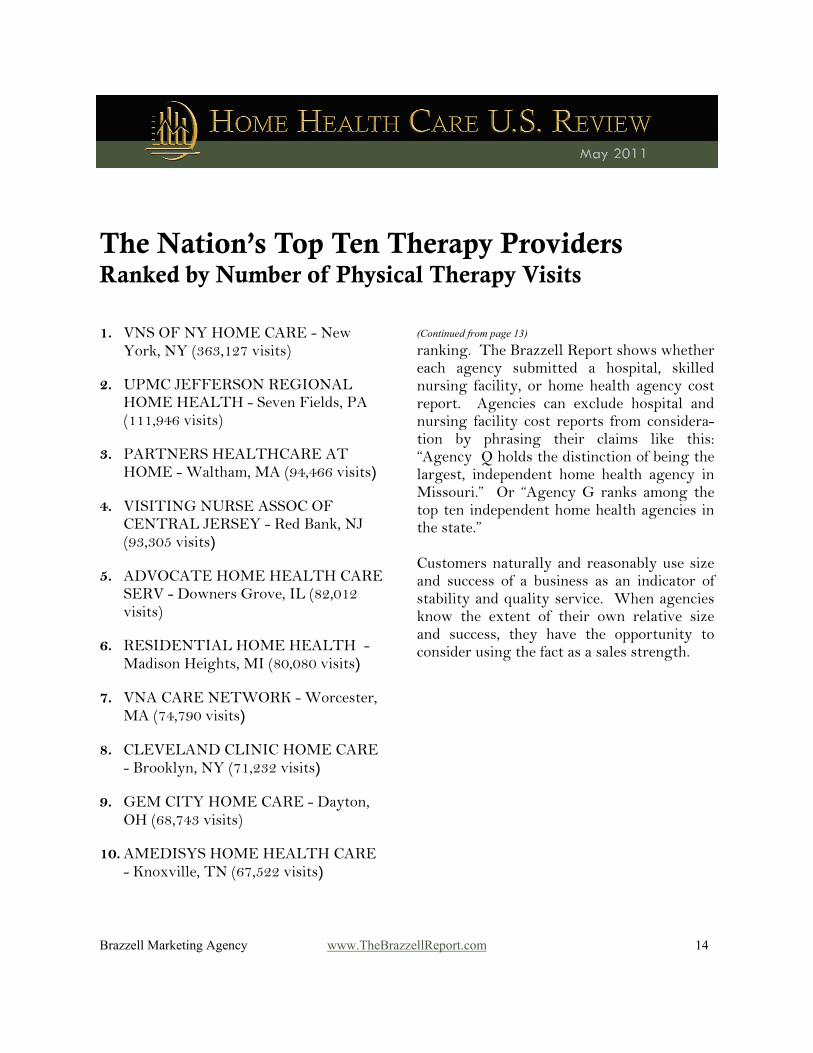
The Nation’s Top Ten Therapy Providers Ranked by Number of Physical Therapy Visits
1. VNS OF NY HOME CARE - New York, NY (363,127 visits)
2. UPMC JEFFERSON REGIONAL HOME HEALTH - Seven Fields, PA (111,946 visits)
3. PARTNERS HEALTHCARE AT HOME - Waltham, MA (94,466 visits)
4. VISITING NURSE ASSOC OF CENTRAL JERSEY - Red Bank, NJ (93,305 visits)
5. ADVOCATE HOME HEALTH CARE SERV - Downers Grove, IL (82,012 visits)
6. RESIDENTIAL HOME HEALTH - Madison Heights, MI (80,080 visits)
7. VNA CARE NETWORK - Worcester, MA (74,790 visits)
8. CLEVELAND CLINIC HOME CARE - Brooklyn, NY (71,232 visits)
9. GEM CITY HOME CARE - Dayton, OH (68,743 visits)
10. AMEDISYS HOME HEALTH CARE - Knoxville, TN (67,522 visits)
14 Brazzell Marketing Agency www.TheBrazzellReport.com
ranking. The Brazzell Report shows whether each agency submitted a hospital, skilled nursing facility, or home health agency cost report. Agencies can exclude hospital and nursing facility cost reports from considera-tion by phrasing their claims like this: “Agency Q holds the distinction of being the largest, independent home health agency in Missouri.” Or “Agency G ranks among the top ten independent home health agencies in the state.” Customers naturally and reasonably use size and success of a business as an indicator of stability and quality service. When agencies know the extent of their own relative size and success, they have the opportunity to consider using the fact as a sales strength.
(Continued from page 13)

Special Feature: Marketing Advice Column from Gary Brazzell
Make a Tangible Difference -Say it Over and Over-
“Excellent firms don’t believe in excellence,
only in constant improvement and constant change.” – Tom Peters, a renowned management consultant -
Business always has been and always will be about “What have you done for me lately?” From the way you respond to your employees to the way your referral sources respond to your agency, a success this quarter always overshadows a success from a year or two ago. Constant improvement and change ultimately increases referrals, but only under certain circumstances. If a provider wants referral sources to base new referrals on anything other than personal relationships or corporate allegiance, that provider must differentiate itself in its community. Sometimes, differentiation can be as simple as being the one that does the most physician education or the most physician courting. However, in today’s highly competitive home health market, further differentiation is usually required to gain a competitive advantage. Providers sometimes attempt to differenti-ate themselves with exciting descriptions
15 Brazzell Marketing Agency www.TheBrazzellReport.com
such as, “pioneering,” “more caring,” “heroes,” “premier,” etc. Administrators should bear in mind that medical referral sources are both highly educated and highly inundated - making them rather impervious to unfounded advertising-speak. Doctors will be looking for proof of marketing claims. In physician oriented literature, if one states that the company is a pioneer, one should also explain what new ground that company broke. For the best effect with referral sources, blend exciting descriptions with factual support. The question becomes for each owner and administrator, “What factual truth makes me a better choice than my competitor?” Using The Brazzell Report to collect relevant local market data, marketing managers can fashion proof of marketing claims such as these (and more): • “Patients you refer to us get more
attention. Compared to other agencies in the city, cost report data shows we provide 30% more nursing visits per episode.”

• “Patients you refer to us get the support they deserve. Compared to other agencies in the state, we provide 25% more aide visits per episode.”
• “Truly multidisciplinary care leads to better results. Patients with XYZ home health are 100% more likely to receive a visit from a social worker, and 40% more likely to receive consultation from an OT.”
• “Certified in 1982, we are the most experienced Medicare certified home health agency in the region.”
• “We are the largest independent home health agency in the region.”
Other common ways to differentiate one healthcare provider from the next include: • Associating your company with a
highly respected brand or institution • New programs • New equipment • Clinical outcome measures • Specialized training • Awards • Satisfaction surveys • Improved methods for interacting with
referral sources A scheduled effort to make tangible improvements to services on a regular basis will help protect a provider from the occasional successes of competitors. For referral-based healthcare providers, the constant improvement and constant change can help garner new referrals only under one condition. Providers must
16 Brazzell Marketing Agency www.TheBrazzellReport.com
make referral sources aware of their services and advantages. Retail has the fantastic, inexpensive tool of in-store promo-tion. Referral-based healthcare providers, on the other hand, must reach out to referral sources in a deliberate and repetitive manner. Marketing statements on fax cover sheets and promotional inserts with mailed correspondence can help improve lines of communication with current referral sources. Providers must open and maintain lines of communication to effectively reach and motivate the occasional or inactive referral sources. The communications strategy should seek to make as many impressions as possible short of becoming annoying. Marketing efforts occasionally have perfect timing. The rep walks in an office on the very day that the competitor irritated the referral source. More often, however, the referral source needs to be able to remember your marketing message at a later date. This requires ongoing repetition. Brazzell Marketing Agency specializes in the communications needs of referral-based healthcare providers. Communications ideas are scattered throughout the Popular Services Page of the Brazzell Marketing Agency website [click here]. Paid consultation services to evaluate and brainstorm about communications plans are also available.

Appendix I: The Brazzell Report
Understanding your industry nationwide is not nearly as useful as knowing the same data for your own local market. The Brazzell Report makes local market metrics available at a cost that is easily affordable to any home health agency. Download a sample report at
www.TheBrazzellReport.com. Use the order form on the following pages to order The Brazzell Report for your area. The Brazzell Report brings together data from multiple government reports (including home health cost reports) to give you the most current and cost-effective market analysis tool possible. You specify the counties for which you would like market share data, and we produce a report including: • A list ranking the top 25 traditional
leaders in your market according to total census, Medicare charges, and Medicare census.
• A table showing each agency's exact
total census, Medicare census, and Medicare to other insurance ratio. This ratio identifies agencies whose market-ing plans are more successful at garnering a larger proportion of higher paying Medicare cases.
17 Brazzell Marketing Agency www.TheBrazzellReport.com
• Tables detailing each agency's number of visits per episode, number of episodes per patient, utilization of each discipline, and other marketing and management metrics.
• A chart comparing your selected area to
national norms in terms of elderly population, population density, number of home health agencies, average census, etc.
Use the following order form to order
The Brazzell Report for your area.
The Brazzell Report ORDER FORM (Page 1 of 2)
The Brazzell Report brings together data from multiple government sources to give you the most current and cost-effective market analysis tool possible. Please read a sample report at www.TheBrazzellReport.com before ordering. Contents: Census, charges, visits, and episode data based on 2009 cost reports for home health. Price: $86 for the first county you specify. $74 for each subsequent county.
Your Contact Information: Company:
Contact Name(s):
Contact Phone:
Contact Email Address:
How You Want to Receive the Report: Email Mail Both (+$21)
Mail The Brazzell Report to:
May We Add You to Our Email Newsletter and Announcements List? List your email address(es) below. We send up to 12 emails per year, but usually much less than that. Unsubscribe at any time by clicking the link at the bottom of each email.
Name Your Counties: On the following page, specify the areas for which you would like The Brazzell Report. For most home health agencies, this will simply be a list of the counties you serve. (Optional): We also provide the option of getting a report for an entire state or a single zip code. Purchasing a report with a state or zip code territory is only recommended for agencies that conduct statewide marketing plans or agencies that only serve very specific areas. Note, if there are more than 35 competitors in your given area, The Brazzell Report will show specific data for the top 35 competitors in your area, your agency’s specific data, and aggregate data for the area.
Toll Free: (866) 272-3799 621 Nuckolls Curve Rd / Galax, VA 24333 Fax: (276) 236-5070 E-Mail: [email protected] www.BrazzellMarketing.com
Payment: Credit Card: Total Authorized Charge: Card #: __ __ __ __ - __ __ __ __ - __ __ __ __ - __ __ __ __ Exp. ____ / ____ CV2 (three digit code from back of card): Name on Card: Billing Address for Card: Authorized Signature: Fax credit card payments to: BMA at (276) 236-5070 Check: Make checks payable to: Brazzell Marketing Agency Mail check to: Brazzell Marketing Agency 621 Nuckolls Curve Rd Galax, VA 24333
The Brazzell Report ORDER FORM (Page 2 of 2)
Area Name & State Type (zip, county (county equivalent), or state)
1.
2.
3.
4.
5. 6.
7.
8.
9.
10.
11.
12.
13.
14.
15.

Appendix II: Why Home Health Executives Should Know the Census of Their Competition
• In our experience, many home health administrators asked to name their fastest rising, serious competition, name the wrong agencies. The fastest growing agencies are the ones making a difference to their referral sources. First learn who they are so you can then know whom to watch and whom to beat.
• It is impossible to truly gauge the effectiveness of your marketing plan unless you know what is happening to your market as a whole. How much your market as a whole is shrinking or growing affects how you should judge the growth of your own agency.
• When you know how many referrals your competitors are getting (in other words, how many referrals you are not getting), you can better predict the possible gains from different marketing strategies.
• If you are starting a Medicare certified home health agency, knowing the size of your market and the relative size of different competitors will better inform the business plan and marketing plan.
18 Brazzell Marketing Agency www.TheBrazzellReport.com
How can you estimate how many patients your new agency will get without knowing how many patients similar agencies get?
• Need more? Get six real-world examples of how home health care agencies have used The Brazzell Report to improve their marketing plans. [Click Here]
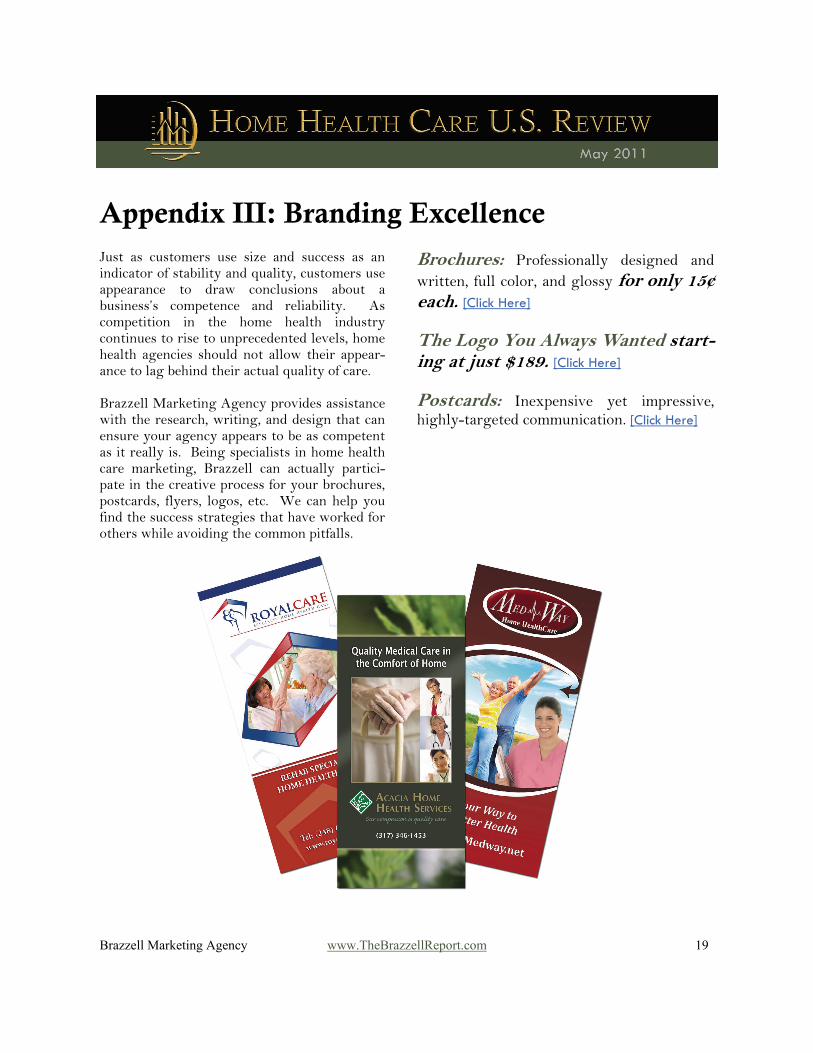
Appendix III: Branding Excellence Just as customers use size and success as an indicator of stability and quality, customers use appearance to draw conclusions about a business’s competence and reliability. As competition in the home health industry continues to rise to unprecedented levels, home health agencies should not allow their appear-ance to lag behind their actual quality of care. Brazzell Marketing Agency provides assistance with the research, writing, and design that can ensure your agency appears to be as competent as it really is. Being specialists in home health care marketing, Brazzell can actually partici-pate in the creative process for your brochures, postcards, flyers, logos, etc. We can help you find the success strategies that have worked for others while avoiding the common pitfalls.
19 Brazzell Marketing Agency www.TheBrazzellReport.com
Brochures: Professionally designed and written, full color, and glossy for only 15¢ each. [Click Here] The Logo You Always Wanted start-ing at just $189. [Click Here] Postcards: Inexpensive yet impressive, highly-targeted communication. [Click Here]
Resources
Data used to create the analyses in the Home Health Care U.S. Review comes in part from these resources. The United States Census Bureau Medicare OASIS-C records (Data set January through June 2010). 2009 Medicare Home Health Cost Reports:
2009 cost reports are the most current set available for the types of compara-tive analyses in this report. Home health agencies must submit cost reports within five months of their fiscal year end. Then processing the reports to the point they become available for public analysis takes up to 12 months. Therefore, the most thorough set of cost report data typically becomes available for analysis 17 months after a calendar year end.
20 Brazzell Marketing Agency www.TheBrazzellReport.com