Embed Size (px)
Citation preview

Zone President, North America
1

Building Our Future
5 Year Track Record
Who We Are 1
2
3
2

Building Our Future
5 Year Track Record
Who We Are 1
2
3
3

Largest beer profit pool
235 Mhl volume (2nd largest)
$247B in consumption (1.6% of US GDP)
$39B in direct federal, state and local taxes
Top 10 states are 54% of volume
Direct+Indirect employs 2.0M Americans
Over 2,500 brewers
4.7K brands; 8.8K SKUs
5 distinct channels; 500,000+ retailers
50 different franchise laws
Unique 3-tier system; 1500+ distributors
4
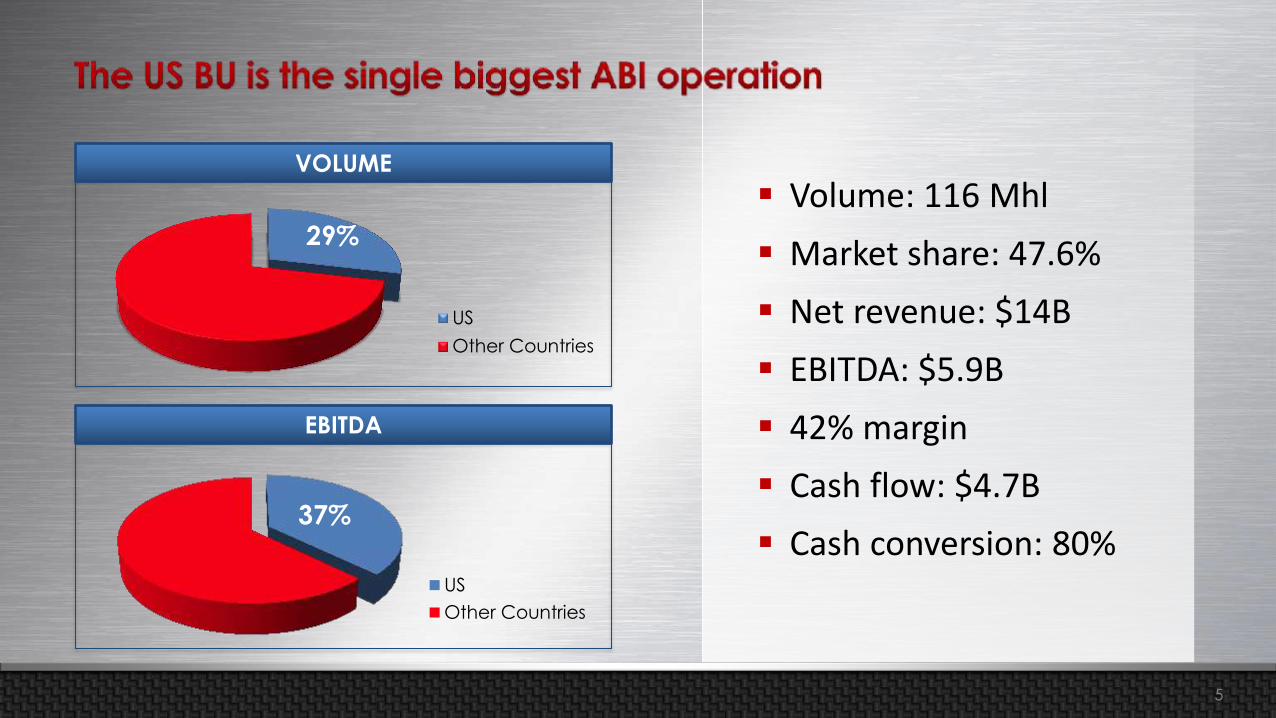
Volume: 116 Mhl
Market share: 47.6%
Net revenue: $14B
EBITDA: $5.9B
42% margin
Cash flow: $4.7B
Cash conversion: 80%
VOLUME
29%
US
Other Countries
EBITDA
37%
US
Other Countries
5

Value
Premium / Premium Light
Premium Plus and FMB
High End (Imports + Crafts) Brewer Market Share Top 10 US Brands
Michelob Ultra
Keystone Light
Corona Extra
Busch
Busch Light
Natural Light
Miller Lite
Budweiser
Coors Light
Bud Light
2%
2%
3%
3%
4%
5%
7%
7%
8%
21%
All Others
Pabst
Heineken
Crown
MillerCoors
ABI
12%
2%
4%
7%
27%
48%
Beck's is brewed in the U.S. in accordance with the German reinheitsgebot
brewing standard and competes against brands in the Import segment. 6

Brewing Expertise 12 + 1 State-of-the-art Breweries
13 breweries supply the whole US
One avg US brewery produces more
than the whole craft segment
Brew masters average 16 yrs. experience
Flexibility to produce over 1900 SKUs
High quality; Low risk
7

Agricultural Operations Packaging Operations
Elk Mountain Hop Farm – largest hop
farm in the world
Colorado barley research – largest
barley research facility in the world
Metal Container has 7 facilities and supplies 50% of our requirements
Lowest-cost, highest-quality
producer
Innovation
8

500 equity agreement wholesalers
90% of beer sold at wholesalers is ABI volume
Operational excellence driven through
Ambassadors of Excellence program
17 Wholesaler Operation Divisions (WOD),
10% of our volume
9

Building Our Future
5 Year Track Record
Who We Are 1
2
3
1 0

Other Achievements
EBITDA margin from 29% to 42%
Net revenues grew $0.6B
ZBB drove $1.3B in savings
Water use reduced 20% and
extract loss reduced 35%
Implemented ABI payment
term strategy
ROI discipline in CAPEX
+$2.1B
+$3.2B
EBITDA ($B)
Cash Flow ($B)
2008
3.8
2012
5.9
2008
1.5
2012
4.7
1 1

New Products
Budweiser Made in America
Bud Light Music First
Music
Sponsorships
New Packaging
1 2

Experienced, Diverse Leadership Team (avg. 20 years)
Focusing on Training Hiring Top Talent – 114 MBA & GMT
David Almeida VP Sale
15 Years
Paul Chibe VP Marketing
4 Years
Joao Guerra VP Finance
13 Years
James Brickey VP People
22 Years
James
Villenueve VP Corporate Affairs
26 Years
Luiz Edmond President
22 Years
Pete Kraemer VP Supply
23 Years
Pablo Gonzalez VP Logistics
19 Years
Lee Keathley VP Procurement
24 Years
Fued Sadala VP IBS
23 Years
Gary Rutledge VP Legal
15 Years 50%
55%
60%
65%
70%
75%
2008 2009 2010 2011 2012
Increasing Engagement
1 3

Overall best zone support group, US
Finance, Information & Business Services
in 2012
Sales and Supply in 2nd place
Oklahoma Lid Plant; St. Louis brewery
3rd place
1 4

Source: Cognos
3.7
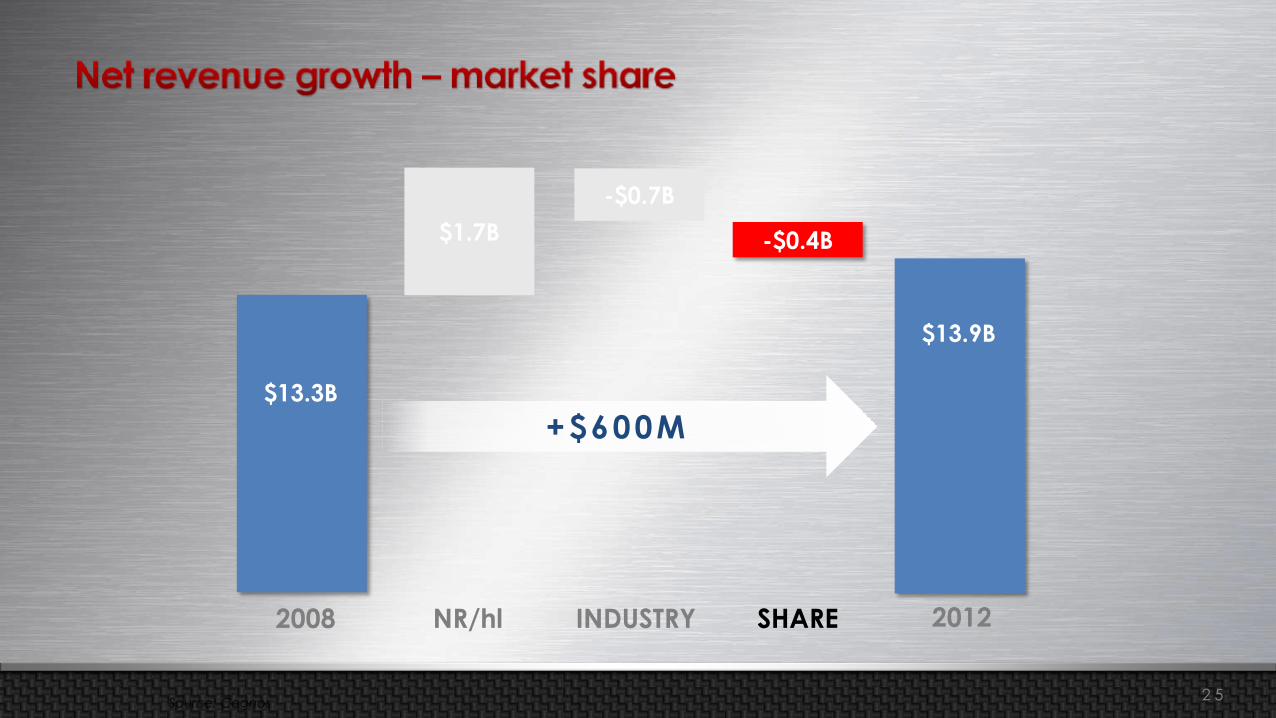
2008
$13.3B
$13.9B
2012
+$600M
1 5

Source: Cognos
NR/hl
3.7
2008
$13.3B
$13.9B
$1.7B
2012
+$600M
1 6
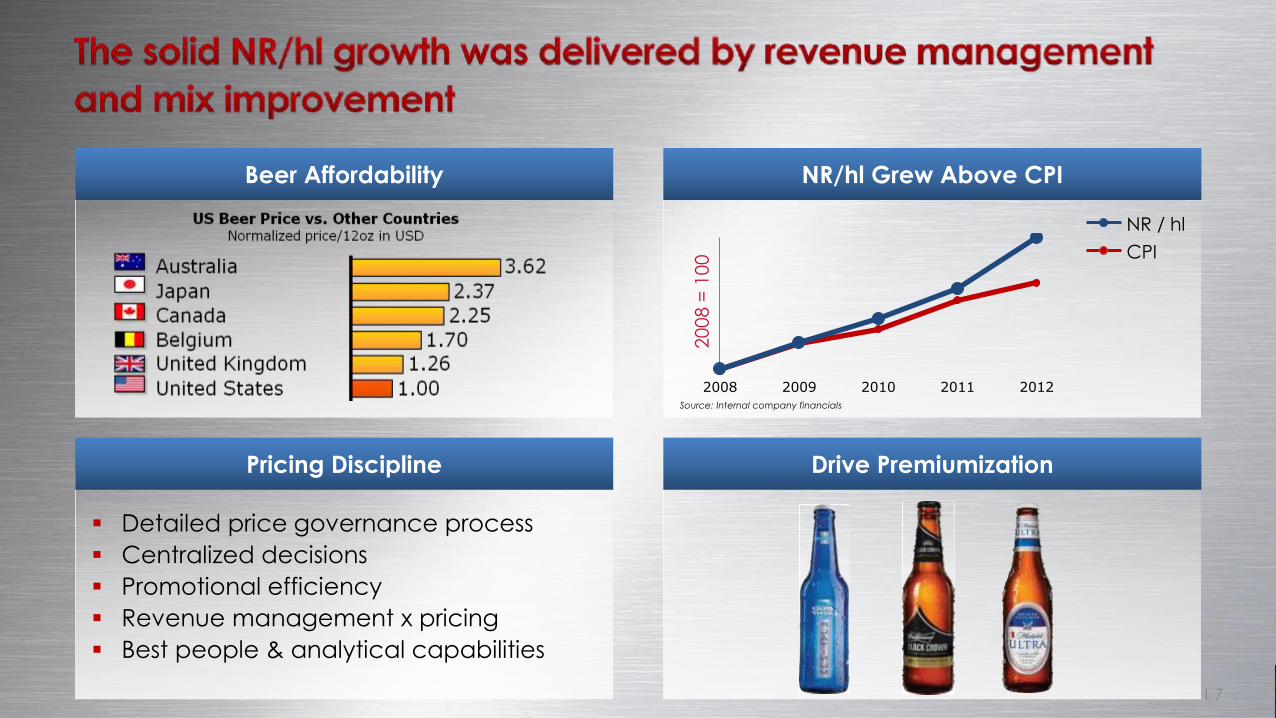
Beer Affordability
Pricing Discipline
Detailed price governance process
Centralized decisions
Promotional efficiency
Revenue management x pricing
Best people & analytical capabilities
Drive Premiumization
NR/hl Grew Above CPI
2008 2009 2010 2011 2012
20
08
= 1
00
CPI
NR / hl
Source: Internal company financials
1 7

Source: Cognos
INDUSTRY
3.7
2008
$13.3B
$13.9B
2012 NR/hl
$1.7B
+$600M
-$0.7B
1 8

175
185
195
205
215
225
235
2001 2002 2003 2004 2005 2006 2007 2008
Industry Volume (mm hl)
1 9

175
185
195
205
215
225
235
2001 2002 2003 2004 2005 2006 2007 2008 2009 2010 2011 2012 2013
Industry Volume (mm hl)
Source: AB Top 9E STR 20 2 0

2012 Price Calendar Weather Disposable
Income Labor
Participation 2008
4
6
8
10
63
64
65
66
67 Un
em
plo
ym
en
t La
bo
r P
art
icip
atio
n
1/1/11 1/1/09 1/1/13 1/1/10 1/1/12 1/1/08
Source: Internal company models
2 1

175
185
195
205
215
225
235
2001 2002 2003 2004 2005 2006 2007 2008 2009 2010 2011 2012 2013
Industry Volume (mm hl)
Source: AB Top 9E STR 2 2

175
185
195
205
215
225
235
2001 2002 2003 2004 2005 2006 2007 2008 2009 2010 2011 2012 2013
Industry Volume (mm hl)
Source: AB Top 9E STR
-0.6% CAGR
2 3

Labor Force Participation Disposable Income (Quarterly % Growth)
Jun/Jul Sep/Oct Aug Jan Feb Mar Apr May
60
61
62
63
64
65
66
67
1982 2002 Jan '13 Mar '13 May '13 Jul '13 Sep '13
Stabilization 3.7 3.6
2.9
5.3
1.7 1.9
2.6
Q1 '12 Q2 '12 Q3 '12 Q4 '12 Q1 '13 Q2 '13 Q3 '13
2 4
Source: Cognos
INDUSTRY
3.7
2008
$13.3B
$13.9B
2012 NR/hl SHARE
-$0.7B
$1.7B
+$600M
-$0.4B
2 5
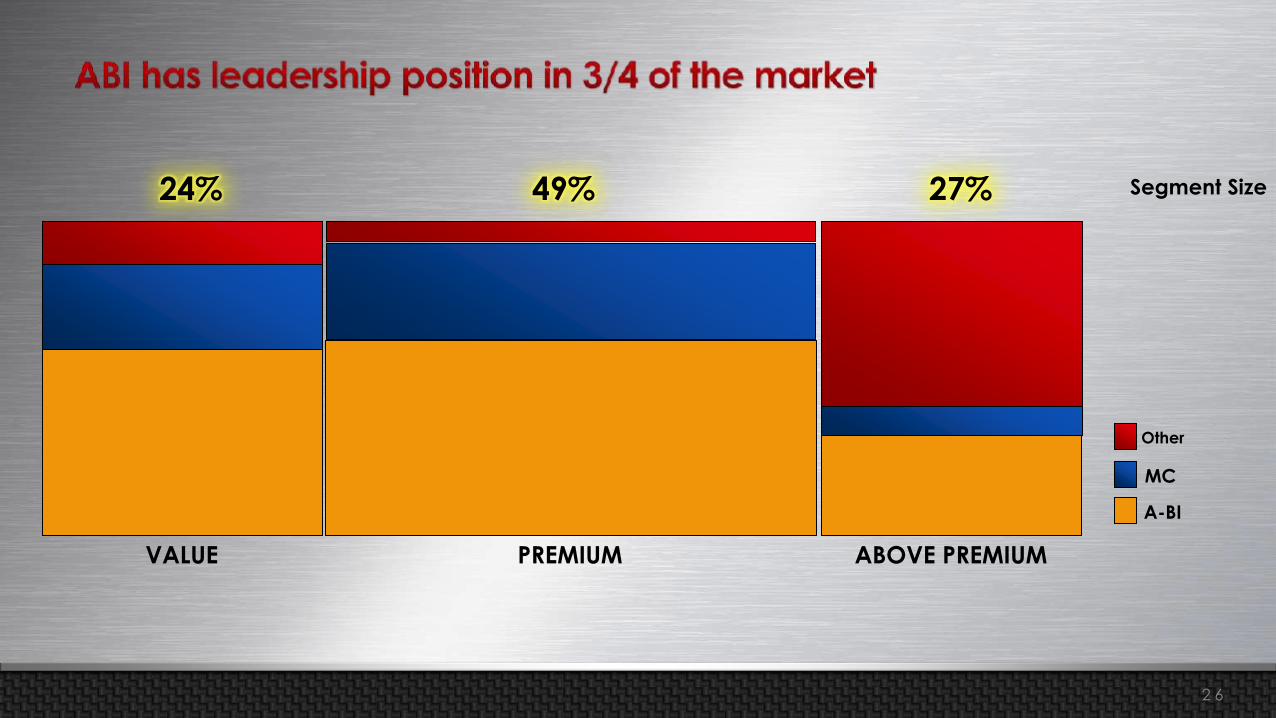
Segment Size
VALUE
24%
PREMIUM
49%
ABOVE PREMIUM
27%
A-BI
MC
Other
2 6

Strong Position in the Premium and Value Segments
Premium and Value Declined ABI Share Declined -1.2 p.p.
2008 2009 2010 2011 2012
Above Premium Value Premium
0.1
-0.6 -0.5 -0.2
2009 2010 2011 2012
Market Share
Source: Internal estimates Source: Internal industry estimates
A-BI
MC
Other
Segment Size
VALUE
24%
PREMIUM
49%
ABOVE PREMIUM
27%
Internal Industry estimates
2 7

Segment Size
PREMIUM
49%
ABOVE PREMIUM
27%
VALUE
24%
A-BI
MC
Other
2 8

25%
26%
25% 25%
24%
2008 2009 2010 2011 2012
Source: Internal Industry estimates
-2.0 p.p Decline Since 2009
50% of the Decline is Driven by the Economy
-50%
-25%
-25%
P52W Economy Trade Up Others 2/26/12
Model developed to analyze Value
Industry case sales; 76.9% R Square
Source: Internal analysis based on IRI FDMxC – 52W ended 2/26/2012 Source: EPI analysis of Bureau of Labor Statistics Current Population Survey microdata
Core Value Consumer Unemployment Spiked
Blue Collar
White Collar 0%
5%
10%
15%
20%
2001 2003 2005 2007 2009 2011 2013
Un
em
plo
ym
en
t ra
te
27.7% 28.7% 28.6%
28.8%
28.1%
26.2%
24.7% 23.8%
Closing the Price Gap to Premium Drove Trade up
Source: Internal STRs (Mix of Premium/Value)
2010 2009 2008 2012 2011 2007 2006 2005
Source: bls.gov
2 9

Segment Size
PREMIUM
49%
ABOVE PREMIUM
27%
VALUE
24%
A-BI
MC
Other
3 0

Source: Internal Industry estimates
56
57
55
58
2009 2010 2011 2012 2013
3 1

Segment Size
ABOVE PREMIUM
27%
VALUE
24%
PREMIUM
49%
A-BI
MC
Other
3 2

Segment Size
VALUE
24%
May consolidate Imports & Crafts, or leave off
A-BI
MC
Other
HIGH END
18%
PREMIUM
49%
PREM+
6%
FMB/
PAB
3%
3 3
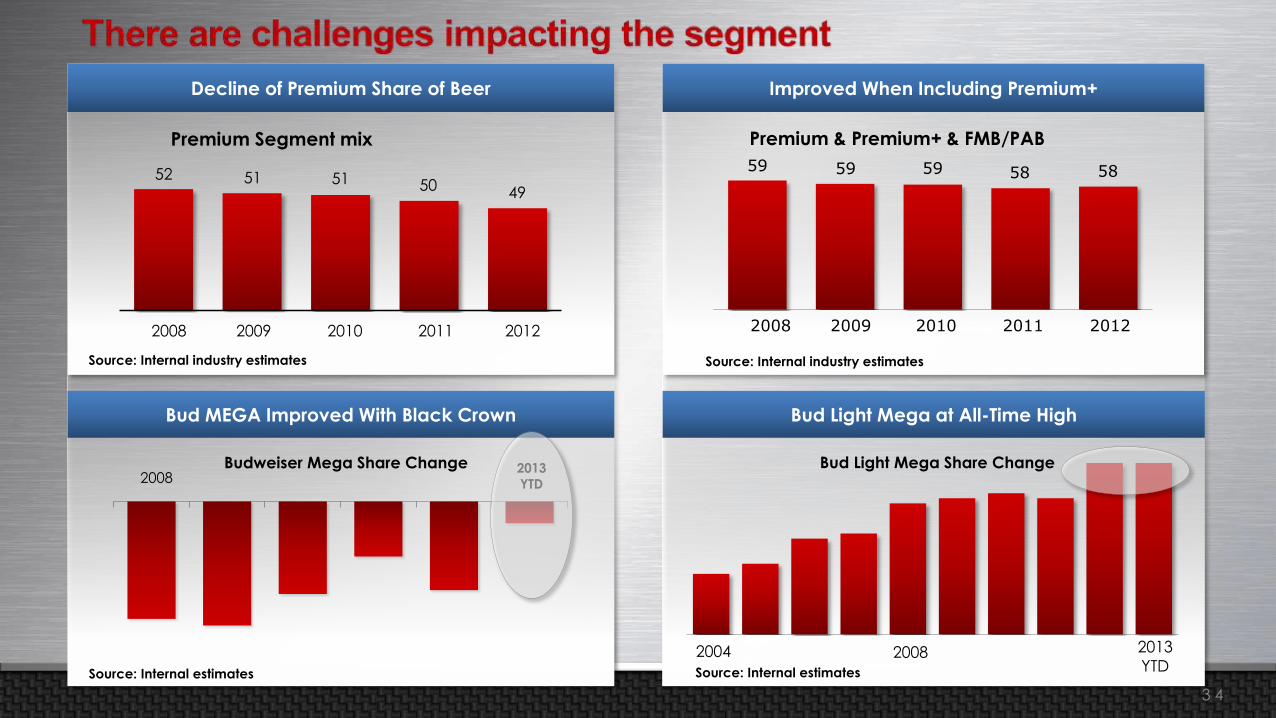
Bud MEGA Improved With Black Crown
Budweiser Mega Share Change 2008
Source: Internal estimates
2013
YTD
2008 2013
YTD 2004
Bud Light Mega Share Change
Bud Light Mega at All-Time High
Source: Internal estimates
Improved When Including Premium+
Source: Internal industry estimates
Premium & Premium+ & FMB/PAB
59 59 59 58 58
2008 2010 2009 2011 2012
52 51 51 50 49
Decline of Premium Share of Beer
2008 2010 2009 2011 2012
Premium Segment mix
Source: Internal industry estimates
3 4
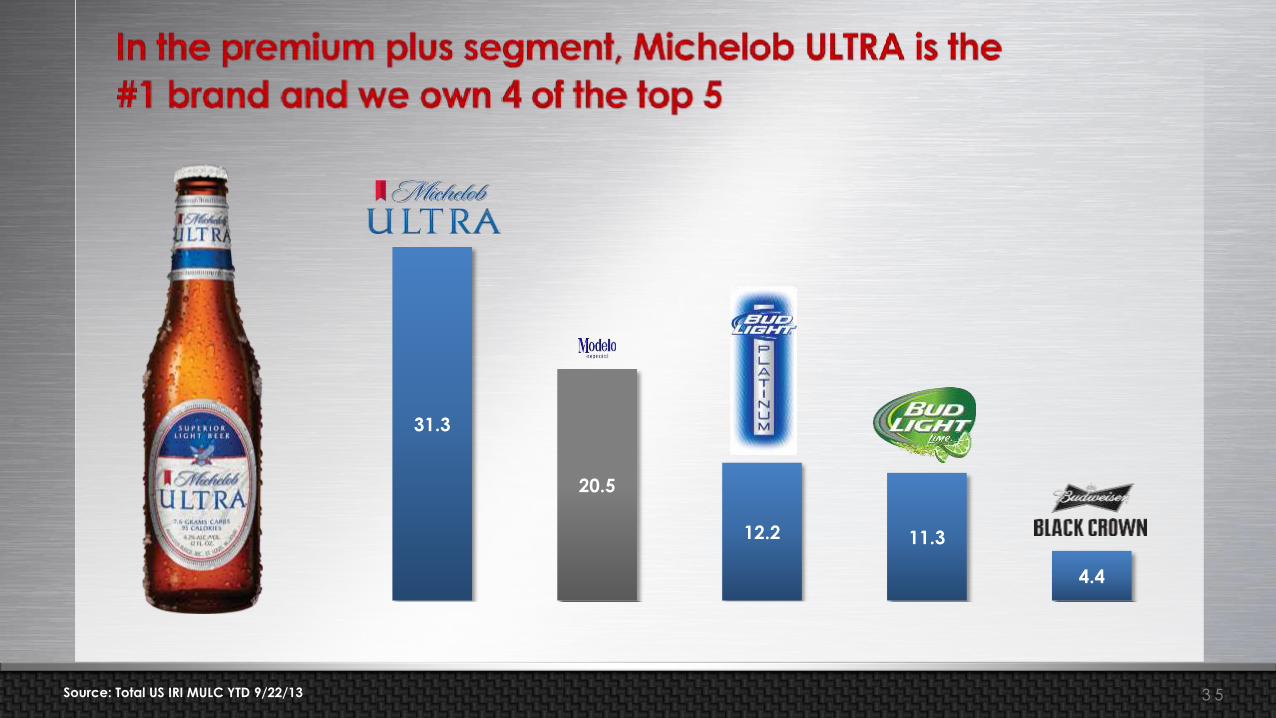
31.3
20.5
12.2 11.3
4.4
Source: Total US IRI MULC YTD 9/22/13 3 5

27.3 24.9
9.3 8.2 8.2 7.9
2.8
Source: Total US IRI MULC YTD 9/29/13, Brand Family Share of FMB/PAB Segment 3 6
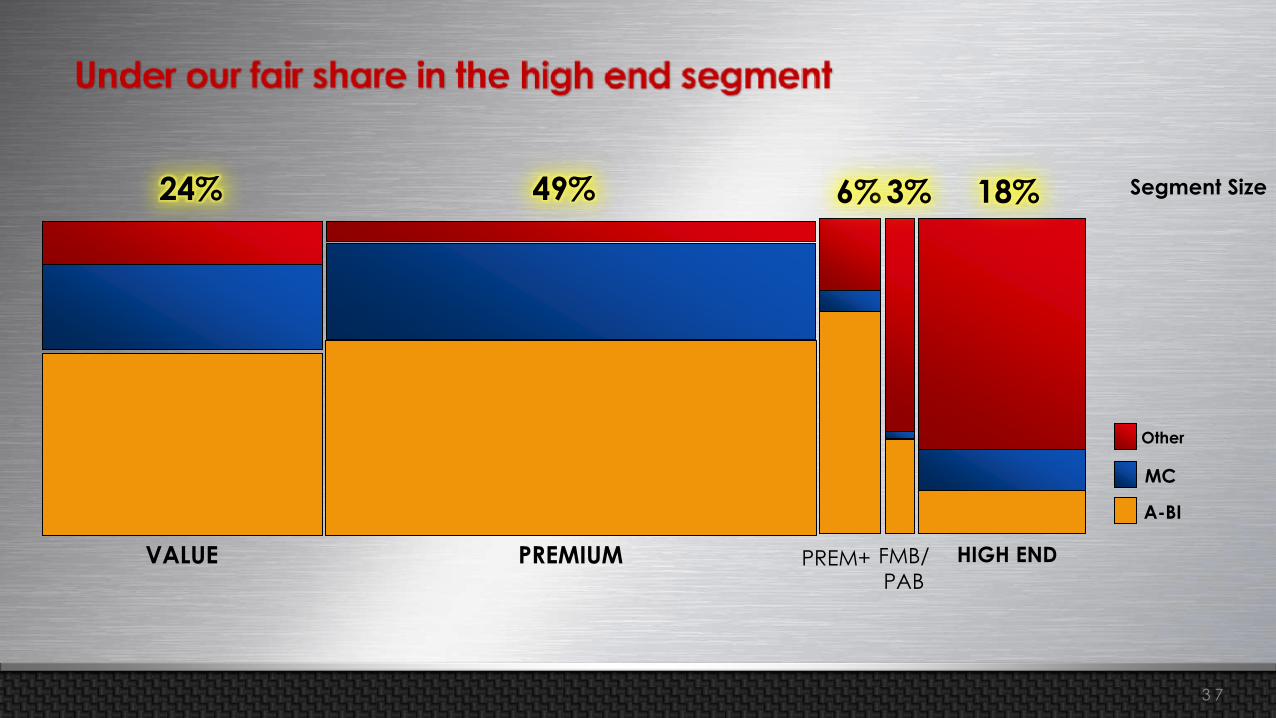
Segment Size
VALUE
24%
PREMIUM
49%
PREM+
6%
FMB/
PAB
3%
A-BI
MC
Other
HIGH END
18%
3 7

Over 80% of Growth Consolidated In Top 5 Players
Number of High End Brands Has Slowed In 2013
Source: IRI Total US MULC weeks through 9/30/13
2009 2010 2011 2012 2013
Source: Internal industry estimates
The High End Segment Is Growing
-5%
5% 5% 5%
2009 2010 2011 2012
Source: Internal industry estimates
26% 51% 58%
81%
2010 2011 2012 2013
3 8

HE
CRAFT
7% Segment Size
VALUE
24%
PREMIUM
49%
PREM+
6%
FMB/
PAB
3%
May consolidate Imports & Crafts, or leave off
A-BI
MC
Other
HE
IMPORTS
11%
Beck's is brewed in the U.S. in accordance with the German reinheitsgebot
brewing standard and competes against brands in the Import segment. 3 9
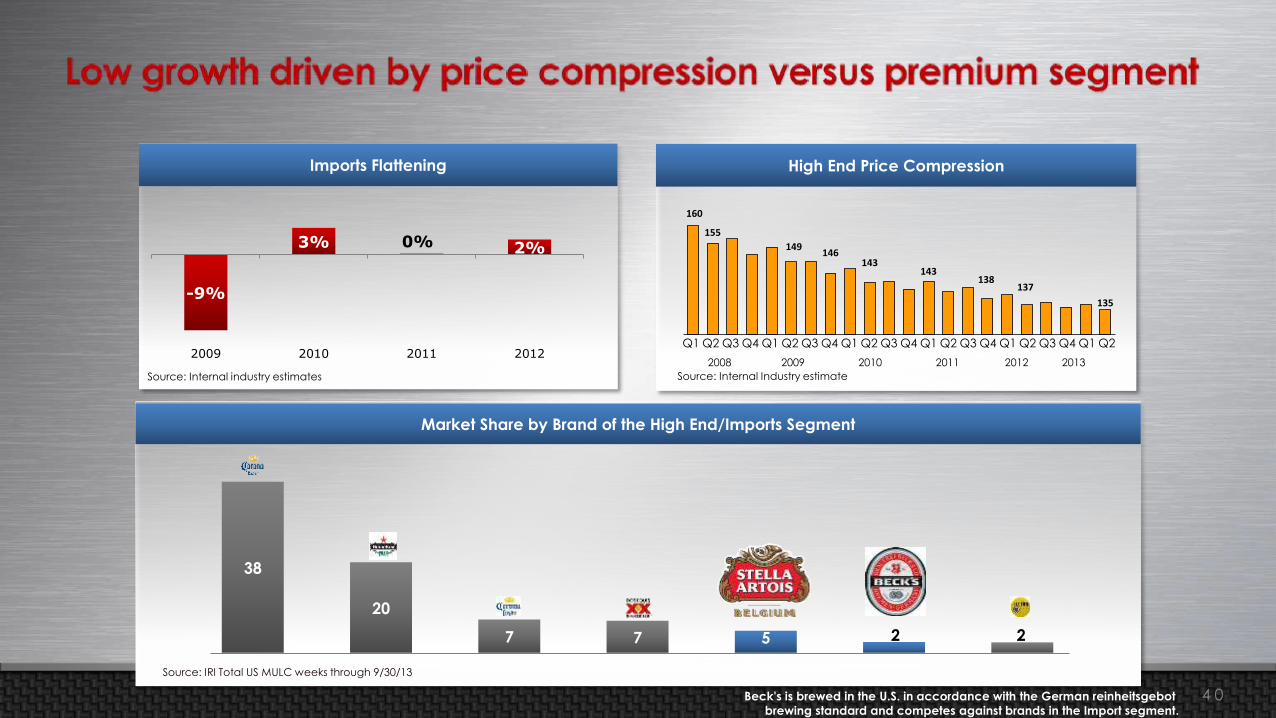
Imports Flattening
-9%
3% 0% 2%
2009 2010 2011 2012
Source: Internal industry estimates
Source: IRI Total US MULC weeks through 9/30/13
Market Share by Brand of the High End/Imports Segment
38
20
7 7 5 2 2
High End Price Compression
160
155
149 146
143 143
138 137
135
Q2 Q1 Q2 Q1 Q4 Q3 Q2 Q1 Q4 Q3 Q2 Q1 Q4 Q3 Q2 Q1 Q4 Q3 Q2 Q1 Q4 Q3
2008 2009 2010 2011 2012 2013
Source: Internal Industry estimate
Beck's is brewed in the U.S. in accordance with the German reinheitsgebot
brewing standard and competes against brands in the Import segment.
4 0

Bud Light challenging Corona for the #1 preferred brand among Latino consumers
New slide requested by Luiz. Need to be formatted
And animations must be included.
12%
14%
16%
18%
20%
Sep 2011 Dec 2011 Mar 2012 Jun 2012 Sep 2012 Dec 2012 Mar 2013 Jun 2013 Sep 2013
16%
16%
18%
15%
Stella Artois More Than Doubled Since 2007
2007 2008 2009 2010 2011 2012 2013
Source: Internal industry estimates
Bud Light Challenging Corona for the #1 Preferred Brand Among Latino Consumers
12%
14%
16%
18%
20%
Sep 2011 Dec 2011 Mar 2012 Jun 2012 Sep 2012 Dec 2012 Mar 2013 Jun 2013 Sep 2013
16%
16%
18%
15%
Source: ABI Brand Performance Tracking Survey
64.9%
43.3% 43.2% 41.9%
Source: BPT Global Imagery, Aug. 2013
Considered the Most Sophisticated Brand
% consumers who think the brand is sophisticated
4 1

HE
IMPORTS
11%
HE
CRAFT
7%
A-BI
MC
Other
Segment Size
VALUE
24%
PREMIUM
49%
PREM+
6%
FMB/
PAB
3%
May consolidate Imports & Crafts, or leave off
4 2

High End Craft Can Be Categorized In Two Ways
50% of the Volume in Top 3
Source: IRI MULC 10-27-13 YTD
21%5%
26%
100%
79%74%
48%
Next 600 11 thru 15 4 thru 10 Top 3
Cumulative
Share of Craft
And 64% of the Growth is in the Top 3
4 thru 10 11 thru 15 Top 3 Next 600
5%16% 16%
84%79%64%
100%
Source: IRI MULC 10-27-13 YTD
Cumulative
Share of Craft
Craft Concentrated In 5 Basic Styles/Palates
110
120
130
140
150
160
170
Axis Title
Sierra Nevada Kellerweis
Lagunitas IPA
Ranger IPA
Sam Adams
312
Inversion IPAChainbreaker
IPA
Goose Island IPA
SN Torpedo
Sierra Nevada Pale Ale
Honker's Ale
Mirror Pond Pale Ale
NewBelgium
Shiner Bock
Little Sumpin' Sumpin' Ale
Sam Adams Boston Lager
NB Abbey
Green Lakes Organic Ale
Fat Tire
1554Redbridge Sam Adams
Light
Full SailAmber
Sierra Nevada Porter
ObsidianStout
Sam Adams Cream Stout
Alaskan Amber
Shift Lager
Mendocino Red Ale
Great LakesDortmunder
ShinerLight
SA NoblePils
ShinerBlonde
AbitaAmber
Anchor SteamBeer
Redhook IPA
Latitude 48
Harpoon IPA
Redhook ESB
Magic HatNo 9
Sweetwater420
Black ButtePorter
Great LakesPorter
BlueMoon
ShockTop
Widmer
LeineSunset
Leine
ShockTop
Deschutes
BlueMoon
SierraNevada
Goose Island
NB Tripple
HE Craft Mix 21% 16% 11% 10% 8% 7% 2% 1%2012 Trend 22% 10% 41% 7% -2% 7% 5% 12%
PTC I
ndex
to Bu
d Ligh
t
IPA Pale Ale American
Lager
Dark Lager Dark Ale Porter/ Stout
WheatSeasonal
#2Grow Share
of IPA
#1Enter Pale category
#3Enter Lager
category
#4Grow
Seasonal Share
Seasonal Wheat
IPA Pale Ale
American Lager Dark Lager Dark Ale Porter/Stout
Source: Internal estimates
4 3

Shock Top Achieved in 5 years What Took Blue Moon 14
Shock Top is the Fastest Growing Brand in Segment
Source: Internal Shipment Estimates (Shock Top Belgian White vs. Blue Moon Belgian White)
1 2 3 4 5 6 7 8 9 10 11 12 13 14 15 16 17 18
Blue Moon
Shock Top
Brand Volume by Year Since Launch
Sam Adams
New Belgium
Blue Moon
Leinenkugel
Shock Top
Source: 2013 AB estimate using IRI Total US MULC YTD 11-3-13 trend vs. 2009, 4Yr Total Change
Diverse Portfolio and Seasonals
4 4
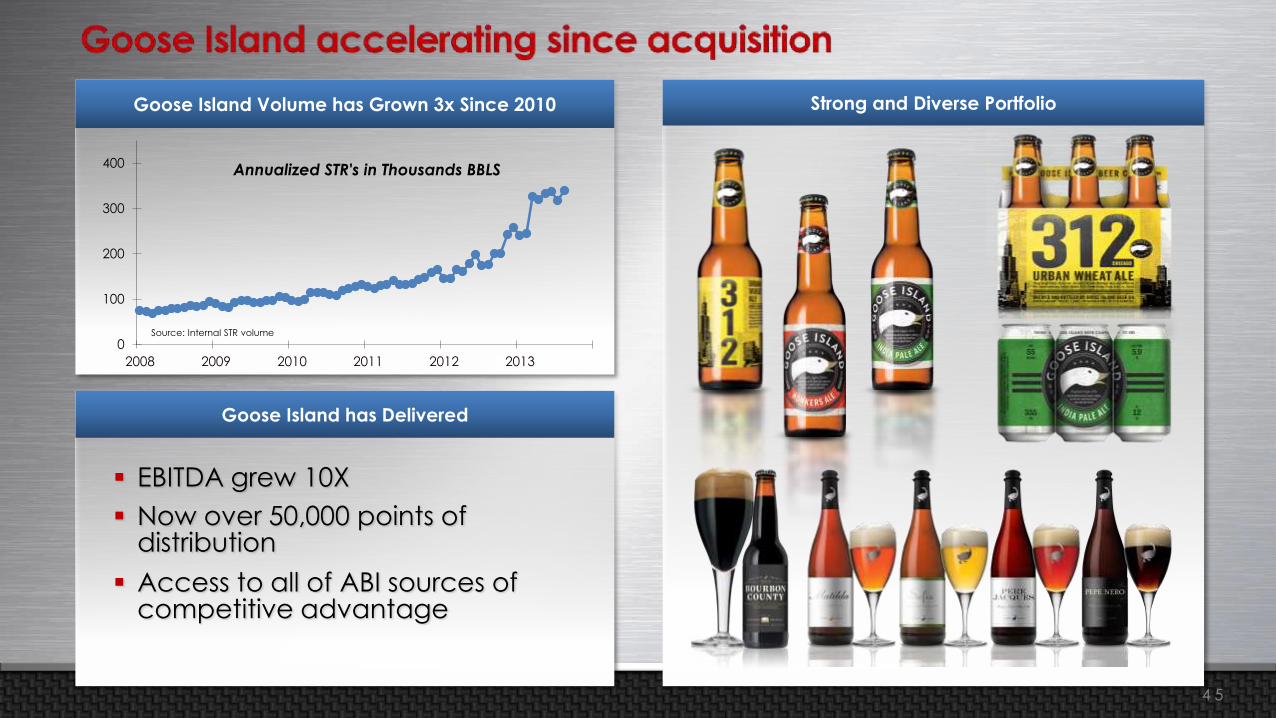
Strong and Diverse Portfolio Goose Island Volume has Grown 3x Since 2010
0
100
200
300
400
2008 2009 2010 2011 2012 2013
Annualized STR's in Thousands BBLS
Goose Island has Delivered
EBITDA grew 10X
Now over 50,000 points of distribution
Access to all of ABI sources of competitive advantage
Source: Internal STR volume
4 5

Building Our Future
5 Year Track Record
Who We Are 1
2
3
4 6

4 7

4 8
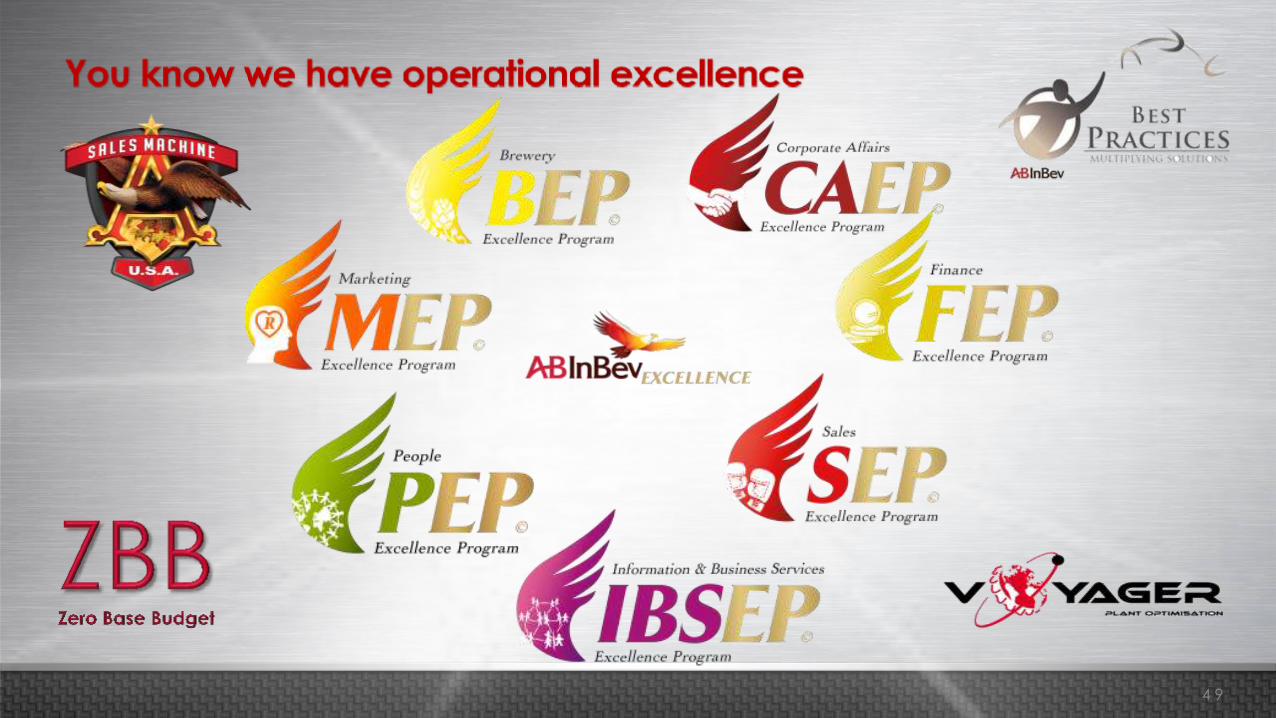
4 9

Explore Thinking
Ambidexterous
Lead, shape, create
Prototype, test, learn
Design thinking
Diverge to converge
Create platforms
Process & Structure
11 platforms
150+ projects
85+ meetings/yr
4-6 hours/week
5 0

5 1

5 2

3P
5 3

Ad
Targeting
Connected Devices Tap Handles
Expiratio
n Date: Dec 30,
2013
Mobile Wallet Retail On Premise
5 4
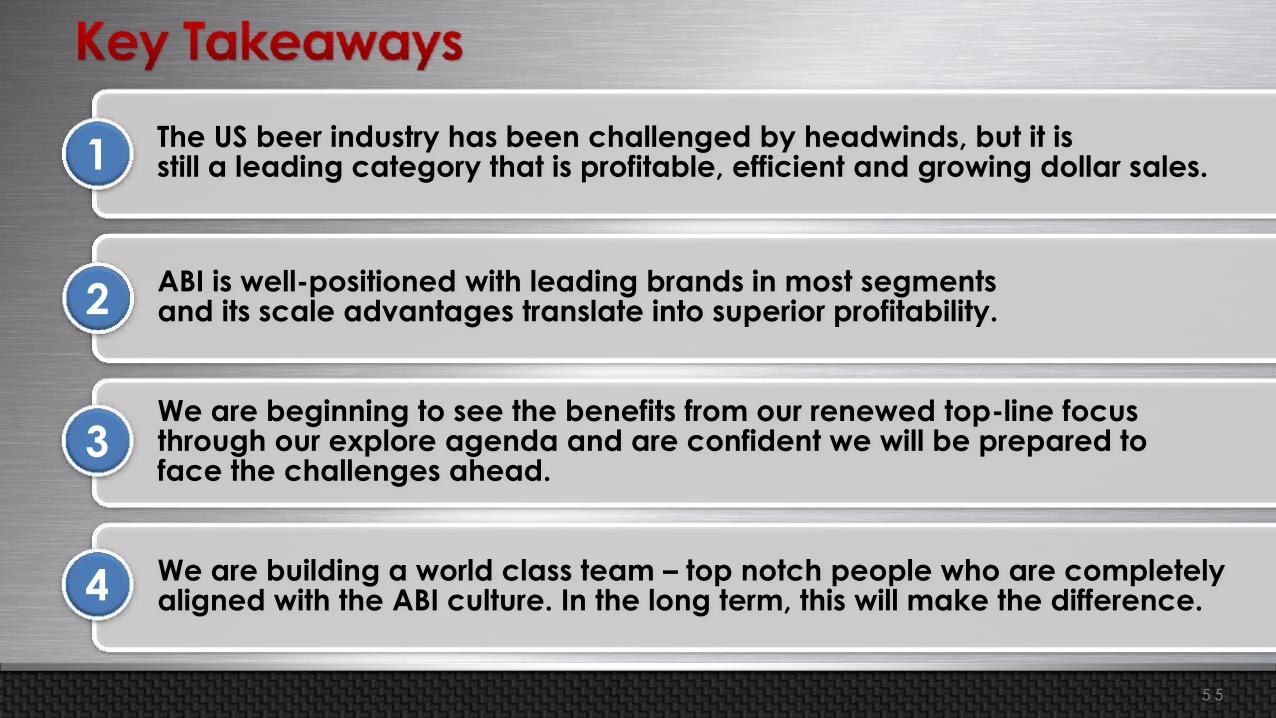
We are beginning to see the benefits from our renewed top-line focus through our explore agenda and are confident we will be prepared to face the challenges ahead.
ABI is well-positioned with leading brands in most segments and its scale advantages translate into superior profitability.
The US beer industry has been challenged by headwinds, but it is still a leading category that is profitable, efficient and growing dollar sales. 1
2
3
We are building a world class team – top notch people who are completely aligned with the ABI culture. In the long term, this will make the difference. 4
5 5

Shoppers
Consumers
Topics
Category leadership
Revenue management
Sales execution
Trade marketing
Changing consumer landscape
Digital execution
Win with Bud Light
Stabilize Budweiser
Grow share in the high end
Premium plus (ULTRA)
Innovation
* Integrated Marketing Communication
IMC*
5 6


![Testicular ca [edmond]](https://img.pdfslide.net/doc/110x75/554af15ab4c905fc0e8b467b/testicular-ca-edmond.jpg)

![Ca prostate [edmond]](https://img.pdfslide.net/doc/110x75/554af15eb4c905fc0e8b467f/ca-prostate-edmond.jpg)


![Ca kidney [edmond]](https://img.pdfslide.net/doc/110x75/554af04eb4c90559058b4784/ca-kidney-edmond.jpg)