Embed Size (px)
Citation preview

Saving Grace: reforming the presentation and composition of current savings
policies
Helen Thomas, edited by Natalie Evans
Introduction Saving money in the good times gives security against the bad times. It also helps to generate a pool of capital that
can be drawn on when expensive things, like the university education of a child, need to be paid for. A high savings
rate should also keep financial demands on the state down, as the more financially independent the population is
the smaller the number of people likely to need emergency help. Since Labour entered government in 1997 it has
developed several schemes for encouraging an increase in the rate of saving. But because much of it has been
insufficiently co-ordinated it is now time to develop a holistic approach that makes saving consistently attractive.
In 2009, national saving as a percentage of GDP in Britain is expected to be 11.62%. In Germany it is expected to be
19.8%.1 Judging by what people say in savings surveys, the amount of money that Britons regularly save is
insufficient. This year, National Savings and Investments again found that most people want to save around 14% of
their income, but even regular savers only manage around 11%. For the population as a whole the rate is only 6%.2
Across Britain, 70% of people have credit cards and but only 50% have a savings account. 3 This suggests an
imbalance between spending money and saving it. To some analysts the use of credit is regarded as a “mark of
financial incapability.” 4
A lot of evidence on how savings and investment schemes are used by the lay public shows that irrational and
costly decisions are common. For example, according to research from the Financial Services Authority, 40% of
people who own an equity ISA are not aware that its value changes with the performance of the stock market. At
the time of the survey 33% of people who had purchased general insurance cover had done so without comparing
one product to another.5
These problems are compounded by mistakes in government policy and insufficient trust in the products on offer.
Back in 1999 the Treasury scrapped the Advance Corporation Tax scheme, which gave pension funds some tax
relief. In the years since then this change has cut the value of those funds by up to £150 billion, a significant charge
on the savings pool accumulated in the UK. There are also problems with the introduction of personal accounts:
research note February 2010

2
the Pensions Policy Institute reckons that 45% of pensioners could lose out as they suffer from lower payments
from means-tested benefits. In 2009, one survey found that 60% did not think that banks were looking after their
interests properly.6
The background to all this is, of course, the increase in the value of residential property over the last decade or so
and the subsequent storing of “savings ” by many people in their homes. It is because this is a risky approach to
saving, plus the problems in policy elsewhere, that we recommend an approach to government savings policy
along the following “jam jar” lines:
• Jam jar 1: long-term saving for retirement, which would include automatic enrolment into a personal account.
• Jam jar 2: saving for a big purchase, which the tax-free ISA allowance of £10,200 would contribute.
• Jam jar 3: saving for a regular annual event, which the Saving Gateway would bolster.
• Jam jar 4: saving for children, for which the free Child Trust Fund voucher would be the mainstay.
To support this approach we also recommend the following specific changes:
• That the extra payment made by the Child Trust Fund scheme once a child reaches seven years of age be
made at birth;
• That the Saving Gateway be made easier for banks to use and that the interest rate be expressed as part
of the “matched” funding;
• That flexible withdrawals be allowed from Personal Accounts;
• That the ISA ceiling be raised each year in line with inflation.
Together, these changes and the overall “jam jar” approach should improve the likelihood that Britain will increase
its savings rate.

3
Why should the encouragement of saving be a policy goal? Savings policy over the last fifteen years has largely been the by-product of attempts to achieve other goals, such
as increasing home ownership, or redistributing incomes, rather than an end in itself. There have been numerous
changes to the tax benefits for saving, with little explanation of what the changes were designed to achieve. Even
work around increasing financial capability has been divorced from the larger issue of improving savings in
aggregate.
The NICE (non-inflationary, consistent expansion) decade, as Mervyn King so aptly described it, contributed to
government complacency about the role of savings in the economy. Saving was considered somewhat irrelevant
over the sixty consecutive quarters of economic growth – something nice to have, rather than a necessity. It is time
to set out more clearly why increasing saving should be a policy goal.
Let us first consider the economic argument. The fundamental macro-economic case for a higher savings rate is
that it would create a capital base to fund sustainable economic growth, rather than relying on debt which cannot
be refinanced forever. Savings funnel into wider economic investment – buyers of corporate bonds and equities
provide the capital for ventures large and small. Without this money, investment relies on government borrowing
– something that can be ill-afforded in the current climate.
The fundamental micro-economic case for a higher savings rate is that it will smooth an individual’s consumption
function over a business cycle. Both of these factors should then smooth the economic cycle, reducing volatility of
output. This should also smooth inter-temporal imbalances: the burden of today’s consumption would not be
shifted onto future generations.
It is at this point that the political arguments start to wade into emotive, rather than rational, territory – excessive
borrowing today leading to “tax bombshells” lurking in the future. As the credit crunch has shown, prudent savers
are bailing out imprudent borrowers. If everyone saved something for a rainy day, from corporations to individuals
to government, wouldn’t that be “fairer”? Raising the spectre of fairness introduces a whole new set of issues that
go to the heart of dividing lines in political discourse, and it is in this emotional minefield that the biggest
obstructions to a comprehensive policy lie. Therefore, to win the political argument, there must be an appeal to
more than just economic reasoning.
A clear savings policy would help to empower people to manage their own finances. Money may not bring
happiness, but it brings freedom – the freedom to make your own choices. It also opens up opportunities – once
people feel that they have the security to manage if things go wrong, then they can stop living from day-to-day and
look to the long term. They feel able to change their future, rather than relying on anyone else. A 2001 study

4
shows that owning a financial asset of between £300 and £600 at age 23 is positively associated with a greater
chance of employment and improved mental health outcomes at age 33, controlling for other factors. 7
Savings provide a person with a cushion against “black swan” events, such as we have recently seen in the banking
crisis. They also provide a cushion for the government, as a person’s savings can kick in before government help is
required. A higher savings rate would mean that stronger private sector balance sheets would ease the burden on
the public sector balance sheet, freeing up government resources to concentrate on delivering better public
services. This is particularly the case during hard times such as the current recession, when the government is at its
most stretched.
The message is therefore clear: everyone can benefit from an increase in household savings, both by achieving
greater personal freedom, and by creating a sustainable path for economic growth.
How did Britain come to have such a low savings rate?
According to National Savings and Investments (NS&I), in autumn 2009 46% of Britons were saving regularly, with
the average percentage of monthly take-home income saved being 6.06% and the average amount per head
£83.87.8 That nearly half the population consistently saves some income sounds satisfactory, but a little more
detail shows how insufficient the level of saving actually is.
In the five years that National Savings and Investments have conducted a savings survey they have found that the
amount saved across the population has consistently fallen short of an ideal amount expressed by survey
respondents, and that the gap between the money put away by regular and irregular savers is big enough to
suggest that many people are not making enough provision for times when they will need, at the very least,
emergency funds, as shown by figure 1. Britain’s national saving rate has often been at the bottom of international
comparisons for the past thirty years, as shown by figure 2.

5
Figure 1: level of actual saving versus ideal level of saving (as a percentage of income)9
Figure 2: gross national savings (percentage of GDP)10
These consistently low levels of saving have been exacerbated by the failure to make the case for, and
then deliver, a comprehensive savings policy.
0
5
10
15
20
25
30
35
40
1980
1981
1982
1983
1984
1985
1986
1987
1988
1989
1990
1991
1992
1993
1994
1995
1996
1997
1998
1999
2000
2001
2002
2003
2004
2005
2006
2007
2008
2009
2010
Perc
enta
ge
Year
Canada
France
Germany
Italy
Japan
United Kingdom
United States
4
6
8
10
12
14
16
2005 2006 2007 2008 2009
Perc
enta
ge o
f inc
ome
Year
Ideal savings per head as a percentage of income
Amount saved by regular savers as a percentage of income
Average amount saved per head across the United Kingdom4
6
8
10
12
14
16
2005 2006 2007 2008 2009
Perc
enta
ge o
f inc
ome
Year
Ideal savings per head as a percentage of income
Amount saved by regular savers as a percentage of income
Average amount saved per head across the United Kingdom
6
Financial Capability Upon its creation, the Financial Services Authority was tasked with “promoting public understanding of the
financial system.”11 Since 2003 it has tried to improve public understanding of saving by being the fulcrum for a
national strategy aimed at building “financial capability” in the UK.12 In 2004 it commissioned the University of
Bristol’s Personal Finance Research Centre to look into this area, and in their June 2005 report Measuring Financial
Capability: An Exploratory Study, they noted that:
“A number of research studies have identified relatively low levels of financial capability among consumers in the
UK, and show that they encounter difficulties in dealing with the growing complexity and diversity of financial
services provision.”13
A Financial Services Authority survey conducted in March 2006 found that:
• 33% of people, who held no more complex products than general insurance, bought their policy without
comparing it to even one other product.
• 70% of people had made no personal provision to cover an unexpected drop in income.
• 40% of people who owned an equity ISA are not aware that its value fluctuates with stock market
performance, and 15% of people who owned a cash ISA thought its value does.14
This paints a relatively bleak picture of the level of financial literacy amongst the UK population.
Lack of financial understanding is not just undesirable because it might cause people to fail to save; it is also
destabilising if it leads to an explosion of debt. The imbalance between saving and borrowing is highlighted in the
fact that 70% of people have credit cards, compared to the 50% of people who have a savings account.15 Two years
before Northern Rock collapsed, the University of Bristol’s study established that “[r]eckless use of credit was
regarded as a mark of financial incapability.”16 The lack of financial understanding, combined with low interest
rates and easy lending standards, helped to fuel the credit boom that has now turned to bust with such disastrous
consequences. Furthermore, homeowners possess a feeling of wealth owing to increases in house equity and the
same low interest rates as is discussed below.

7
Obsession with the housing market Much work has already been done to explain the UK’s singular obsession with becoming a homeowner. There is a
clear cultural bias towards home ownership that is best summarised by the colloquialism that “every man’s home
is his castle”. To own a home is to have status, security and wealth.
From this cultural bias came the view that a house is regarded as a safe long-term investment. To some extent, this
opinion is not entirely baseless. There are significant supply constraints that imply that the long-term trend for UK
house prices will usually be up, such as population growth and planning.
Policy Exchange showed in its publication, Unaffordable Housing: Fables and Myths, how important this last factor
is to the growth in house prices.17 Britain irrationally constrains the building of new houses through the use of the
1947 Town and Country Planning Act, which sought to use “green belts” to keep development in set areas and not,
as is now assumed, to simply constrain the number of houses being built. Figure 3 shows the affect that this and
other factors have had on the growth in house prices over the past 30 years.
Figure 3: changes in real house prices, 1979-200918
The problem is that the relatively high return one can achieve in property comes with high risks, especially for
home buyers who are not investment professionals. Housing is one of the most illiquid asset classes – it’s hard to
compare houses as each is unique; and you can’t always buy and sell when you want to. Property should be
expected to outperform only over the very long term, and is suitable for an investor prepared to take high risks.
Most people do not think that they fall into this category: a 2009 Department for Work and Pensions survey on
£0
£20,000
£40,000
£60,000
£80,000
£100,000
£120,000
£140,000
£160,000
£180,000
£200,000
1979
Q3
1980
Q3
1981
Q3
1982
Q3
1983
Q3
1984
Q3
1985
Q3
1986
Q3
1987
Q3
1988
Q3
1989
Q3
1990
Q3
1991
Q3
1992
Q3
1993
Q3
1994
Q3
1995
Q3
1996
Q3
1997
Q3
1998
Q3
1999
Q3
2000
Q3
2001
Q3
2002
Q3
2003
Q3
2004
Q3
2005
Q3
2006
Q3
2007
Q3
2008
Q3
2009
Q3
Pric
e
Quarter
7
Obsession with the housing market Much work has already been done to explain the UK’s singular obsession with becoming a homeowner. There is a
clear cultural bias towards home ownership that is best summarised by the colloquialism that “every man’s home
is his castle”. To own a home is to have status, security and wealth.
From this cultural bias came the view that a house is regarded as a safe long-term investment. To some extent, this
opinion is not entirely baseless. There are significant supply constraints that imply that the long-term trend for UK
house prices will usually be up, such as population growth and planning.
Policy Exchange showed in its publication, Unaffordable Housing: Fables and Myths, how important this last factor
is to the growth in house prices.17 Britain irrationally constrains the building of new houses through the use of the
1947 Town and Country Planning Act, which sought to use “green belts” to keep development in set areas and not,
as is now assumed, to simply constrain the number of houses being built. Figure 3 shows the affect that this and
other factors have had on the growth in house prices over the past 30 years.
Figure 3: changes in real house prices, 1979-200918
The problem is that the relatively high return one can achieve in property comes with high risks, especially for
home buyers who are not investment professionals. Housing is one of the most illiquid asset classes – it’s hard to
compare houses as each is unique; and you can’t always buy and sell when you want to. Property should be
expected to outperform only over the very long term, and is suitable for an investor prepared to take high risks.
Most people do not think that they fall into this category: a 2009 Department for Work and Pensions survey on
8
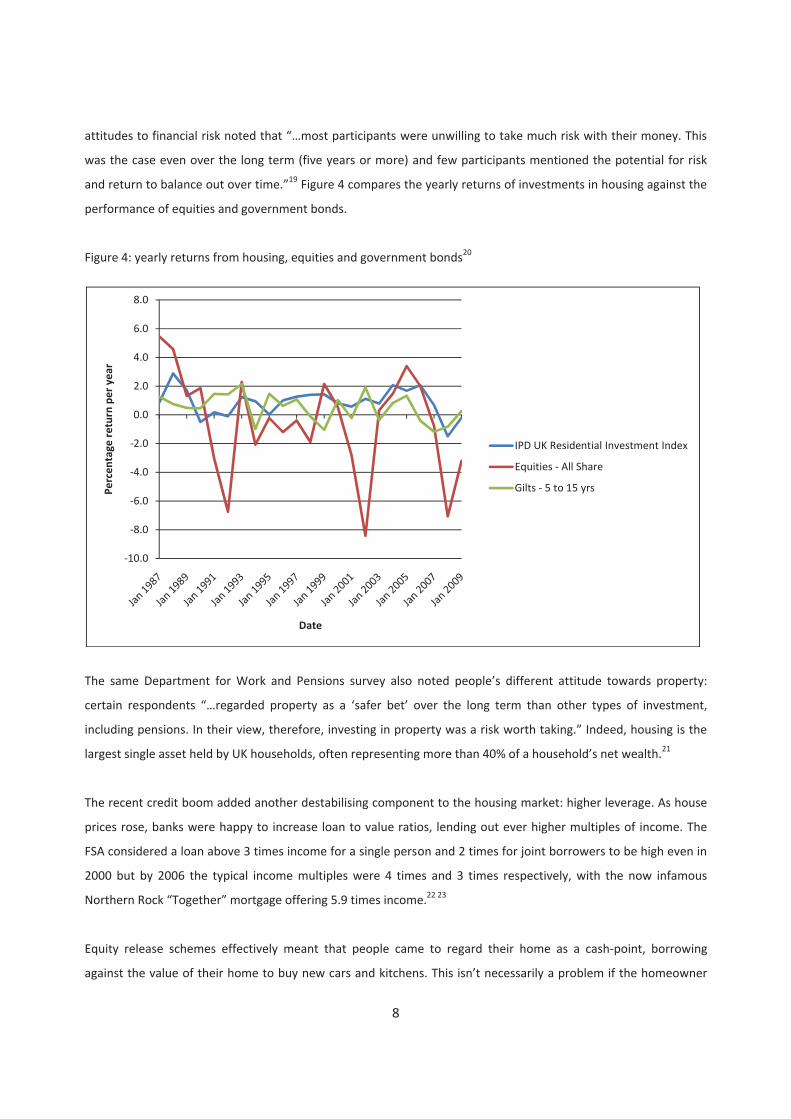
attitudes to financial risk noted that “…most participants were unwilling to take much risk with their money. This
was the case even over the long term (five years or more) and few participants mentioned the potential for risk
and return to balance out over time.”19 Figure 4 compares the yearly returns of investments in housing against the
performance of equities and government bonds.
Figure 4: yearly returns from housing, equities and government bonds20
The same Department for Work and Pensions survey also noted people’s different attitude towards property:
certain respondents “…regarded property as a ‘safer bet’ over the long term than other types of investment,
including pensions. In their view, therefore, investing in property was a risk worth taking.” Indeed, housing is the
largest single asset held by UK households, often representing more than 40% of a household’s net wealth.21
The recent credit boom added another destabilising component to the housing market: higher leverage. As house
prices rose, banks were happy to increase loan to value ratios, lending out ever higher multiples of income. The
FSA considered a loan above 3 times income for a single person and 2 times for joint borrowers to be high even in
2000 but by 2006 the typical income multiples were 4 times and 3 times respectively, with the now infamous
Northern Rock “Together” mortgage offering 5.9 times income.22 23
Equity release schemes effectively meant that people came to regard their home as a cash-point, borrowing
against the value of their home to buy new cars and kitchens. This isn’t necessarily a problem if the homeowner
-10.0
-8.0
-6.0
-4.0
-2.0
0.0
2.0
4.0
6.0
8.0
Perc
enta
ge r
etur
n pe
r ye
ar
Date
IPD UK Residential Investment Index
Equities - All Share
Gilts - 5 to 15 yrs

9
remains in a position of positive equity, but that cannot be assured given the propensity for boom and bust in the
housing market.
Even if homeowners don’t borrow extra money, the very act of taking on a mortgage is itself inherently risky due
to leverage. A 5% deposit means that house prices need only fall by 5% and you start to lose money on a mark-to-
market basis. However, the flipside of this argument shows why leverage can be so alluring: a 5% deposit could
generate a 20% return in one year, if there is a housing boom.
So why do people take on such a high risk, particularly given the fact that a house isn’t simply an investment, it is
also a home? Losing money on the stock market is painful, but it need not automatically mean the loss of the place
in which you live. The answer to this lies partly in the tax system: no Capital Gains Tax is paid on primary
residences. This means that when you sell your property, you receive the whole profit without deduction, whereas
the sale of any other asset incurs a variety of taxes, as shown by the table below.
Table 1: taxation of UK equity, cash, gilts and residential property
UK equity Tax Rate Tax on purchase Stamp Duty/SDRT 0.5% on purchase of shares in UK companies Tax on company paying dividend
Corporation Tax on profits
21%/28% depending on size
Tax on dividend income Dividend Tax 10%/32.5% depending on income (offset by a 10% tax credit)
Tax on Sale Capital Gains 18% flat rate Gilts/Bonds24
Tax Rate Tax on interest Income Tax 20%/40% (at income tax rate)
Tax on savings in bank or building society accounts
Tax Rate Tax on Interest earned Income Tax 20%/40% (at income tax band)
Tax on residential property purchases
Tax Rate
Tax on purchase Stamp Duty 1-4%, depending on the value of the property It’s clear that the tax system therefore skews the country’s balance sheet, encourages investment in some asset
classes rather than others and exacerbates an already ingrained predisposition by the British towards buying
houses.

10
Lack of trust in the savings industry Even before the credit crunch and banking bailout, the savings industry had suffered from a loss of trust. From mis-
selling scandals (split-caps investments, endowment mortgages) to the collapse of investments (Equitable Life),
many savers already felt the industry to be negligent. In 2005, for example, 61% of all complaints received by the
Financial Ombudsman Service related to endowment mortgages – equivalent to 250 new complaints each day.25 A
2004 Which? report showed that fewer than a third of people trusted financial institutions to manage their
pensions properly.26
Since the demise of Lehman, AIG, and the Icelandic banks, trust has been undermined in even simple banking
products such as deposit accounts. A 2009 survey by Cohn & Wolfe showed that 60% of consumers believe that
banks are not looking after their interests and almost half of respondents consider the banks to be greedy.27
Complication by the Government In such an environment it is even more important that the Government delivers and then remains committed to a
coherent savings policy. The last decade has produced such a variety of tweaks to the system that it is not clear
what might happen next. Given the background of low financial capability, Government should make saving as
comprehensible as possible.
Of course, Government cannot prevent an individual from making poor decisions – but one of the easiest ways to
improve decision-making is through the provision of clear and consistent information. Piecemeal amendments to
complicated tax breaks are unlikely to offer this. Surveys that look to gauge awareness of ISA rules show that
• Four out of five had the wrong date for the end of the ISA season.
• Over one in ten believed they were only available to over 21s.
• A quarter thought that only taxpayers were entitled to open an account.
• One in five believed that ISAs are run by the Government.
• 40% thought that tax benefits were lost if any money was withdrawn from an account.

11
In fact, by making so many tax changes, the signalling impact of those changes are undermined, meaning that even
the headline message to “Get Saving” is lost. Changes to the pension tax treatment in the 1990s have reduced the
value of retirement funds by up to £225 billion.28
The Treasury Select Committee noted in 2007 that “[s]aving is not accorded the same priority in the Government’s
strategy for promoting financial inclusion as credit, advice and banking. The evidence we have received suggests
that savings, and the problems of making saving worthwhile and beneficial for those on lower incomes, are
integral to any effective strategy on financial inclusion.”29 It is important that this mistake is not exacerbated in the
future.
The effect of taxation on saving Theoretically, reducing the net returns to saving by taxing capital income may reduce private savings. To an
economist, the likely effects depend on whether “substitution effects” (people deciding to start doing something
else when they see that an alternative course of behaviour has become cheaper) dominate “income effects”
(people deciding to change their behaviour because their level of income has changed). It is generally presumed
that substitution effects dominate over the longer run.
On balance, it appears that taxing capital income reduces savings, but not by very much. Results from one recent
study of 21 OECD countries found that, if the average capital tax rate of 40% were eliminated across the countries,
then private saving would only be raised by 0.5% of GDP.30
Because the increase in total taxes over the recent past has put downward pressure on the total income that a
person might receive over a lifetime, saving may have fallen as a result. The shift in taxation towards levies on
labour could also have reduced savings, as by redistributing income it has taken money away from the high-saving
working-age population and given it to the older generations with low or negative savings. Furthermore, poor
households often do not have enough money to make ends meet, so spend any extra income they have rather
than putting it into a saving scheme.
Lifetime saving will also be affected by other tax issues. In particular, the extension of tax-financed public pension
schemes in OECD countries may have led to a reduction in private savings by eliminating some of the uncertainty
associated with savings for retirement.31
There is ample cross-country evidence that aggregate rates of saving and rates of economic growth are positively
correlated.32 However, the direction of causality – from saving to economic growth, or from growth to saving – is
more ambiguous.

12
Gordon Brown’s raid on pensions Before 1999, pension funds were able to reclaim their corporation tax through the Advance Corporation Tax
scheme. This relief allowed pension funds in the UK to accumulate assets that made them the envy of other rich
European countries with much lower pension wealth to draw on.
But in 1999 this relief was scrapped. According to some analyses, as of a few years ago this change had cost
pension funds anything from £100 billion to £150 billion. According to the Institute of Actuaries: “What happened
in 1997 [when Gordon Brown, the then Chancellor, decided to get rid of the Advance Corporation Tax scheme]
represented an enormous and ongoing raid on the assets of UK company pension schemes. [Our] research shows it
would be very hard to justify an impact of less than £100 billion – and even £150 billion may still be a conservative
estimate.”33
Along with poor returns from investments in government bonds and the stock market crash of 2001, this tax
change by the government appears to have cut the rate of saving accumulated in pensions funds substantially.
Where do we go from here?
To increase the aggregate savings in the economy, it might seem a truism to state that, quite simply, there must be
more savers, saving more. Within this simple formula, however, lie very different approaches to policy.
• Introducing more people to saving will mean creating new kinds of incentives or at least changing the way
the current ones are marketed, as well as improving financial education.
• Increasing the amounts saved by those already saving is likely to require more innovative and flexible
products that reflect the increasingly unpredictable path of modern life. In essence, a coherent savings
policy will have to be differentiated in order to achieve two quite different goals: that of more savings,
and that of more savers. There is no silver bullet “one-size-fits-all” policy.
Current savings policies attempt to address the goal of differentiation, but at the moment they are relatively
unpublicised, and poorly understood. Below is an outline of these policies, and an analysis of how they are
designed to influence savings behaviour.

13
Current Savings Products
Child Trust Funds
• The parents of every child born after 1 September 2002 receive a voucher from the government of £250,
which cannot be accessed by the child until their 18th birthday. Lower income families (below the Child Tax Credit
threshold) will receive an additional £250, starting with a £500 lump sum.
• The voucher can be used to purchase a number of different Child Trust Funds: either 100% cash, or
shares, or a mandated mixture of shares initially, then cash and bonds that changes as the child grows up. Each
year the account can be topped up with a maximum of £1,200.
• As of the 2006 Budget, there is a further payment made to children on the 7th birthday of £250 (or £500
for children from lower-income families). After 18 years, individuals can access the money and spend it on what
they wish.
Saving Gateway
• From 2010, this new cash savings account will be available for working age people on lower incomes.
People qualify for an account if they receive any of the following benefits: Income Support, Employment and
Support Allowance, Severe Disablement Allowance, Tax Credits (income below £15,575), Incapacity Benefit or
Jobseekers’ Allowance. This comprises around 8 million people in the UK.
• Each month, the person can save up to £25, over a period of 2 years. The government will match every £1
saved with 50p. After 2 years, a person who has saved the maximum will receive £900. They can withdraw the
savings if they need to without affecting the government contribution that has been earned up to that point.
• If they qualify for a Saving Gateway account they will be sent a letter of invitation and an information
booklet, which can then be taken to any approved Saving Gateway provider to open the account.
Personal Accounts
• PADA (The Personal Accounts Delivery Authority) is a non-departmental public body set up to help
implement the reforms of the Pensions Act 2007 and 2008, with the aim to make saving for retirement the norm.
• The pensions reforms mean that all employers must offer a qualifying workplace pension scheme and all
eligible workers must be automatically enrolled into this chosen scheme.
• From 2012, these schemes will be available, where the employer contributes 3%, the employee
contributes 4% and the Government 1%. The Government contribution is simply tax relief, but in expressing it in
this way, it is hoped that people will better understand the incentive given its presentation as a “matched”
contribution.

14
ISAs (Individual Savings Accounts)
• ISAs were established in 1999 to replace PEPs and TESSAs and provide everyone with a tax-free savings
account. The overall amount that can be invested in an ISA will be £10,200 from next April, of which half can be
held in a cash ISA, and the other half can be invested in shares via an equity ISA.
• ISAs are offered by private providers and offer two tax benefits: gains that are accrued by ISAs are not
subject to capital gains tax; and income tax is not payable on capital that is held in an ISA when it is withdrawn.
• ISAs dominate the landscape for short-term and medium-term savings incentives: there are now over 18
million ISA accounts held in the UK
We will now consider each of these products in more detail to determine how they might increase the savings rate
in the light of the two goals established above: do they introduce more people to saving, and do they increase the
amount saved by those already saving? We will outline the main advantages and criticisms of each policy before
concluding how each might be improved.
Child Trust Funds Child Trust Funds are designed to introduce more people to saving, both by the creation of a new incentive, and by
improving financial capability. They are meant to help children get into the habit of saving, as well as learning to
understand the benefits of saving. As David White, chief executive of the Children's Mutual, one of the UK's
biggest providers of CTF accounts, explains: "[p]eople who would never have had any form of children's savings in
place now have something quite substantial. In addition, both parents and children are gaining a financial
education from the whole CTF process.34
Advantages of the scheme
• The scheme should mean that all children have at least a modest sum of money at their disposal when
they reach adulthood.
• It encourages families to consider saving for the future, as they can top-up the CTF every year. Prior to the
introduction of the CTF, the Children’s Mutual estimate that only 18% of children were having long-term
savings made for them; the proportion of people now topping up their account is 27%.35
• CTFs should contribute to financial awareness among children. Indeed, the Government states:
“[f]inancial education is a key part of the CTF.”36 Until the age of 16, the account will be managed by the
“registered contact” (e.g. a parent) but between 16 and 18 the child will manage the account,

15
encouraging them to think about saving and financial security as the money still cannot be withdrawn
until 18.
• CTFs have encouraged financial education to develop: in 2009 the Department for Children, Schools and
Families introduced (via the Personal Finance Education Group) “My Money Week” into schools prompted
by the introduction of the CTF.
• It is easy to open a CTF account: all families that receive Child Benefit are automatically sent a voucher. If
an account is not opened before the voucher expires (usually 12 months from issue) then HM Revenue &
Customs open a stakeholder CTF account for that child.37
• The product has been well received – since their launch, 4.6 million children have opened accounts, and
around £2 billion is currently held in them.38 “According to figures from The Children’s Mutual, prior to
the introduction of the CTF less than one in five families was saving regularly for their children. This has
now leapt dramatically to almost six in 10, with regular payments being seen from every socio-economic
background.”39
• There is a choice about how the CTF is invested:
a) Standard savings account that pays a rate of interest
b) A non-stakeholder account that invests in shares
c) A stakeholder account that also invests in companies’ shares (the default option if no choice is
made).
Within these, it is also possible to opt for an ethical account, which does not invest in, for example, arms
companies, and a Sharia account which does not invest in un-Islamic sectors such as tobacco, alcohol or
gaming.40 The CTF is likely to offer many people their first taste of equity investment, through the
provision of these choices. Evidence suggests that choice is desirable and motivating for consumers and
individuals feel safer when they have a degree of control over their investments. 41 42
Having considered the benefits of Child Trust Funds, we now turn to analysing their potential limitations. The
Conservative Party recently announced that it would look to change some parts of the scheme in order to reduce
the amount of money spent on it if it were in power, so there is appetite for reform among some policy-makers.

16
Criticisms of the scheme
• The fact that there are no restrictions on how the CTF money can be spent at age 18 has attracted strong
criticism. Polls have shown that parents are concerned that their child may spend the money on items
such as plastic surgery, a motorbike or just “drinking and partying.”43
• Critics claim the scheme is a tax break for the rich. When income of more than £100 a year is generated
by assets given to a child by a parent, it is normally taxed as if it were paid to the parent. The £100 rule
does not apply to the Child Trust Fund as all income and gains will be tax-free. Therefore those parents
who can afford to contribute more will receive larger tax breaks.44
Saving Gateway This scheme has been introduced to help people of working age on lower incomes to “kick-start” a savings habit. In
this way, they are designed to introduce more people to saving, by creating a new incentive (Government
matching) and improving financial inclusion – “[e]ncouraging people to engage with mainstream financial
services.”45
Advantages of the scheme
• This scheme specifically targets those for whom tax breaks do not encourage a savings habit, because
they pay little or no direct tax. It is this group that needs new incentives to save, as those on lower
incomes are the least likely to feel able to put money aside. Evidence has shown that households with
lower incomes are those least likely to save. According to the most recent Family Resources Survey, 43%
of households with a total weekly income of less than £100 have no savings at all.46
• The pilot schemes for the Savings Gateway had broadly positive results: between the two pilots
undertaken, more than 22,000 people took part, saving an aggregate total of over £15 million. The
Government claims that “[t]hose who participated were overwhelmingly positive about the effect of the
saving gateway.”47
Criticisms of the scheme
• The time-limited nature of the accounts (2 years) has raised two main concerns. Firstly, it is argued that
the lower income groups targeted by the scheme are penalised by comparison to higher earners, as most
tax benefit schemes have no imposed time limit.48 Secondly, the time horizon appears arbitrary: the only
time-limited savings goal for most households is Christmas, implying that the scheme might be better
targeted if it ran on an annual basis.

17
• The scheme is unattractive to commercial providers: both the British Bankers’ Association and the
Building Societies’ Association have explained that the current business case for creating Saving Gateway
accounts is unlikely to prove viable, despite their sympathy for the goals of the scheme. 49 50
• Although matching has been welcomed as an innovative way to kick-start the savings habit, it need not
supplant the requirement for an interest rate. In fact, by failing to provide interest on the account, the
ultimate goal of improving financial capability might be compromised. Citizens Advice have raised this
issue, arguing that if the product does not include the key feature of a standard savings account – the
interest rate – then the opportunity is lost to “…engage people with the idea that they earn interest on
the money that they put aside.”51
Personal Accounts According to PADA, there are currently around seven million people in the UK who are not saving enough to
generate the pension income they are likely to want, or expect, in retirement.52 The scheme is therefore designed
both to introduce more people to saving and to increase the amounts saved.
Advantages of the scheme
• It should ensure that low to middle income workers have access to sufficient pensions.
• The personal accounts scheme is flexible – employers will be able to choose to use the personal accounts
scheme or another qualifying workplace pension.
• It is also portable – employees can take it on to another job, which is particularly useful in sectors with a
high turnover of staff.
• The scheme will combat the problem of employee inertia in making pension arrangements, as employers
will be required to enrol all eligible employees automatically into the scheme unless the employee
concerned has exercised the right to opt out.53
• The maximum administration charge is lower than most pension schemes, capped at 0.3% of the fund
under management.
18
• There will be a choice of investment funds. They will include options such as social, environmental and
ethical investments, as well as branded funds. For those not wishing to make an investment choice, there
will be a default fund.54
• In a DWP survey into attitudes towards personal accounts reform, there was broad support for the key
elements: the majority of people (64 per cent) found the idea of automatic enrolment attractive; over
nine in ten (91 per cent) found the employer contribution attractive; and seven in ten people (72 per cent)
found the idea of automated individual contributions attractive.55 Most people (69 per cent) said that, if
enrolled into personal accounts tomorrow, they would remain in the scheme.56
Criticisms of the scheme
• Pension providers argue that the upper limit for contributions is too high. The cap has been reduced from
£5,000 to £3,600 but the pensions industry has argued that anything above £3,000 would compete
against existing pension provision and possibly damage it.57
• The Government is anxious to support good existing schemes, but critics say some employers may cut
their contributions to the minimum levels set for Personal Accounts. Employers will have to provide 3% of
workers' salaries into the scheme. As a result of the increased uptake by employees, employers are likely
to have to reduce contributions to their current schemes (or close them down). A report by the
Association of Consulting Actuaries suggests that the personal account reforms will result in the closing of
many existing pension schemes, as 55% of current schemes would fall short of the proposed exemption
tests.58
• Those who criticise the low contribution rates to the scheme claim that it could restrict the pension
incomes of millions of savers and force them into a trade-off with means-tested benefits. The Pensions
Policy Institute has estimated that up to 45% of pensioners could lose out on means-tested benefits.
When their small savings are taken into account it would mean cuts in their Pension Credit, Council Tax
Benefit or Housing Benefit.
ISAs Given that ISAs are now well established as the main vehicle to meet short and medium term savings goals, it is
well known that their aim is to increase the amounts saved.

19
Advantages of ISAs
• ISAs are one of the few ways to invest tax-free, which is of particular benefit to high rate taxpayers. Those
on higher incomes are likely to have the most available to save, and therefore should be encouraged to
put it aside.
• It is easy to open an ISA, either by phone or on the internet.
• There is generally no lock-in period for ISAs and withdrawals can be made at any time, without loss of the
tax advantages.
• The ISA allowance is annual, so that over a period of time a relatively large pool of savings can be
accumulated.
• Most investments are covered by either the cash ISA or equity ISA option:
o Cash (includes National Savings & Investment products, bank and building society
accounts and cash funds).
o Equity (includes equities, unit trusts, OEICs, investment trusts, life assurance, gilts and
corporate bonds).
• Cash ISAs can now be transferred into equity ISAs, allowing for greater flexibility when choosing between
the two options. By being able to progress from a cash ISA to an equity ISA, consumers can understand
that equity is the next level of investment when they have understood the nature of investment risks.
They can move on from a short-term cash investment to a longer term equity investment
• These options raise awareness of the benefits of equity investing. The UK has a particularly low level of
investment in stocks and shares, which can be explained by 3 main reasons:
1) the cultural obsession with housing,
2) the penalising taxation associated with equity investment, such as Capital Gains Tax and
Stamp Duty which can reduce a typical pension by over £10,000 and erode almost the entire
initial value of the CTF (reducing the funds available after 18 years by up to £202, according
to London Stock Exchange estimates), and
3) a lack of understanding of how equities work.
20
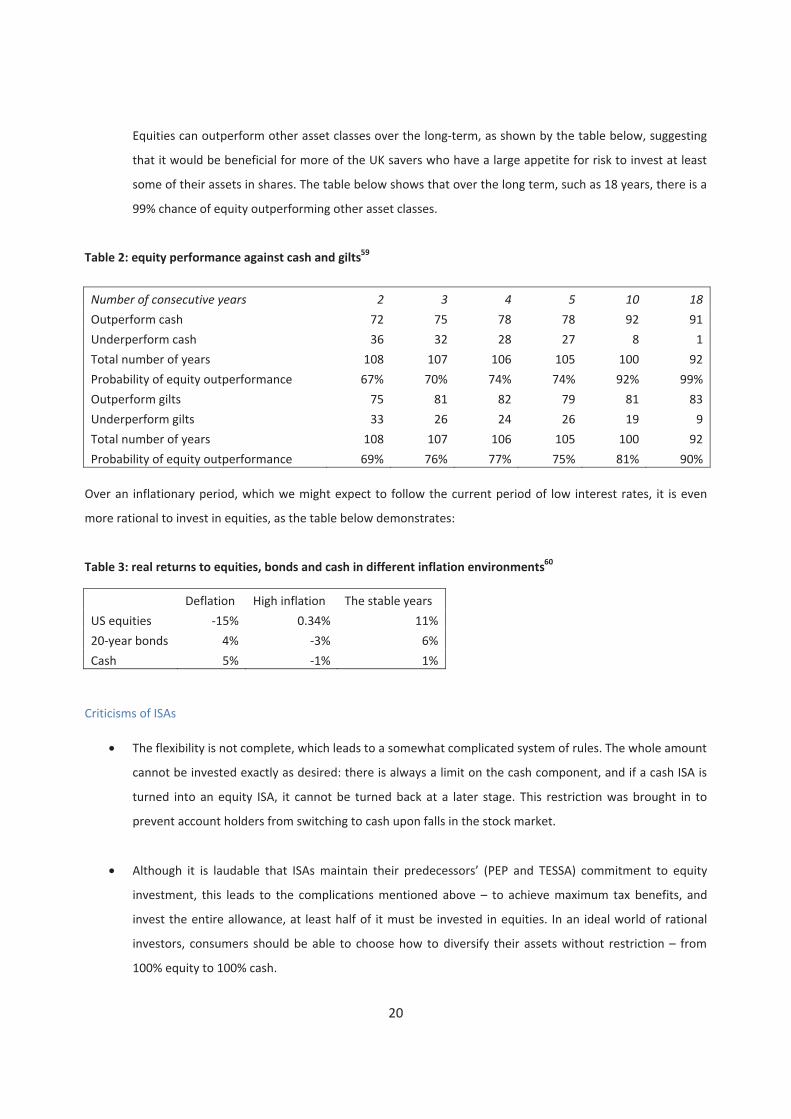
Equities can outperform other asset classes over the long-term, as shown by the table below, suggesting
that it would be beneficial for more of the UK savers who have a large appetite for risk to invest at least
some of their assets in shares. The table below shows that over the long term, such as 18 years, there is a
99% chance of equity outperforming other asset classes.
Table 2: equity performance against cash and gilts59
Number of consecutive years 2 3 4 5 10 18
Outperform cash 72 75 78 78 92 91
Underperform cash 36 32 28 27 8 1
Total number of years 108 107 106 105 100 92
Probability of equity outperformance 67% 70% 74% 74% 92% 99%
Outperform gilts 75 81 82 79 81 83
Underperform gilts 33 26 24 26 19 9
Total number of years 108 107 106 105 100 92
Probability of equity outperformance 69% 76% 77% 75% 81% 90% Over an inflationary period, which we might expect to follow the current period of low interest rates, it is even
more rational to invest in equities, as the table below demonstrates:
Table 3: real returns to equities, bonds and cash in different inflation environments60
Deflation High inflation The stable years
US equities -15% 0.34% 11%
20-year bonds 4% -3% 6%
Cash 5% -1% 1% Criticisms of ISAs
• The flexibility is not complete, which leads to a somewhat complicated system of rules. The whole amount
cannot be invested exactly as desired: there is always a limit on the cash component, and if a cash ISA is
turned into an equity ISA, it cannot be turned back at a later stage. This restriction was brought in to
prevent account holders from switching to cash upon falls in the stock market.
• Although it is laudable that ISAs maintain their predecessors’ (PEP and TESSA) commitment to equity
investment, this leads to the complications mentioned above – to achieve maximum tax benefits, and
invest the entire allowance, at least half of it must be invested in equities. In an ideal world of rational
investors, consumers should be able to choose how to diversify their assets without restriction – from
100% equity to 100% cash.

21
• The tax benefits are not as advantageous for equity ISAs – since the abolition of the dividend tax credit,
there is effectively a 10% tax on dividends. Furthermore, as the personal allowance for Capital Gains Tax is
£9,600 (for 2008/09), there is no real tax advantage to an ISA being free from Capital Gains Tax unless you
are a higher rate taxpayer
Overall Despite some design flaws that have engendered criticism for these reforms, it is clear that these policies intend to
introduce more people to saving. On further inspection, they could also create a base from which to increase the
amounts saved:
• The CTF will mean that every young person has a financial asset. It should also improve financial
education, meaning that when the child turns 18, they can continue with their savings habit, and use
other kinds of savings products, such as ISAs.
• The Saving Gateway should improve financial inclusion, making those on a lower-income more acquainted
with mainstream financial products. Once the 2 years are up, they should have also picked up the savings
habit, and can go on to other kinds of savings products, such as a savings account.
• Personal Accounts should increase the amounts saved, both as people become used to seeing their
pension pot increase over time, and due to the required employer contribution of at least 3%.
• On top of these products, there is the existing tax-free saving vehicle in the form of the ISA, which is one
of the more attractive forms of saving for a higher rate taxpayer. by increasing the tax-free amount, the
amounts saved should increase. Indeed, The Scottish Widows Savings and Investment Report 2009 notes
that cash ISAs were held by nearly half of survey respondents, and equity ISAs by over 10%.
There are two problems that need to be solved in order to improve the situation from here:
Firstly, there are design flaws within the current policies that need to be ironed out. Secondly, the policies need to
be joined up in order to present a comprehensive savings approach that delivers the goal of promoting savings as
an end in itself.
We will now address each of these problems in turn, before drawing our final conclusions.

22
Improvements to the current system Design of current policies The biggest criticisms of these policies arise when it is felt that certain sectors of society lose out, and other sectors
are “unfairly” rewarded. But as our analysis shows each of these policies is designed for a different audience with
different needs. This is a sensible approach but the Government needs to make it clearer that each policy is in fact
designed to be different in this way. Different sectors have different needs. Once all the policies are put together
and presented in unison, then it will become clear that where some seem to benefit, they can also lose out
elsewhere.
Furthermore, each policy can be amended in order to deliver the incentives that they were designed to achieve.
We will now consider each policy in turn and outline our recommendations for how it could be improved.
Child trust funds This is the only truly universal benefit on offer. It is important that at least one savings policy can apply to
everyone, to convey the message that saving is too important for anyone to neglect it.
However, the second tranche of cash given once the child is 7 is a curious approach to encouraging saving – what
behaviour is it rewarding? It would be better to offer this extra payment at the beginning of the process; that way,
there will be an extra seven years of return to add to the original voucher.
The costs of the scheme have prompted some to argue that it is an expensive luxury in the current climate of
budgetary belt-tightening. Reducing or scrapping CTFs now would seem unwise:
• having only been in action for 7 years, we have yet to see its full benefits, particularly the improvement in
financial capability for 16-18 year olds when they manage their funds for the first time;
• the scheme has been well received, with parents choosing to invest the vouchers three quarters of the
time (rather than leaving it to be automatically invested by the government);
• their universal application means that CTFs can form the foundation of a comprehensive saving policy.
We recommend that the anomaly of the extra payment at age 7 should be removed and paid at the start, and that
the scheme should remain in place for all children.
23
Saving Gateway The innovation of providing a matched saving product should help to trigger savings behaviour in a sector of
society that is currently poorly provided for in the area of savings products. In the 2009 Scottish Widows Savings
and Investment Report, matched saving ranked third in the list of incentives to save. A matched savings product
could therefore tap into a group that have never saved before. Academic studies into incentives support this view.
A 2003 study showed that participants agreed unanimously that matched funding “…was the most effective way of
encouraging people like them to save.”61 A poll conducted after the second Saving Gateway pilot scheme confirms
that “…the match rate was very important in their decision to open a SG account.”62
There are three ways, however, to improve the SG scheme:
• Involve the savings industry in its design. At the moment, the scheme contains too many unknowns for
the private sector to be able to act as providers: how is the matching calculated - on the highest amount
over a period, or on average? Why is it a requirement that people can transfer the account within the 2
year period – this is very costly and time consuming given the short time period and relatively small sums
of money involved? Upon maturity, will there be a delay in crediting the person with the interest or will
the provider make the payment and then claim it back from the government?
If providers were able to design the product then they could make sure that it was consistent and, most
importantly, clear to the customer. It should be noted that PADA’s work has been very well received, and
this is in large part due to the private sector background of the implementation team. They knew what
private sector providers would be looking for in the creation of personal accounts.
Most banks also now provide basic bank accounts. Given that the goal of this scheme is to improve
financial inclusion, it would be useful if SG account holders could open basic bank accounts to facilitate
the matching payments. This would mean that once the SG time period elapses, the person could move
onto other products; and they would already have a relationship with the bank, ensuring that they
became part of the mainstream financial system.
• Delivery of the product is key, and must be considered in more detail. The current requirement that any
provider must offer an over-the-counter cash option is potentially harmful in this regard. It adds to the
cost of providing the product, and it also fails to understand how lower income groups might be
incentivised to join the scheme. Benefits are often received electronically – it is therefore less likely that
once this has been converted into cash, the recipient will make a special trip to deposit it over the counter

24
into a Saving Gateway account. An alternative approach would be to deduct the money at source: this
taps into the behavioural finance idea that “what you don’t have, you don’t miss.”
If an individual did want to make a cash payment, it might be better to use providers who are currently
set up to receive such small cash payments, rather than banks. Although the Post Office could fulfil this
role, it might prove to be a costly burden on the state. An alternative idea would be to encourage private
sector providers such as PayPoint to accept SG payments. PayPoint facilities exist in around 18,000
outlets, and Credit Unions already use PayPoint to accept loan repayments. Many users of the system
prefer the anonymity of it, as no-one will know whether a late loan is being repaid, if you are depositing
money or simply paying a utility bill.
• The matching rate should in some way be linked to interest rates. This is important because the goal of SG
is to make savings products clear to those who might never have saved before. Matching is certainly the
easiest way to express the reward for saving, but it must not be divorced from interest rates. Even the
most simple of savings accounts earn a rate of interest. If the goal of this policy is to improve financial
literacy and promote financial inclusion, then those who participate must learn what to expect when they
progress to the next level of mainstream financial services.
We recommend that providers should be involved in a re-design of the scheme; that the channels of delivering the
scheme are reconsidered; and that the matching rate should in some way be an expression of the interest rate.
Personal accounts Understanding why people regard their house as an investment provides us with the clues for how to incentivise
pension saving. It is not just about the tax break, it is also about flexibility. Demand for housing increased as people
learnt that they could release some of the equity from their investment. Pensions should provide similar flexibility
– people should be able to tap into some of their savings, should an emergency need arise. With no jobs-for-life
any more, it seems unrealistic to expect savers to plan only for their retirement rather than more immediate “rainy
day” needs.
Unfortunately, the ticking time bomb of pension provision is so important that schemes cannot be too flexible, and
the Personal Accounts scheme does not offer any early withdrawals. The UK can learn much from the 401(k) plans
in the USA, as well as Canada, on how to structure the schemes.

25
USA
Through a 401(k) plan, employees authorise their employer to deduct up to 15% of salary up to a limit of $16,500
per annum. Contributions are made from gross income and are tax deductible. Employers can match the
contribution but it is not mandatory. The plans allow both outright withdrawals and loans, usually for the following
reasons:
• Hardship Withdrawals
This is allowed under certain conditions, such as medical expenses or disability. There is a 10% penalty of the sum
withdrawn and it is liable for income tax, to discourage frequent usage.
• Non-Hardship Withdrawals
Some plans allow for this kind of withdrawal, again with penalties and taxes to pay if the funds are not rolled over
into another retirement saving vehicle.
• Loans
Holders can borrow up to a limit of half their accumulated balance or $50,000, though some plans restrict the uses
to which the loan can be put. The loan must be paid back, usually within 5 years; or sooner if you leave a company
with any loan outstanding.
CANADA
In Canada, withdrawals from Registered Retirement Savings Plans (RRSPs) can be made, penalty-free, for buying a
house or for educational fees. There are restrictions on the house purchase: the amount is capped at C$20,000,
they must not have owned a house in the previous five years, and it must be repaid within 15 years. Once that
period has elapsed, and the money has not been repaid, then the pension pot will be permanently reduced by this
amount.
There is also a C$20,000 limit for educational fees, with only C$10,000 permitted to be withdrawn in any one year.
Repayment can be delayed until 5 years after the first withdrawal, and then must be paid back within a 10 year
window. Other withdrawals can be made, but at a graduated fee: 10% for all withdrawals under C$5,000 up to
35% over C$15,000.
Research has shown that giving such flexible options increases the rate of contribution by plan participants. A
report, Contribution Behaviour of 401(k) Plan Participants by the Employee Benefit Research Institute and the
Investment Company Institute showed that contribution rates were raised by 10% in plans that offered loans.63

26
Furthermore, the option to borrow does not mean that every participant uses the facility. The same report showed
that just 18% of the participants actually had a loan outstanding. Indeed their loan balances amounted to only 14%
of total account balances (net of the unpaid loan). This implies that allowing the option to borrow does not render
the concept of retirement planning redundant – people can be trusted to use the facility wisely. In turn, they
contribute more to their pension, safe in the knowledge that their saving can be accessed if a short-term
emergency need arises.
Therefore the personal accounts initiative should at some point offer the flexibility to access pension pots ahead of
retirement. Auto-enrolment in personal accounts will take time to become familiar to people, and it is preferable
to retain simplicity at the start of an initiative that is designed to change behaviour. In the longer term, however,
flexibility should increase pension provision, and it should be introduced once the start-up period of the personal
accounts scheme is complete.
We recommend that once the scheme is familiar to people, a flexible component to the scheme that permits early
withdrawals should be introduced.
ISA The recent significant increase in the maximum amount that can be invested is certainly welcome, given how much
the economy has grown since they were first introduced over a decade ago. An annual rise in the ceiling in line
with inflation should be introduced. Although this might only raise the amount a little, it sends a wider signal that
inflation should be considered when making saving decisions. It also signals a wider intent that ISAs are here to
stay, reassuring consumers and creating consistency.
We recommend that the maximum amount that can be invested in an ISA should every year be raised by the rate
of inflation.
Delivering the policy goal The signalling power of policy is important when attempting to embed a shift in cultural behaviour. Having
considered some of the ways to improve savings products, they must then be presented in a coherent fashion, so
that they don’t undermine the very goal of making saving an end in itself.
Simplicity is key, as the DWP Survey explains: “[f]indings from previous research indicate that, while people value
choice they are easily overwhelmed by it – particularly in contexts where the costs associated with making a
‘wrong’ choice are perceived to be high (such as making major financial decisions).”64

27
The saving framework outlined in this note could be described as a combination of 4 “jam jars” for people’s
savings:
Jam jar 1) long-term saving, for retirement:
• Automatic enrolment into a personal account, possibly with the added benefit of being able to unlock
some of the money in a specified emergency situation
Jam jar 2) saving for a big purchase, such as the down-payment on a house:
• The tax-free ISA allowance of £10,200 could contribute to this
Jam jar 3) saving for a regular annual treat, such as a holiday or Christmas:
• Using the Saving Gateway, a matched savings scheme
Jam jar 4) saving for your children:
• Take up the free CTF voucher
To some degree, people’s choices of jam jars will then be self-selecting. Some people might not ever save up for a
house deposit; some people might just save for Christmas. Behavioural Economics has shown that we commonly
divide accounts into different objectives in this way, something known as Mental Accounting.65 People are likely to
focus just on the savings goals that are important to them.
People will continue to think that their homes constitute a large proportion of their savings. But if they start to use
other products and see that they deliver preferable outcomes, then that might be the first step towards weaning
the country off its unsustainable housing addiction.
Presenting the policy in this way will offer people simple choices and, in so doing, emphasise the importance of
saving. There will be a product for everyone. To deliver the political argument of why saving can and should apply
to everyone, the focus should fall on the maxim stated earlier: money may not bring happiness, but it can bring the
freedom to make choices.
28
The political argument will also be supported by the reduction of criticisms that specific policies are unfair: it will
be easier to see that if a certain sector of society cannot benefit from jam jar 2, they are still able to benefit from 1
and 4, for example. This should reduce the need for the temptation to tweak policies, and a more consistent and
stable approach to savings should help to embed a long-term cultural change.
There will still be the risk that politicians try to influence voters in a specific section of society by promising to
deliver more government help for certain policies. Such a problem is in the future, however, and the current
parlous state of savings within this country means that more people must be encouraged to save now.
Conclusion Although there is no silver bullet to restore the indebted consumer to balance, the current financial crisis provides
an opportunity to build on a shift in consumer behaviour. Saving will come to the forefront of everyone’s minds,
and it is time to concentrate on increasing the number of savers, as well as the aggregate amount saved, over the
long term.
There is no one policy that will achieve this goal. The answer comes in a change of approach towards savings policy
– instead of piecemeal amendments, there should be a new, coherent and comprehensive set of savings policies.
To do this, the current policies should undergo a re-design, and then be repackaged as part of a new, jam jar,
approach to saving. Our recommendations are as follows:
Child Trust Funds
• Make the extra payment at age 7 part of the original voucher awarded at birth.
Saving Gateway
• Ask providers to re-design the scheme;
• Consider alternative methods of delivery;
• Express the interest rate as a match.

29
Personal Accounts
• Introduce flexible withdrawals once the scheme is up and running and people are familiar with how it
works.
ISA
• Raise the ceiling each year by the rate of inflation.
Place each in its own jam jar and then present this new framework to consumers.
Embedding a new savings culture will help to recapitalise the economy. Despite the low level of saving in Britain,
the tools to solve the remedy have already been laid out. They must now be strengthened and assembled to
create a sustainable framework for improving the saving rate over the long term.
References
1 Statistical First Release, ‘Children looked after in England (including adoption and care leavers) year ending 31 March 2009,’
30
1 International Monetary Fund, World Economic Outlook Database, October 2009 2 National Savings and Investments, Quarterly Savings Survey, Issue 21, Autumn 2009 3 Scottish Widows, Scottish Widows Savings and Investment Report 2009, Scottish Widows, 2009 4 Financial Services Authority, Measuring Financial Capability: An Exploratory Study, Financial Services Authority, 2005 http://www.fsa.gov.uk/pubs/consumer-research/crpr37.pdf 5 Financial Services Authority, Financial Capability in the UK: Establishing a Baseline, 2006 http://www.fsa.gov.uk/pubs/other/fincap_baseline.pdf 6 Cohn & Wolfe, “Banking Blues: UK Survey says Consumers Lose Trust as ‘greedy’ and ‘impersonal’ Banks fail to offer Advice amid Financial Downturn,” Cohn & Wolfe, 2009 http://www.cohnwolfe.com/en/news/banking-blues-uk-survey-says-consumers-lose-trust-%E2%80%98greedy%E2%80%99-and-%E2%80%98impersonal%E2%80%99-banks-fail-offer-ad 7 Bynner J (2001) ‘Effects of assets on life chances’ in Bynner J and Paxton W (eds) The Asset-effect 8 National Savings and Investments, Quarterly Savings Survey, Issue 21, Autumn 2009 9 National Savings and Investments, Quarterly Savings Survey, Issue 21, Autumn 2009 10 International Monetary Fund, World Economic Outlook Database, October 2009. The chart shows all available data from internationally comparable countries 11 See http://www.fsa.gov.uk/financial_capability/about_us/history/ 12 See http://www.fsa.gov.uk/financial_capability/about_us/history/ 13 http://www.fsa.gov.uk/pubs/consumer-research/crpr37.pdf 14 Financial Services Authority, Financial Capability in the UK: Establishing a Baseline, 2006 http://www.fsa.gov.uk/pubs/other/fincap_baseline.pdf 15 Scottish Widows, Scottish Widows Savings and Investment Report 2009, Scottish Widows, 2009 16 Financial Services Authority, Measuring Financial Capability: An Exploratory Study, Financial Services Authority, 2005 http://www.fsa.gov.uk/pubs/consumer-research/crpr37.pdf 17 Evans AW and Hartwich OM, Unaffordable Housing: Fables and Myths, Policy Exchange, 2005 18 Nationwide House Prices Index, April 2009 19 Collard S and Breuer Z, Attitudes Towards Investment Choice and Risk Within the Personal Accounts Scheme: Report of a Qualitative Study, research report no 565, Department for Work and Pensions, 2009 20 IPD UK Residential Investment Index 21 Pensions Policy Institute, “Retirement Income and Assets: How can Housing Support Retirement?”, Pensions Policy Institute, 2009 22 http://www.fsa.gov.uk/Pages/Library/Communication/PR/2000/150.shtml 23 http://www.guardian.co.uk/money/2006/aug/20/firsttimebuyers.property 24 In addition, interest on debt re-payments are tax-deductible for companies. 25 Daily Mail, “’250 Complaints a Day’ about Endowment Mortgages,” Daily Mail, 4 July 2006, http://www.dailymail.co.uk/news/article-394050/250-complaints-day-endowment-mortgages.html 26 Which?, “Public wants Radical Pensions’ Reform,”, Which?, 2004 http://www.which.co.uk/about-which/press/campaign-press-releases/personal-finance/2004/10/public-wants-radical-pensions-reform.jsp 27 Cohn & Wolfe, “Banking Blues: UK Survey says Consumers Lose Trust as ‘greedy’ and ‘impersonal’ Banks fail to offer Advice amid Financial Downturn,” Cohn & Wolfe, 2009 http://www.cohnwolfe.com/en/news/banking-blues-uk-survey-says-consumers-lose-trust-%E2%80%98greedy%E2%80%99-and-%E2%80%98impersonal%E2%80%99-banks-fail-offer-ad 28 Taxpayers' Alliance 29 HC 848–I, para 118 30 Willi L, Thornton J and Bibbee A, "Taxation and Economic Performance," OECD, working paper 176, 1997 31 Ibid 32 See Barro RJ, "Determinants of Economic Growth: A Cross-Country Emprical Study." NBER, working paper 5698, 1996 33 Halligan L, “Brown’s Raid on Pensions costs Britain £100 Billion,” The Daily Telegraph, 15th October 2006, http://www.telegraph.co.uk/news/uknews/1531448/Browns-raid-on-pensions-costs-Britain-100-billion.html 34 Knight J, “Child Trust Funds hit not so Terrible Twos”, BBC, 2007 http://news.bbc.co.uk/1/hi/business/6521655.stm 35 TISA statistics covering approx. 70% of CTF providers 36 http://www.hmrc.gov.uk/ctf/key-features.htm 37 http://www.hmrc.gov.uk/ctf/key-features.htm 38 http://www.hm-treasury.gov.uk/press_80_09.htm 39 The Children’s Mutual, “Child Trust Fund Figures Provide Cause for Hope Despite Growing Economic Gloom,” The Children’s Mutual, 2008 http://www.thechildrensmutual.co.uk/about-the-childrens-mutual/media-centre/2008-press-releases/child-trust-fund-figures-hope.aspx 40 http://www.childtrustfund.gov.uk/templates/Page____1218.aspx

31
41 Zuckerman M, Porac J, Lathin D, Smith R and Deci E L, “On the Importance of Self-determination for Intrinsically Motivated Behaviour, Personality and Social Psychology,” no 4, pp 443-446, 1978 42 Olsen R, “Behavioral Finance and its Implications for Stock Price Volatility,” Financial Analysts Journal, vol 54 no 2, pp 10-18, 1998 43 Engage Mutual Assurance, “No Child Trust Fund yet? Get on the Net!,” Engage Mutual Assurance, 2005 http://www.engagemutual.com/MediaCentre/PressReleases/011005.asp 44 The Sunday Times, “Child Trust Fund ‘is a tax perk for the rich’,” Sunday Times, December 7 2003, http://www.timesonline.co.uk/tol/money/article1035771.ece 45 http://www.parliament.uk/commons/lib/research/rp2009/rp09-016.pdf 46 http://www.theyworkforyou.com/lords/?id=2009-03-17a.118.4 47 Myners L, http://www.theyworkforyou.com/lords/?id=2009-03-17a.118.4 48 Lord Newby http://www.theyworkforyou.com/lords/?id=2009-03-17a.118.4 49 Hansard 17 March 2009 http://www.publications.parliament.uk/pa/ld200809/ldhansrd/text/90317-0004.htm 50 Hansard, 27 January 2009 http://www.publications.parliament.uk/pa/cm200809/cmpublic/saving/090127/pm/90127s01.htm 51 http://www.parliament.uk/commons/lib/research/rp2009/rp09-016.pdf 52 Personal Accounts Delivery Authority, Key Facts, 2008 http://www.padeliveryauthority.org.uk/documents/key_facts.pdf 53 Addleshaw Goddard, Personal Accounts – the Government’s Plans, Addleshaw Goddard, issue 97, 2007, http://www.addleshawgoddard.co.uk/asset_store/document/pensions_update_july_07_issue_97_102237.pdf 54 http://www.pensionsadvisoryservice.org.uk/miscellaneous/personal_accounts/ 55 PADA Investment Consultation, May 2009 56 Webb C, Pye J, Jeans D, Robey R, Smith P, Gray E, Harvey P and Lancaster J, “Research on Individuals’ Reactions to the Workplace Pension Reforms,” Department for Work and Pensions, 2008 57 This is Money, “Personal Accounts Q & A,” This is Money http://www.thisismoney.co.uk/help-and-advice/advice-banks/article.html?in_advicepage_id=125&in_article_id=421545&in_page_id=90. 58 Bytestart, “’Personal Accounts’ will Impact Small Business Pension Schemes,” Bytestart, 2009 http://www.bytestart.co.uk/content/finance/43_1/personal-accounts.shtml 59 Barclays, Equity Gilts Study, Barclays, 2009 60 Barclays, Equity Gilts Study, Barclays, 2009 61 Collard S, Kempson E and Dominy N, Promoting Financial Inclusion: An Assessment of Initiatives Using a Community Select Committee Approach, Joseph Rowntree Foundation, 2003 62 Institute for Fiscal Studies and Ipsos MORI, Interim Evaluation of Saving Gateway 2, Institute for Fiscal Studies and Ipsos MORI, 2006 63 Holden S and Van Derhei J, “Contribution Behaviour of 401(k) Plan Participants”, Investment Company Institute, vol 7, no 1 2001 http://www.ici.org/pdf/per07-04.pdf 64 Iyengar S and Lepper M, “When Choice is Demotivating: Can one Desire too Much of a Good Thing?,” Journal of Personality and Social Psychology, vol 79, 2000 65 Thaler RH, “Mental Accounting Matters,” Journal of Behavioral Decision Making, vol 12, no 3, pp 183-206, 1999

January 2010
The work of the Economics unit at Policy Exchange
For more information on the work of the Economics unit, please contact Andrew Lilico, Research Director of
Economics at [email protected]
About Policy Exchange
Policy Exchange, an independent educational charity, is Britain’s largest centre-right think tank. Our mission
is to develop and promote new policy ideas which will foster a free society based on strong communities,
limited government, national self confidence and an enterprise culture. In contrast to many other think tanks
Policy Exchange is committed to an evidence-based approach to policy development. Our impact speaks for
itself: from housing to policing reform, education to the NHS, our proposals have been taken on board by the
main political parties. Registered charity number 1096300. For more information please contact us at: Clutha
House, 10 Storey’s Gate, London, SW1P 3AY. Alternatively we can be contacted on 020 7340 2650 and at
Trustees
Charles Moore (Chairman of the Board), Richard Ehrman (Deputy Chair), Theodore Agnew, Richard Briance,
Camilla Cavendish, Robin Edwards, Virginia Fraser, George Robinson, Andrew Sells, Tim Steel, Alice Thomson,
Rachel Whetstone, Simon Wolfson.
research note February 2010