Embed Size (px)
Citation preview

Introduction System Dynamics
Un instrument for System Thinking
Learning Objectives
After this class the students should be able to: recognize their cognitive capacity limitation
to deal is dynamic systems; understand the mean concepts of
System Dynamics, such as feedback loop, delays; and archetype of systems; and
interpret System Dynamics diagrams
Time management
The expected time to deliver this module is 50 minutes. 20
minutes are reserved for team practices and exercises
and 30 minutes for lecture
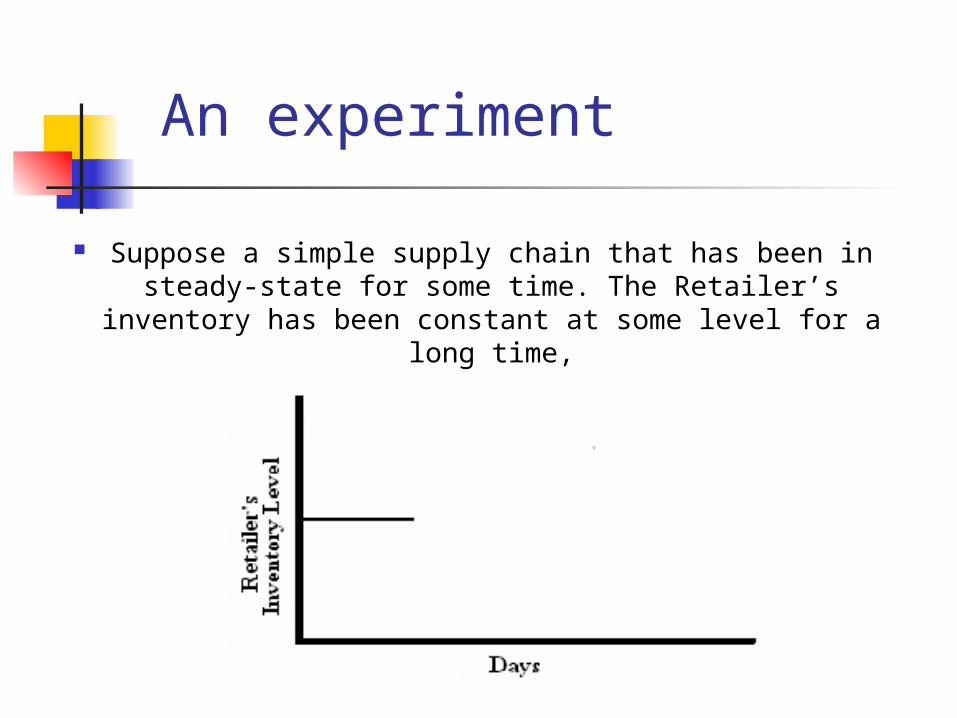
An experiment
Suppose a simple supply chain that has been in steady-state for some time. The Retailer’s inventory
has been constant at some level for a long time,
steady-state supply chain
A retailer maintains an inventory of product that is shipped to customers on demand.
Upon shipping, the retailer always orders immediately from his supplier the same amount of product just shipped.
The supplier also is very regular. He always deliveries the product to retailer 7 days after the he places the order.
The supplier has never been out‑of‑stock (and never will be!).
No product shipped by the supplier is ever, or will ever be, defective, damaged or lost in transit.
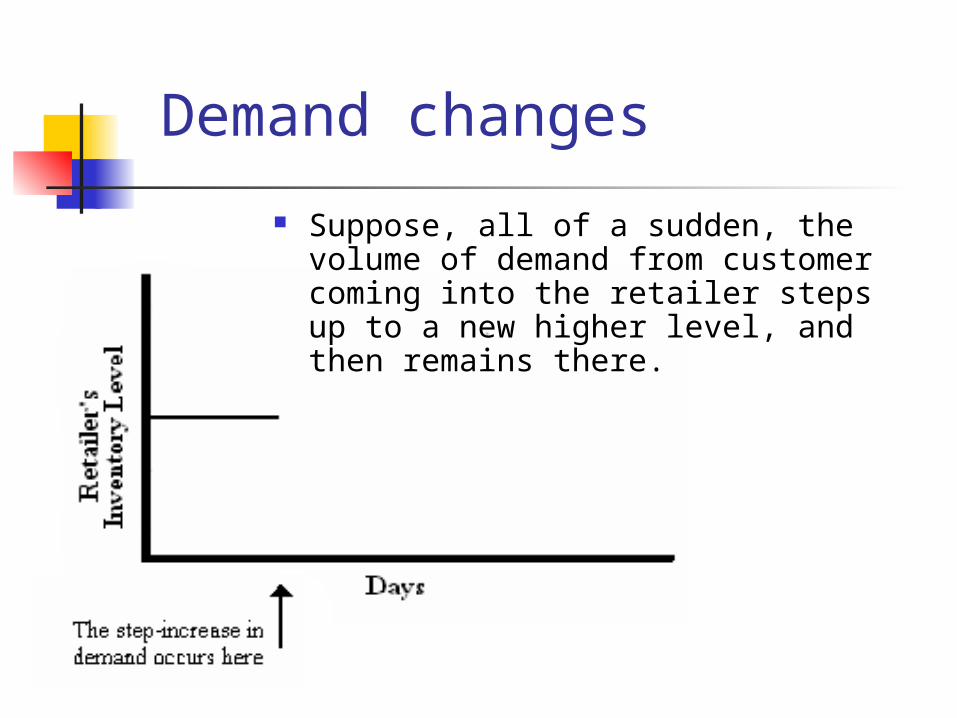
Demand changes
Suppose, all of a sudden, the volume of demand from customer coming into the retailer steps up to a new higher level, and then remains there.
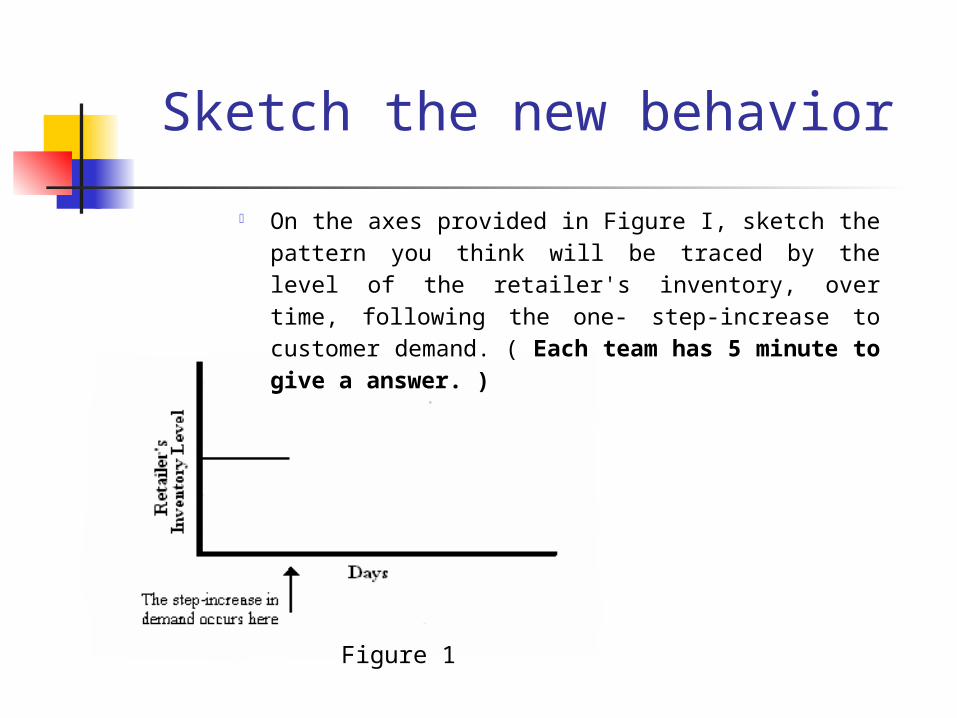
Sketch the new behavior
On the axes provided in Figure I, sketch the pattern you think will be traced by the level of the retailer's inventory, over time, following the one‑ step‑increase to customer demand. ( Each team has 5 minute to give a answer. )
Figure 1
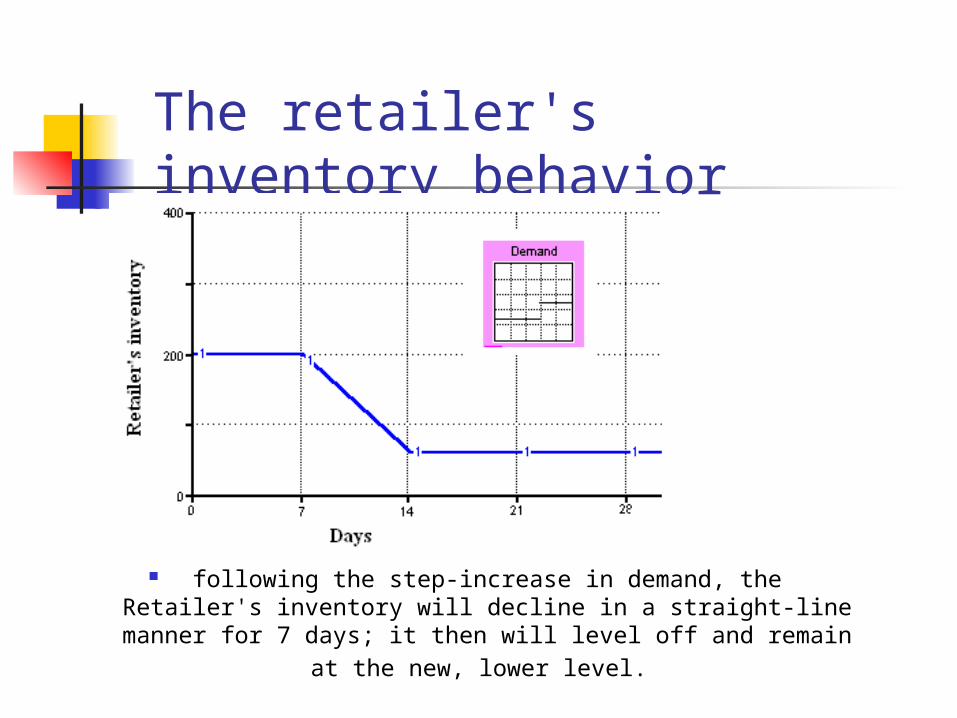
The retailer's inventory behavior
following the step‑increase in demand, the Retailer's inventory will decline in a straight‑line manner for 7 days; it then will level off and remain at the new, lower level.
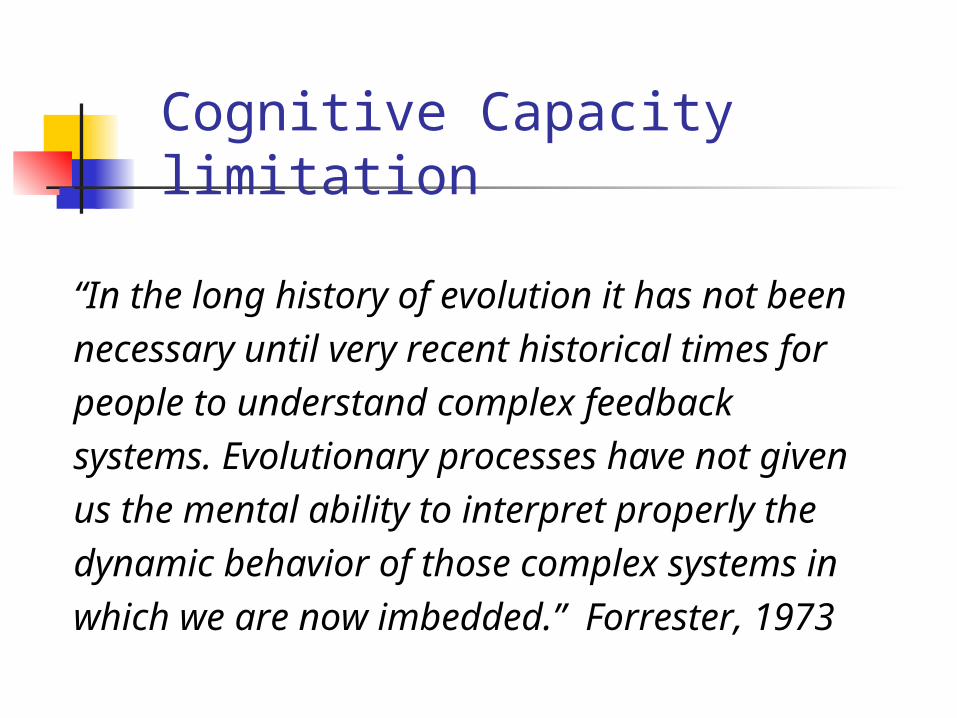
Cognitive Capacity limitation
“In the long history of evolution it has not been
necessary until very recent historical times for
people to understand complex feedback
systems. Evolutionary processes have not given
us the mental ability to interpret properly the
dynamic behavior of those complex systems in
which we are now imbedded.” Forrester, 1973
System Dynamics
In particular, to analyze how the interaction between structures of the systems and their policies determine the system behavior
Methodology to study systems behavior
Filling a cup of water
Each team is invited to describe through any kind of diagram (or algorithm) the process to fill a cup of water. Imagine this as an exercise of operation management. (10 minutes)
Desired Water Level
Perceived
Gap
Faucet
Position
Current
WaterLevel
WaterFlow
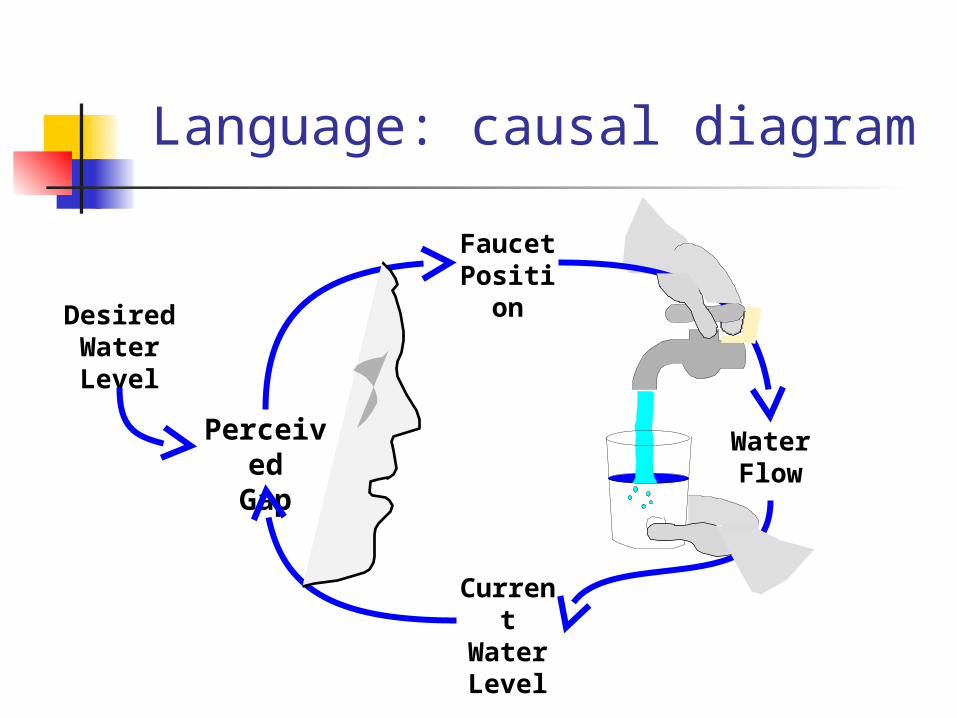
Language: causal diagram
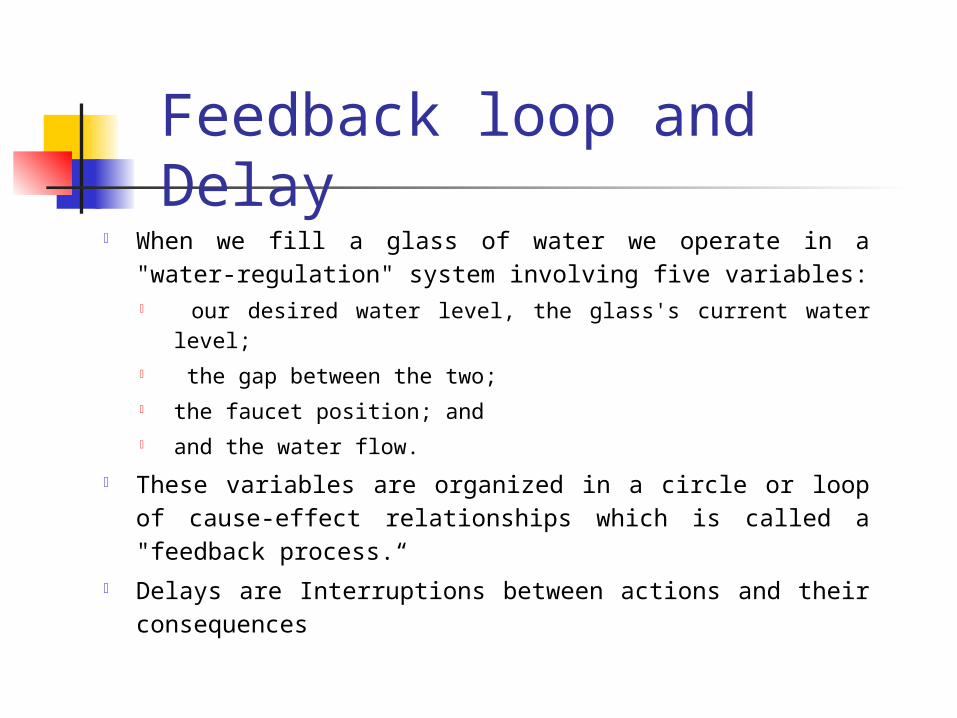
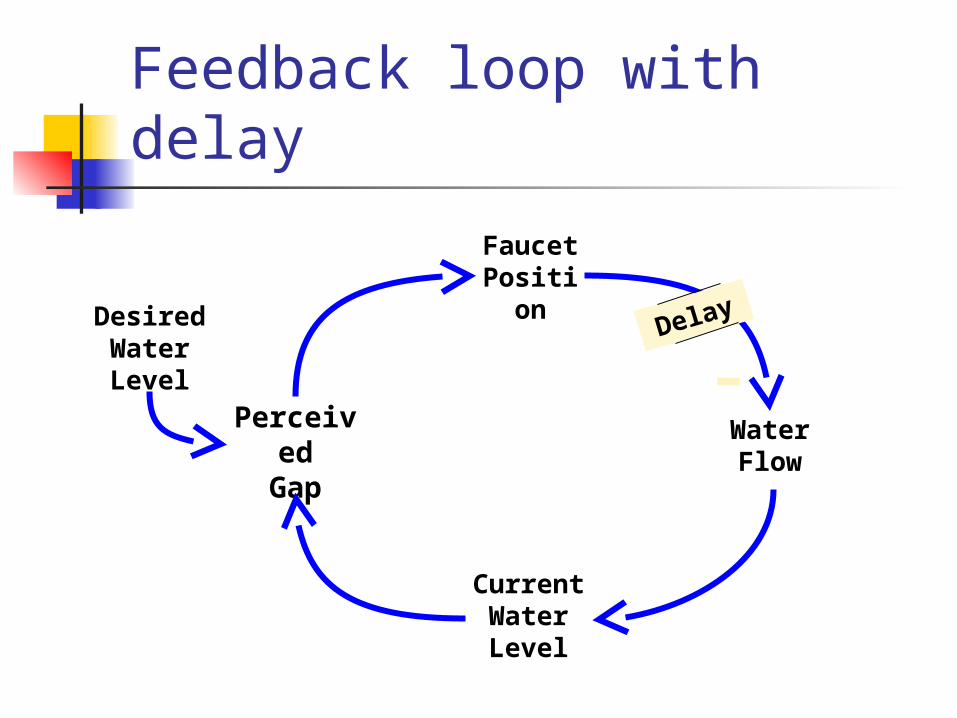
Feedback loop and Delay
When we fill a glass of water we operate in a "water‑regulation" system involving five variables:
our desired water level, the glass's current water level; the gap between the two; the faucet position; and and the water flow.
These variables are organized in a circle or loop of cause‑effect relationships which is called a "feedback process.“
Delays are Interruptions between actions and their consequences
Desired Water Level
Perceived
Gap
Faucet Positio
n
CurrentWaterLevel
WaterFlow
Delay
Feedback loop with delay
Desired Water Level
Perceived
Gap
Faucet
Position
Current
WaterLevel
Water
Flow
The means of arrows
Desired Inventor
y Level
Perceived
Gap
OrderPlaced
CurrentInventory
Level
Supply Line
-+ -
+
+
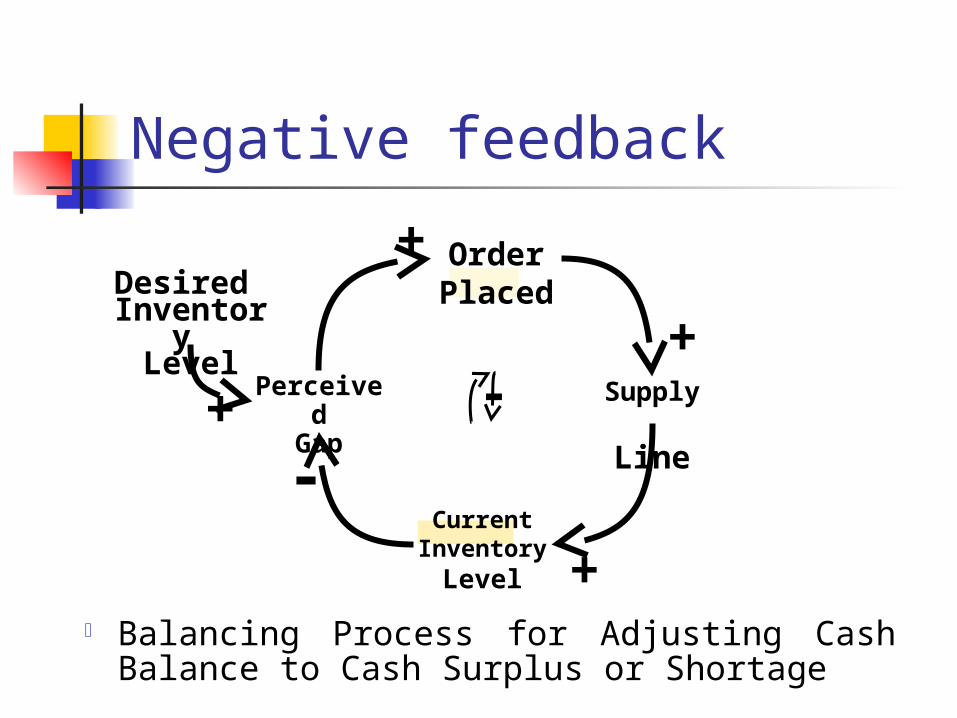
+ Balancing Process for Adjusting Cash
Balance to Cash Surplus or Shortage
Negative feedback
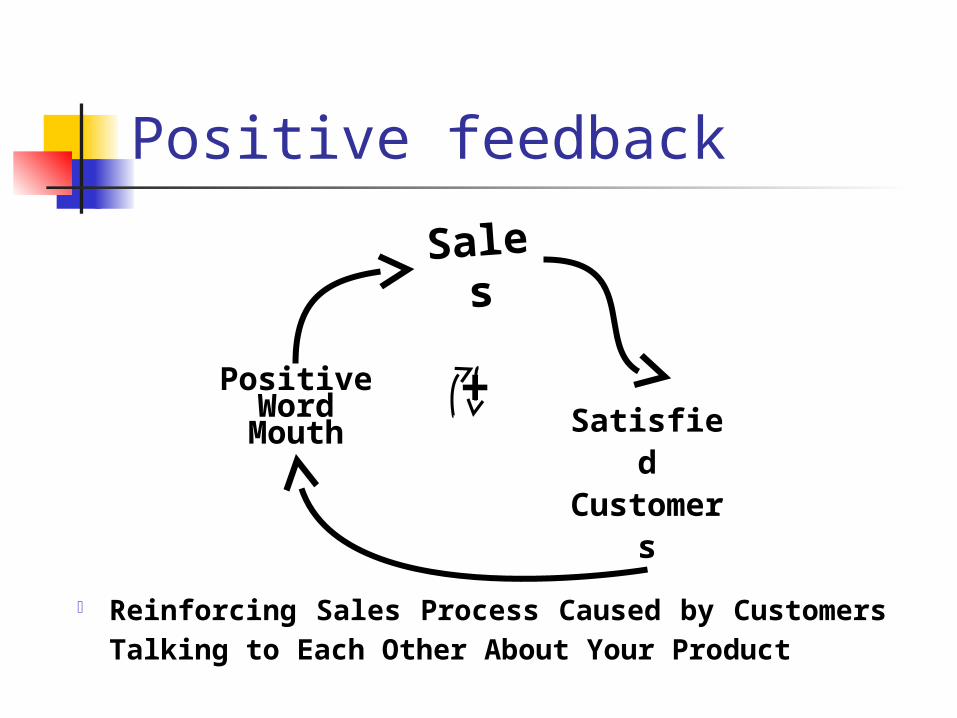
Sales
Satisfied Custome
rs
Positive Word Mouth
+
Reinforcing Sales Process Caused by Customers Talking to Each Other About Your Product
Positive feedback
Archetypes of systems
Certain patterns of structure recur again and again. These generic structures are named "systems archetypes".
Archetype systems are a set of reinforcing and balancing feedback and delays interconnected.
A relatively small number of these archetypes are common to a very large variety of management situations.
Approach developed to study system behaviors taking into account complex structures of feedbacks and time delays.
The industrial environment, seen as a set of stocks and activities linked by flow of information and flow of material submitted to time delays, is a typical object for System Dynamics study.
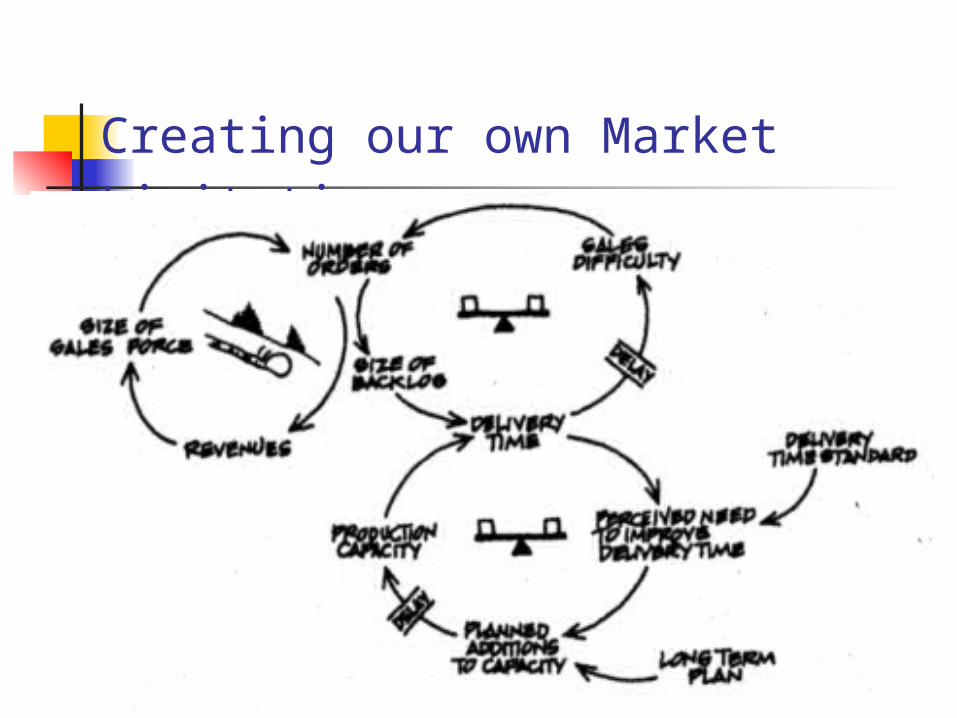
Creating our own Market Limitation
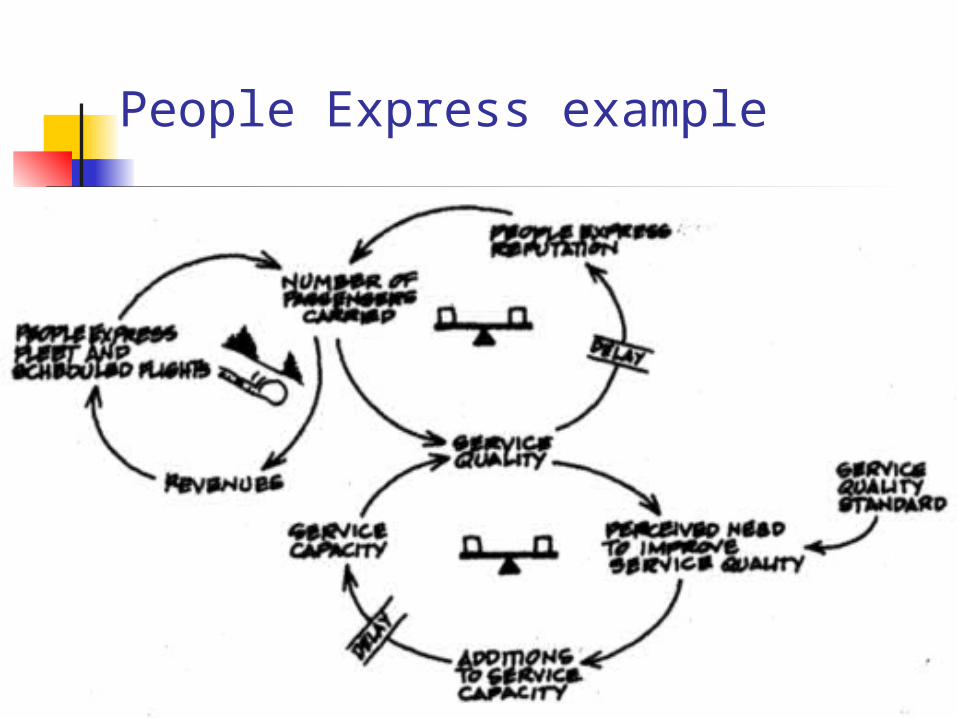
People Express example
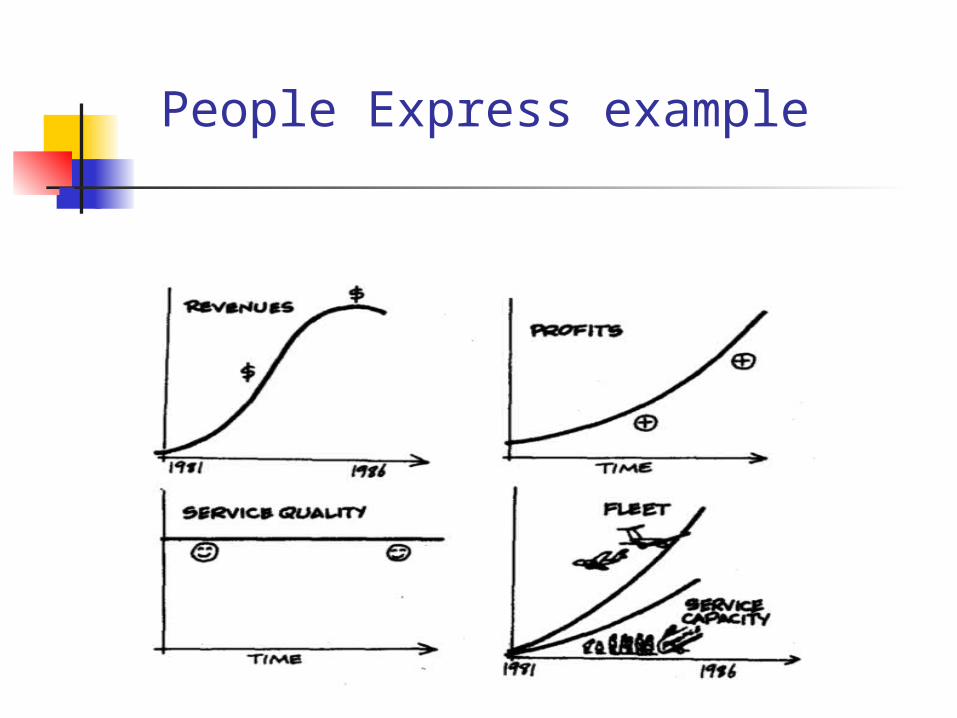
People Express example
Reference
Peter Senge, The Fifth Discipline, 1990 Chapter 5
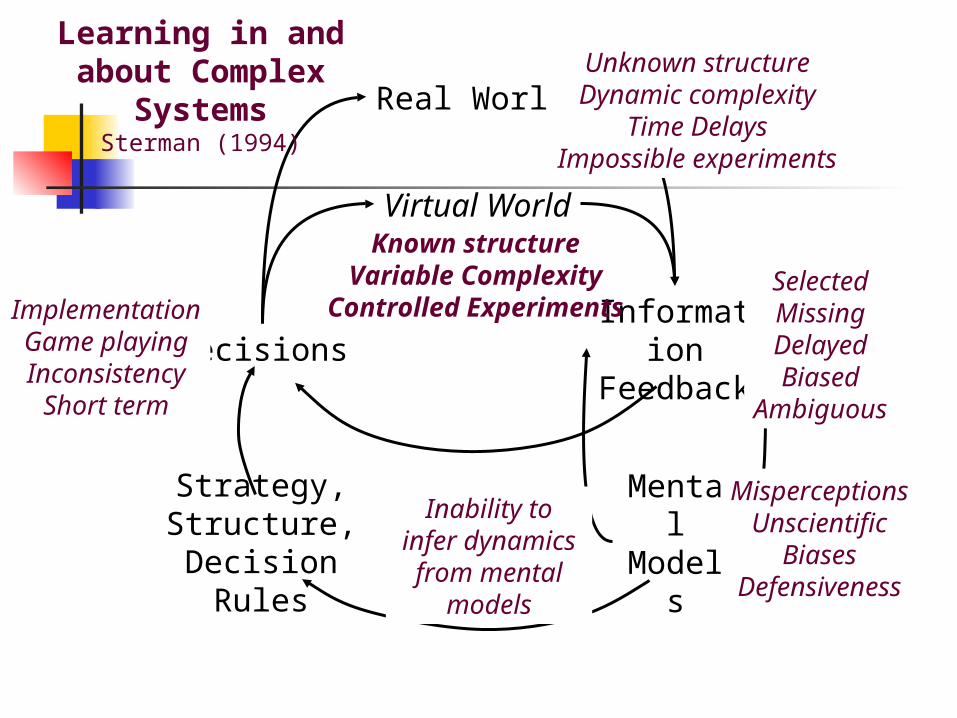
Decisions
Real World
Information Feedback
Strategy, Structure, Decision Rules
Mental Models
Virtual World
SelectedMissingDelayedBiased
Ambiguous
ImplementationGame playingInconsistency
Short term
Unknown structureDynamic complexity
Time DelaysImpossible experiments
MisperceptionsUnscientific
BiasesDefensiveness
Known structureVariable Complexity
Controlled Experiments
Learning in and about Complex Systems
Sterman (1994)
Inability to infer dynamics from mental models
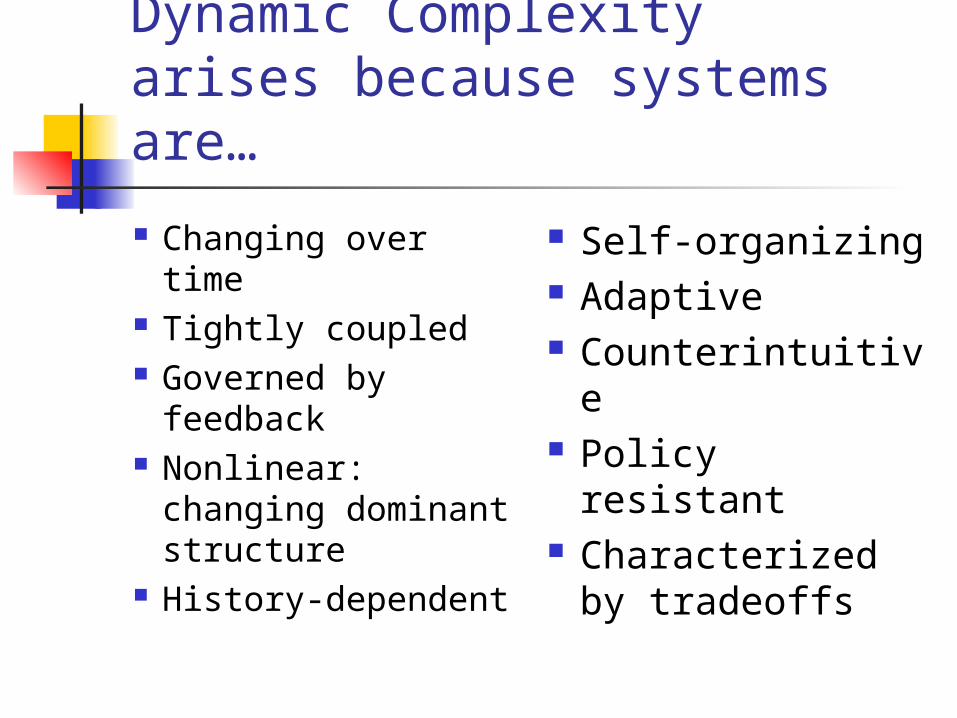
Dynamic Complexity arises because systems are…
Changing over time
Tightly coupled Governed by
feedback Nonlinear:
changing dominant structure
History-dependent
Self-organizing Adaptive Counterintuitive Policy resistant Characterized
by tradeoffs
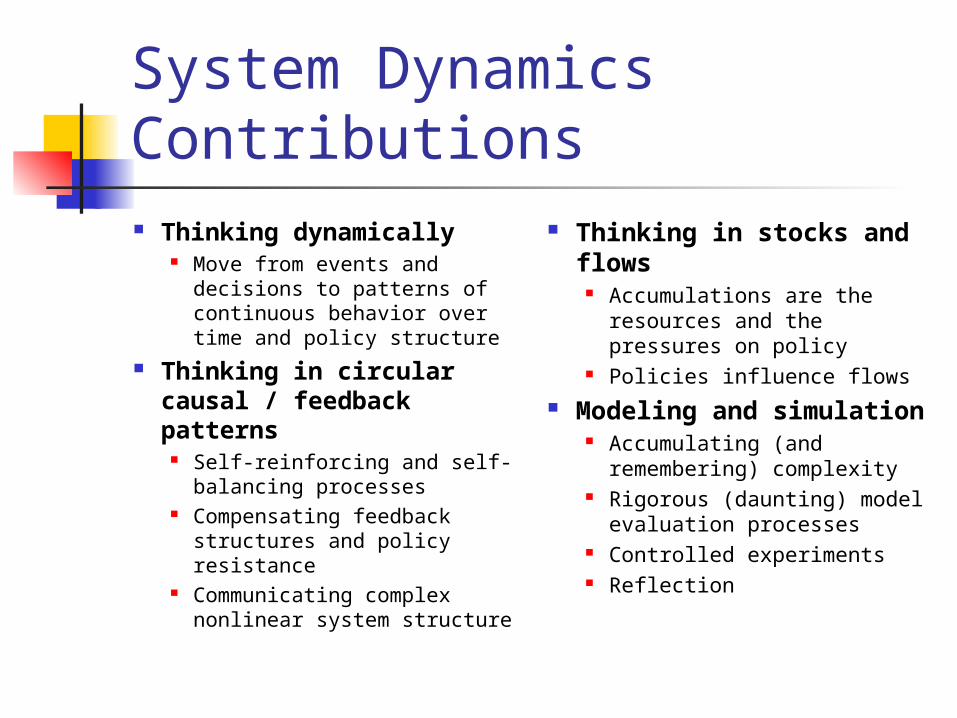
System Dynamics Contributions Thinking dynamically
Move from events and decisions to patterns of continuous behavior over time and policy structure
Thinking in circular causal / feedback patterns
Self-reinforcing and self-balancing processes
Compensating feedback structures and policy resistance
Communicating complex nonlinear system structure
Thinking in stocks and flows
Accumulations are the resources and the pressures on policy
Policies influence flows Modeling and
simulation Accumulating (and
remembering) complexity Rigorous (daunting) model
evaluation processes Controlled experiments Reflection
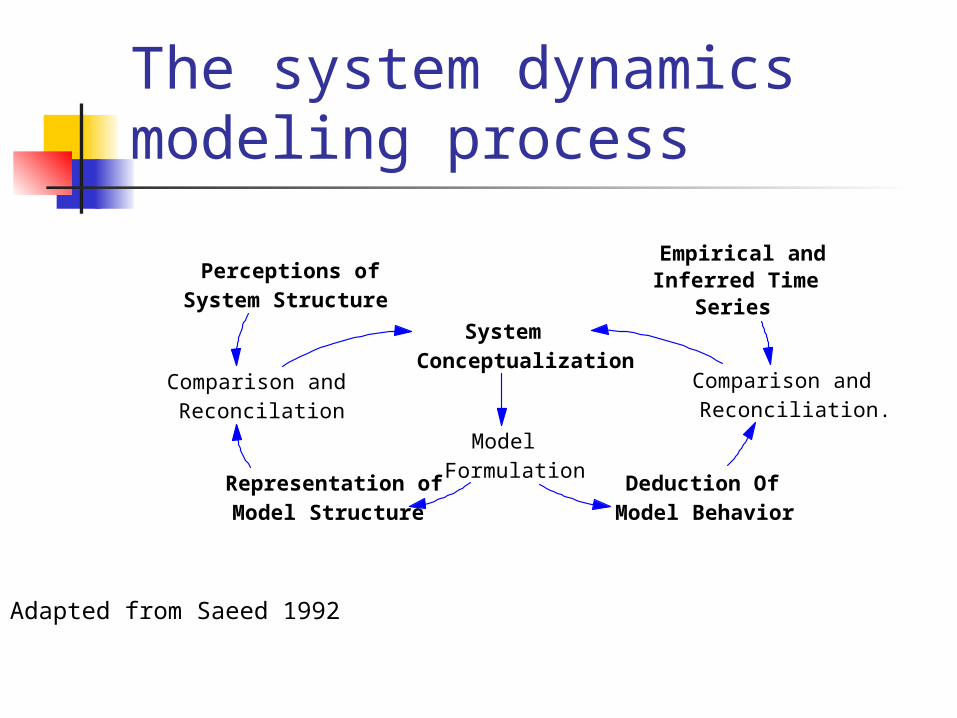
The system dynamics modeling process
SystemConceptualization
ModelFormulation
Representation ofModel Structure
Comparison andReconcilation
Perceptions ofSystem Structure
Empirical andInferred Time
Series
Comparison andReconciliation.
Deduction OfModel Behavior
Adapted from Saeed 1992
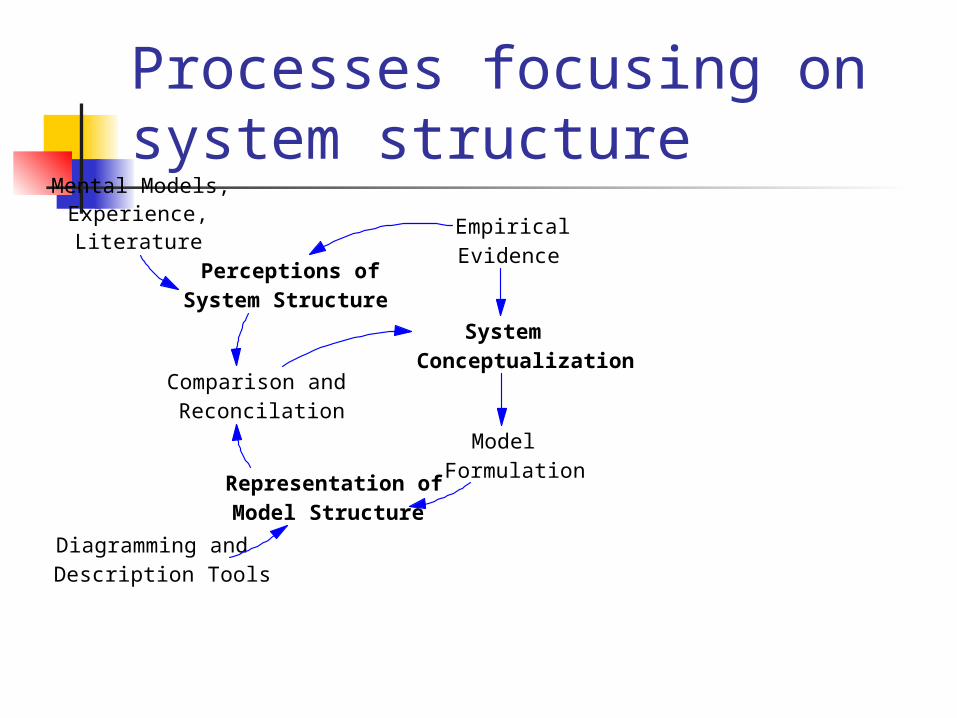
Processes focusing on system structure
EmpiricalEvidence
SystemConceptualization
ModelFormulation
Representation ofModel Structure
Comparison andReconcilation
Perceptions ofSystem Structure
Mental Models,Experience,Literature
Diagramming andDescription Tools
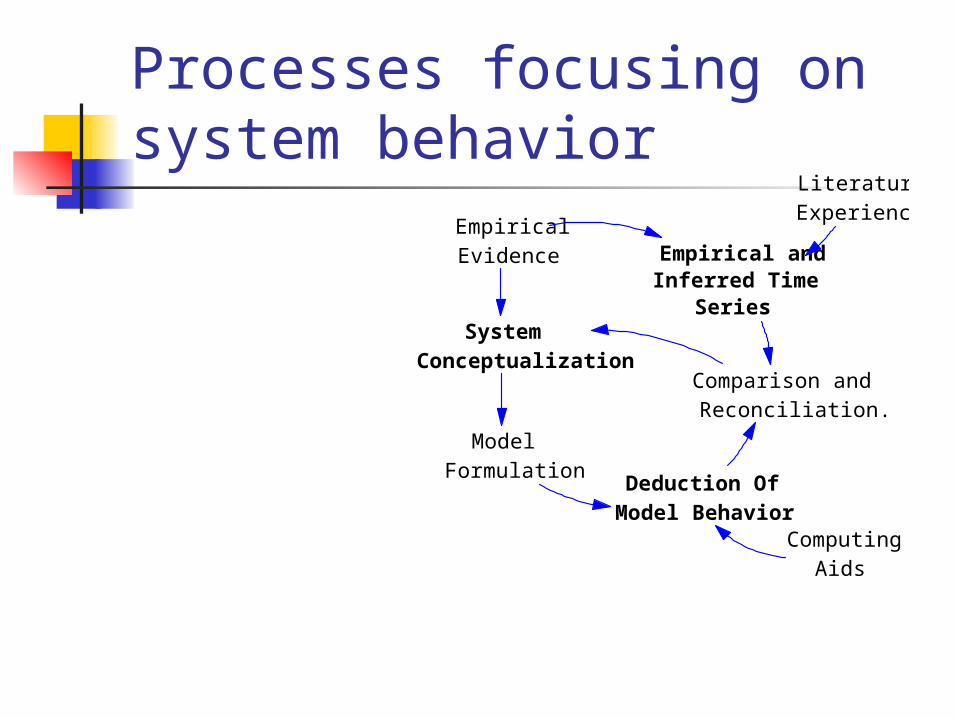
Processes focusing on system behavior
EmpiricalEvidence
SystemConceptualization
ModelFormulation
Literature,Experience
Empirical andInferred Time
Series
Comparison andReconciliation.
Deduction OfModel Behavior
ComputingAids
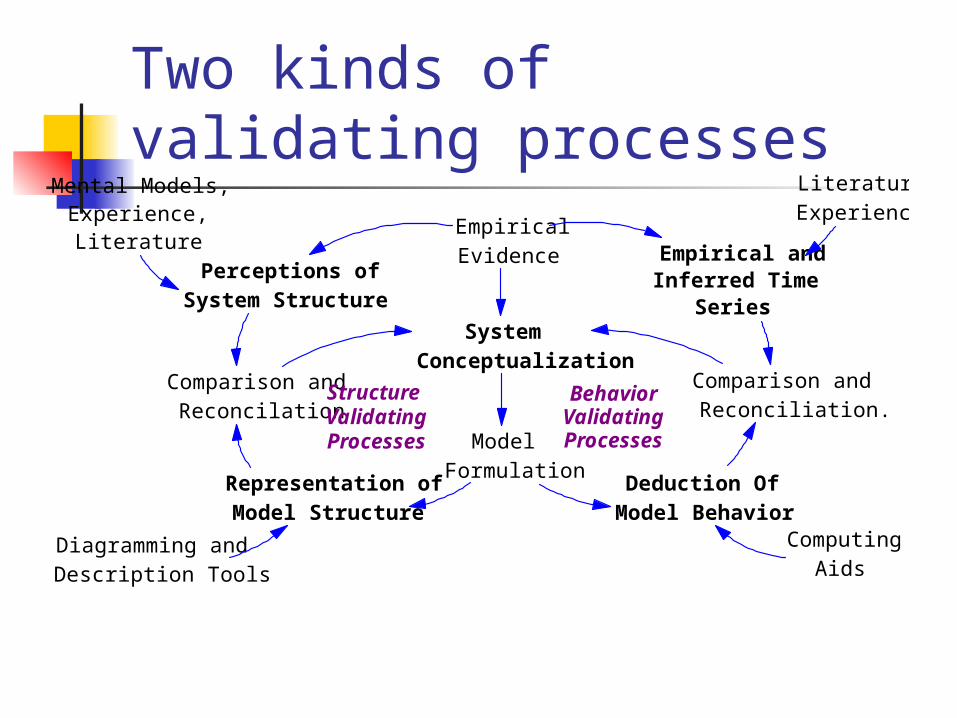
Two kinds of validating processes
EmpiricalEvidence
SystemConceptualization
ModelFormulation
Representation ofModel Structure
Comparison andReconcilation
Perceptions ofSystem Structure
Mental Models,Experience,Literature
Literature,Experience
Empirical andInferred Time
Series
Comparison andReconciliation.
Deduction OfModel Behavior
Diagramming andDescription Tools
ComputingAids
StructureValidatingProcesses
BehaviorValidatingProcesses
QuickTime™ and aTIFF (LZW) decompressor
are needed to see this picture.
Six Traditions Contributing to the Evolution of Feedback Thought•Biology: math models•Econometrics•Engineering•Social Sciences•Biology: homeostasis•Logic
Two Threads of Feedback Thought•System dynamics arises in the servomechanisms thread(the first four in this list)
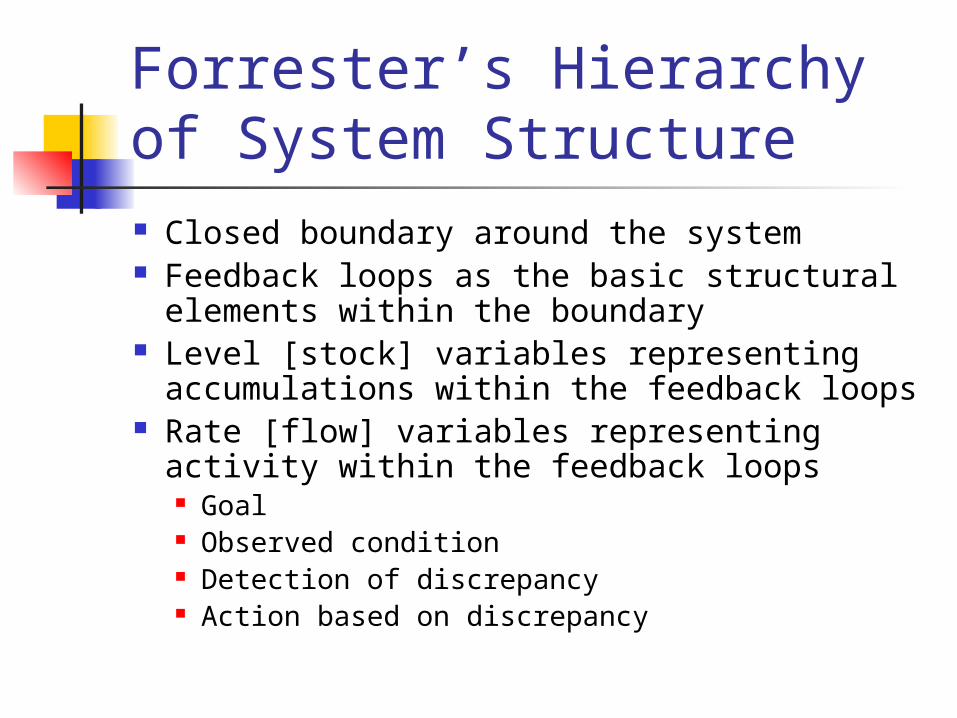
Forrester’s Hierarchy of System Structure Closed boundary around the system Feedback loops as the basic structural
elements within the boundary Level [stock] variables representing
accumulations within the feedback loops Rate [flow] variables representing activity
within the feedback loops Goal Observed condition Detection of discrepancy Action based on discrepancy
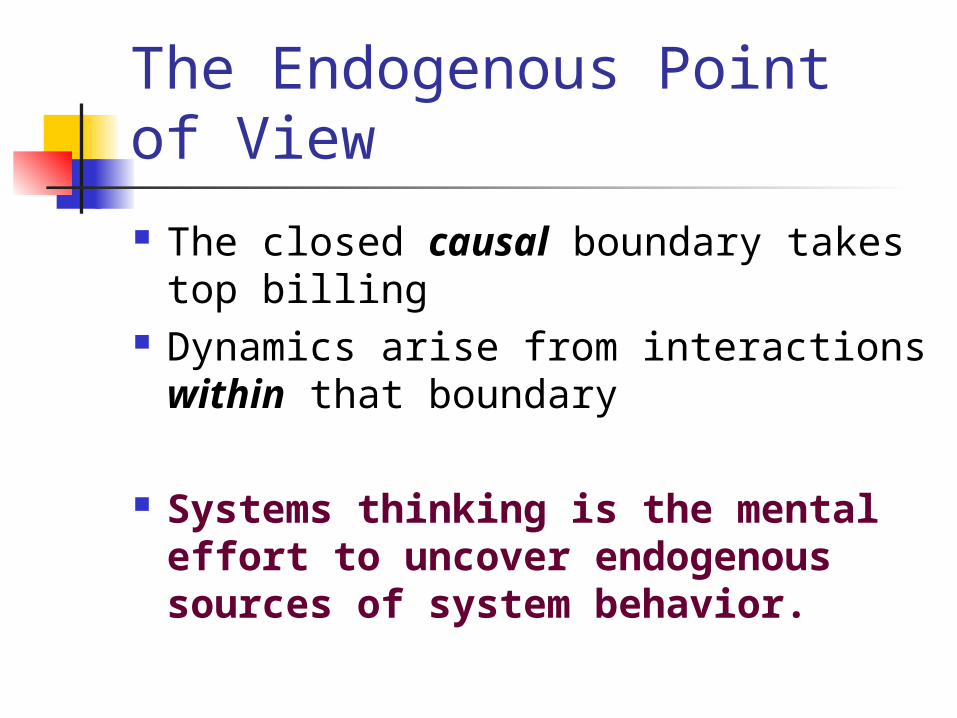
The Endogenous Point of View
The closed causal boundary takes top billing
Dynamics arise from interactions within that boundary
Systems thinking is the mental effort to uncover endogenous sources of system behavior.
Dynamics
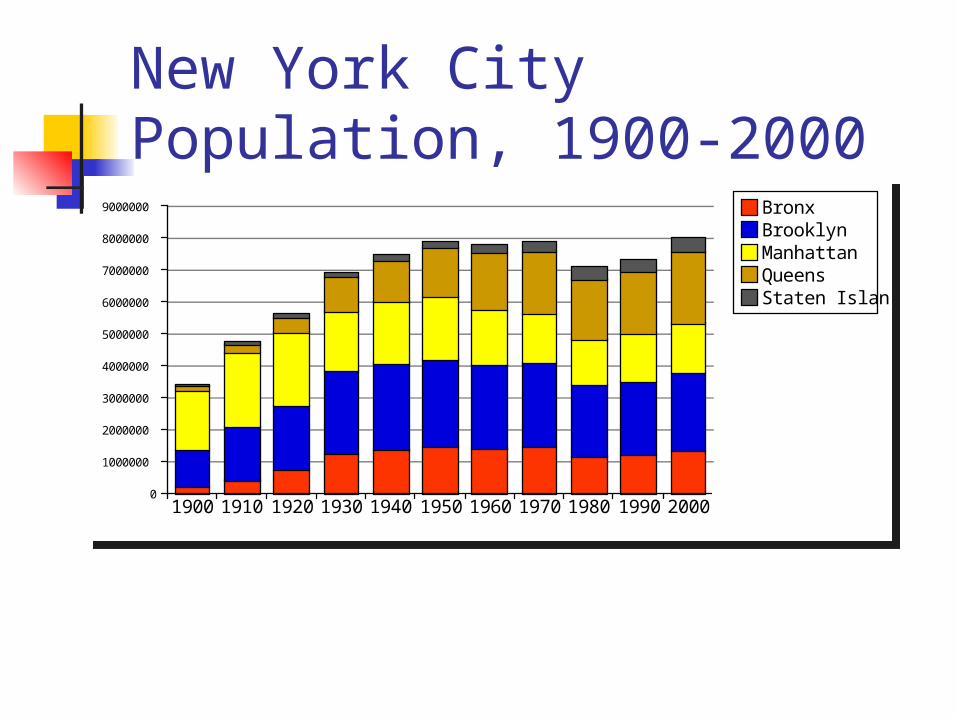
New York City Population, 1900-2000
9000000
8000000
7000000
6000000
5000000
4000000
3000000
2000000
1000000
01900 1910 1920 1930 1940 1950 1960 1970 1980 1990 2000
BronxBrooklynManhattanQueensStaten Island
9000000
8000000
7000000
6000000
5000000
4000000
3000000
2000000
1000000
01900 1910 1920 1930 1940 1950 1960 1970 1980 1990 2000
BronxBrooklynManhattanQueensStaten Island
Global Atmospheric Methane (1860-1994)
Global Atmospheric Methane
0
50
100
150
200
250
300
350
4001860
Global Atmospheric Methane
0
50
100
150
200
250
300
350
4001860

Global Average Temperature (Reconstruction 1400-1980; Data 1902-1998)
QuickTime™ and aTIFF (LZW) decompressor
are needed to see this picture.

Stocks and Flows
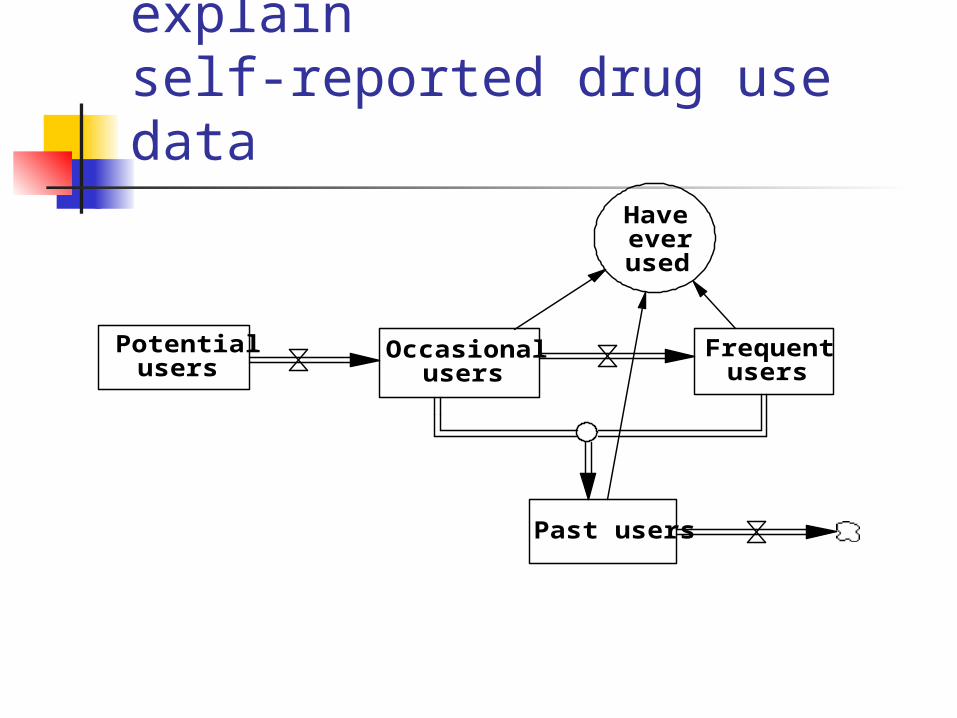
Stocks and flows help to explain self-reported drug use data
Potentialusers
Occasionalusers
Frequentusers
Past users
Haveeverused
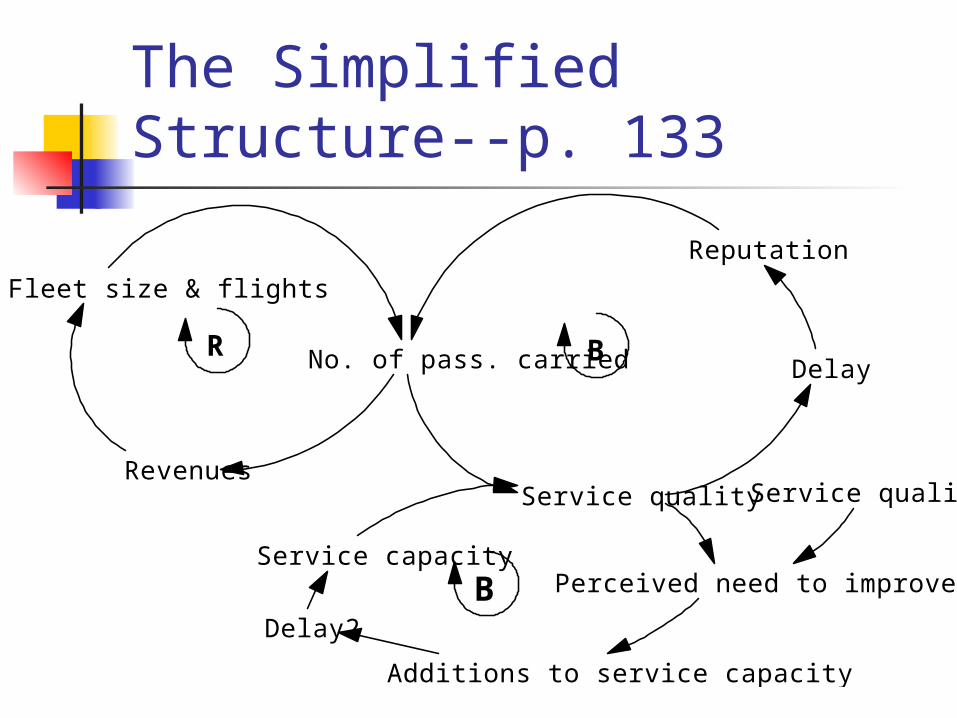
The Simplified Structure--p. 133
No. of pass. carried
Fleet size & flights
Revenues
Reputation
Delay
Service quality
Service capacityPerceived need to improve quality
Service quality standard
Additions to service capacity
Delay2
R B
B
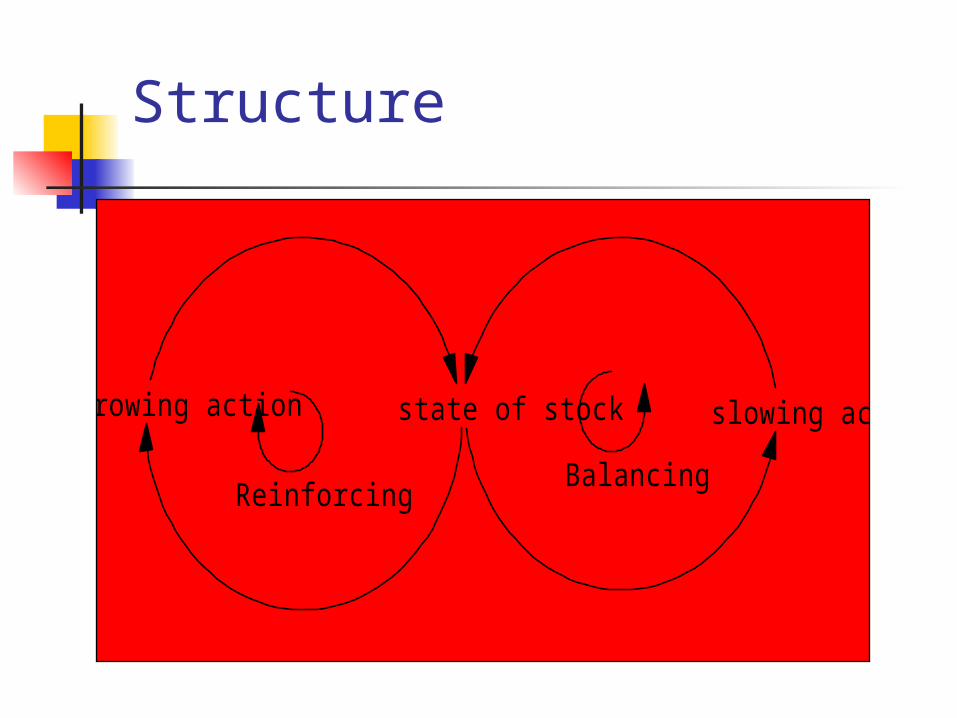
Structure
state of stockgrowing action slowing action
BalancingReinforcing
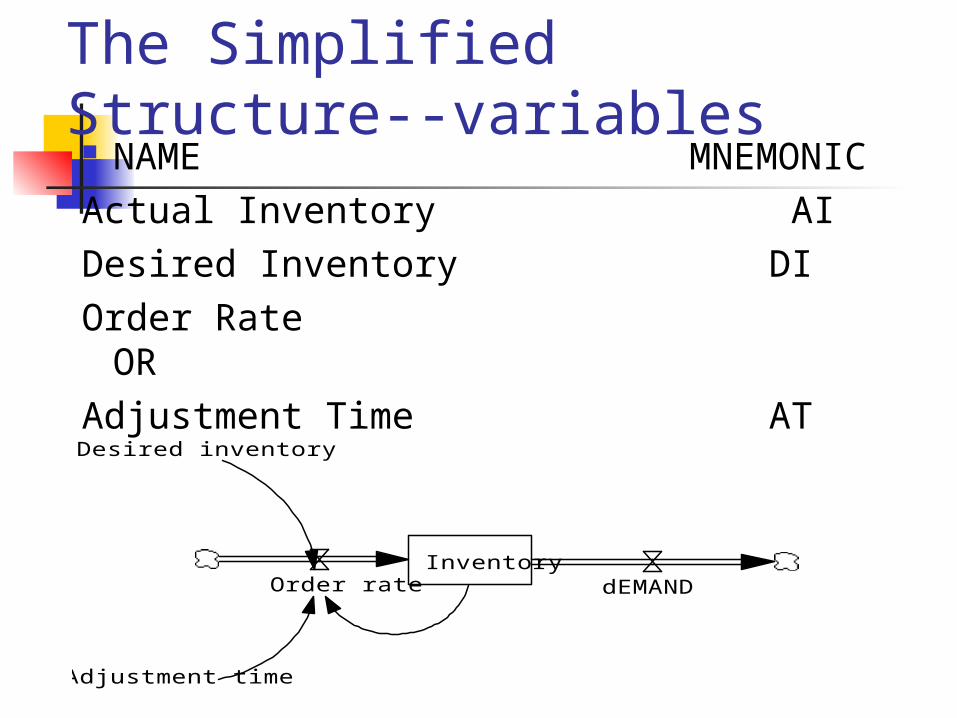
The Simplified Structure--variables NAME MNEMONICActual Inventory AIDesired Inventory DIOrder Rate ORAdjustment Time AT
Inventory
Desired inventory
Adjustment time
Order rate dEMAND
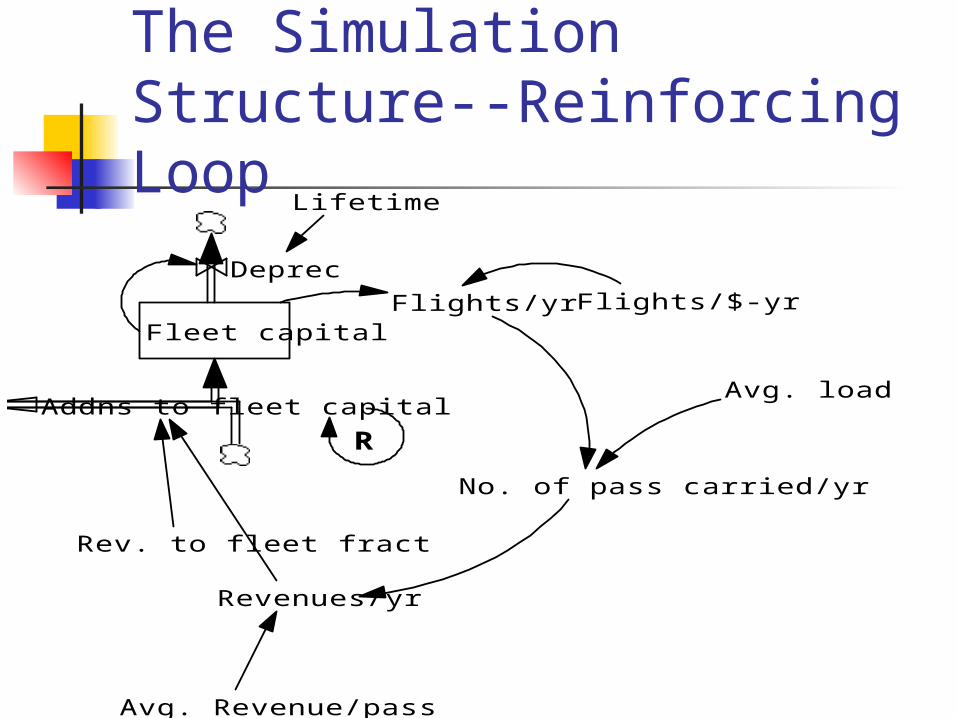
The Simulation Structure--Reinforcing Loop
No. of pass carried/yr
Revenues/yr
Avg. Revenue/pass
Fleet capital
Addns to fleet capital
Rev. to fleet fract
Flights/yr Flights/$-yr
Deprec
Lifetime
Avg. load factor
R
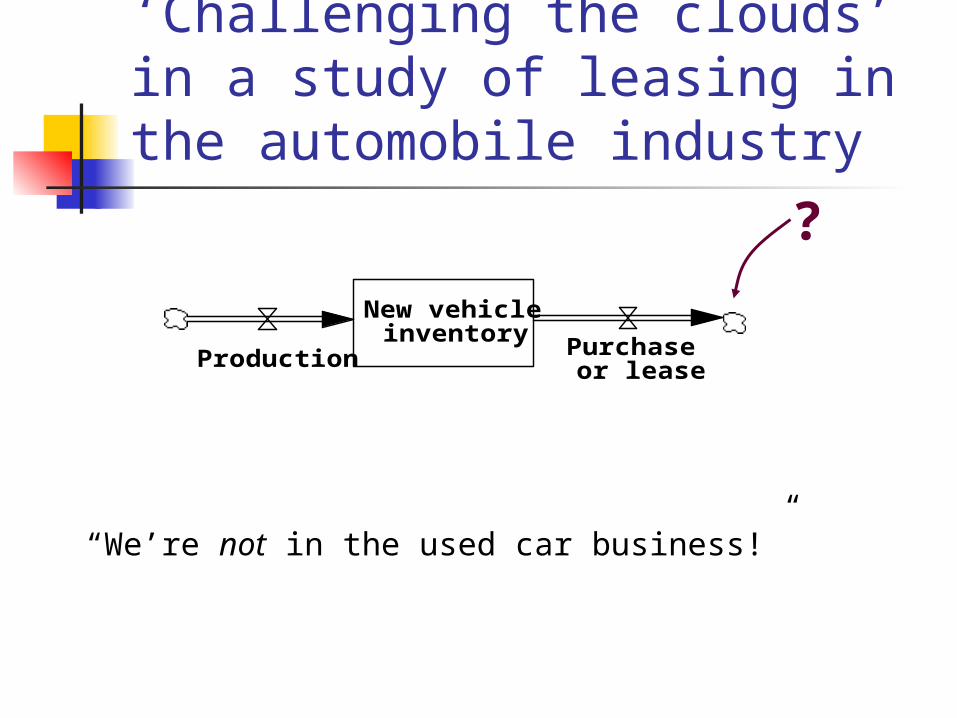
‘Challenging the clouds’ in a study of leasing in the automobile industry
“We’re not in the used car business!”
New vehicleinventory
Production Purchaseor lease
?
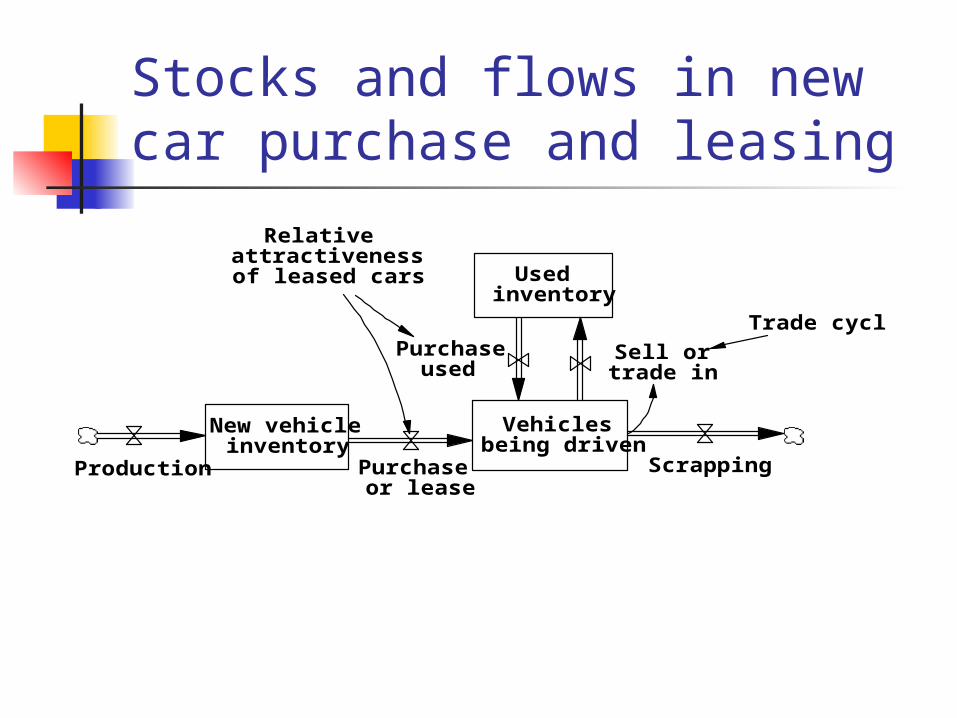
Stocks and flows in new car purchase and leasing
New vehicleinventory
Production
Vehiclesbeing driven
Purchaseor lease
Scrapping
Usedinventory
Sell ortrade in
Purchaseused
Relativeattractivenessof leased cars
Trade cycle
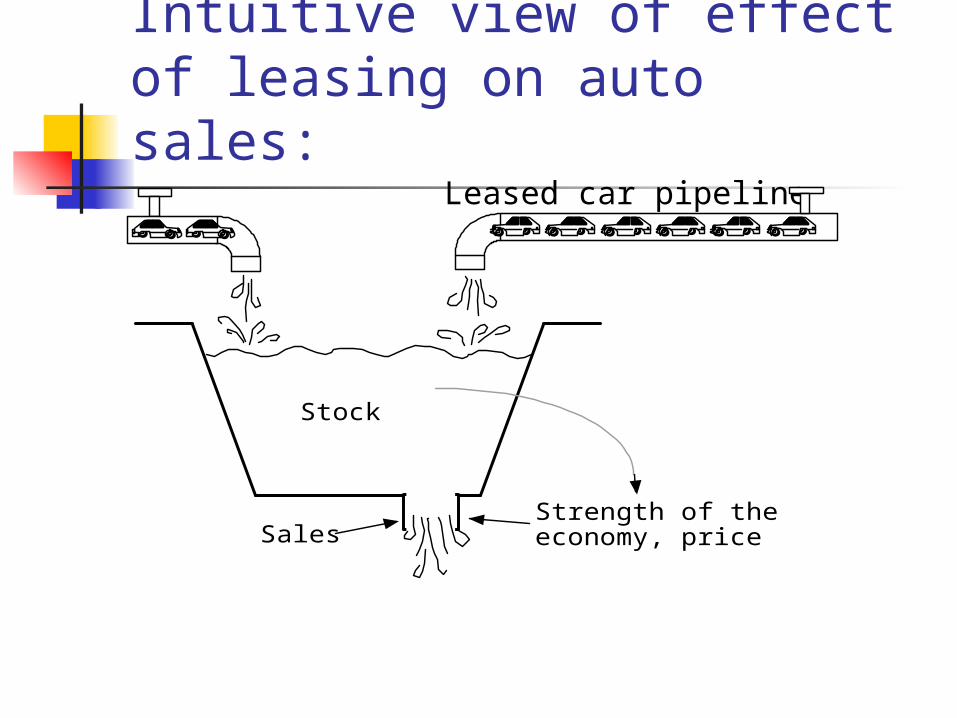
Intuitive view of effect of leasing on auto sales:
Leased car pipeline
Stock
SalesStrength of the economy, price
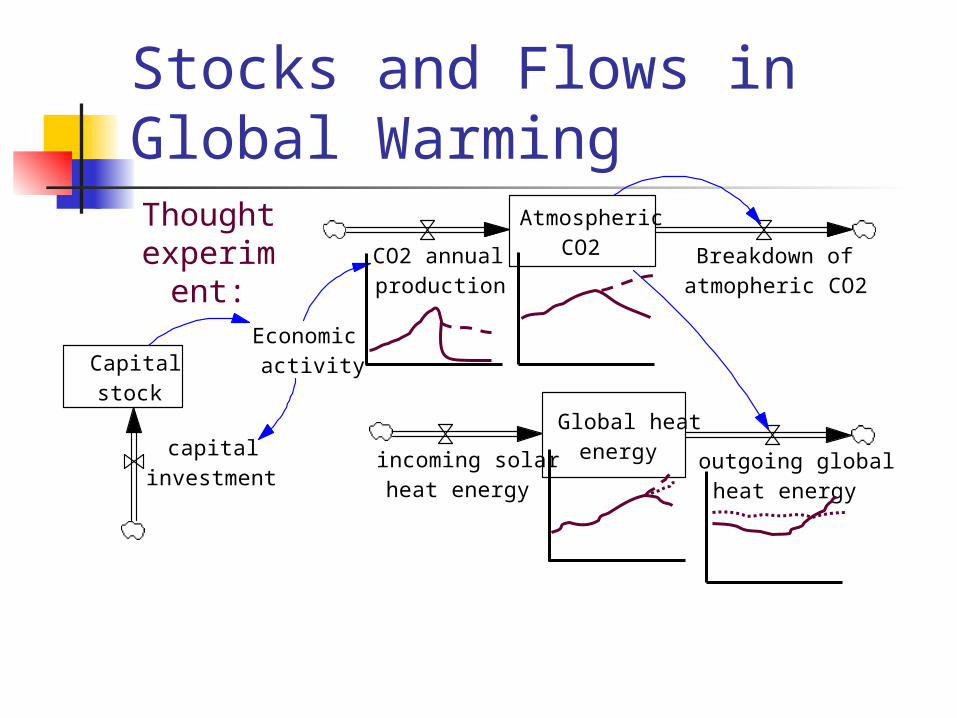
Stocks and Flows in Global Warming
Capitalstock
capitalinvestment
AtmosphericCO2CO2 annual
productionBreakdown of
atmopheric CO2
Economicactivity
Global heatenergyincoming solar
heat energyoutgoing global
heat energy
Thought experiment:
Earth Ocean and Atm heat
Earth ice
Net thawing
Earth heat radiation
Earth water Water vapor in atm
Condensation
Water in clouds
Cloud cover~
GH gas reten efct
Evaporation
Precipitation
~
Cloud reten efct
Solar heat incoming
Atm temp
Surface temp
Solar heat reaching earth
~
CO2 reten efct
Atm volumeWater vap conc
Ice cover
Aerosols in atm
Atm volume
Aerosol production
GH gases in atm
Aerosol breakdown GH gas production GH gas breakdown
Aerosol concentration
~
Aerosol albedo efct
Life of GH gases in atm
Water density
Total albedo
GH gas concentrationAtm volume
CO2 in oceans
Life of aerosols in atm
Carbon in ocean biomass
Ocean photosynthesis
Ocean biomass decay
Ocean CO2 breakdown
CO2 in atm
CO2 ocean release
CO2 ocean uptake
Carbon in earth biomassAtm CO2 breakdown
Atm CO2 production
Atm volume
CO2 atm conc
Ocean CO2 production
Earth water volume
Earth photosynthesis
Earth biomass decay
Ice thickness
Ice density
Earth area
CO2 water conc
Cloud volume
Ice volume
Ice areaCloud area
Earth area
Cloud density
Cloud thicknessWater vap reten efct
Evap factor
~
Net thawing factor
~
Ice and cloud cover
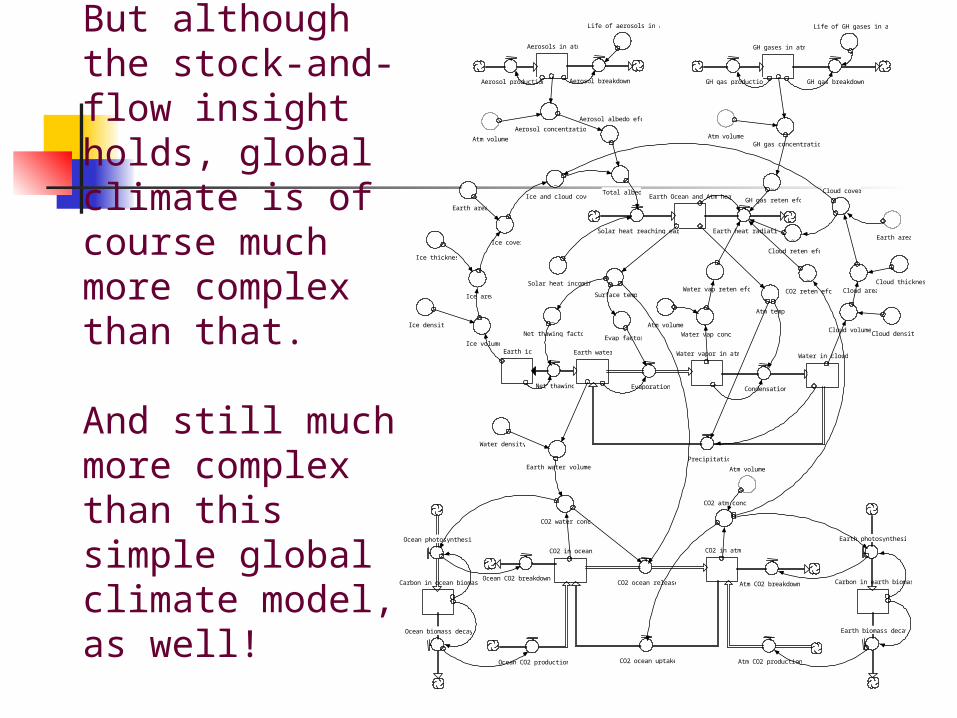
But although the stock-and-flow insight holds, global climate is of course much more complex than that.
And still much more complex than this simple global climate model, as well!
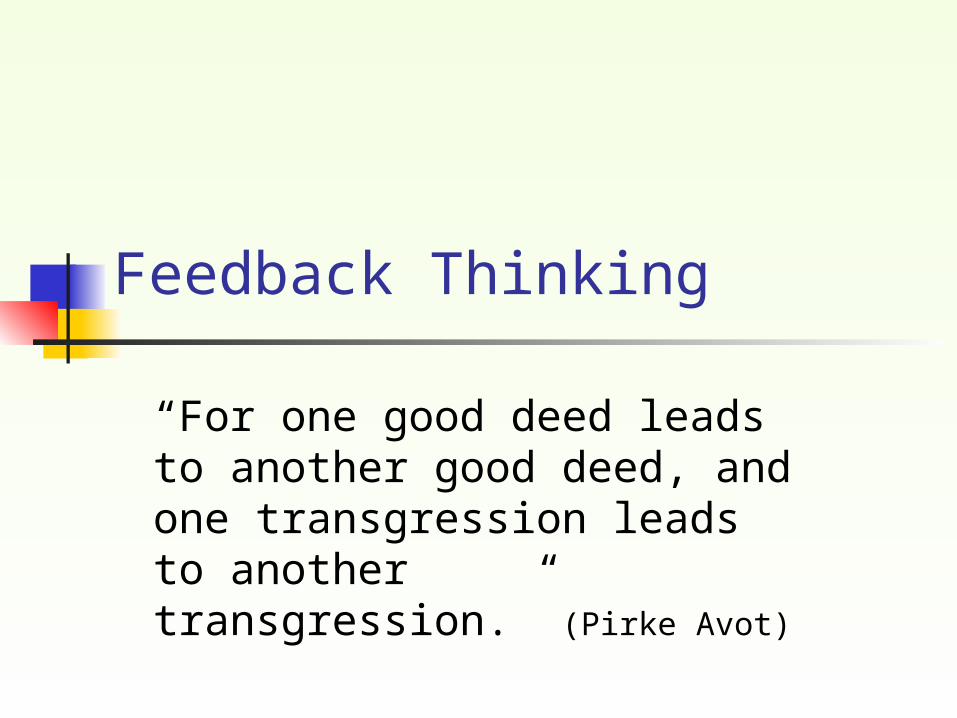
Feedback Thinking
“For one good deed leads to another good deed, and one transgression leads to another transgression.” (Pirke Avot)
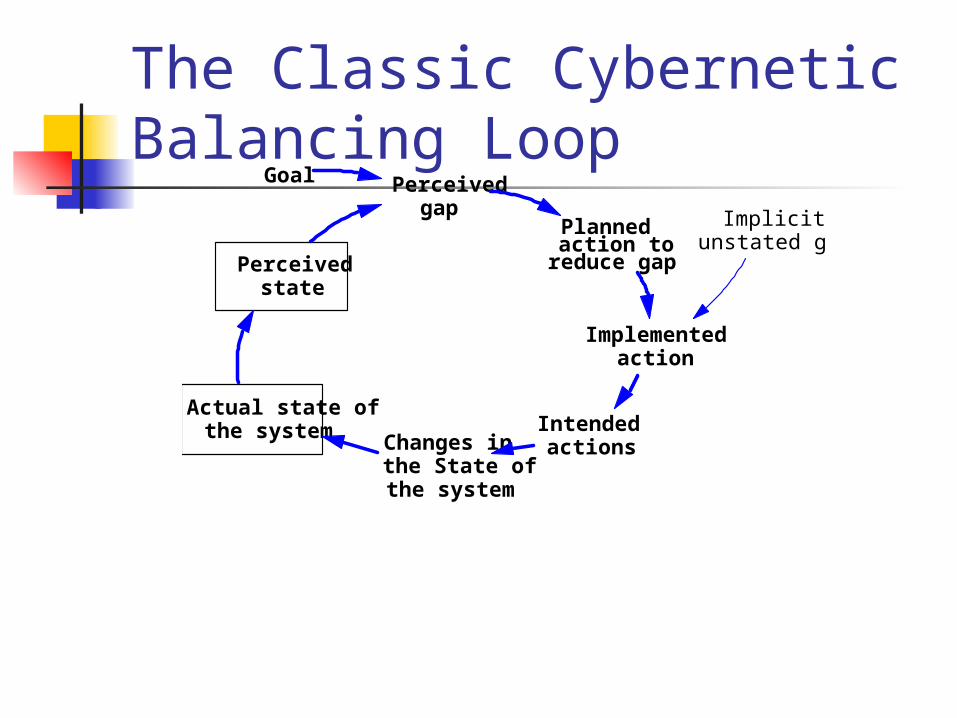
The Classic Cybernetic Balancing Loop
Goal Perceivedgap
Plannedaction to
reduce gap
Implementedaction
Intendedactions
Actual state ofthe system
Perceivedstate
Implicit,unstated goals
Changes inthe State ofthe system
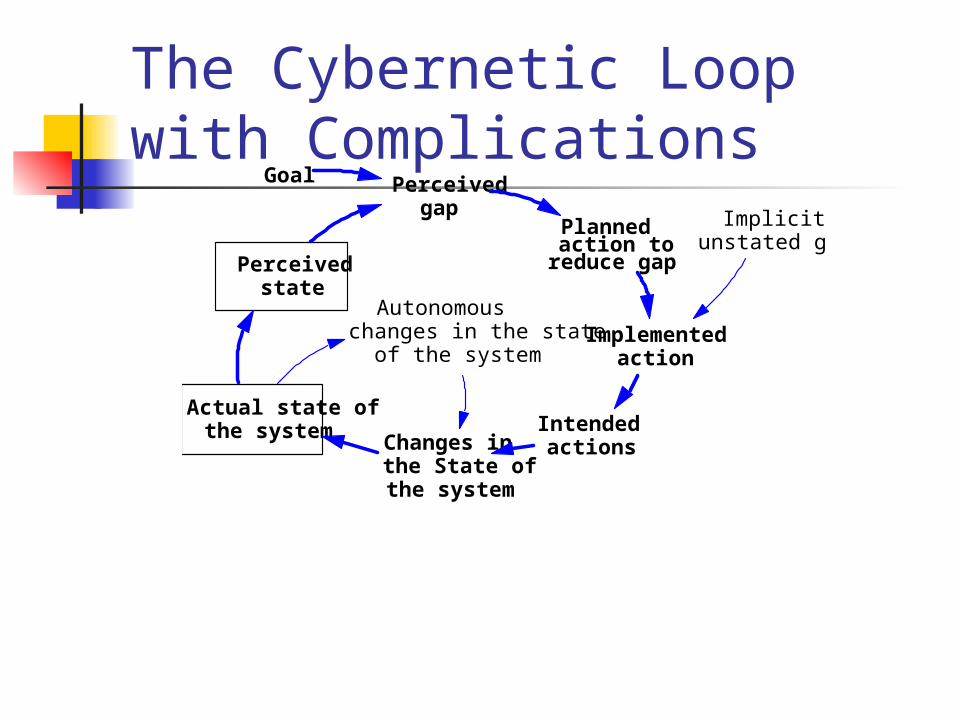
The Cybernetic Loop with Complications
Goal Perceivedgap
Plannedaction to
reduce gap
Implementedaction
Intendedactions
Actual state ofthe system
Perceivedstate
Autonomouschanges in the state
of the system
Implicit,unstated goals
Changes inthe State ofthe system
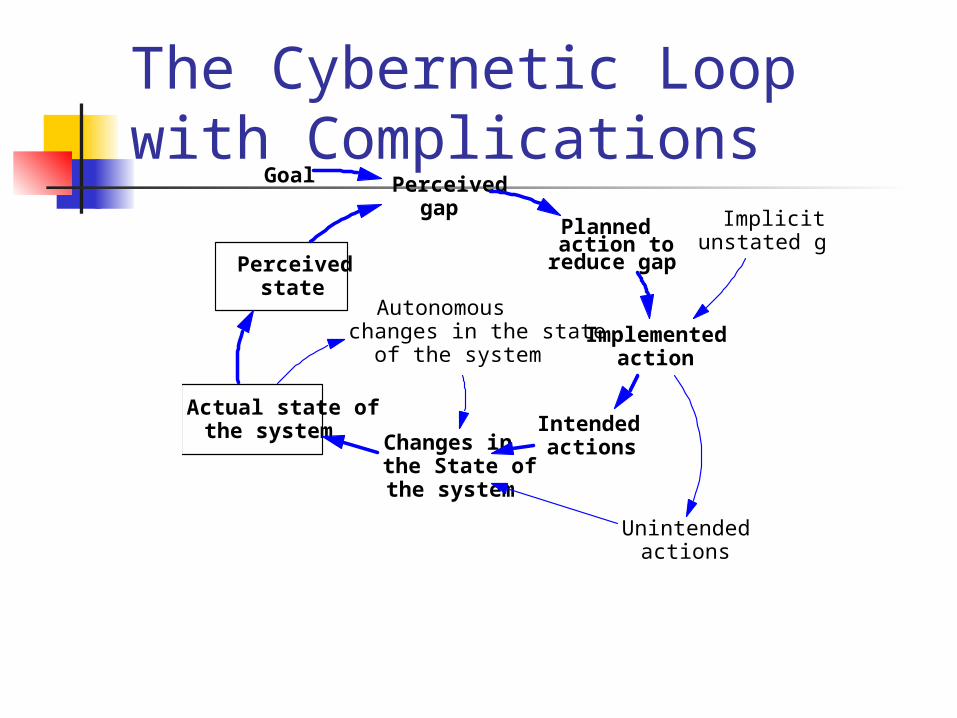
The Cybernetic Loop with Complications
Goal Perceivedgap
Plannedaction to
reduce gap
Implementedaction
Intendedactions
Actual state ofthe system
Perceivedstate
Unintendedactions
Autonomouschanges in the state
of the system
Implicit,unstated goals
Changes inthe State ofthe system
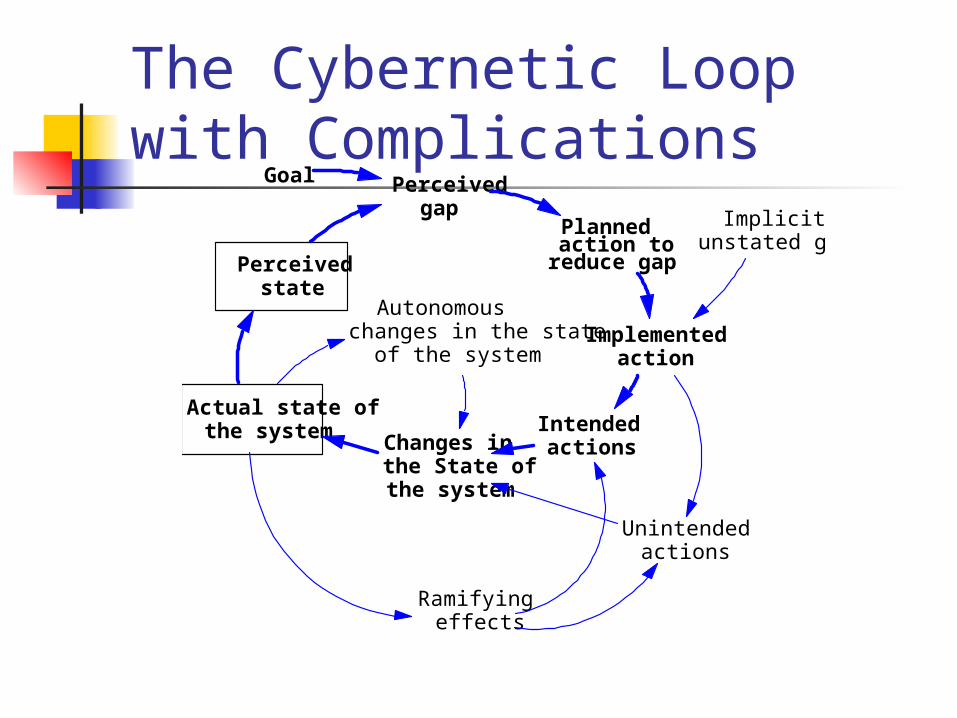
The Cybernetic Loop with Complications
Goal Perceivedgap
Plannedaction to
reduce gap
Implementedaction
Intendedactions
Actual state ofthe system
Perceivedstate
Unintendedactions
Autonomouschanges in the state
of the system
Ramifyingeffects
Implicit,unstated goals
Changes inthe State ofthe system
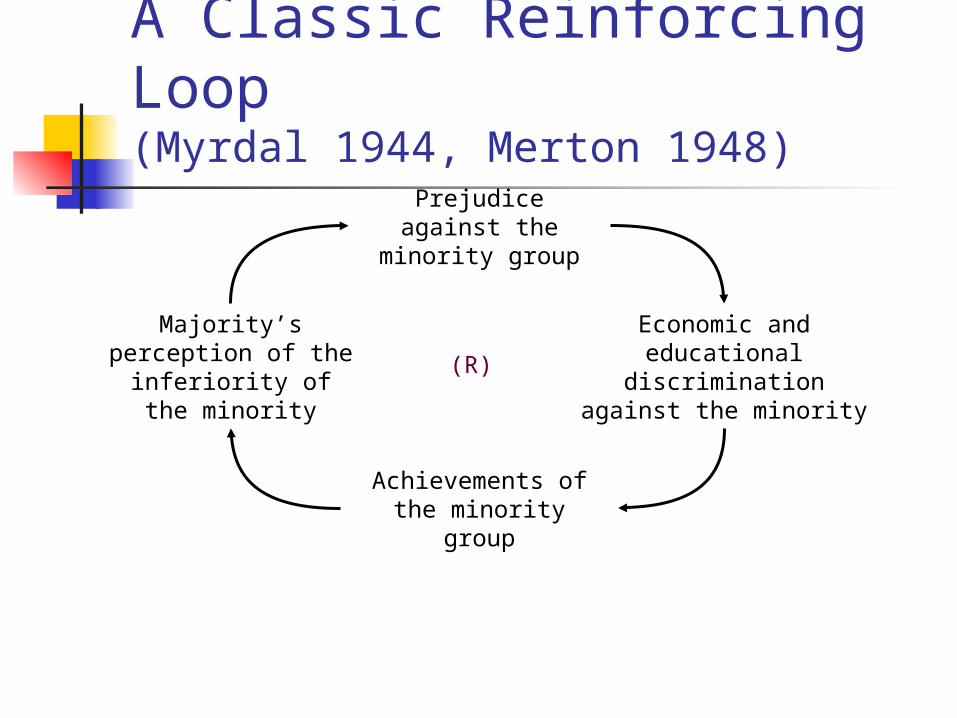
A Classic Reinforcing Loop(Myrdal 1944, Merton 1948)
Prejudice against the minority group
Majority’s perception of the inferiority of the
minority
Economic and educational
discrimination against the minority
Achievements of the minority group
(R)
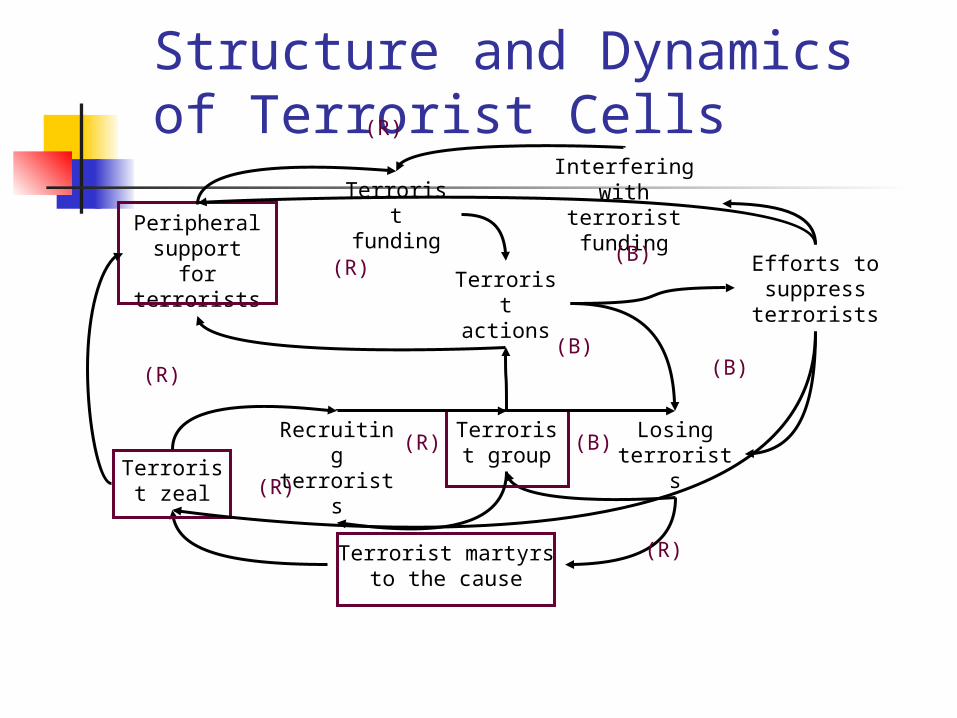
Structure and Dynamics of Terrorist Cells
Recruiting terrorists
Terrorist group
Losing terrorists
Terrorist actions
Efforts to suppress terrorists
Terrorist zeal
Peripheral support for terrorists
Terrorist funding
Terrorist martyrs to the cause
(R)
(B)(R)
(R)
(R)
(B)
(R)
(R)
Interfering with terrorist funding
(B)
(B)
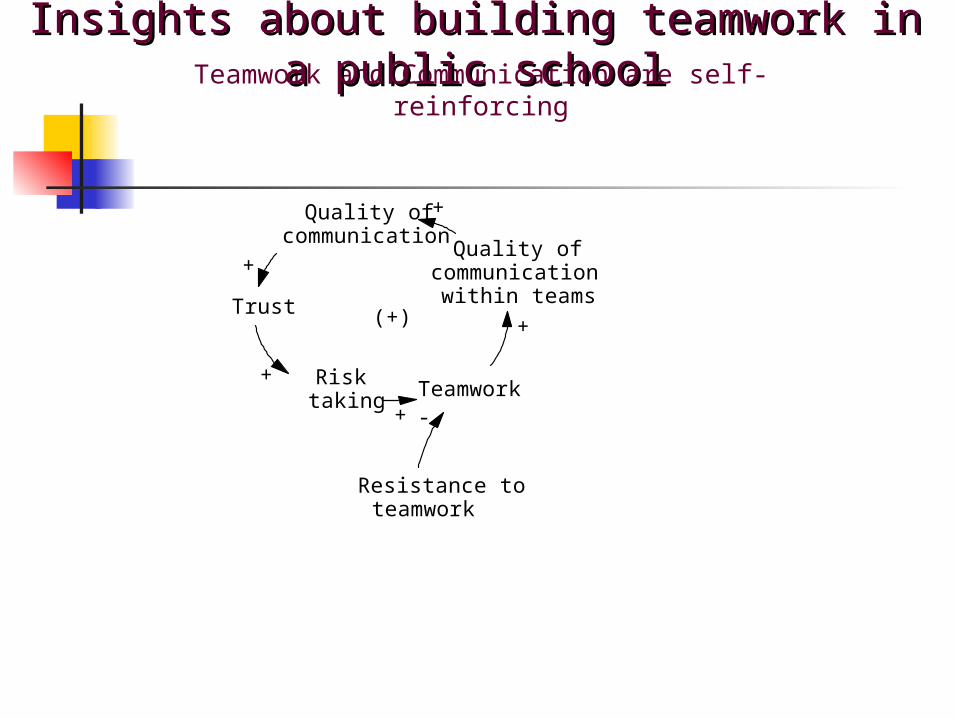
Teamwork and Communication are self-reinforcing
Insights about building teamwork in a public schoolInsights about building teamwork in a public school
Quality ofcommunication
Trust
Risktaking
Teamwork
+
+
+
(+)
Quality ofcommunication
within teams
+
+
Resistance toteamwork
-
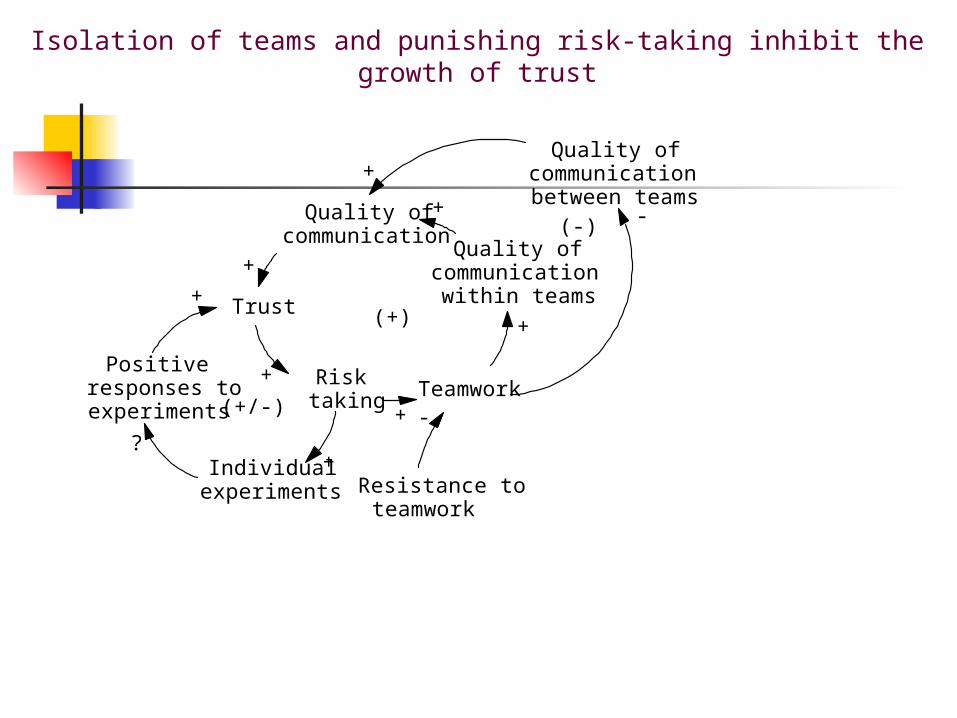
Isolation of teams and punishing risk-taking inhibit the growth of trust
Quality ofcommunication
Trust
Risktaking
Teamwork
+
+
+
Quality ofcommunicationbetween teams
+
(+)
Individualexperiments
Positiveresponses toexperiments
+?
+
(+/-)
Quality ofcommunication
within teams
+
+ -(-)
Resistance toteamwork
-
But longterm experience with teamwork can build communication
Quality ofcommunication
Trust
Risktaking
Teamwork
+
+
+
Cumulativeexperience with
teamwork
+
Quality ofcommunicationbetween teams
++
(+)
Individualexperiments
Positiveresponses toexperiments
+?
+
(+/-)
Quality ofcommunication
within teams
+
+ -
+
(-)
(+)
Teameffectiveness
Resistance toteamwork
-
-
+ +
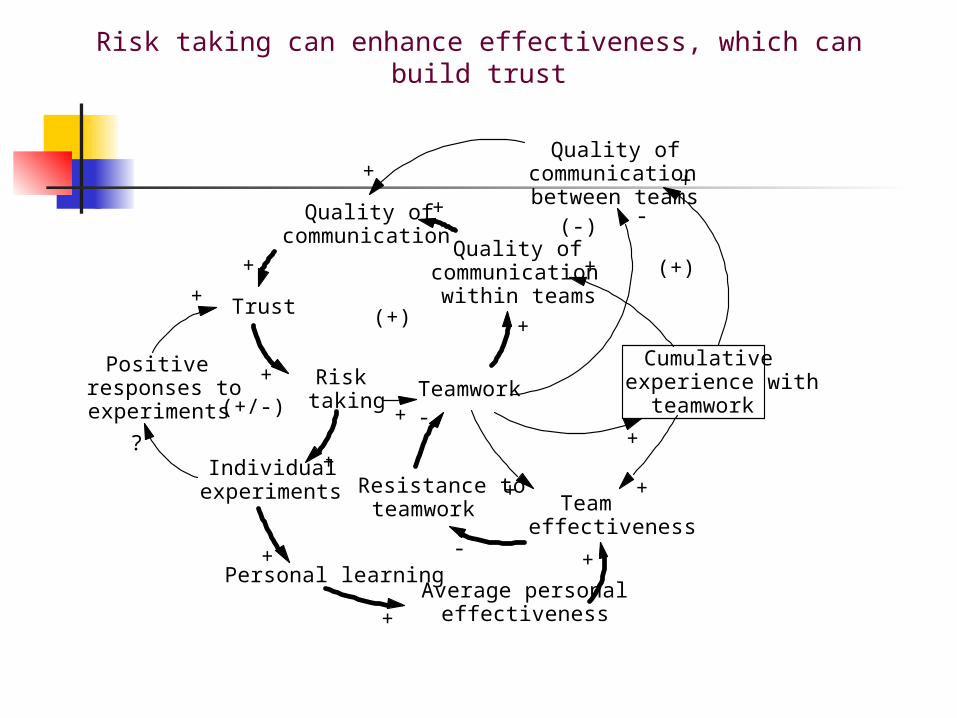
Risk taking can enhance effectiveness, which can build trust
Quality ofcommunication
Trust
Risktaking
Teamwork
+
+
+
Cumulativeexperience with
teamwork
+
Quality ofcommunicationbetween teams
++
(+)
Individualexperiments
Positiveresponses toexperiments
+?
+
(+/-)
Quality ofcommunication
within teams
+
+ -
+
(-)
(+)
Teameffectiveness
Resistance toteamwork
-
-
+
Personal learning+
Average personaleffectiveness+
+
+
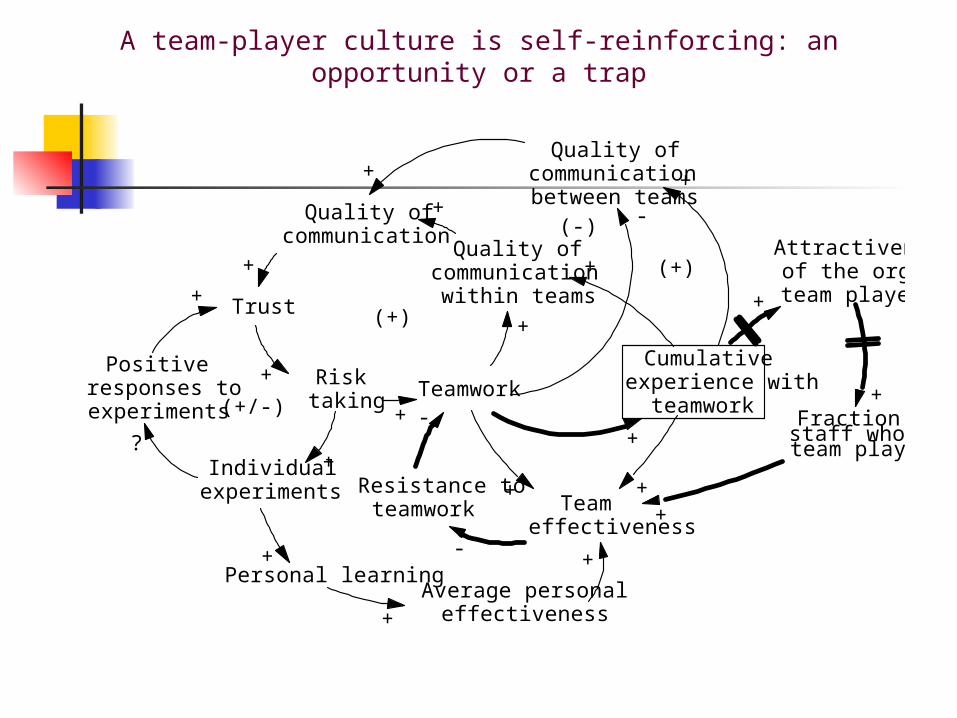
A team-player culture is self-reinforcing: an opportunity or a trap
Quality ofcommunication
Trust
Risktaking
Teamwork
+
+
+
Cumulativeexperience with
teamwork
+
Quality ofcommunicationbetween teams
++
(+)
Individualexperiments
Positiveresponses toexperiments
+?
+
(+/-)
Quality ofcommunication
within teams
+
+ -
+
(-)
(+)
Teameffectiveness
Resistance toteamwork
-
-
+
Personal learning+
Average personaleffectiveness+
+
+
Attractivenessof the org toteam players+
Fraction ofstaff who areteam players
+
+
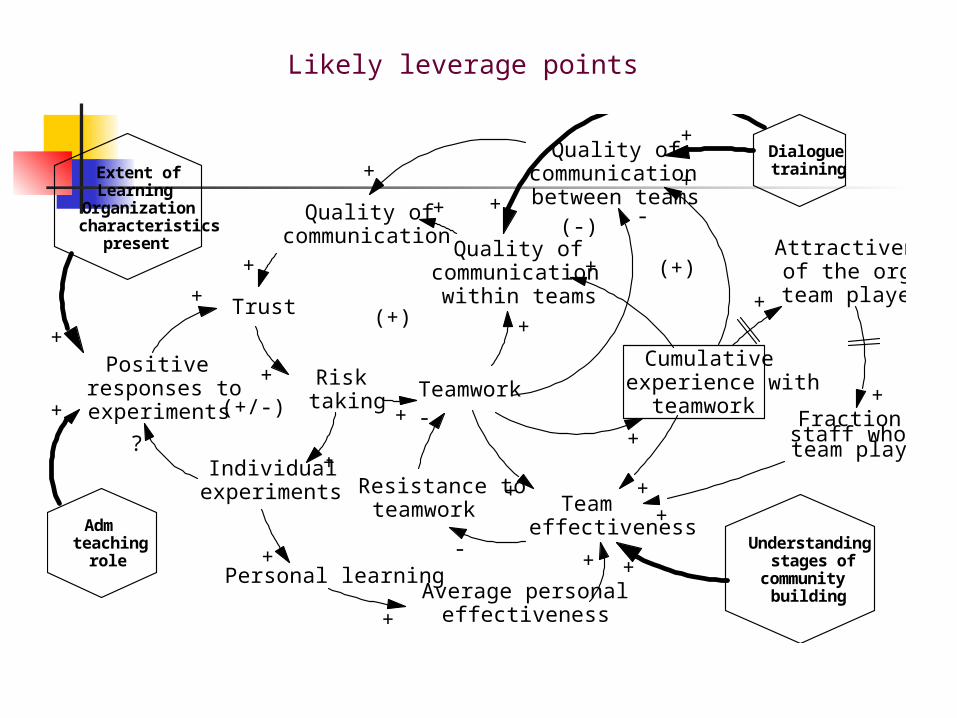
Likely leverage points
Quality ofcommunication
Trust
Risktaking
Teamwork
+
+
+
Cumulativeexperience with
teamwork
+
Quality ofcommunicationbetween teams
++
(+)
Individualexperiments
Positiveresponses toexperiments
+?
+
(+/-)
Quality ofcommunicationwithin teams
+
+ -
+
(-)
(+)
Teameffectiveness
Resistance toteamwork
-
-
+
Extent ofLearning
Organizationcharacteristics
present
Admteaching
role
+
+
Personal learning+
Average personaleffectiveness+
+Understanding
stages ofcommunity
building
+
+
Attractivenessof the org toteam players+
Fraction ofstaff who areteam players
+
+
Dialoguetraining
+
+
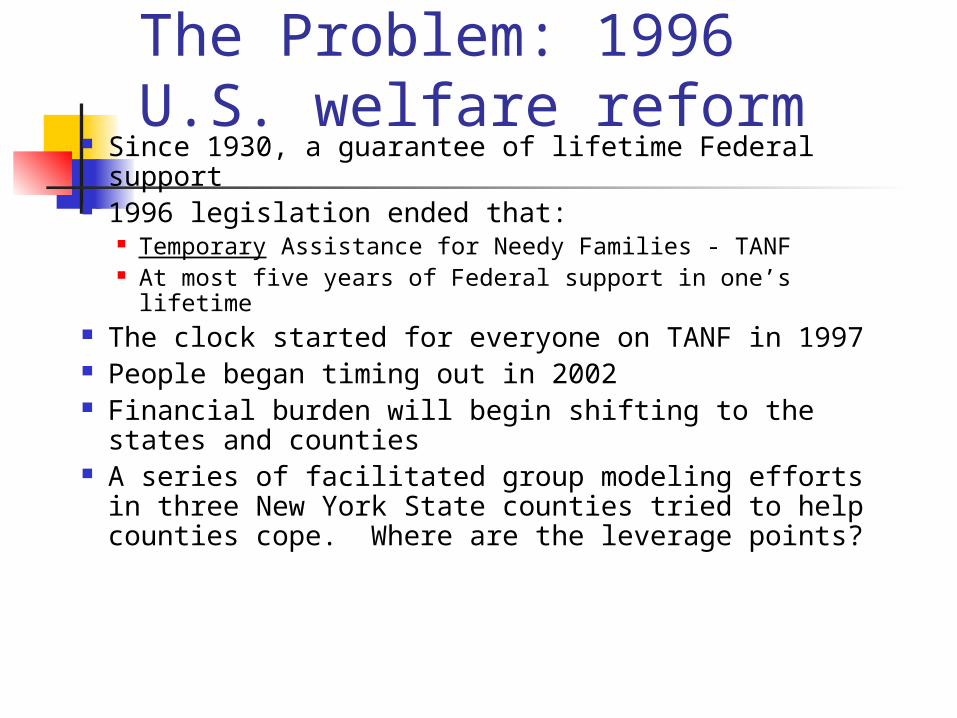
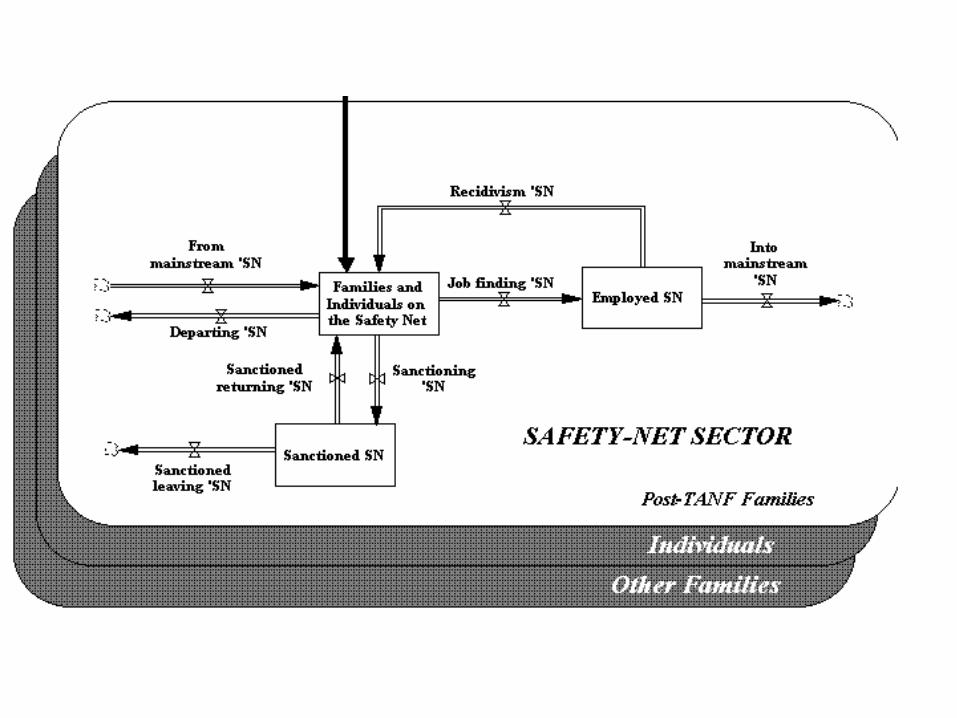
The Problem: 1996 U.S. welfare reform
Since 1930, a guarantee of lifetime Federal support
1996 legislation ended that: Temporary Assistance for Needy Families - TANF At most five years of Federal support in one’s lifetime
The clock started for everyone on TANF in 1997 People began timing out in 2002 Financial burden will begin shifting to the states
and counties A series of facilitated group modeling efforts in
three New York State counties tried to help counties cope. Where are the leverage points?

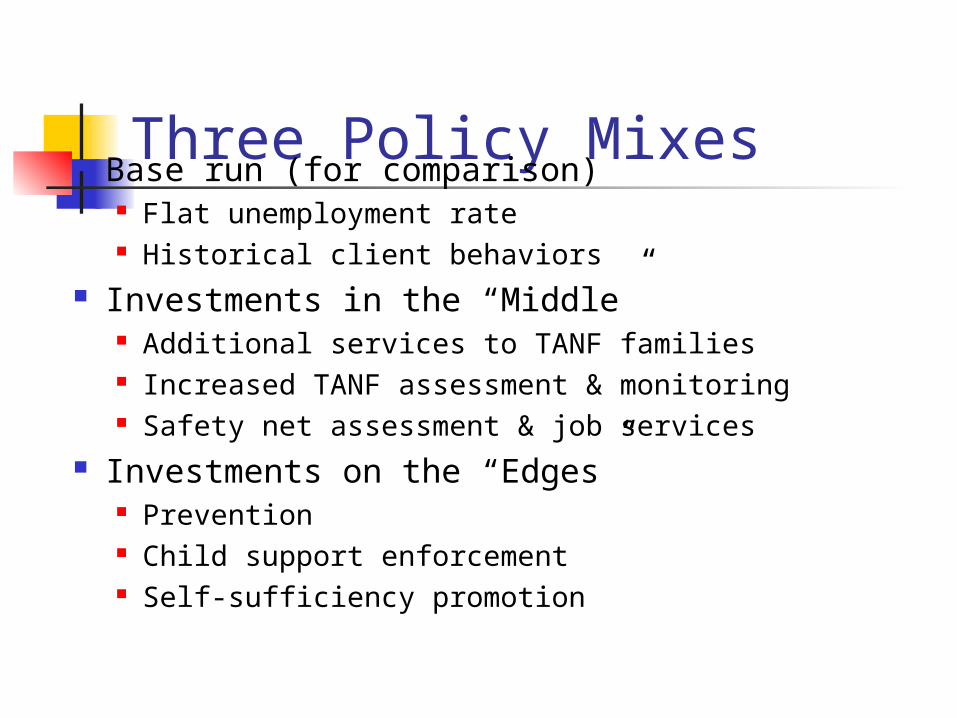
Three Policy Mixes Base run (for comparison)
Flat unemployment rate Historical client behaviors
Investments in the “Middle” Additional services to TANF families Increased TANF assessment & monitoring Safety net assessment & job services
Investments on the “Edges” Prevention Child support enforcement Self-sufficiency promotion
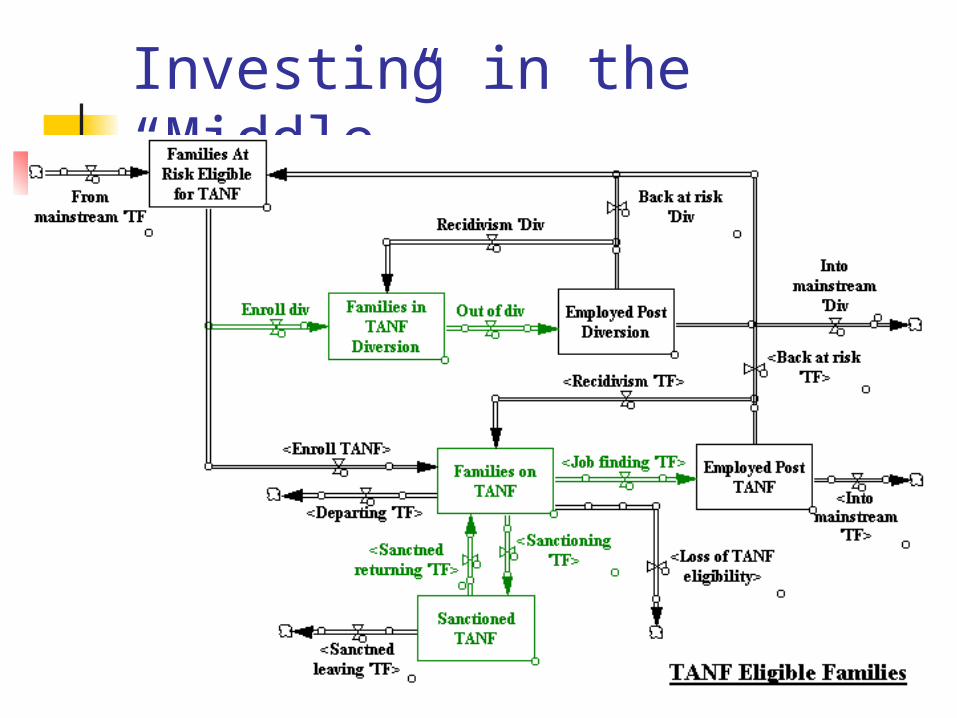
Investing in the “Middle”
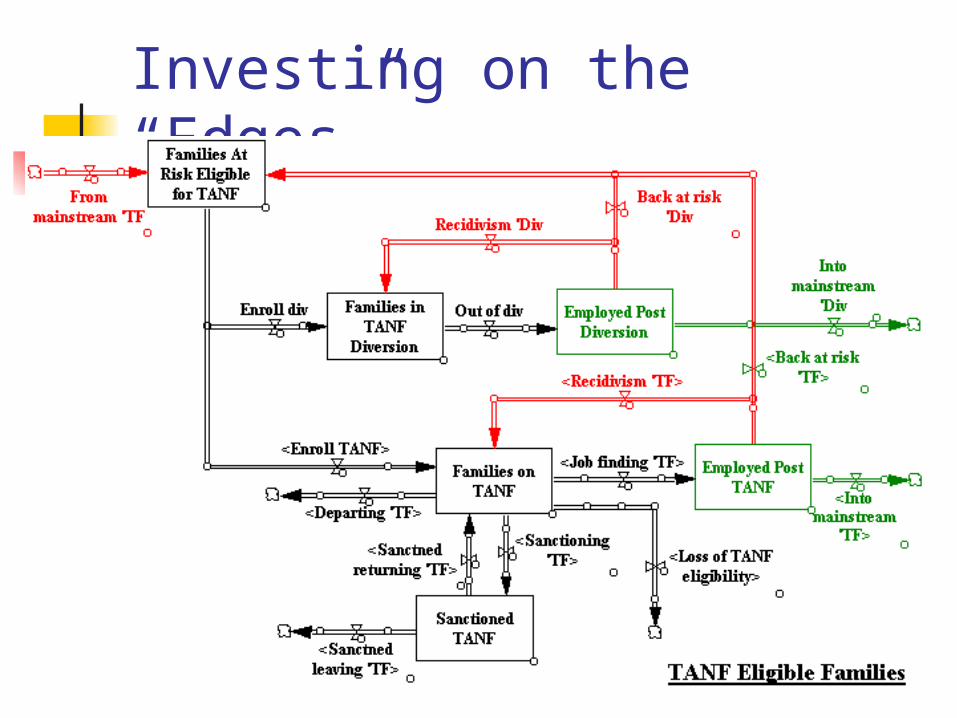
Investing on the “Edges”
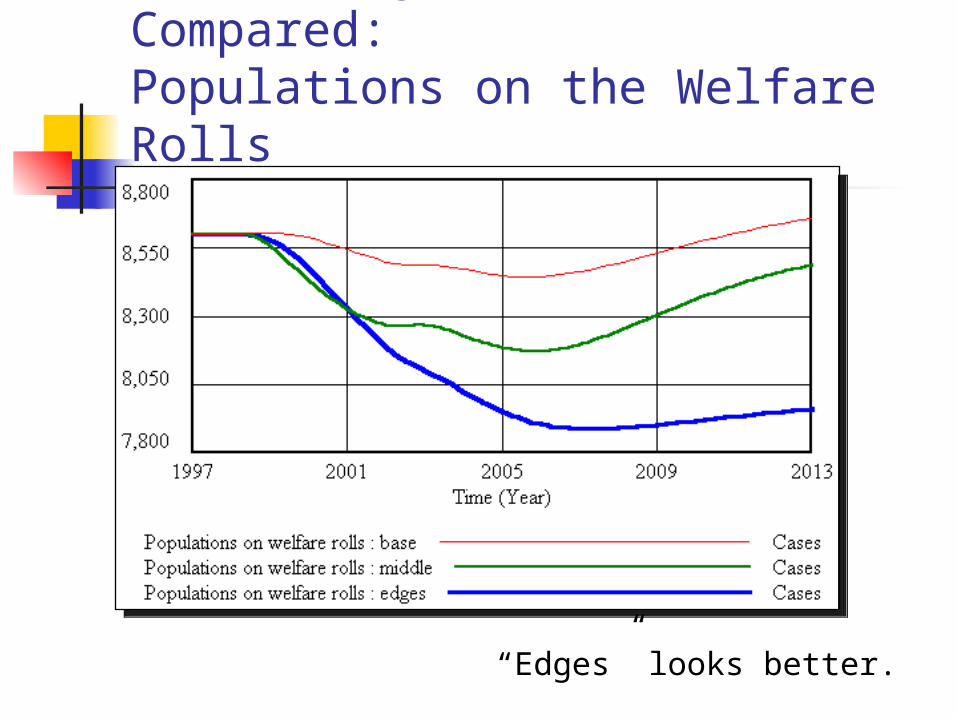
Base, “Edges,” and “Middle” Compared:Populations on the Welfare Rolls
“Edges” looks better.
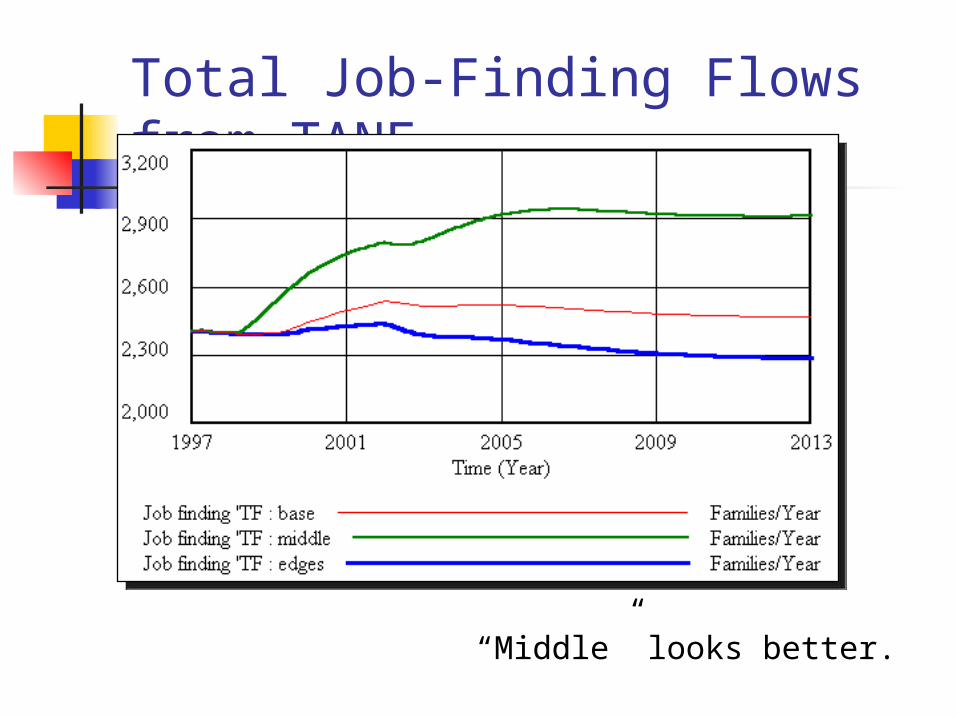
Total Job-Finding Flows from TANF
“Middle” looks better.
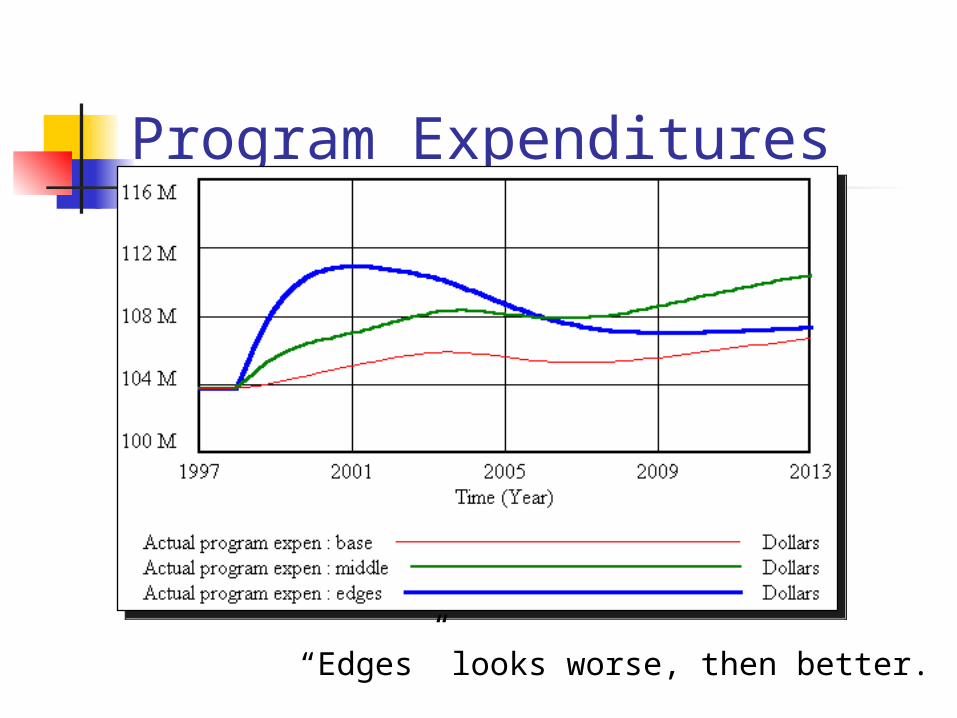
Program Expenditures
“Edges” looks worse, then better.
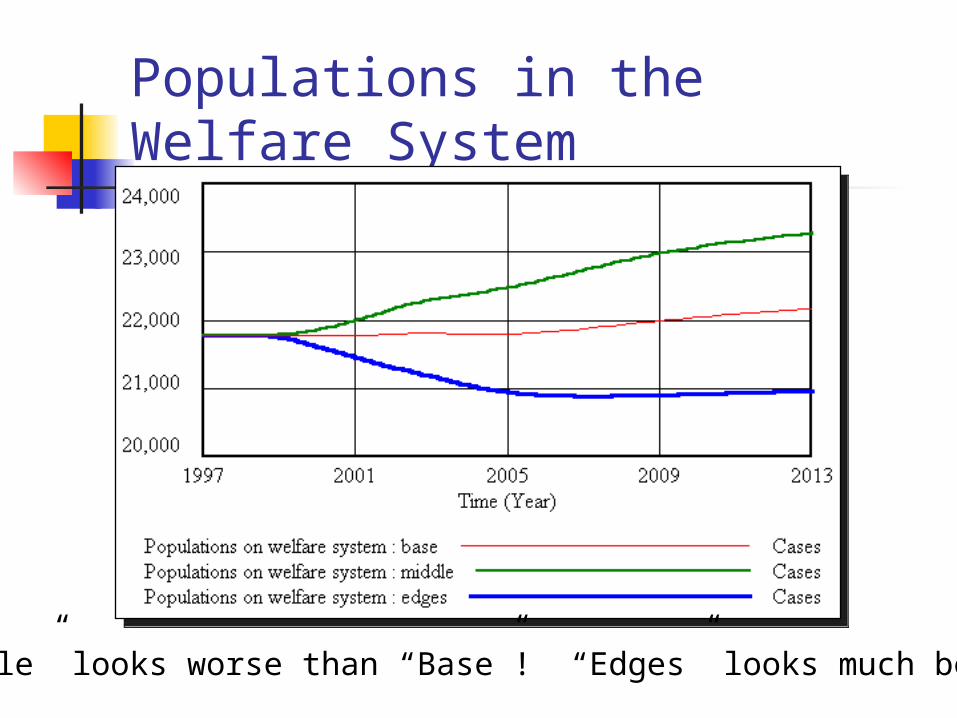
Populations in the Welfare System
“Middle” looks worse than “Base”! “Edges” looks much better.
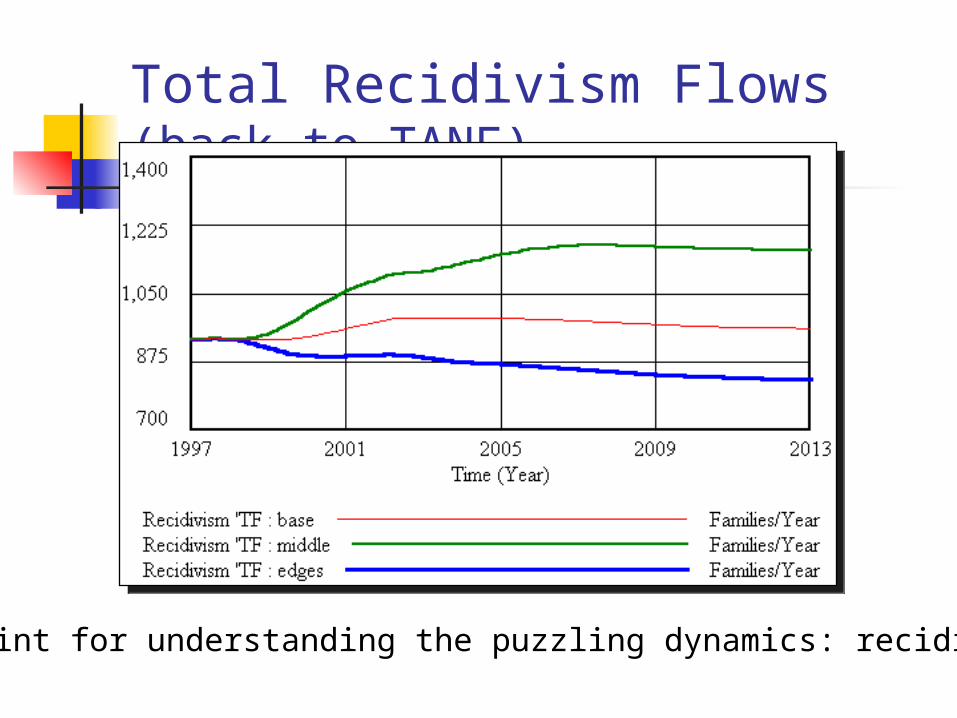
Total Recidivism Flows (back to TANF)
The hint for understanding the puzzling dynamics: recidivism.
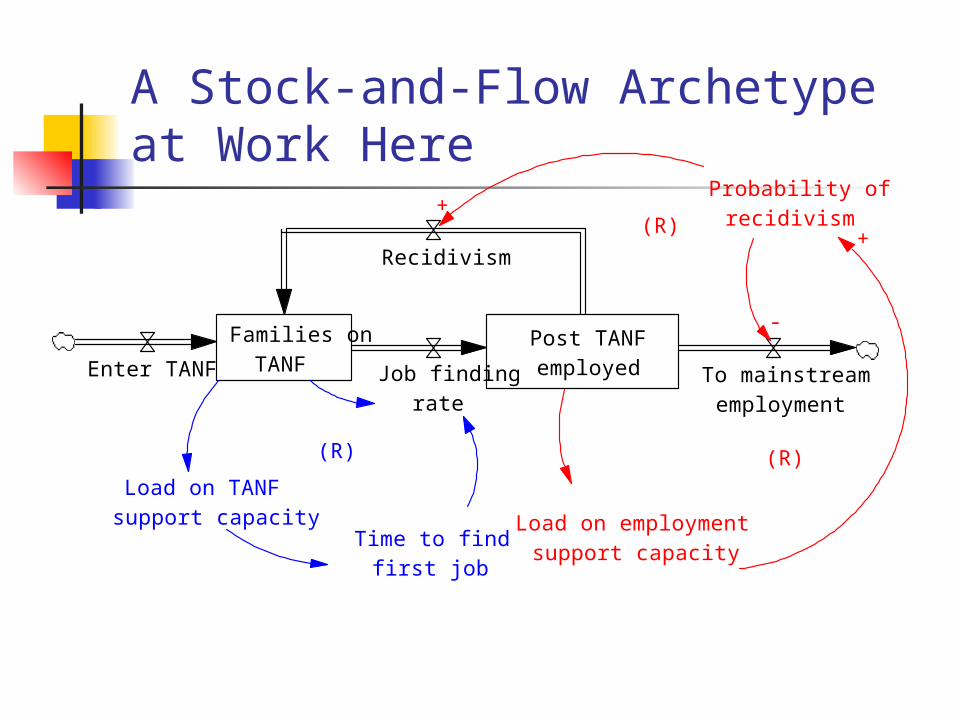
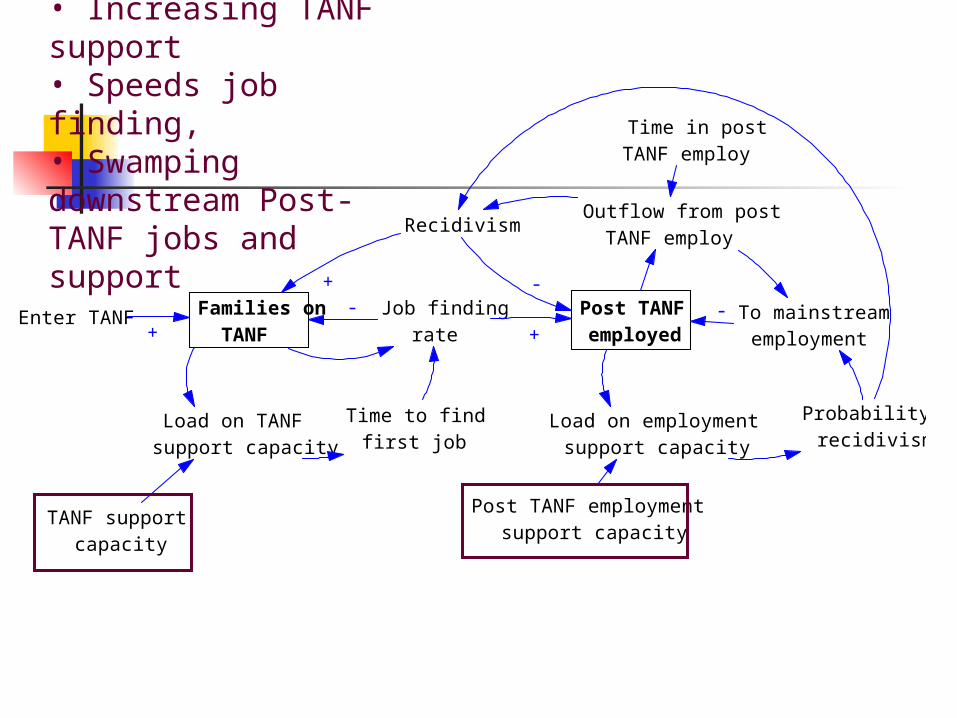
A Stock-and-Flow Archetype at Work Here
Families onTANF
Post TANFemployedJob finding
rate
Recidivism
Load on employmentsupport capacity
Probability ofrecidivism
+
+
Time to findfirst job
Load on TANFsupport capacity
To mainstreamemployment
-
Enter TANF
(R) (R)
(R)
6,000
4,500
3,000
1,500
0
0 6 12 18 24 30 36 42 48 54 60Time (Month)
Families on TANF : archetype base familiesPost TANF employed : archetype base familiesTotal families at risk : archetype base families
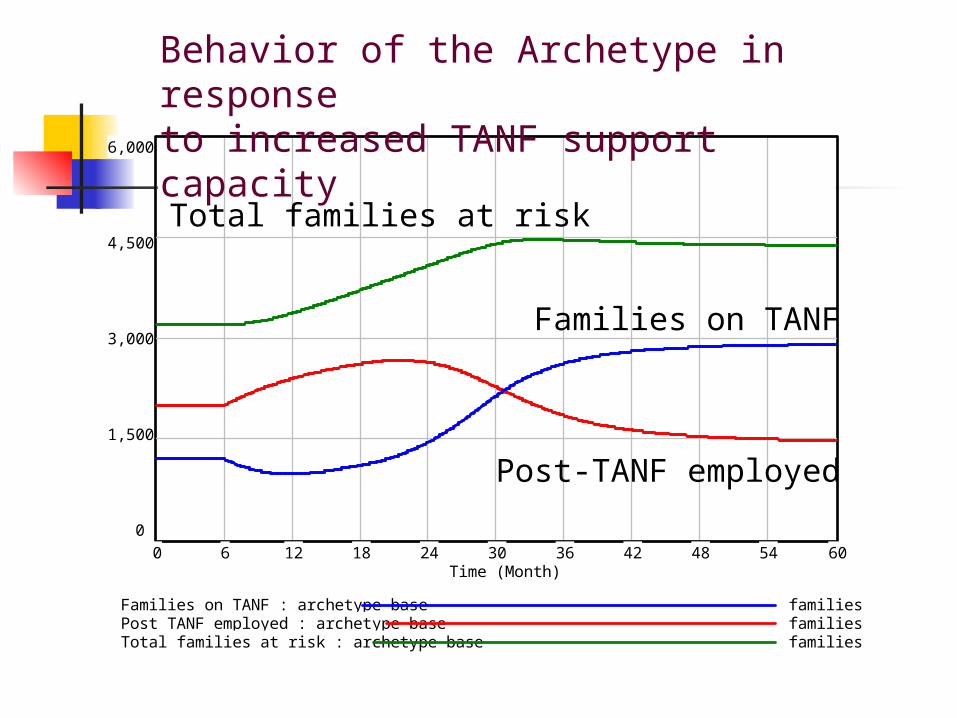
Behavior of the Archetype in response to increased TANF support capacity
Total families at risk
Post-TANF employed
Families on TANF
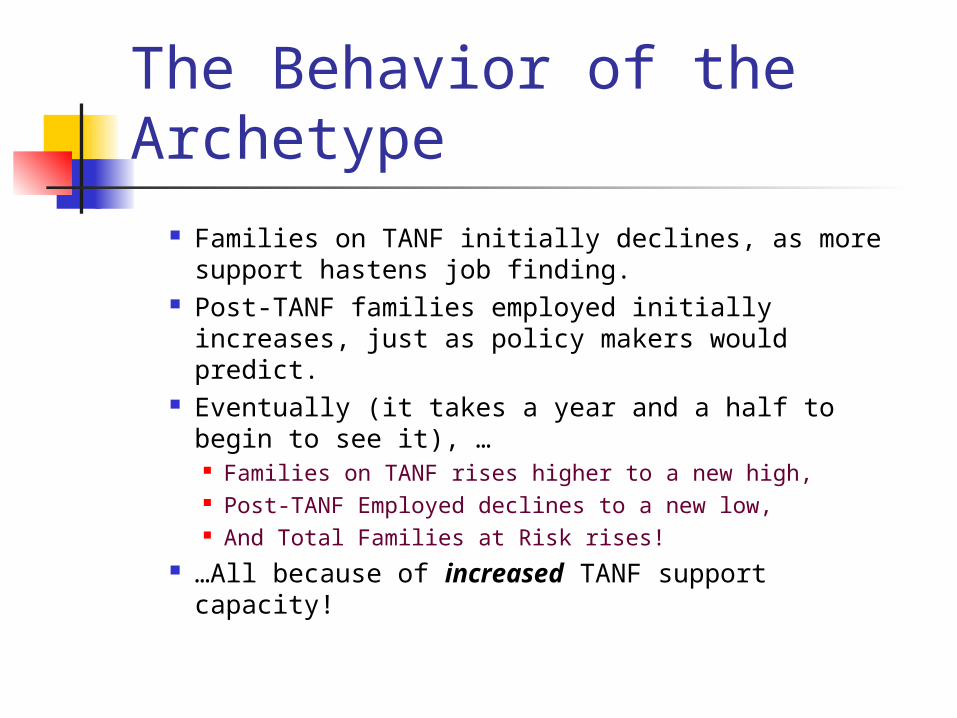
The Behavior of the Archetype
Families on TANF initially declines, as more support hastens job finding.
Post-TANF families employed initially increases, just as policy makers would predict.
Eventually (it takes a year and a half to begin to see it), … Families on TANF rises higher to a new high, Post-TANF Employed declines to a new low, And Total Families at Risk rises!
…All because of increased TANF support capacity!
Enter TANF Families onTANF+
-
Recidivism
+
Outflow from postTANF employ
Post TANFemployed
Time in postTANF employ
Job findingrate +
-
To mainstreamemployment
-
Probability ofrecidivism
Time to findfirst job
Load on TANFsupport capacity
TANF supportcapacity
Load on employmentsupport capacity
Post TANF employmentsupport capacity
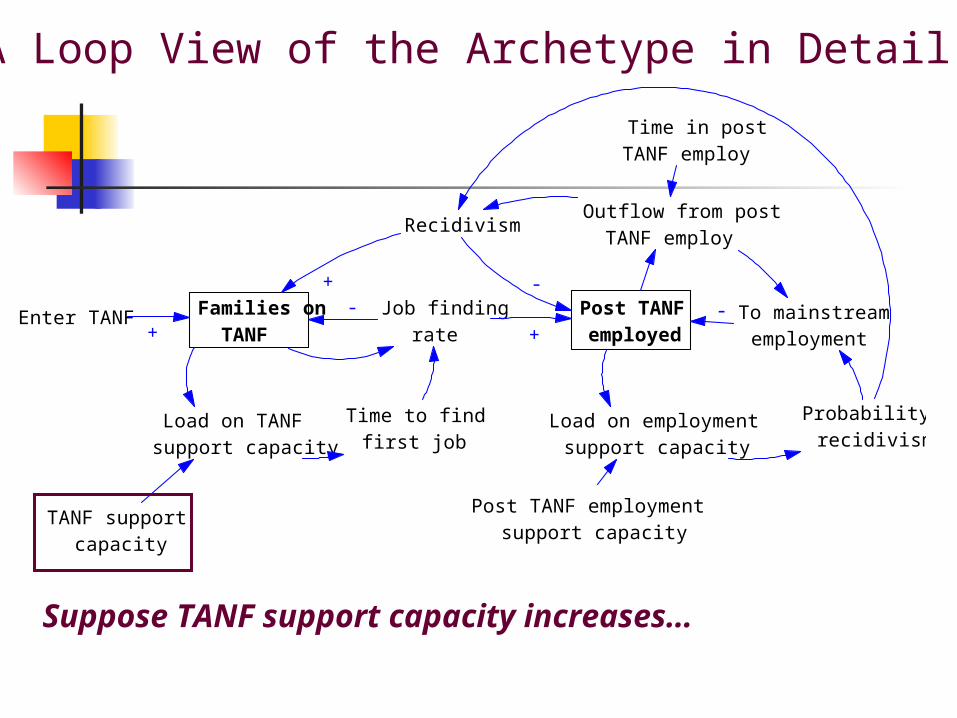
Why? • Increasing TANF support• Speeds job finding, • Swamping downstream Post-TANF jobs and support
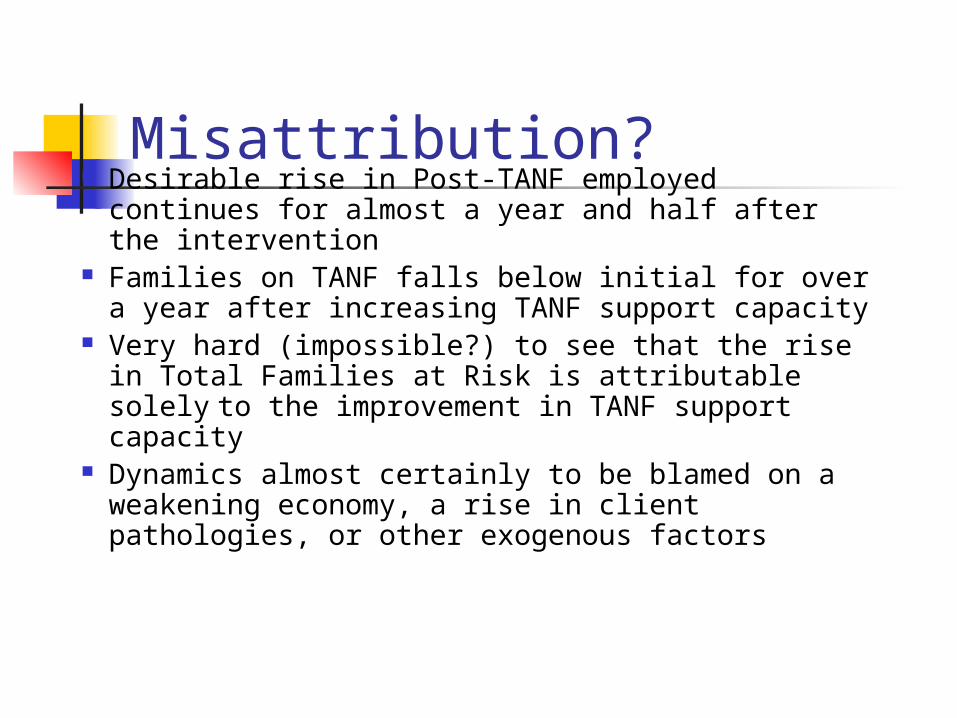
Misattribution? Desirable rise in Post-TANF employed
continues for almost a year and half after the intervention
Families on TANF falls below initial for over a year after increasing TANF support capacity
Very hard (impossible?) to see that the rise in Total Families at Risk is attributable solely to the improvement in TANF support capacity
Dynamics almost certainly to be blamed on a weakening economy, a rise in client pathologies, or other exogenous factors
Enter TANF Families onTANF+
-
Recidivism
+
Outflow from postTANF employ
Post TANFemployed
Time in postTANF employ
Job findingrate +
-
To mainstreamemployment
-
Probability ofrecidivism
Time to findfirst job
Load on TANFsupport capacity
TANF supportcapacity
Load on employmentsupport capacity
Post TANF employmentsupport capacity
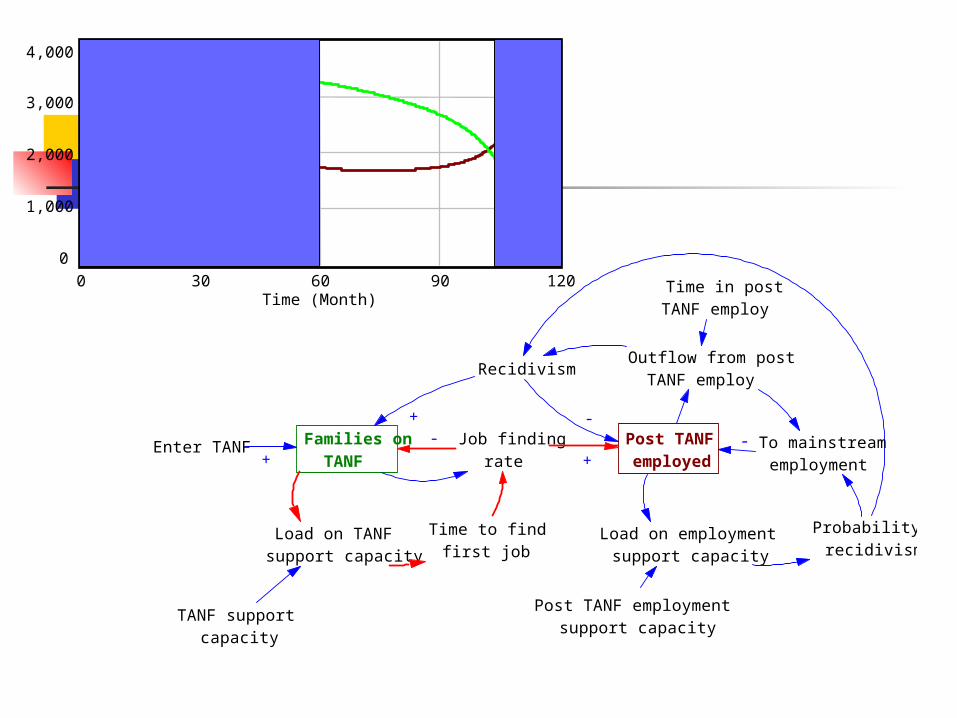
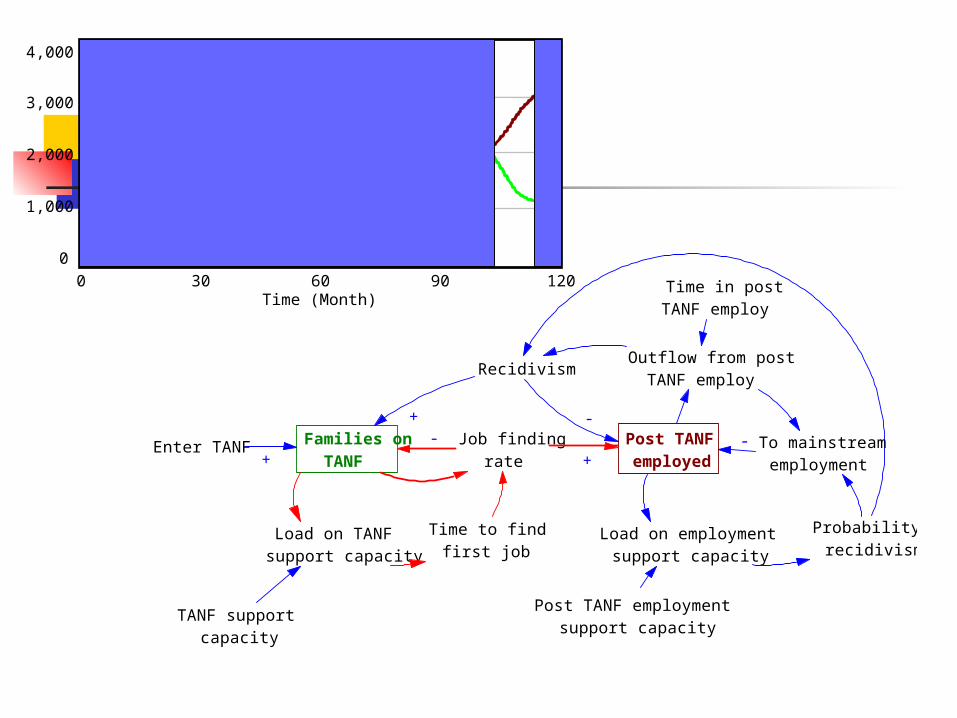
A Loop View of the Archetype in Detail
Suppose TANF support capacity increases…
120
B: Employed load controls recidivism
4,000
3,000
2,000
1,000
0
0 30 60 90Time (Month)
Enter TANF Families onTANF+
-
Recidivism
+
Outflow from postTANF employ
Post TANFemployed
Time in postTANF employ
Job findingrate +
-
To mainstreamemployment
-
Probability ofrecidivism
Time to findfirst job
Load on TANFsupport capacity
TANF supportcapacity
Load on employmentsupport capacity
Post TANF employmentsupport capacity
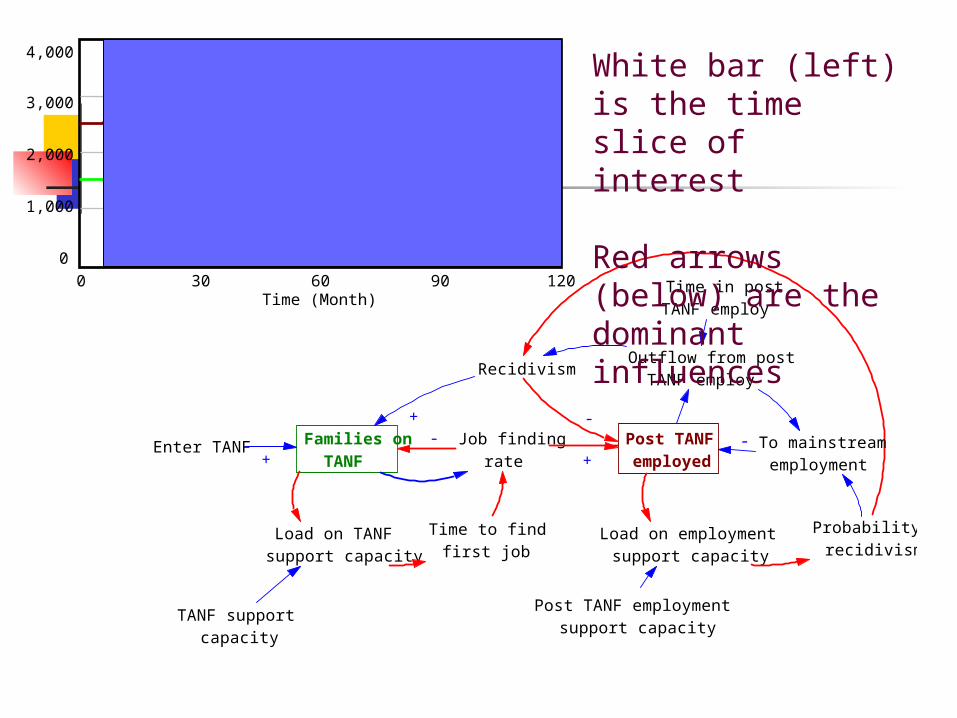
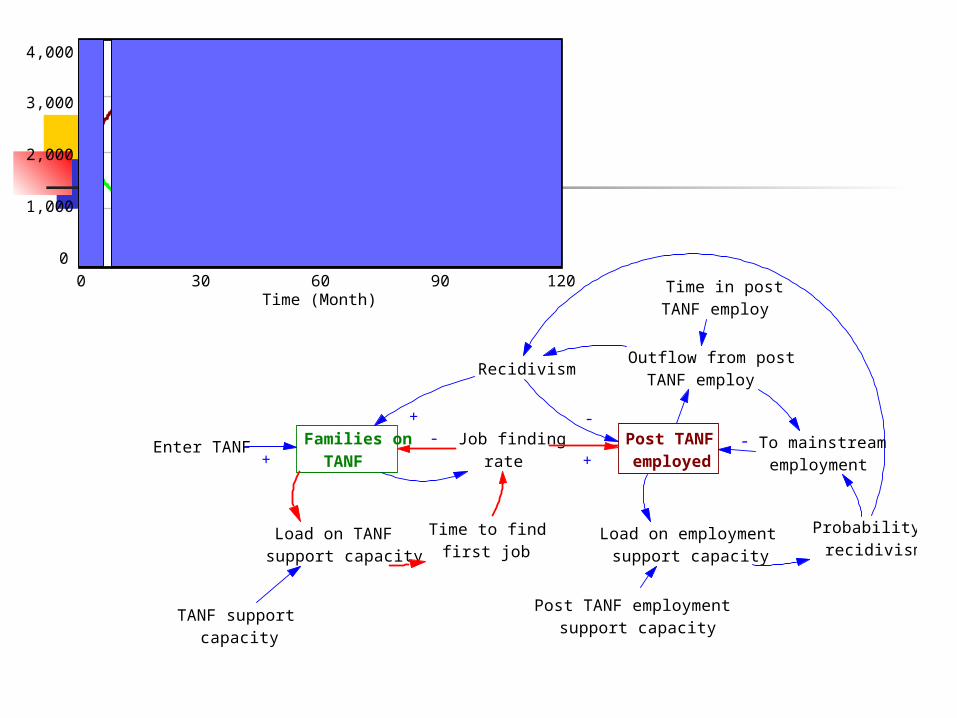
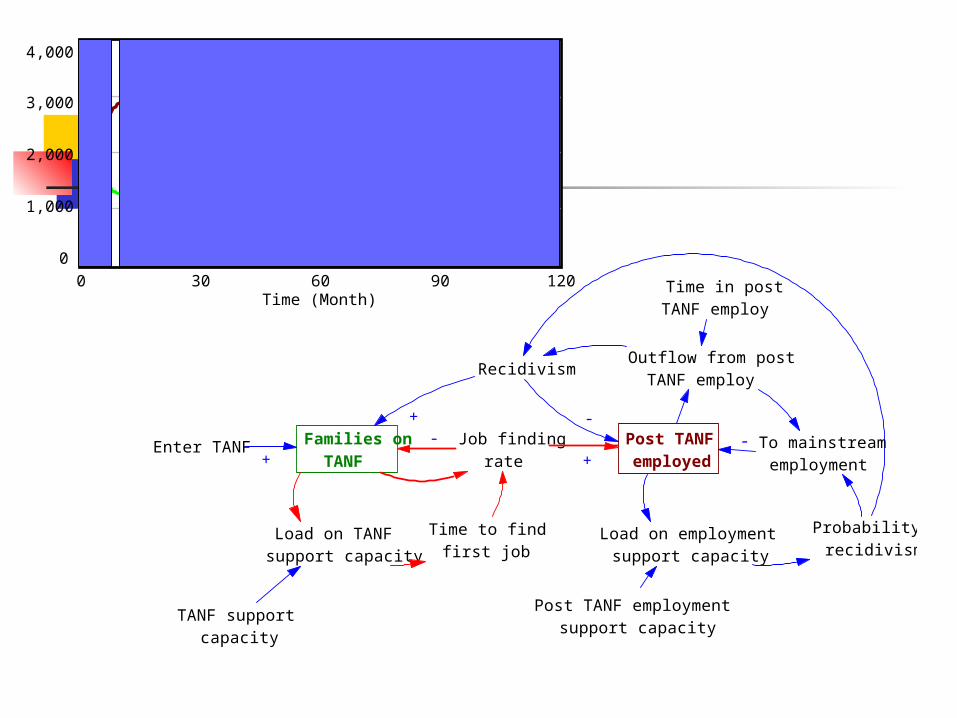
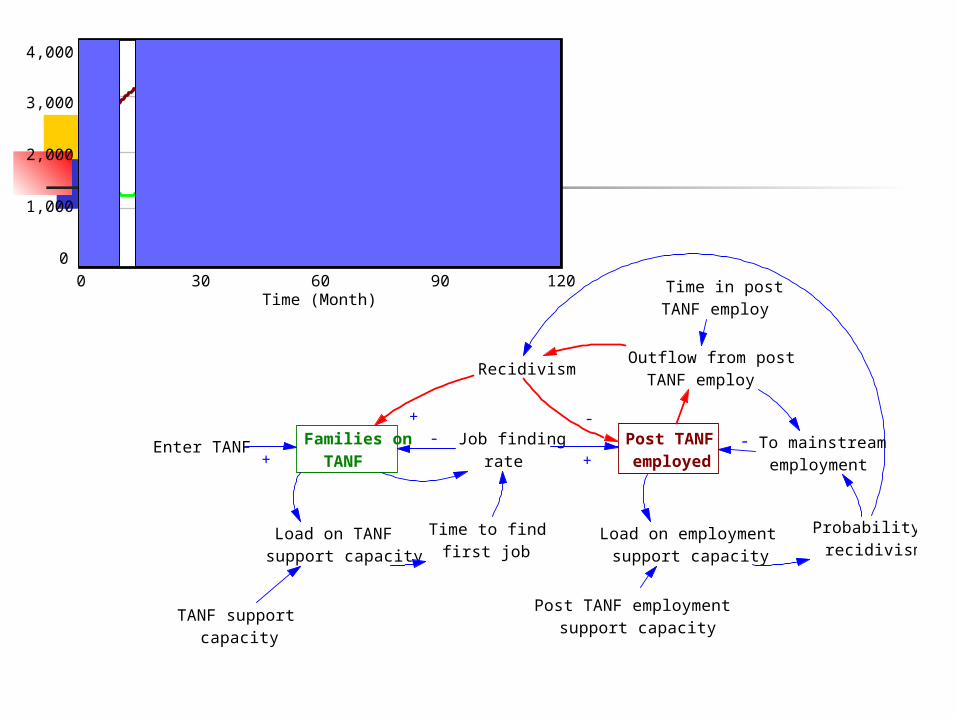
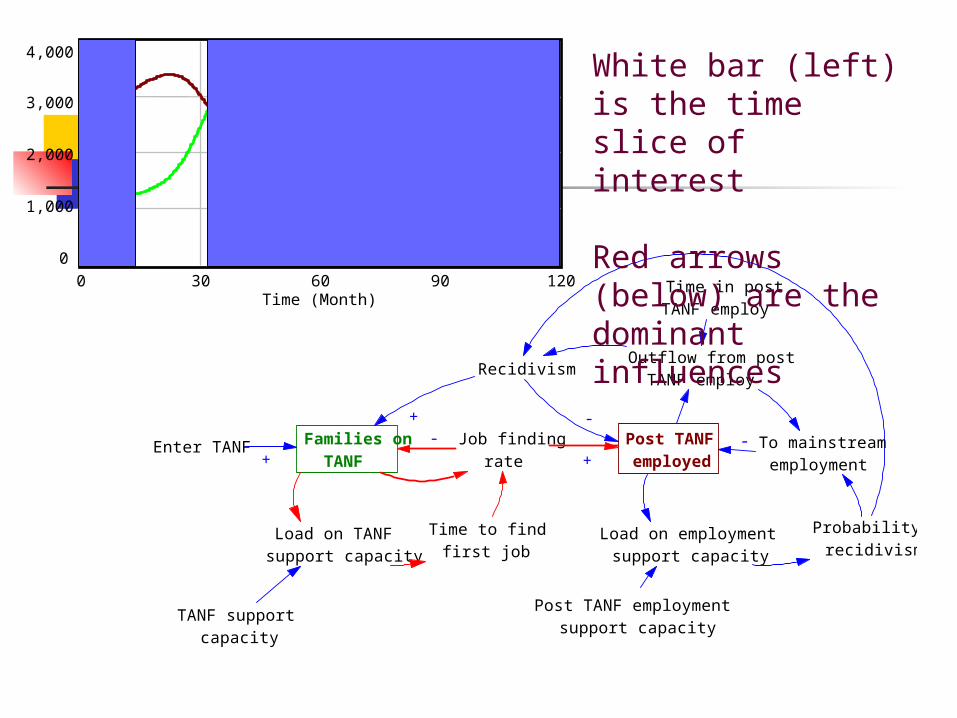
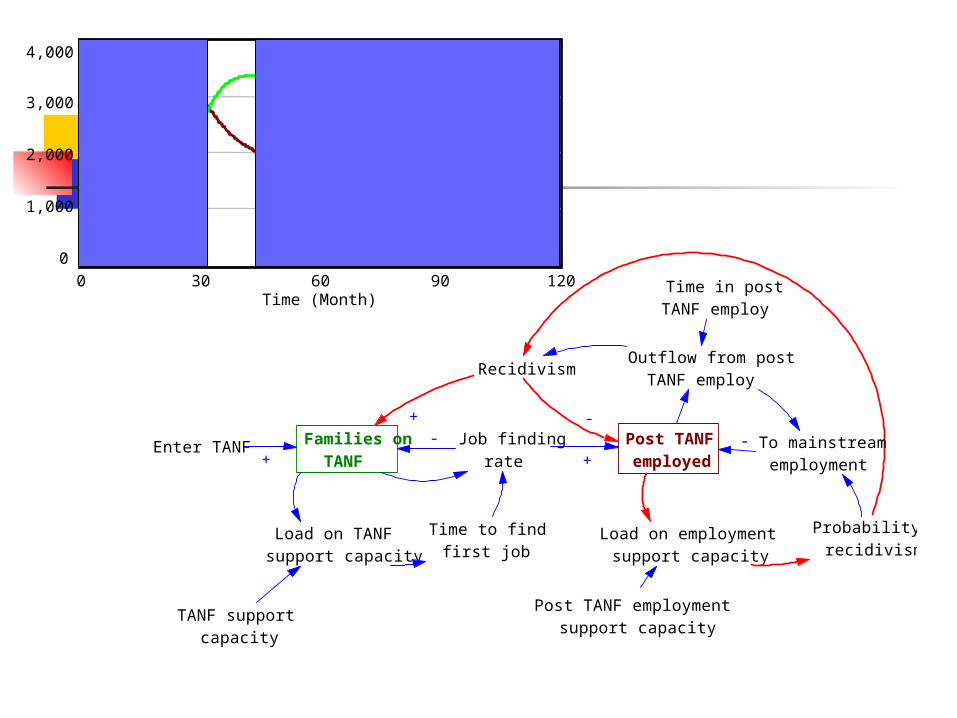
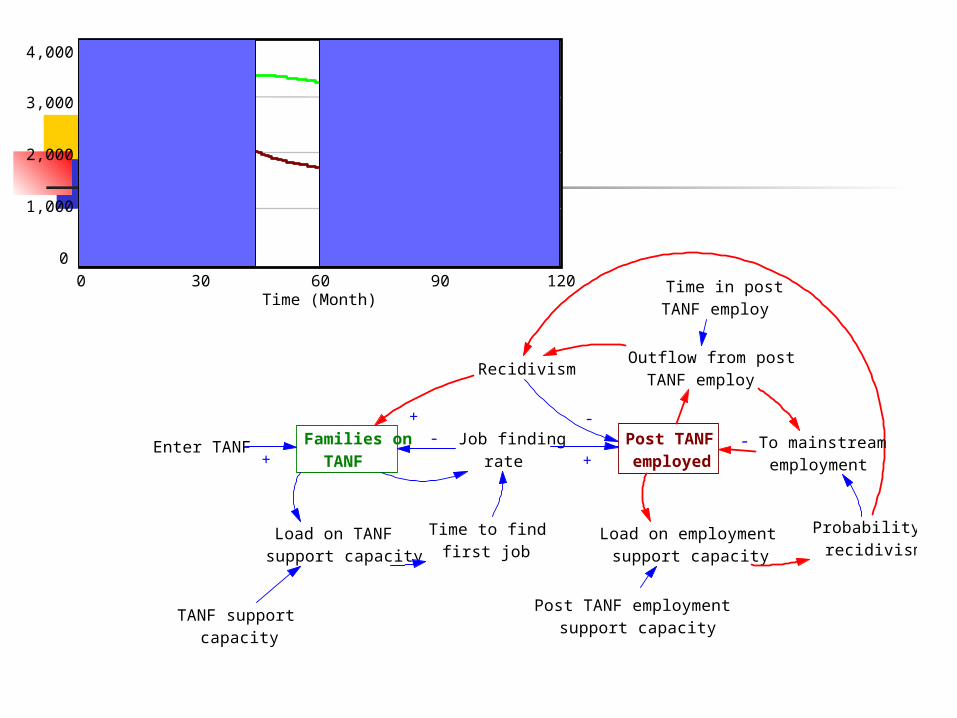
White bar (left) is the time slice of interest
Red arrows (below) are the dominant influences
120
B: Employed load controls recidivism
4,000
3,000
2,000
1,000
0
0 30 60 90Time (Month)
Enter TANF Families onTANF+
-
Recidivism
+
Outflow from postTANF employ
Post TANFemployed
Time in postTANF employ
Job findingrate +
-
To mainstreamemployment
-
Probability ofrecidivism
Time to findfirst job
Load on TANFsupport capacity
TANF supportcapacity
Load on employmentsupport capacity
Post TANF employmentsupport capacity
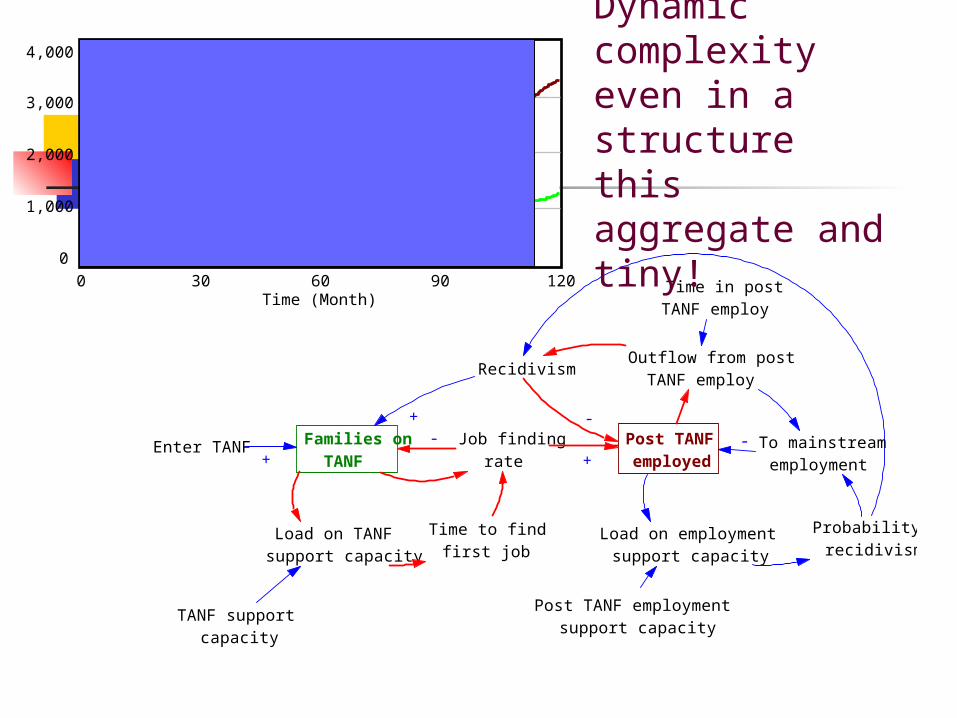
Dynamic complexity even in a structure this aggregate and tiny!
System Dynamics and Dynamic Complexity Thinking dynamically moves us beyond separate
events and decisions, toward understanding.
Feedback thinking extends traditional causal thinking.
It improves (makes more realistic) how we think about the world and how we think about changing it.
The endogenous point of view is empowering.
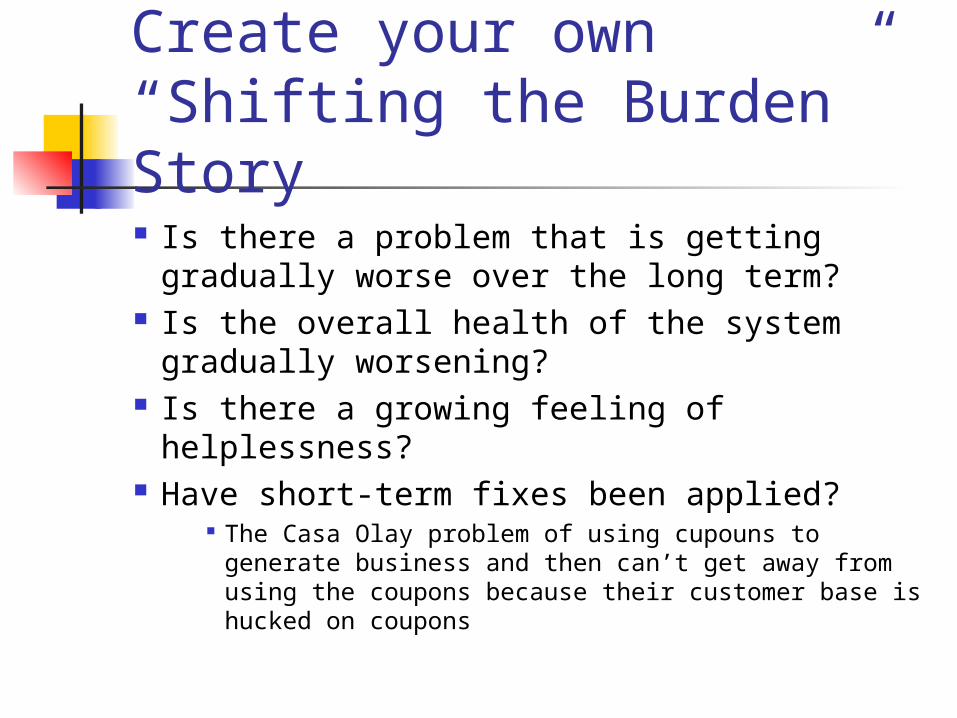
Create your own “Shifting the Burden” Story Is there a problem that is getting
gradually worse over the long term? Is the overall health of the system
gradually worsening? Is there a growing feeling of helplessness? Have short-term fixes been applied?
The Casa Olay problem of using cupouns to generate business and then can’t get away from using the coupons because their customer base is hucked on coupons
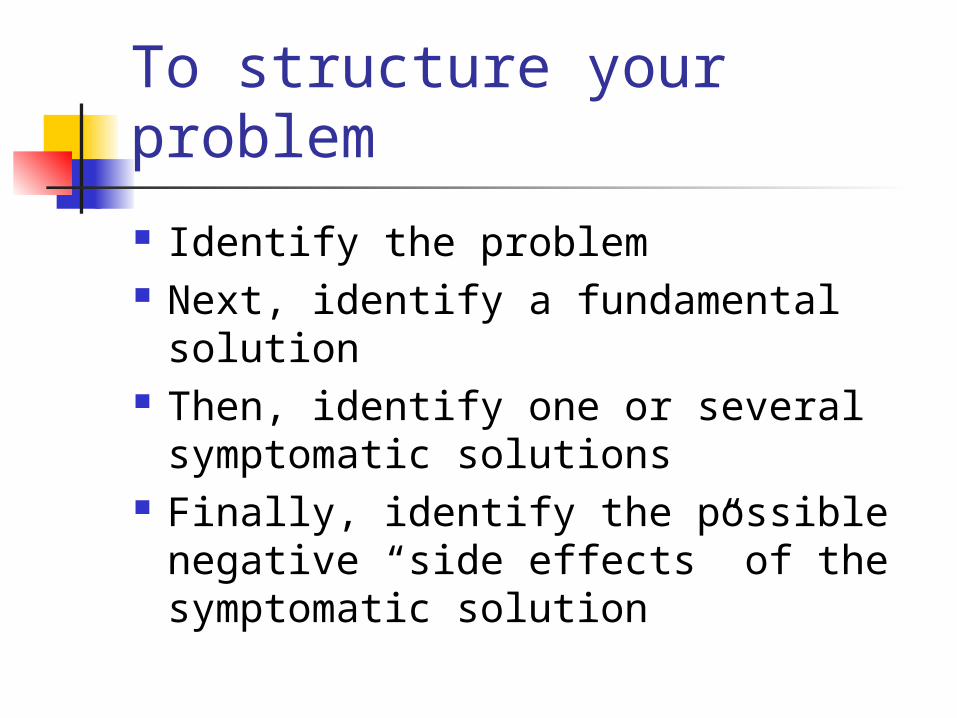
To structure your problem
Identify the problem Next, identify a fundamental
solution Then, identify one or several
symptomatic solutions Finally, identify the possible
negative “side effects” of the symptomatic solution
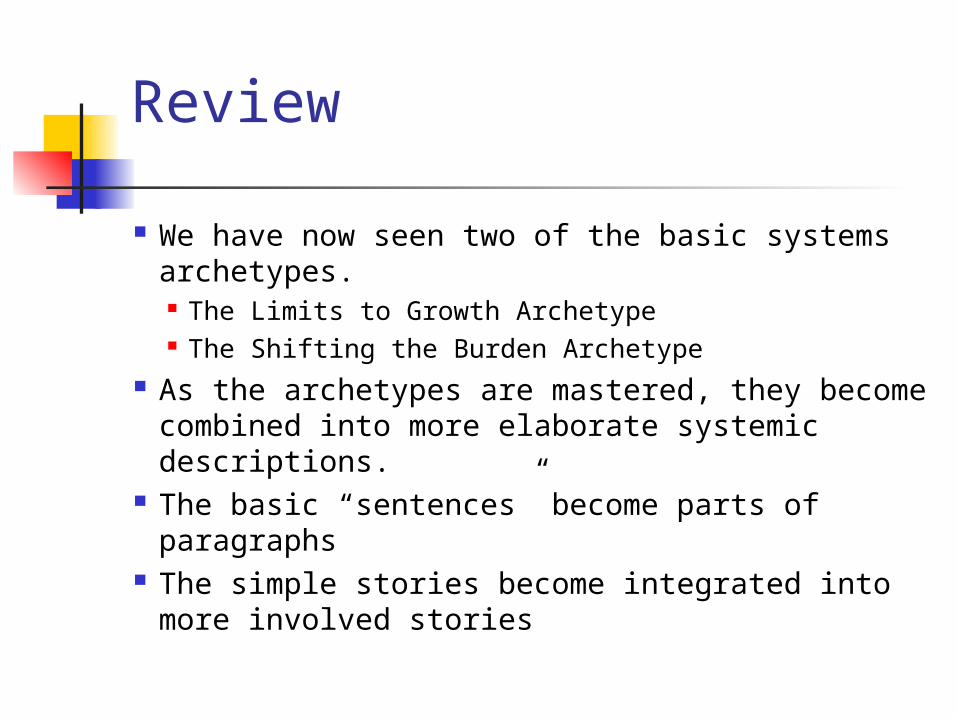
Review
We have now seen two of the basic systems archetypes. The Limits to Growth Archetype The Shifting the Burden Archetype
As the archetypes are mastered, they become combined into more elaborate systemic descriptions.
The basic “sentences” become parts of paragraphs
The simple stories become integrated into more involved stories
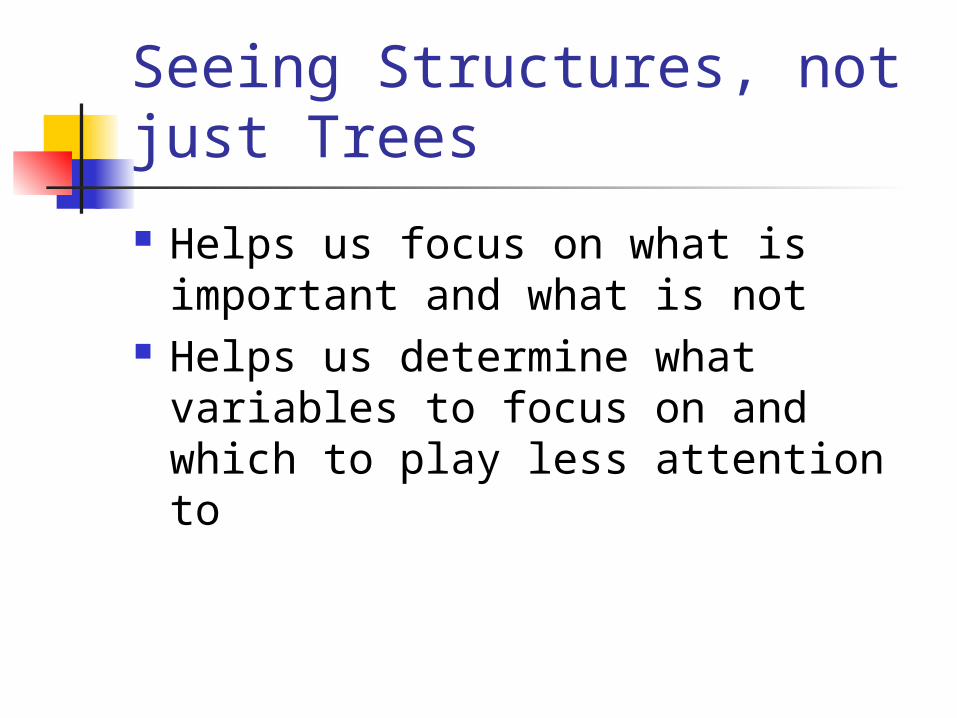
Seeing Structures, not just Trees
Helps us focus on what is important and what is not
Helps us determine what variables to focus on and which to play less attention to

WonderTech: The Chapter 7 Scenario
A lesson in Growth and Underinvestment
What Senge gets out of this is the Growth and Underinvestment Archetype A combination of variants of the
Limits to Growth Archetype and the Shifting the Burden Archetype

The WonderTech Scenario
WonderTech continues to invest in the growth side of the process. Sales grow but then plateau. Management puts more sales people into the field. Offers more incentives to sales force. But because of long lead times, customers wane. “Yes you have a great product, but you can’t deliver on your lead time promise of eight weeks. We know; we’ve heard from your other customers.” In fact, the company relaxed its lead-time standard out to twelve to sixteen weeks because of insufficient capacity.
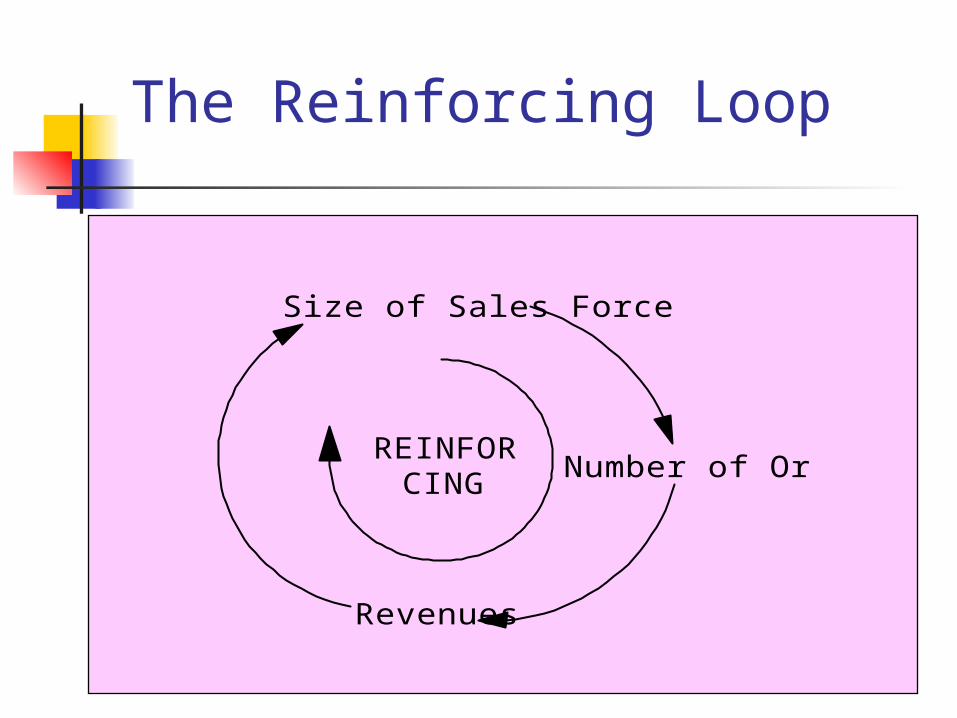
The Reinforcing Loop
Number of Orders
Revenues
Size of Sales Force
REINFORCING
The Balancing Loop: Following the LTG Archetype
Number of Orders
Revenues
Size of Sales Force
Size of Backlog
Delivery Time
Delay
Sales Difficulty

The Growth Curve: Page 117
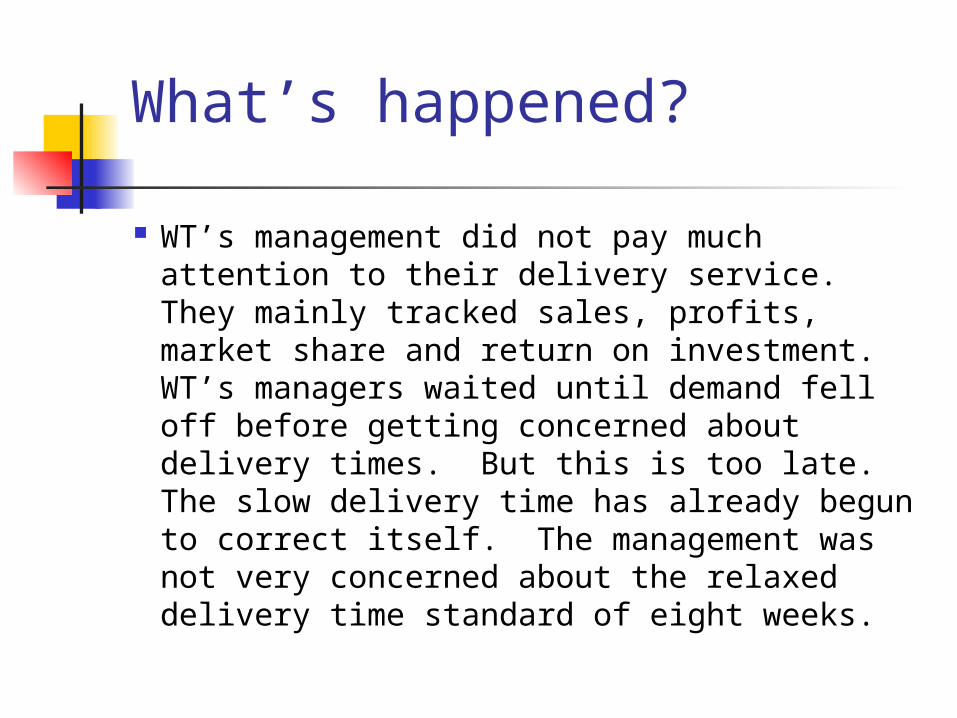
What’s happened?
WT’s management did not pay much attention to their delivery service. They mainly tracked sales, profits, market share and return on investment. WT’s managers waited until demand fell off before getting concerned about delivery times. But this is too late. The slow delivery time has already begun to correct itself. The management was not very concerned about the relaxed delivery time standard of eight weeks.
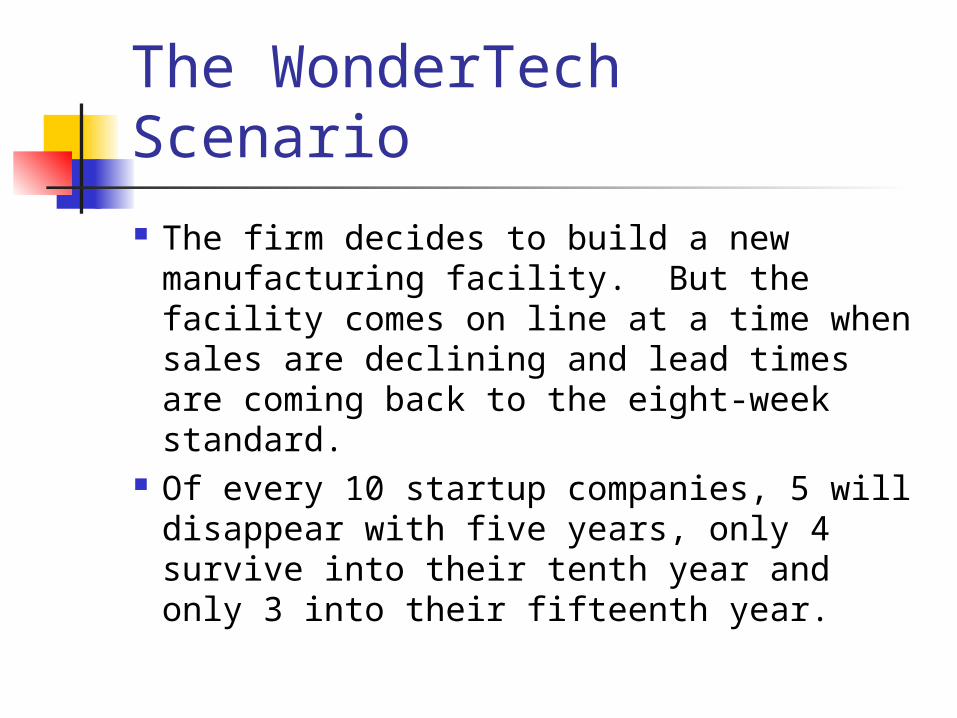
The WonderTech Scenario
The firm decides to build a new manufacturing facility. But the facility comes on line at a time when sales are declining and lead times are coming back to the eight-week standard.
Of every 10 startup companies, 5 will disappear with five years, only 4 survive into their tenth year and only 3 into their fifteenth year.
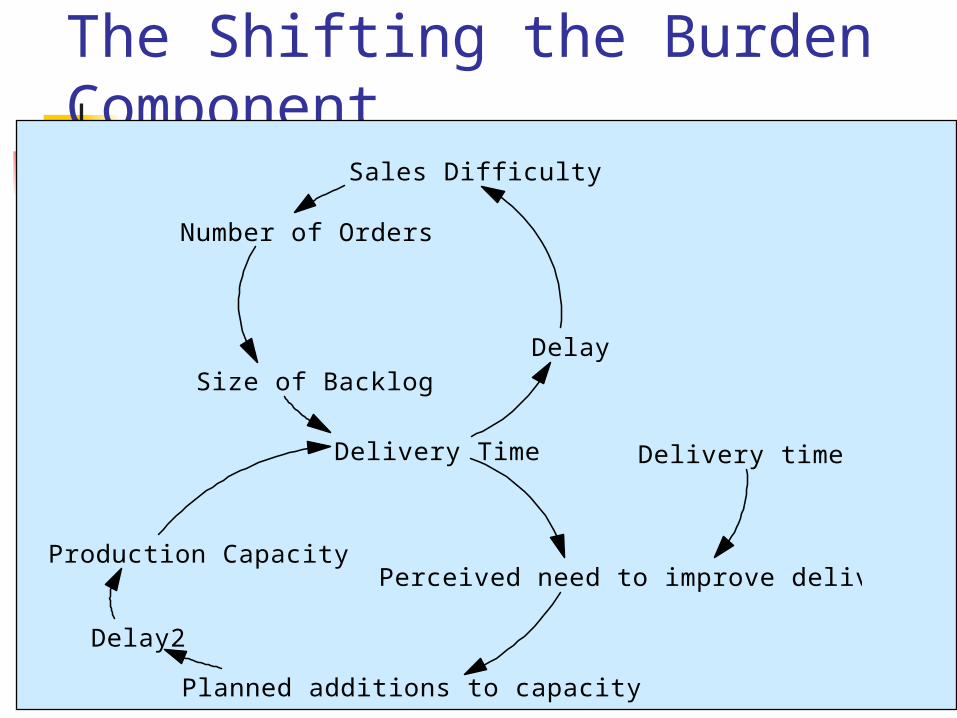
The Shifting the Burden Component
Number of Orders
Size of Backlog
Delivery Time
Delay
Sales Difficulty
Production CapacityPerceived need to improve delivery time
Delivery time standard
Planned additions to capacity
Delay2

Put the whole thing together
Comments on The Senge Methodology
Sees problems as conforming to a finite number of “archetypes”
Formulates models based on combinations of the archetypes
Addresses problem-driven situations What about situations and systems that
are technology-driven, dynamics-driven, exogenously-driven, anything but problem-driven
More Comments on the Senge Methodology
But does this become sufficiently general to accommodate all dynamical “scenarios and situations”?
It is difficult to translate his archetypes and causal models into running system dynamics simulations A lot of variables (RATE VARIABLES,
specifically) get left out in terms of connections
More Comments on the Senge Methodology
The focus is on characterizing the dynamics, not on how to capture that in terms of stocks, flows and information paths
He doesn’t label his edges with “+” or “-” signs
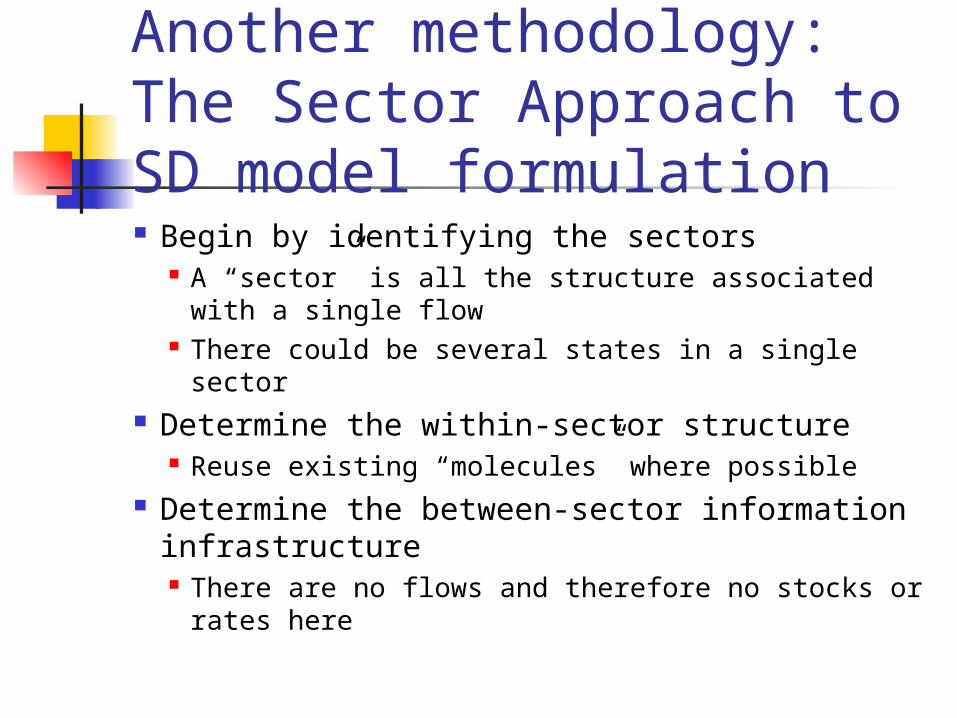
Another methodology: The Sector Approach to SD model formulation Begin by identifying the sectors
A “sector” is all the structure associated with a single flow
There could be several states in a single sector Determine the within-sector structure
Reuse existing “molecules” where possible Determine the between-sector information
infrastructure There are no flows and therefore no stocks or
rates here
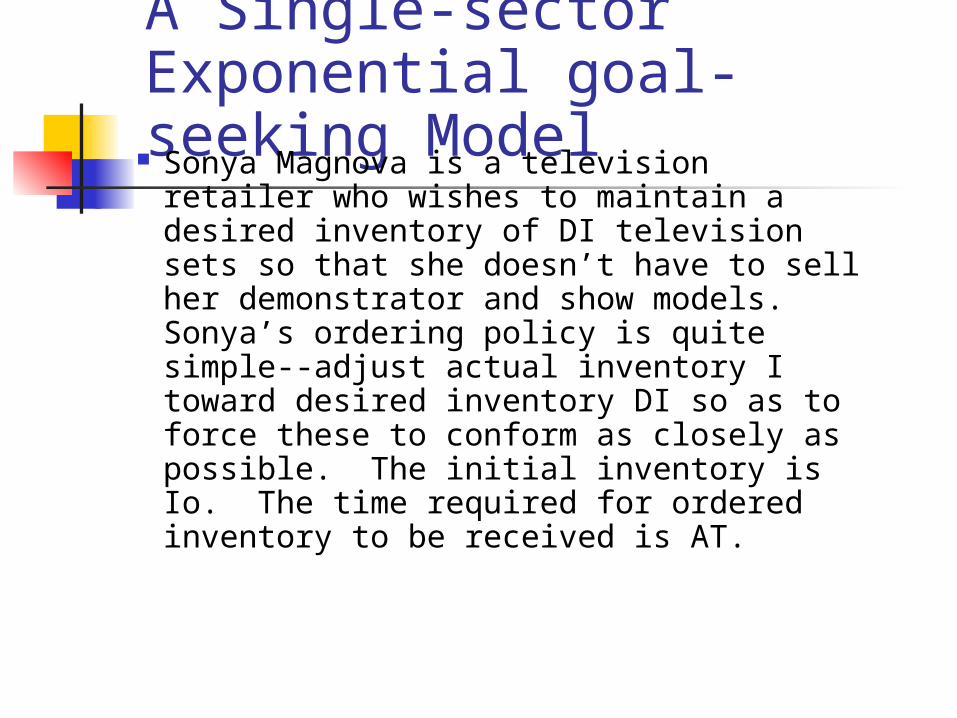
A Single-sector Exponential goal-seeking Model Sonya Magnova is a television retailer who wishes to maintain a desired inventory of DI television sets so that she doesn’t have to sell her demonstrator and show models. Sonya’s ordering policy is quite simple--adjust actual inventory I toward desired inventory DI so as to force these to conform as closely as possible. The initial inventory is Io. The time required for ordered inventory to be received is AT.
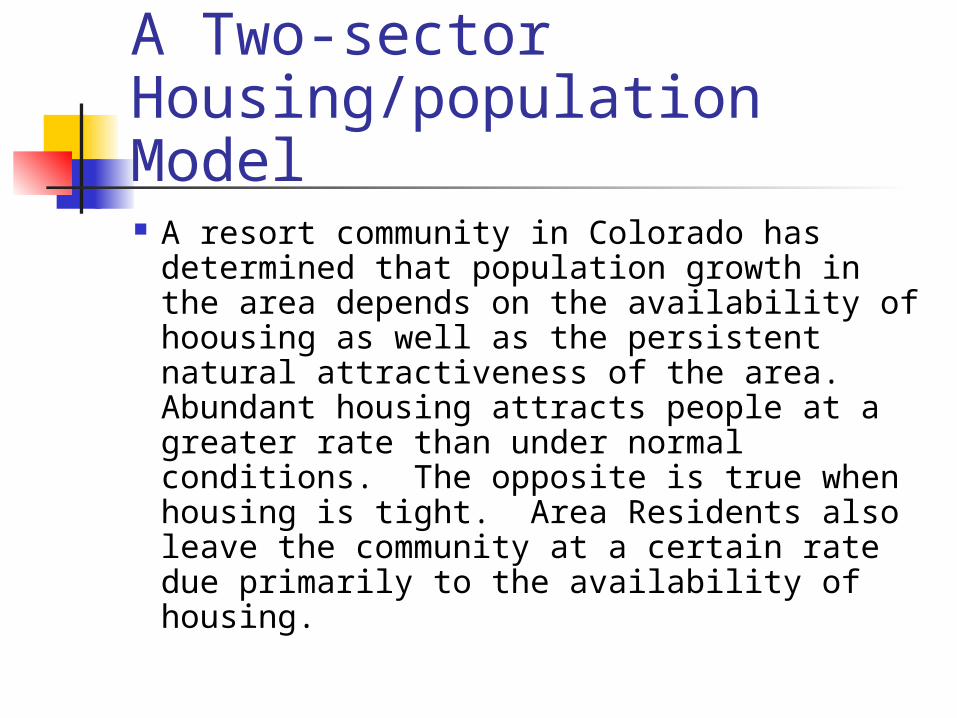
A Two-sector Housing/population Model
A resort community in Colorado has determined that population growth in the area depends on the availability of hoousing as well as the persistent natural attractiveness of the area. Abundant housing attracts people at a greater rate than under normal conditions. The opposite is true when housing is tight. Area Residents also leave the community at a certain rate due primarily to the availability of housing.
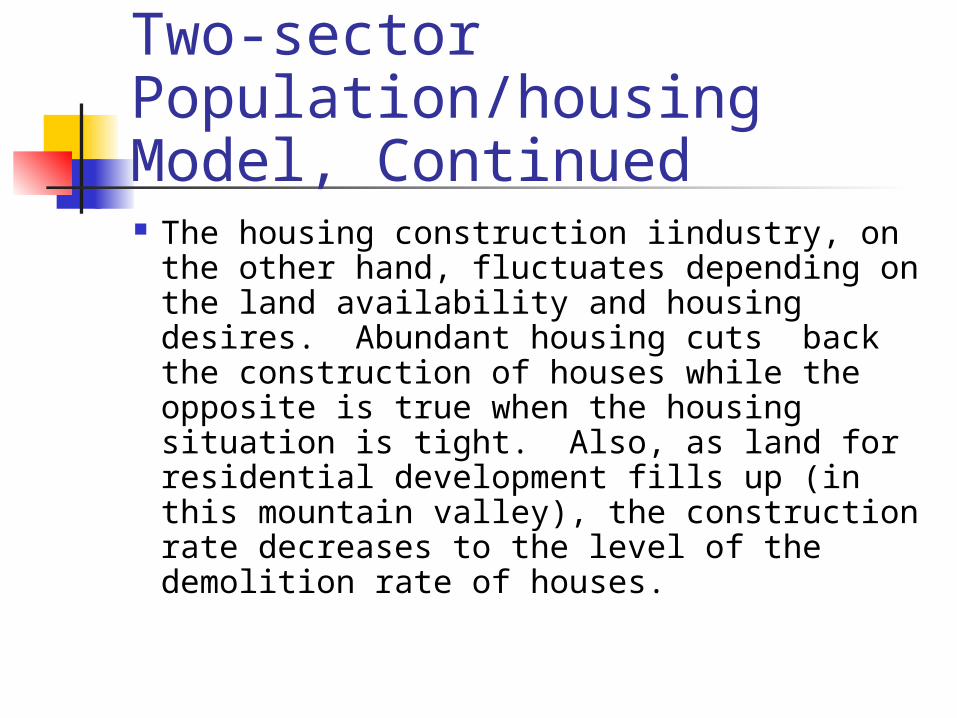
Two-sector Population/housing Model, Continued The housing construction iindustry, on
the other hand, fluctuates depending on the land availability and housing desires. Abundant housing cuts back the construction of houses while the opposite is true when the housing situation is tight. Also, as land for residential development fills up (in this mountain valley), the construction rate decreases to the level of the demolition rate of houses.
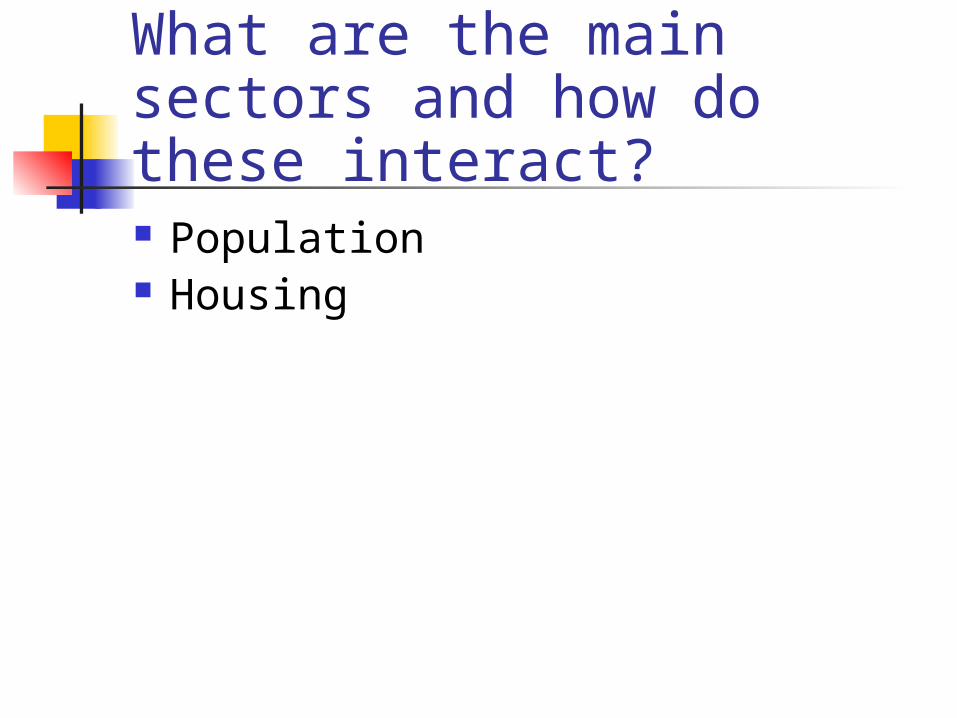
What are the main sectors and how do these interact? Population Housing
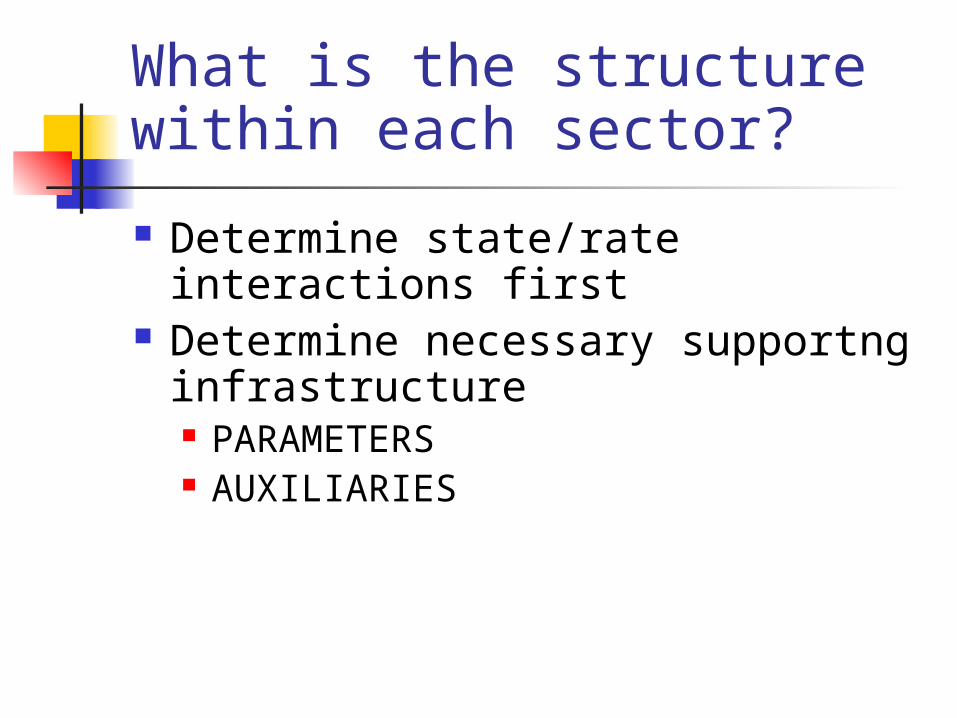
What is the structure within each sector?
Determine state/rate interactions first
Determine necessary supportng infrastructure PARAMETERS AUXILIARIES
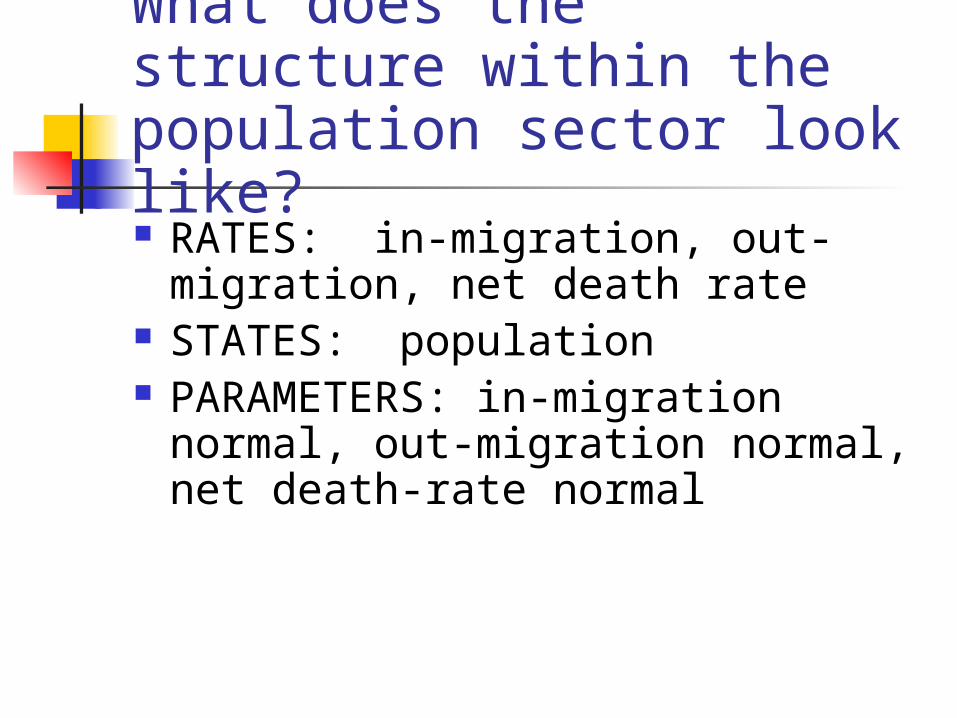
What does the structure within the population sector look like? RATES: in-migration, out-
migration, net death rate STATES: population PARAMETERS: in-migration normal,
out-migration normal, net death-rate normal
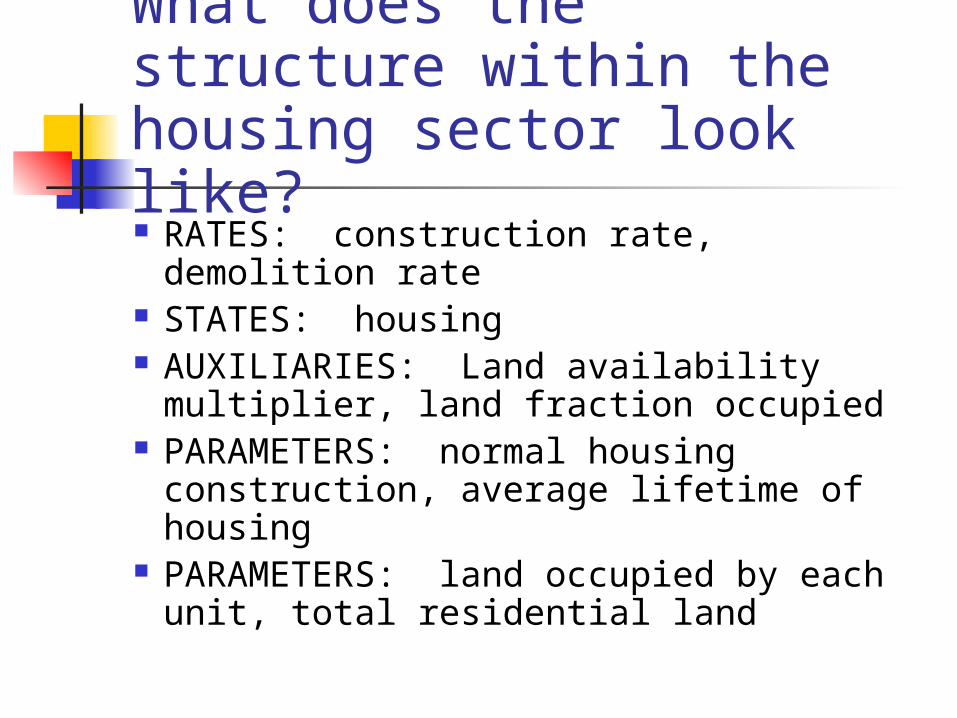
What does the structure within the housing sector look like? RATES: construction rate, demolition
rate STATES: housing AUXILIARIES: Land availability multiplier,
land fraction occupied PARAMETERS: normal housing
construction, average lifetime of housing
PARAMETERS: land occupied by each unit, total residential land
What is the structure between sectors?
There are only AUXILIARIES, PARAMETERS, INPUTS and OUTPUTS
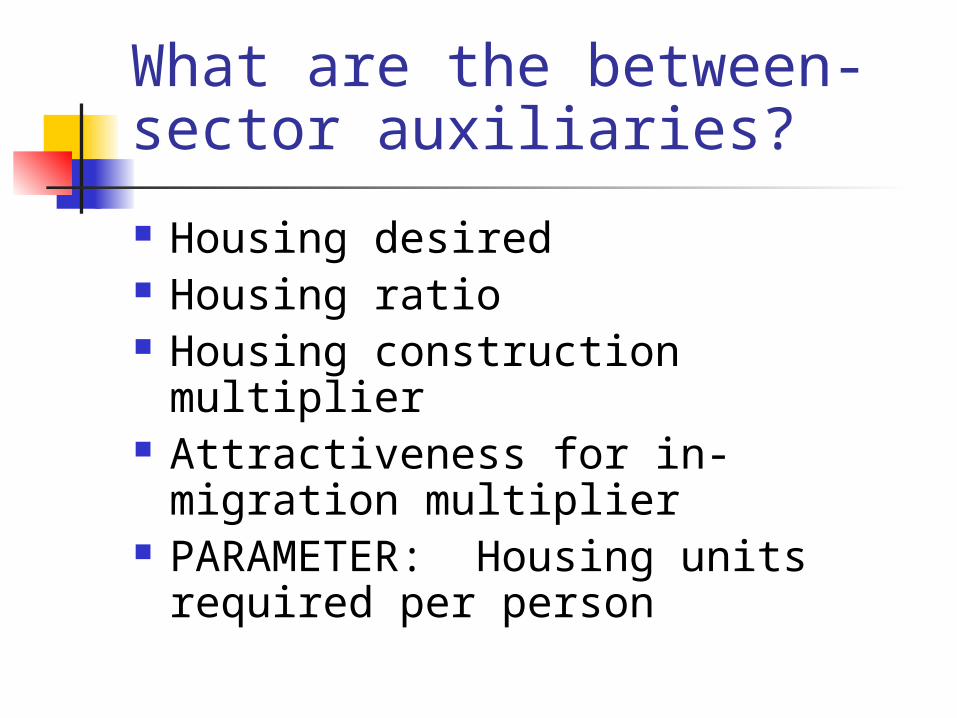
What are the between-sector auxiliaries?
Housing desired Housing ratio Housing construction multiplier Attractiveness for in-migration
multiplier PARAMETER: Housing units
required per person

System DynamicsDouglas M. Stewart, Ph.D.
Anderson Schools of Management
University of New Mexico
Adapted from Senge, P. The Fifth Discipline, Doubleday/Currency, 1990.
Why System Dynamics
TQM requires a systems view of the world
A new paradigm required See the interrelationships rather
than the linear cause-effect chains See the process of change rather
than a snapshot In systems thinking every influence
is both a cause and effect
Introduction to Systems Diagrams
From any element in a situation you can trace arrows that represent the influence on another element.
Example: Filling a glass of water
Faucet Position
Water Flow
Current Water Level
Perceived Gap
Desired Water Level
Am I filling the glass of water?
Or is the level of water controlling my hand?
Building Blocks of Systems Thinking
Reinforcing Loops (Positive Feedback)
Balancing Loops (Negative Feedback)
Delays
Reinforcing Loops
Sales
Satisfied Customers
Positive Word of Mouth
If the product is good we have a virtuous cycle.
If the product is bad we have a vicious cycle.
Reinforcing Loops
The snowball effect Accelerating growth or
accelerating decline These systems can take you by
surprise!
Balancing Loops
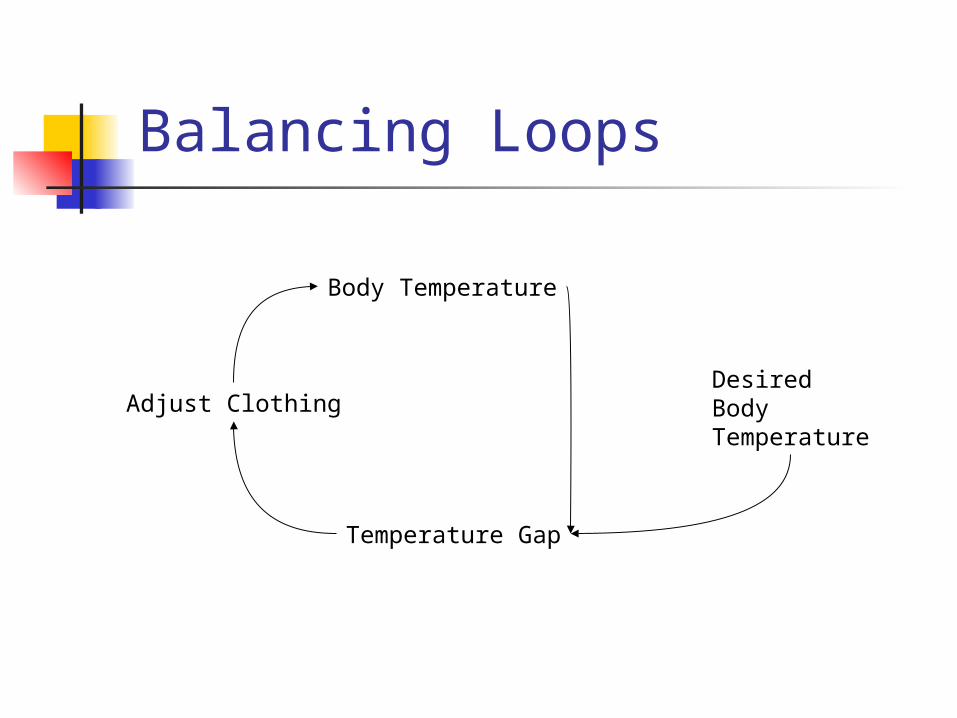
Body Temperature
Desired Body Temperature
Temperature Gap
Adjust Clothing
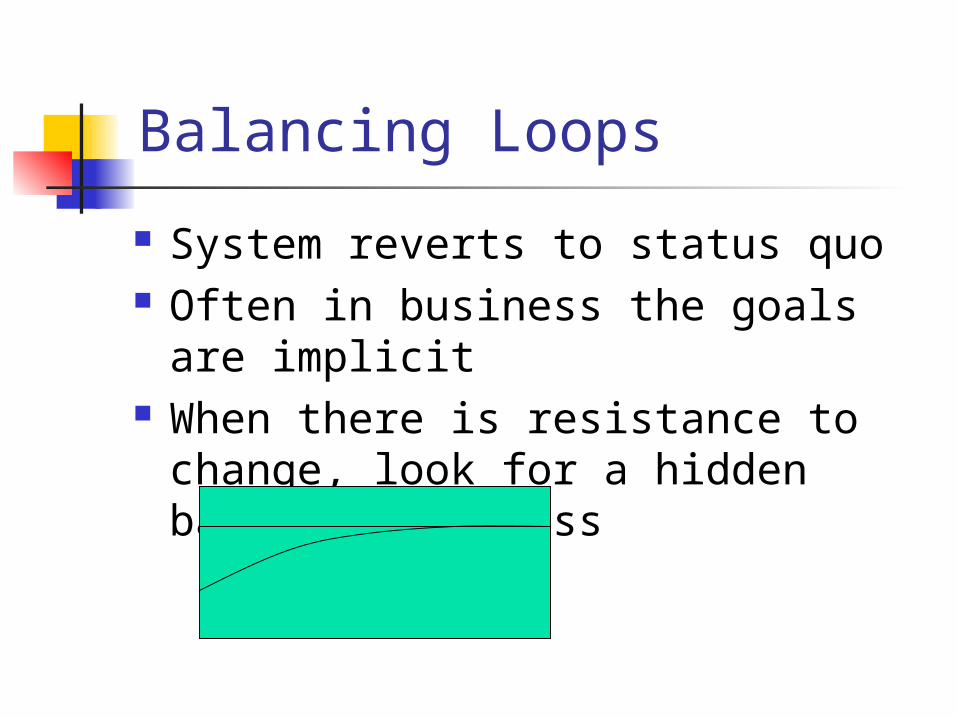
Balancing Loops
System reverts to status quo Often in business the goals are
implicit When there is resistance to
change, look for a hidden balancing process
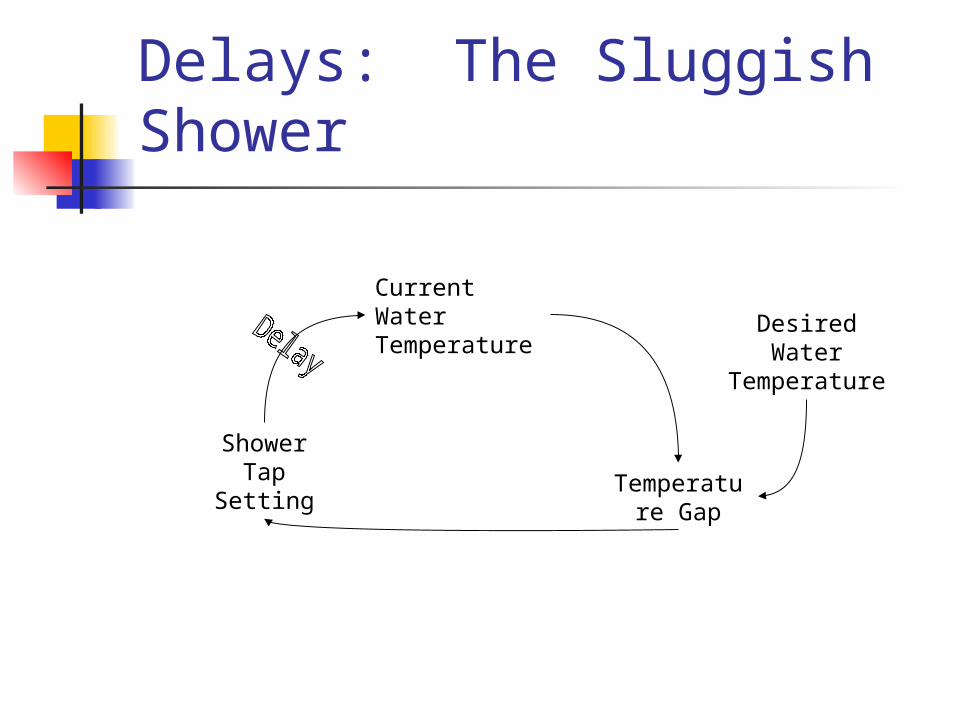
Delays: The Sluggish Shower
Current Water Temperature
Temperature Gap
Shower Tap Setting
Desired Water Temperature
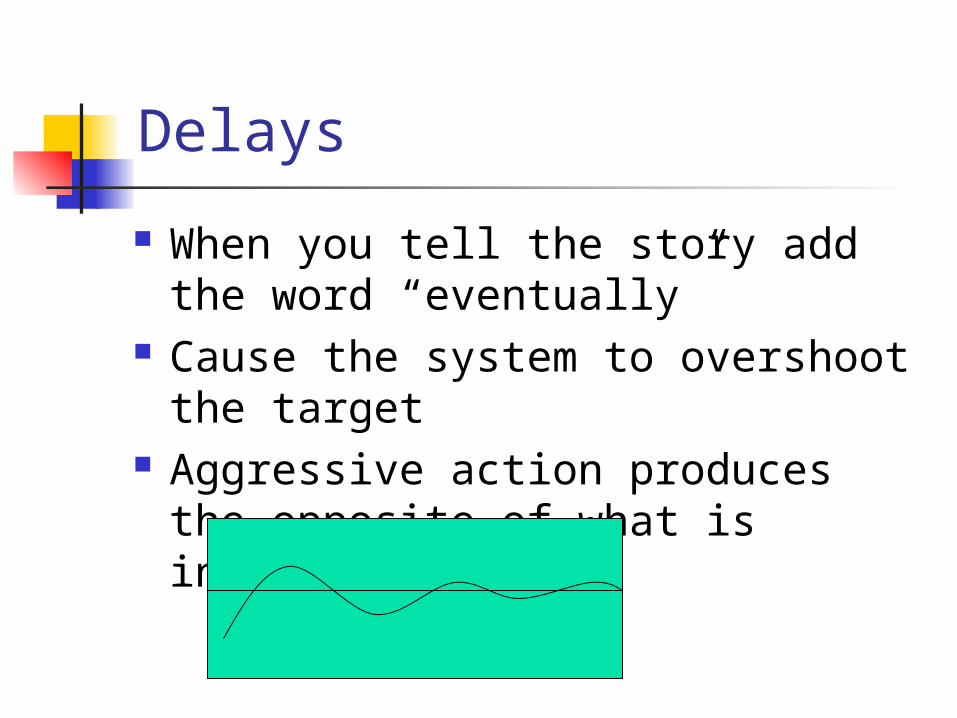
Delays
When you tell the story add the word “eventually”
Cause the system to overshoot the target
Aggressive action produces the opposite of what is intended
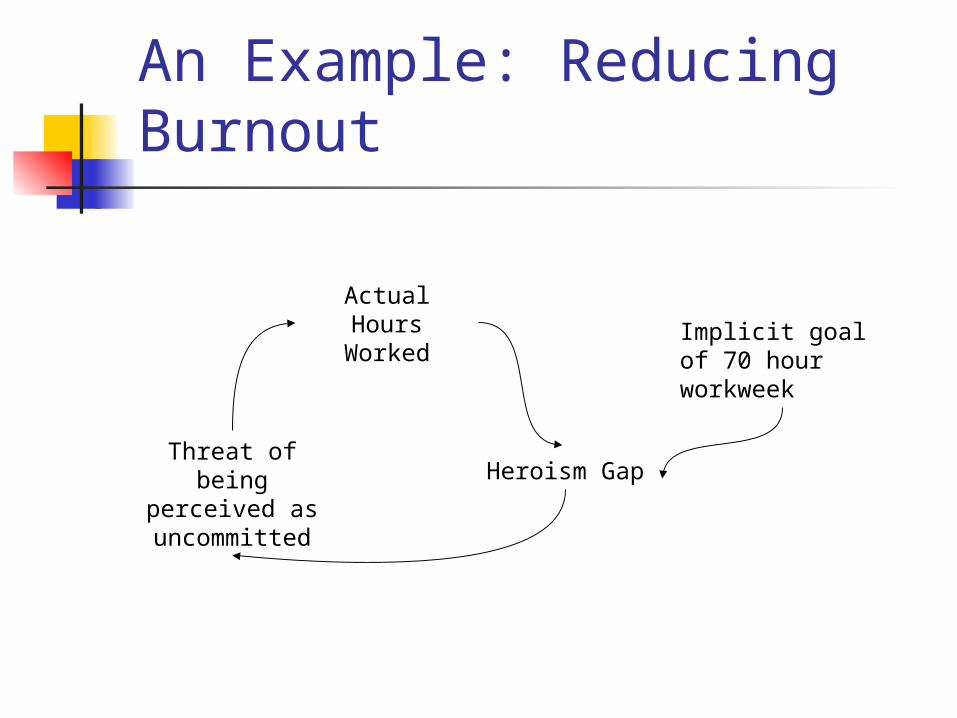
An Example: Reducing Burnout
Actual Hours Worked
Heroism GapThreat of being perceived as uncommitted
Implicit goal of 70 hour workweek
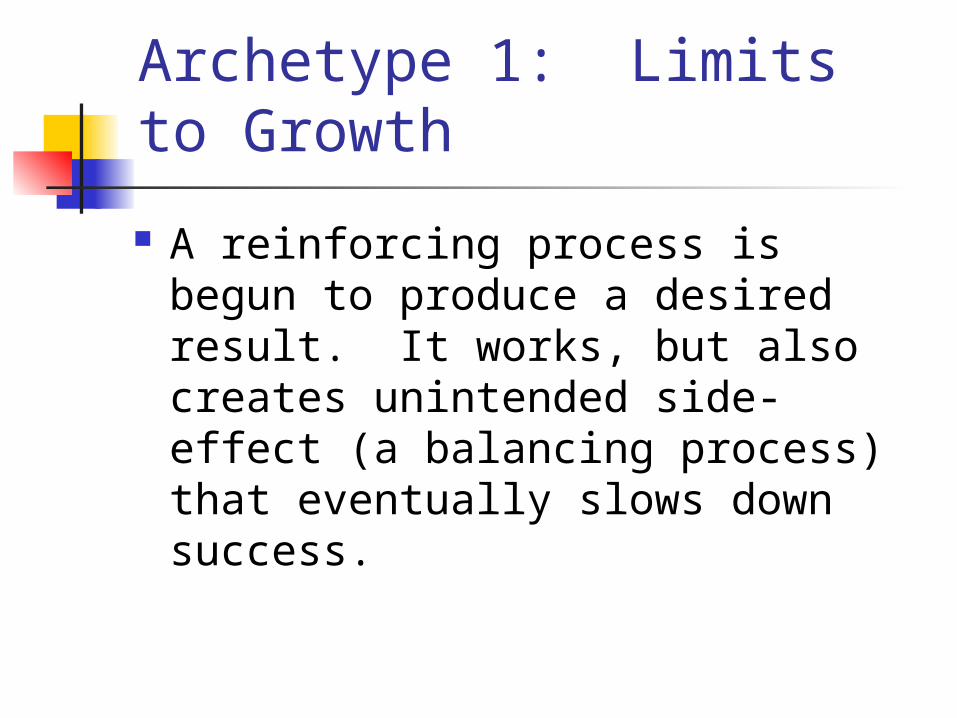
Archetype 1: Limits to Growth
A reinforcing process is begun to produce a desired result. It works, but also creates unintended side-effect (a balancing process) that eventually slows down success.
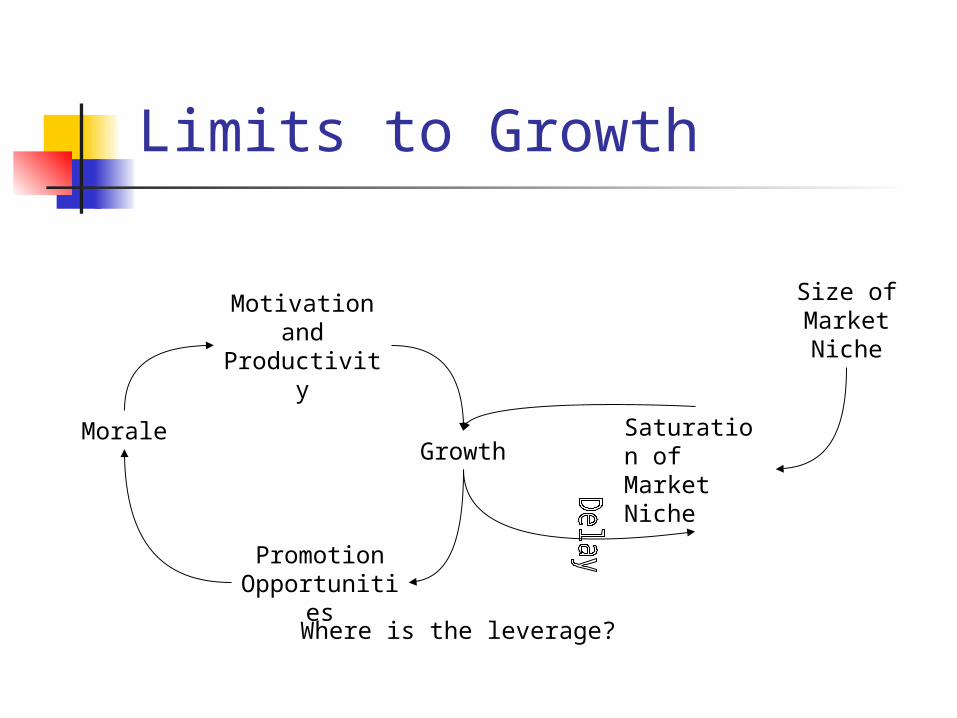
Limits to Growth
Growth
Promotion Opportunities
Morale
Motivation and Productivity
Saturation of Market Niche
Size of Market Niche
Where is the leverage?
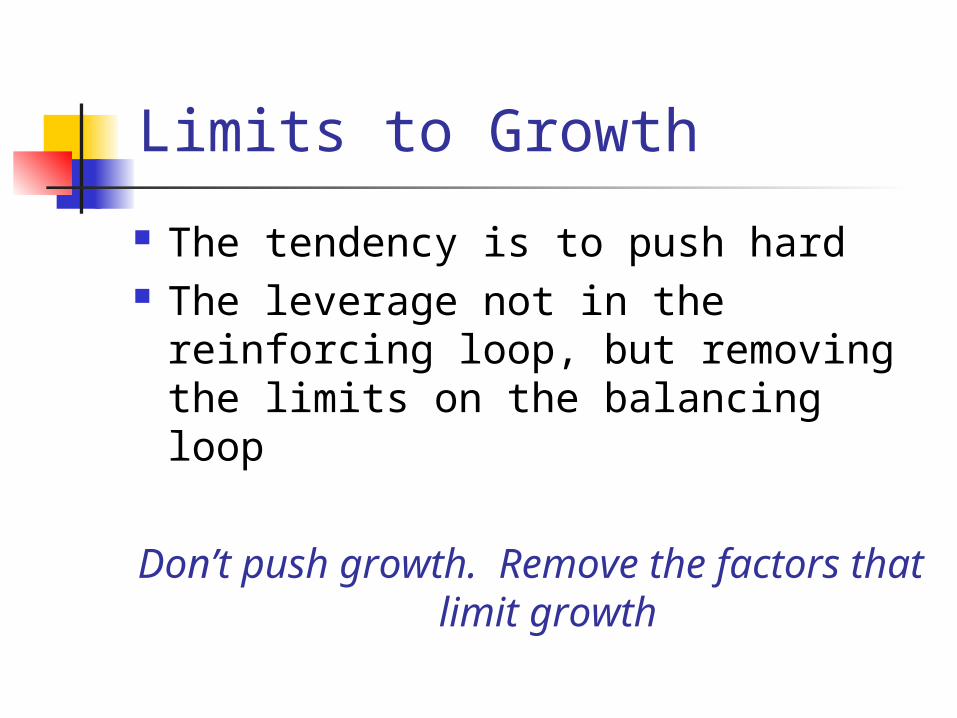
Limits to Growth
The tendency is to push hard The leverage not in the reinforcing
loop, but removing the limits on the balancing loop
Don’t push growth. Remove the factors that limit growth
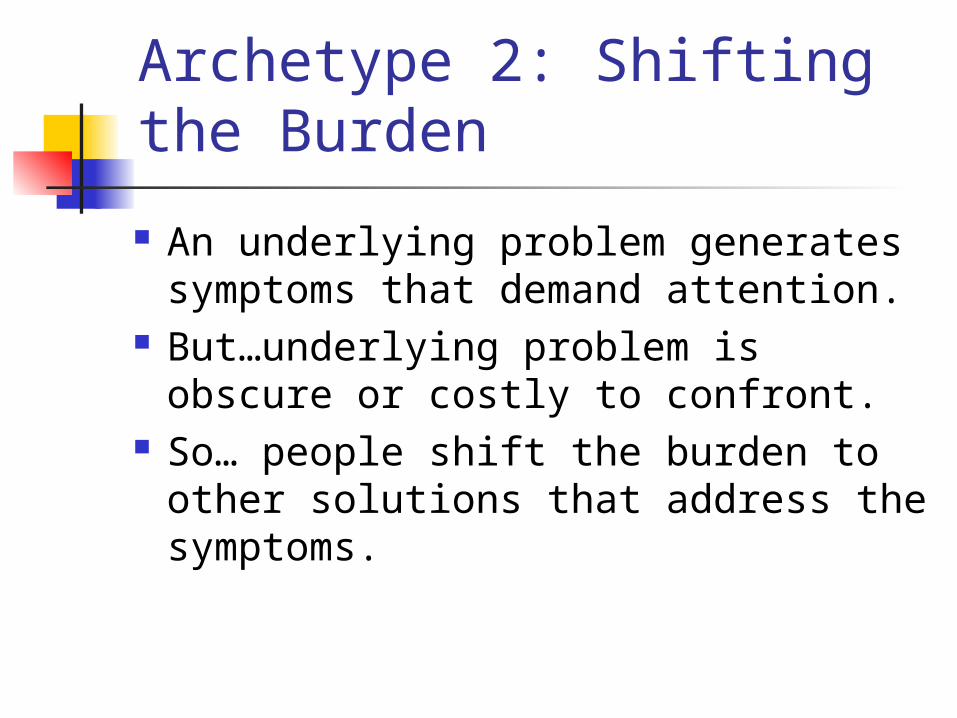
Archetype 2: Shifting the Burden
An underlying problem generates symptoms that demand attention.
But…underlying problem is obscure or costly to confront.
So… people shift the burden to other solutions that address the symptoms.
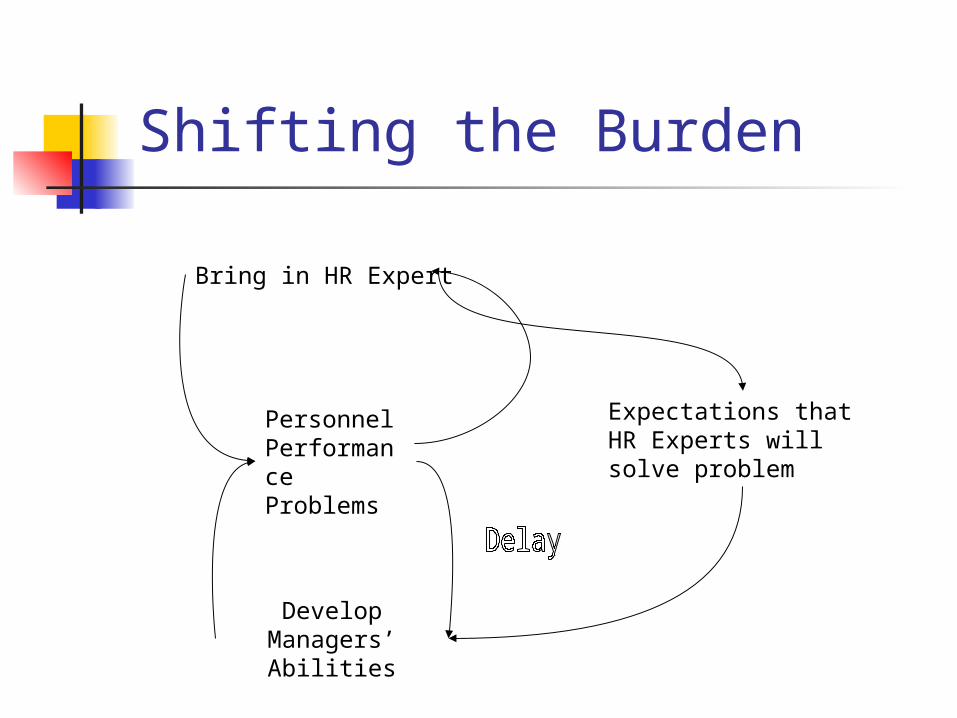
Shifting the Burden
Personnel Performance Problems
Bring in HR Expert
Develop Managers’ Abilities
Expectations that HR Experts will solve problem
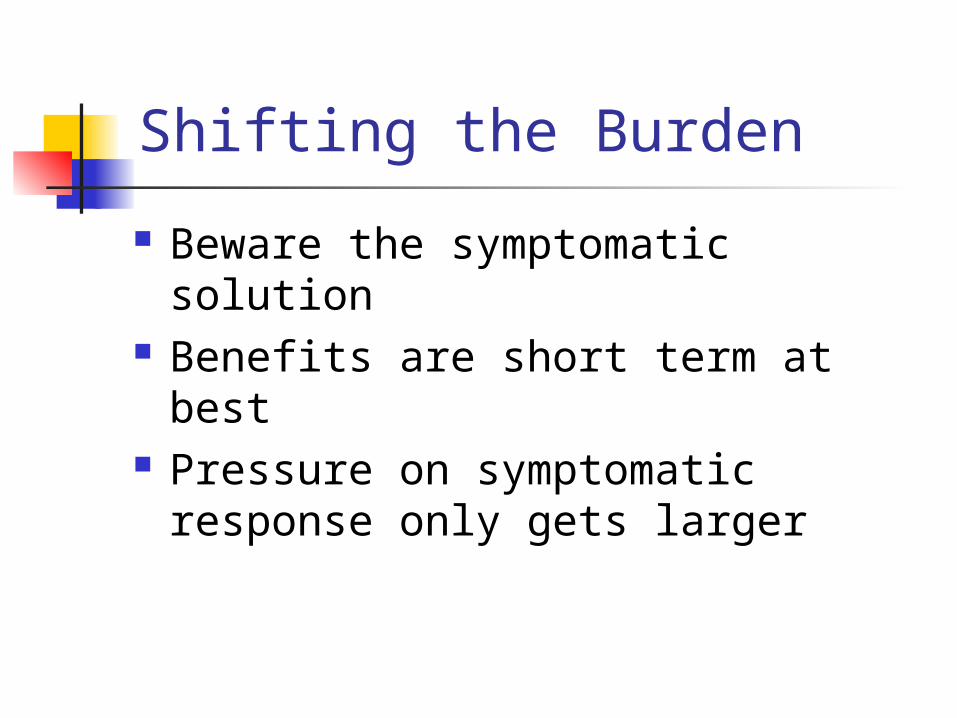
Shifting the Burden
Beware the symptomatic solution Benefits are short term at best Pressure on symptomatic response
only gets larger
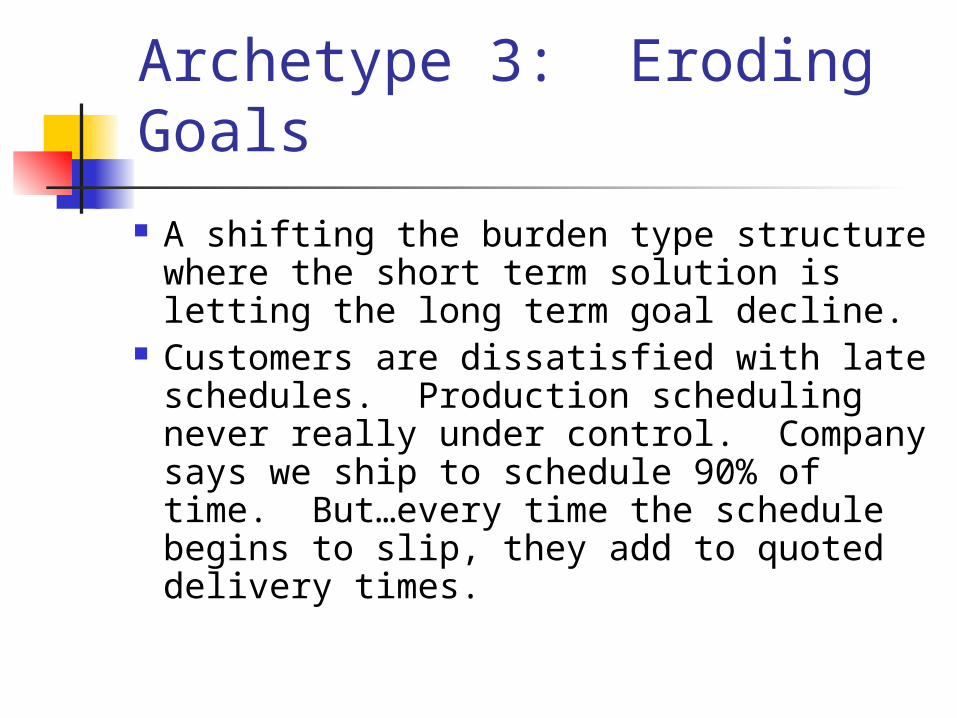
Archetype 3: Eroding Goals
A shifting the burden type structure where the short term solution is letting the long term goal decline.
Customers are dissatisfied with late schedules. Production scheduling never really under control. Company says we ship to schedule 90% of time. But…every time the schedule begins to slip, they add to quoted delivery times.
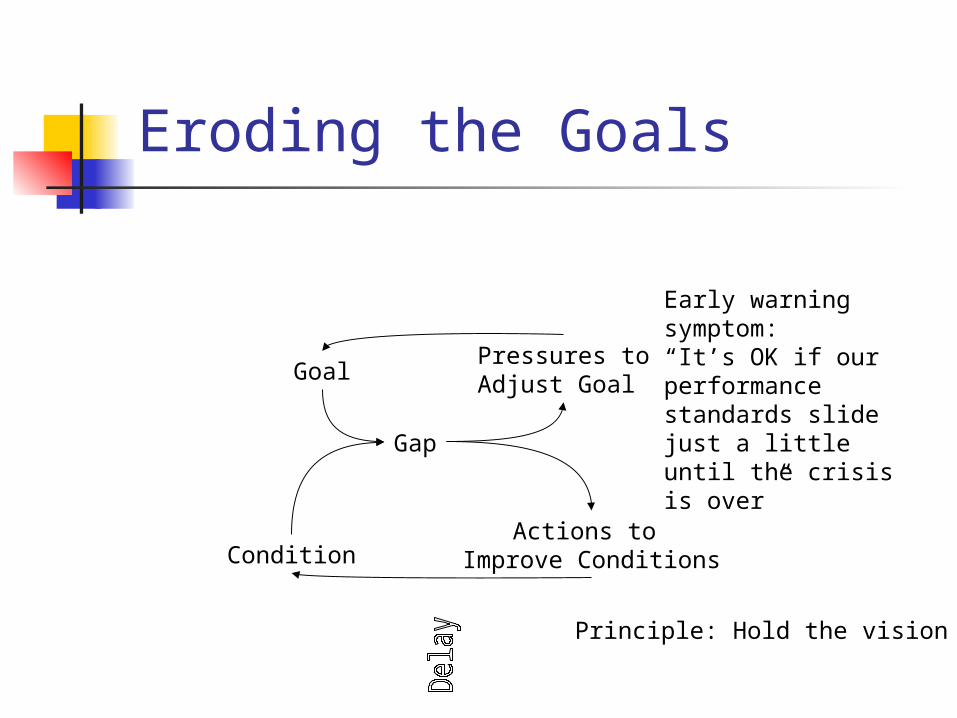
Eroding the Goals
Gap
ConditionActions to
Improve Conditions
Pressures toAdjust GoalGoal
Early warning symptom:“It’s OK if our performance standards slide just a little until the crisis is over”
Principle: Hold the vision
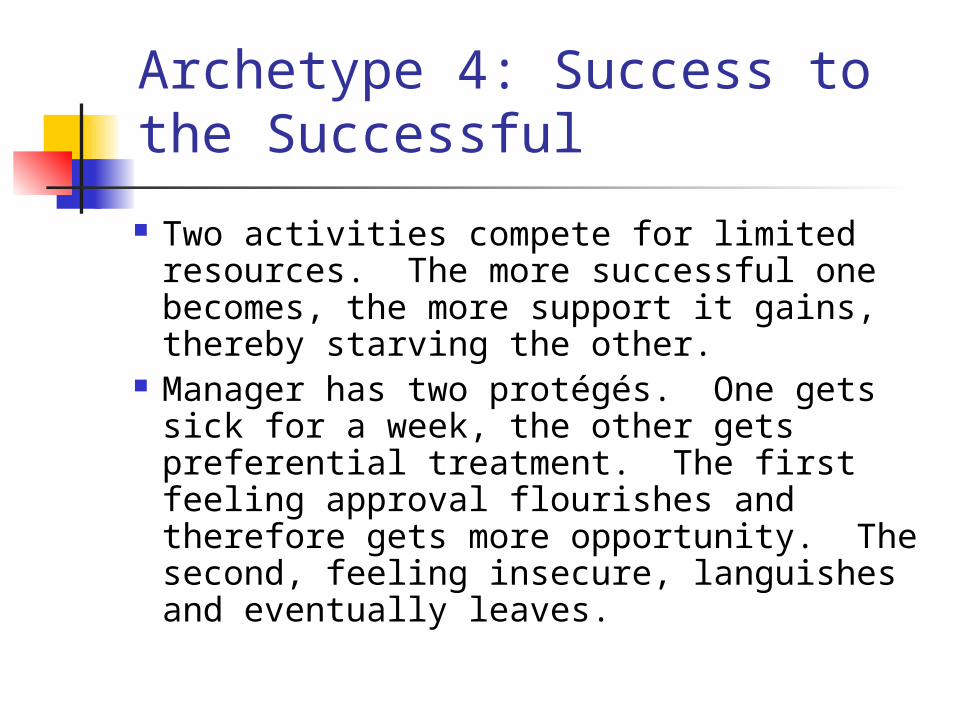
Archetype 4: Success to the Successful
Two activities compete for limited resources. The more successful one becomes, the more support it gains, thereby starving the other.
Manager has two protégés. One gets sick for a week, the other gets preferential treatment. The first feeling approval flourishes and therefore gets more opportunity. The second, feeling insecure, languishes and eventually leaves.
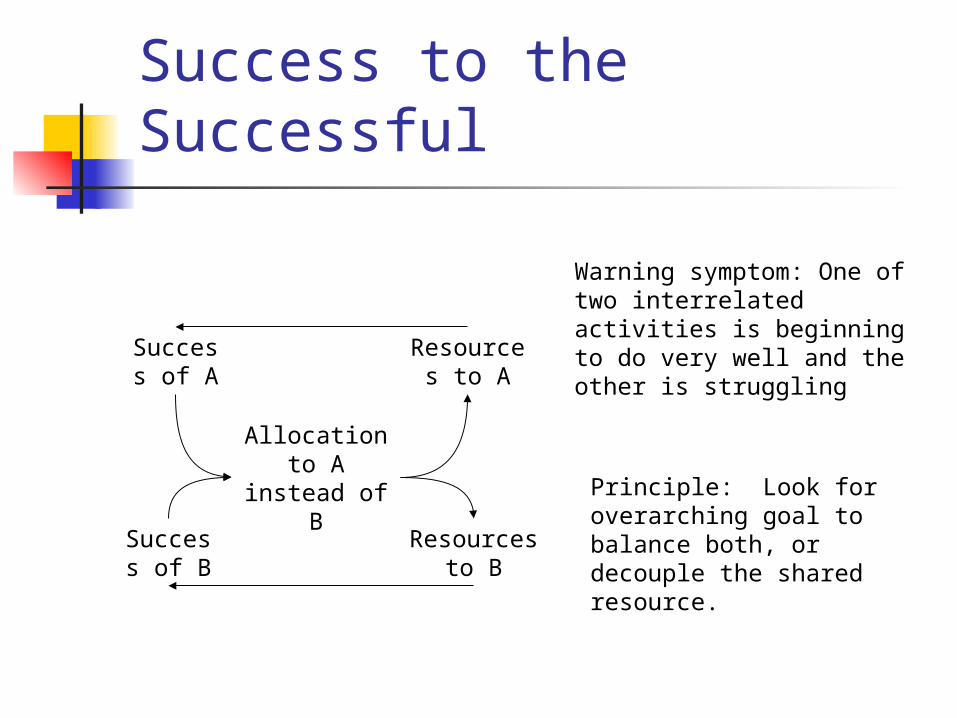
Success to the Successful
Allocation to A instead of B
Resourcesto B
Success of B
Resources to A
Success of A
Warning symptom: One of two interrelated activities is beginning to do very well and the other is struggling
Principle: Look for overarching goal to balance both, or decouple the shared resource.
Tragedy of the Commons
Individuals use a joint resource on the basis of individual need. At first they are rewarded for using it. Eventually they get diminished returns, which causes them to intensify their efforts. The resource becomes depleted.
Several divisions use a common retail sales force. Each is concerned that sales force will not give enough attention to their products. One manager sets higher than needed targets. Other managers followed. Sales force becomes tremendously overburdened, performance declines and turnover increases.
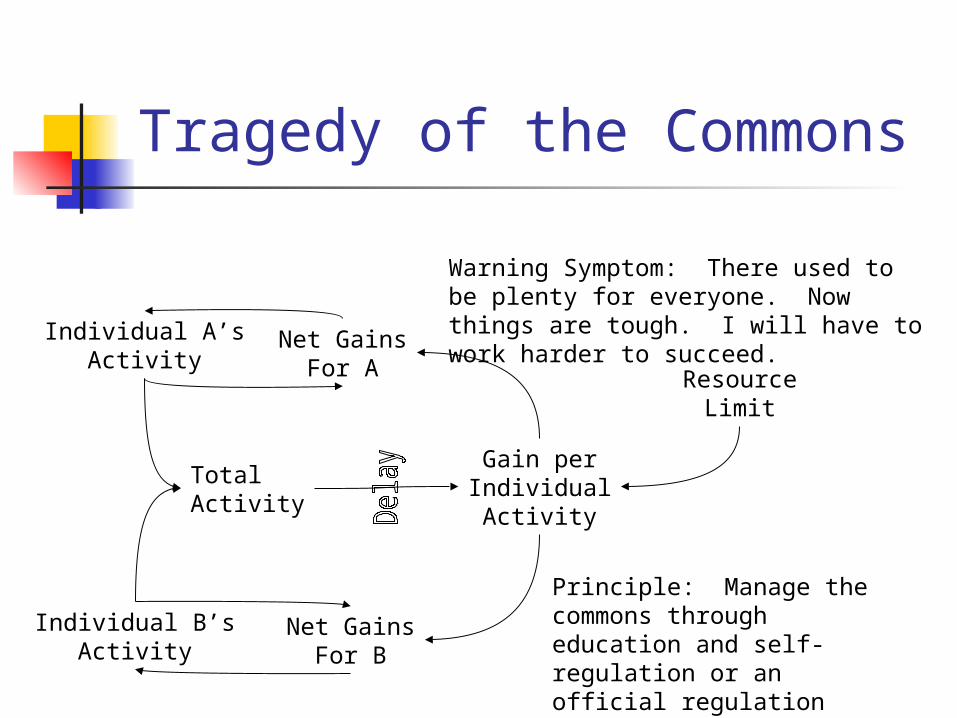
Tragedy of the Commons
TotalActivity
Individual B’sActivity
Net GainsFor B
Individual A’sActivity
Net GainsFor A Resource
Limit
Gain perIndividualActivity
Warning Symptom: There used to be plenty for everyone. Now things are tough. I will have to work harder to succeed.
Principle: Manage the commons through education and self-regulation or an official regulation
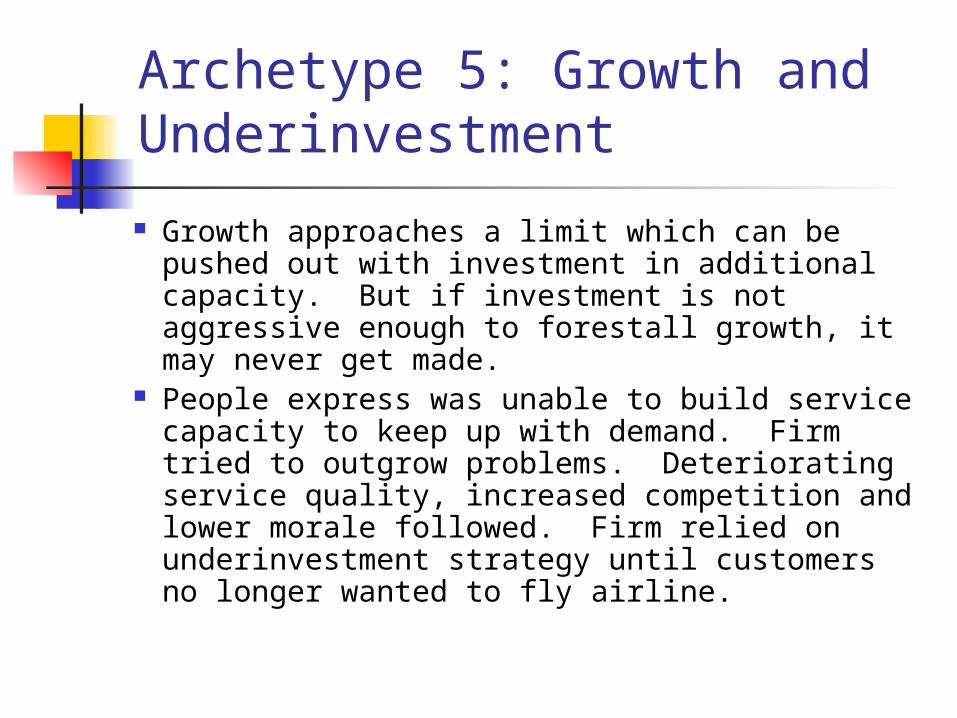
Archetype 5: Growth and Underinvestment
Growth approaches a limit which can be pushed out with investment in additional capacity. But if investment is not aggressive enough to forestall growth, it may never get made.
People express was unable to build service capacity to keep up with demand. Firm tried to outgrow problems. Deteriorating service quality, increased competition and lower morale followed. Firm relied on underinvestment strategy until customers no longer wanted to fly airline.
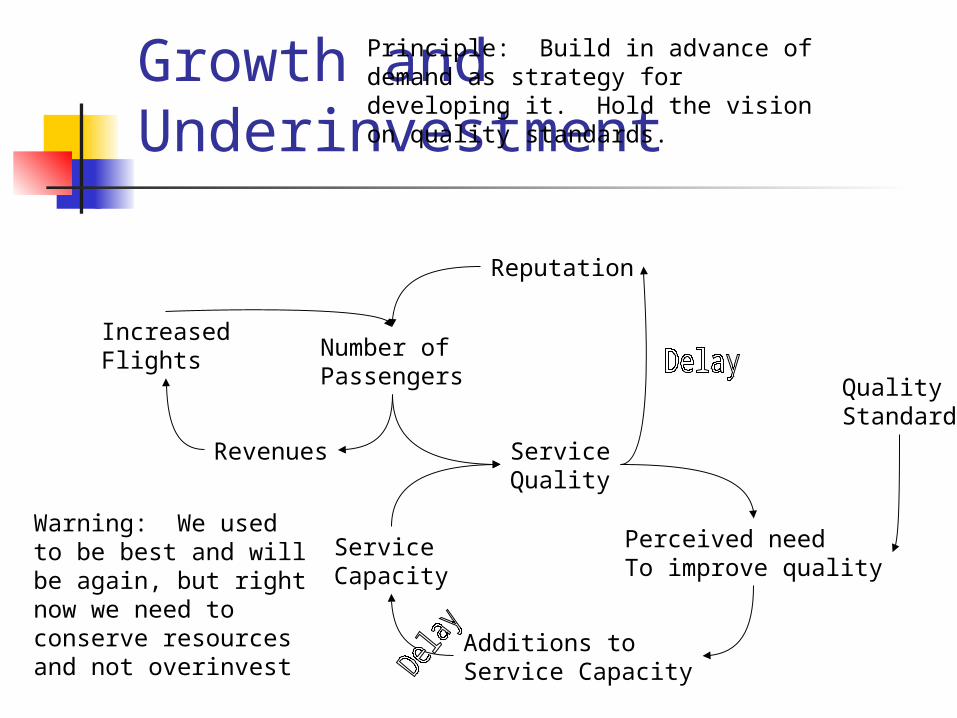
Growth and Underinvestment
Number ofPassengers
IncreasedFlights
Revenues
Reputation
ServiceQuality
Perceived needTo improve quality
Additions toService Capacity
ServiceCapacity
QualityStandard
Warning: We used to be best and will be again, but right now we need to conserve resources and not overinvest
Principle: Build in advance of demand as strategy for developing it. Hold the vision on quality standards.
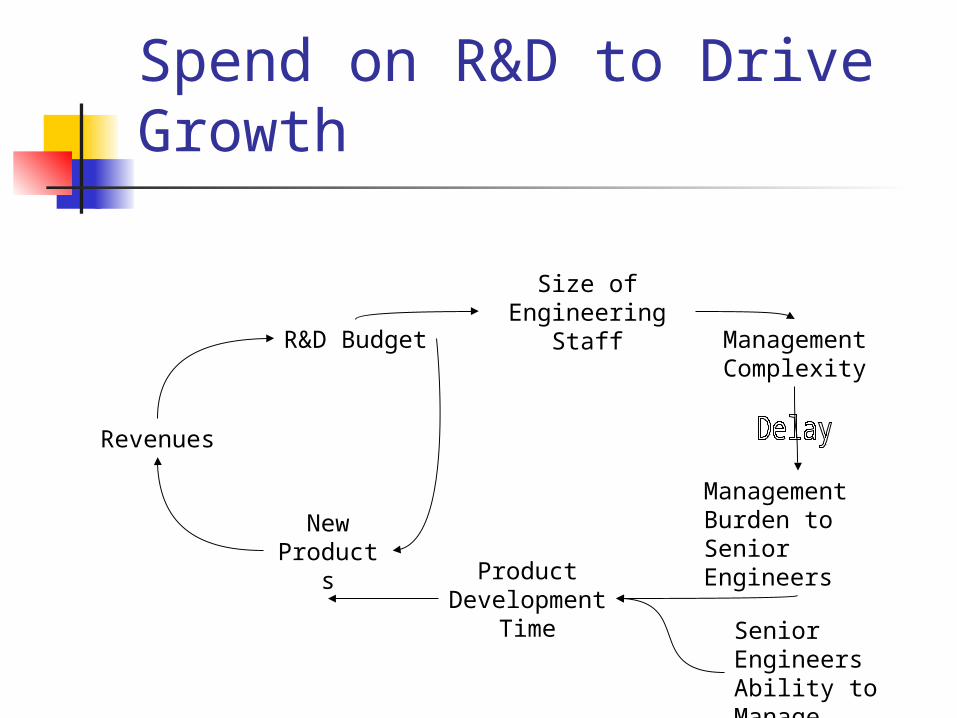
Spend on R&D to Drive Growth
Revenues
R&D Budget
New Products
Size of Engineering Staff
Management Complexity
Management Burden to Senior Engineers
Product Development
Time Senior Engineers Ability to Manage
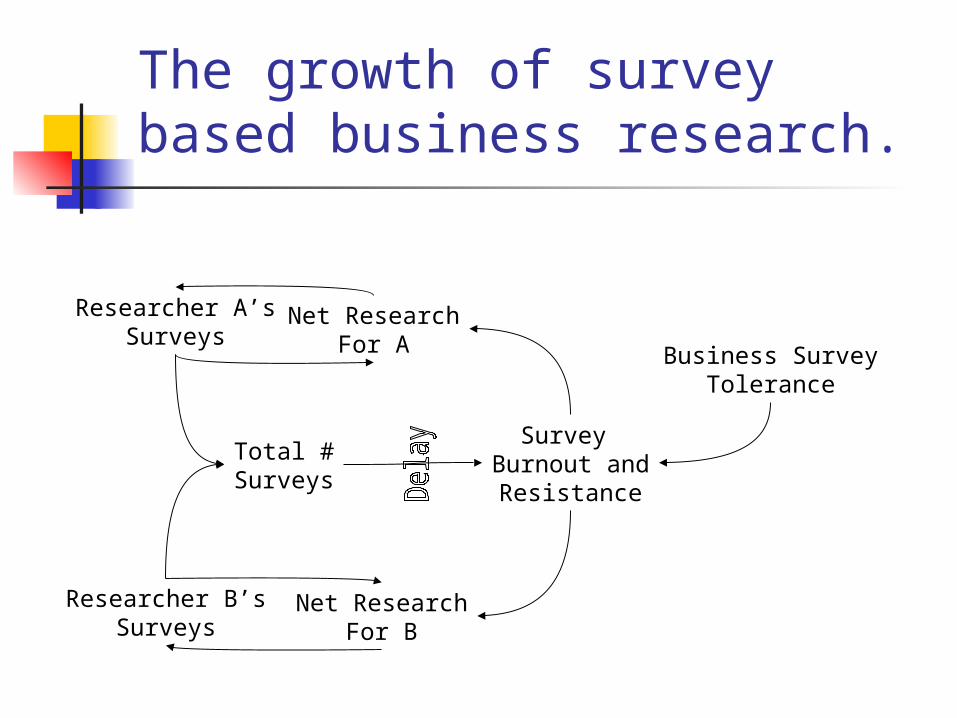
The growth of survey based business research.
Total #Surveys
Researcher B’sSurveys
Net ResearchFor B
Researcher A’sSurveys
Net ResearchFor A Business Survey
Tolerance
Survey Burnout andResistance
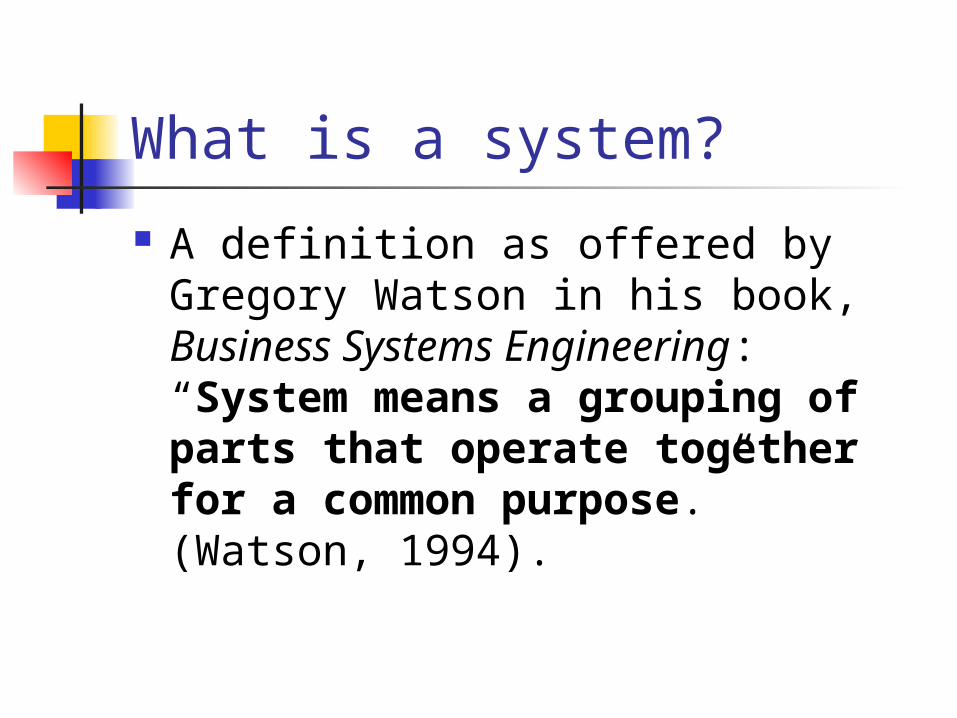
What is a system?
A definition as offered by Gregory Watson in his book, Business Systems Engineering: “System means a grouping of parts that operate together for a common purpose.” (Watson, 1994).
What is a System? (Cont’d) Definition as adapted from Random House Dictionary:
A system is an assemblage or combination of elements or parts forming a complex or unitary whole, such as a river system or a transportation system; any assemblage or set of correlated members, such as a system of currency; an ordered and comprehensive assemblage of facts, principles, or doctrines in a particular field of knowledge or thought, such as a system of philosophy; a coordinated body of methods or a complex scheme or plan of procedure, such as a system of organization and management; any regular or special method of plan or procedure, such as a system of marking, numbering, or measuring (Blanchard & Fabrychy, 1998).

What is Thinking? What, precisely, is thinking? When at the reception
of sense impressions, memory pictures emerge, this is not yet thinking. And when such pictures form a series, each member of which calls forth another, this too is not yet thinking. When, however, a certain picture turns up in many such series, then—precisely through such return—it becomes an ordering element for such series…Such an element becomes an instrument, a concept. I think the transition from free association of dreaming to thinking is characterized by the more or less dominating role which the concept plays in it (Einstein, in Schilpp, 1949).
Connectedness
“If you wish to understand a system, and so be in a position to predict its behavior, it is necessary to study the system as a whole. Cutting it up into bits for study is likely to destroy the system’s connectedness, and hence the system itself.” (Sherwood, 2002)
Connectedness
“If you wish to influence or control the behavior of a system, you must act on the system as a whole. Tweaking it in one place in the hope that nothing will happen in another is doomed to failure—that’s what connectedness is all about.” (Sherwood, 2002).
Systems Theory
General Systems Theory Chaos Theory Quantum Theory Ecological Theory
Systems Principles
Openness Purposefulness Multidimensionality Emergent property Counterintuitivess
Systems Thinking
Problem Solving Tool Pioneered By Biologists Looks At The Whole View Reduces Complexity Controls System Behavior
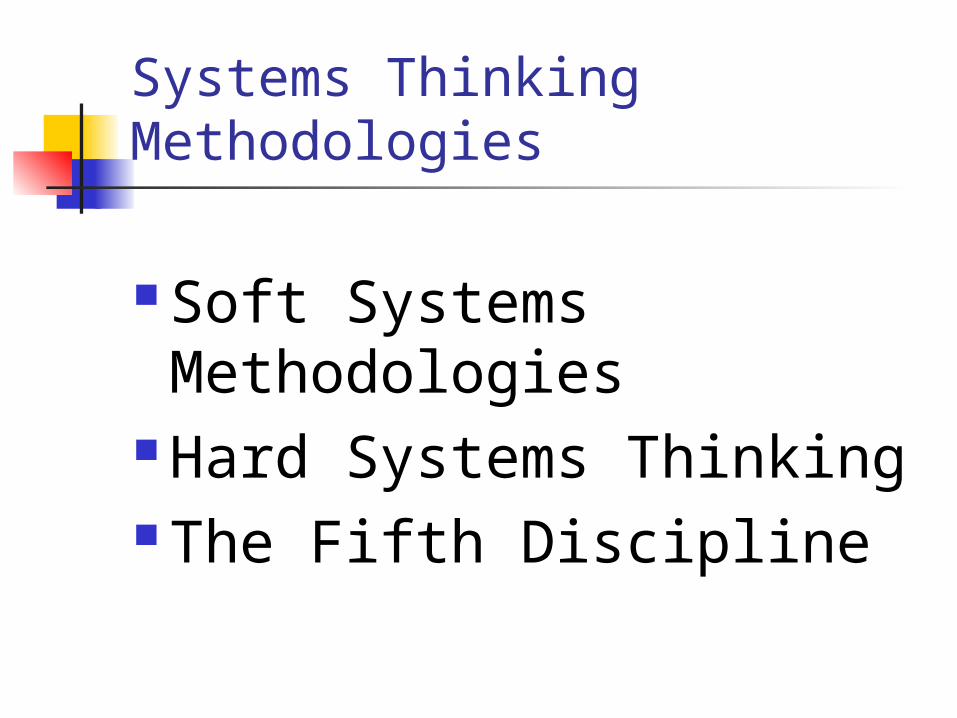
Systems Thinking Methodologies
Soft Systems Methodologies
Hard Systems Thinking The Fifth Discipline
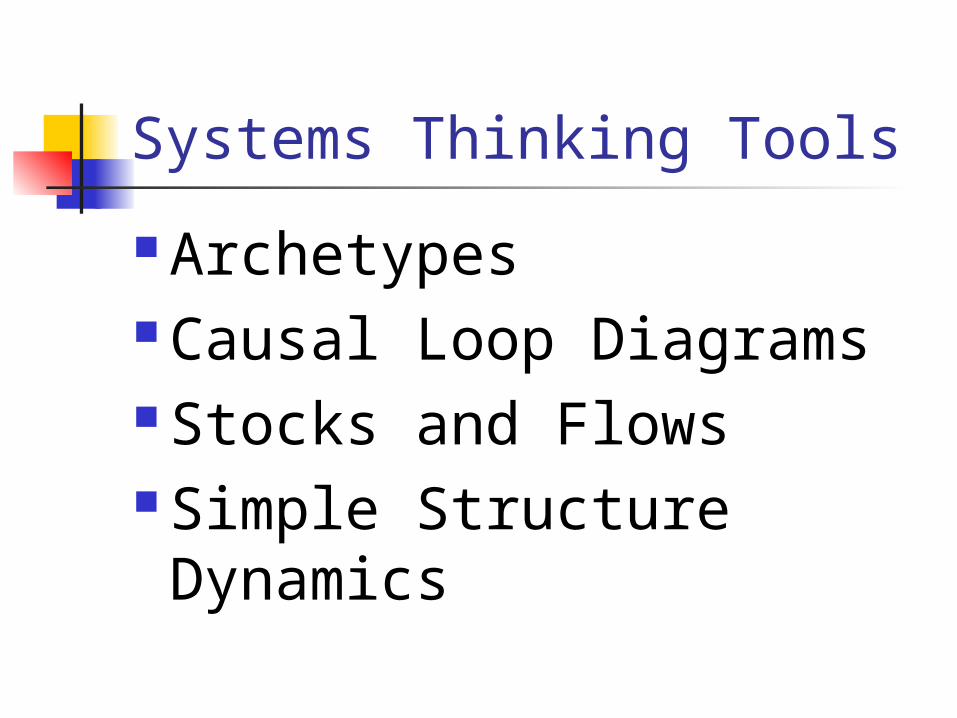
Systems Thinking Tools
Archetypes Causal Loop Diagrams Stocks and Flows Simple Structure Dynamics
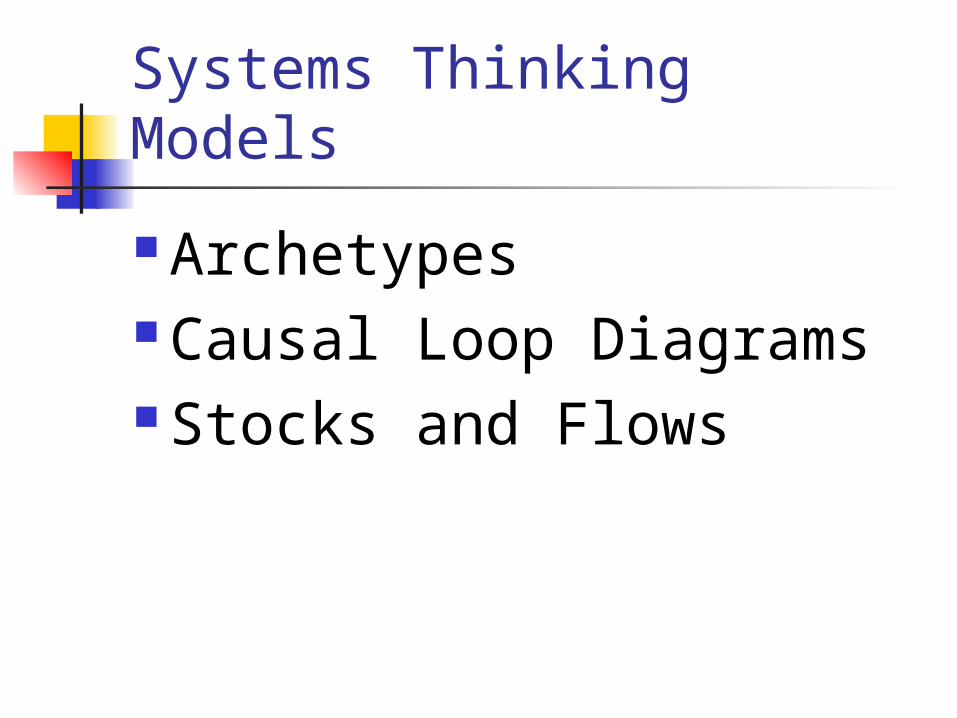
Systems Thinking Models
Archetypes Causal Loop Diagrams Stocks and Flows
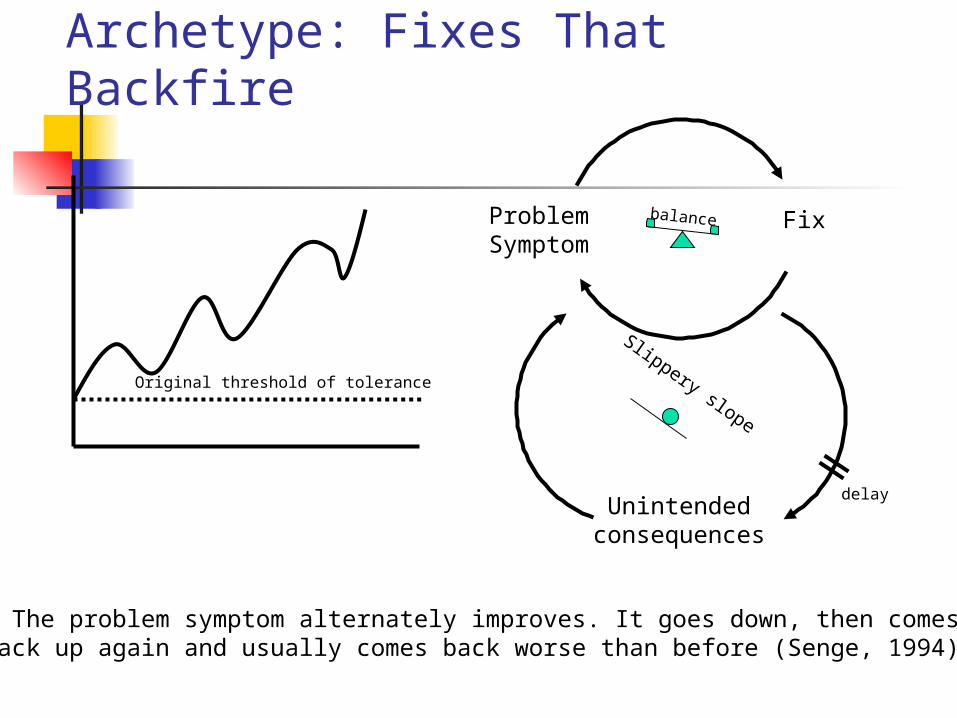
Archetype: Fixes That Backfire
The problem symptom alternately improves. It goes down, then comesBack up again and usually comes back worse than before (Senge, 1994).
Original threshold of tolerance
FixProblemSymptom
Unintendedconsequences
delay
Slippery slope
balance
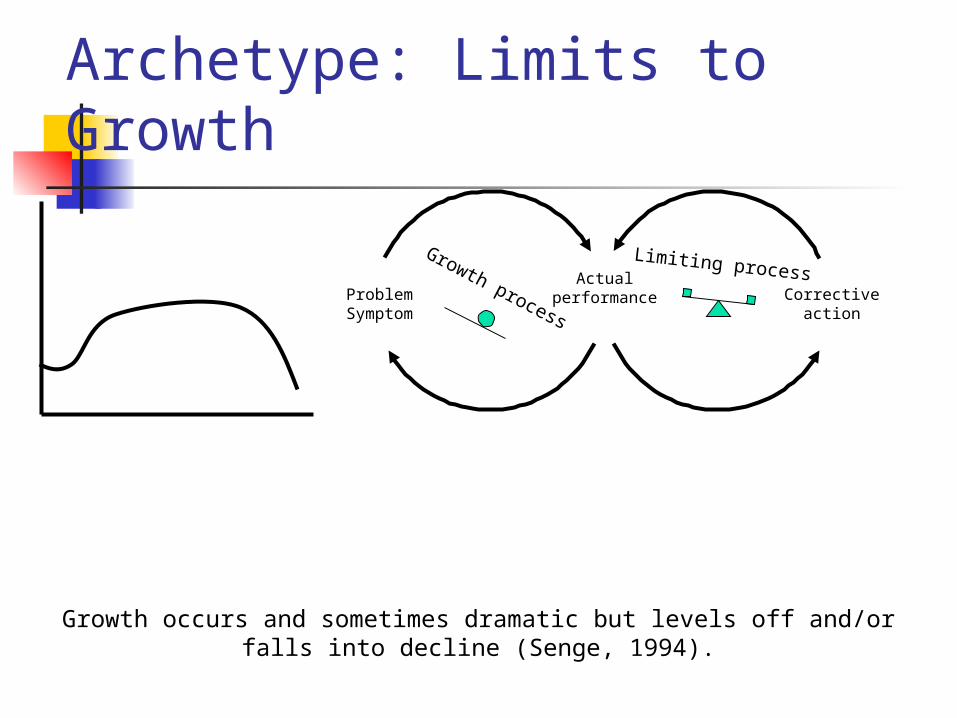
Archetype: Limits to Growth
Growth occurs and sometimes dramatic but levels off and/or falls into decline (Senge, 1994).
ActualperformanceProblem
Symptom
Growth process
Limiting processCorrective
action
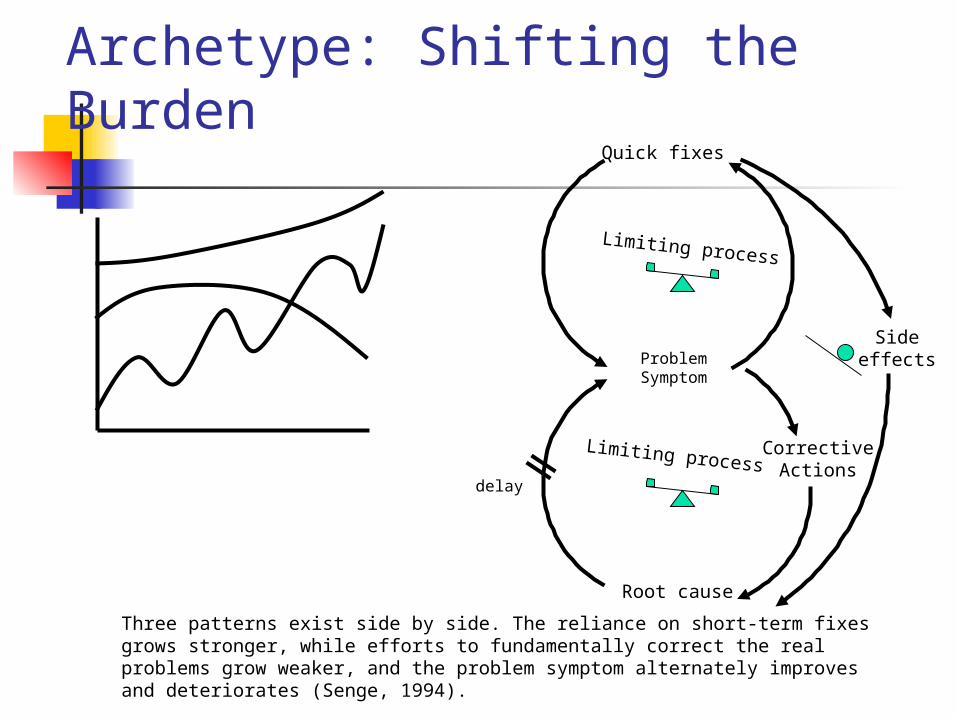
Archetype: Shifting the Burden
Three patterns exist side by side. The reliance on short-term fixes grows stronger, while efforts to fundamentally correct the real problems grow weaker, and the problem symptom alternately improves and deteriorates (Senge, 1994).
Limiting process
Quick fixes
ProblemSymptom
Root cause
Sideeffects
CorrectiveActions
delay
Limiting process
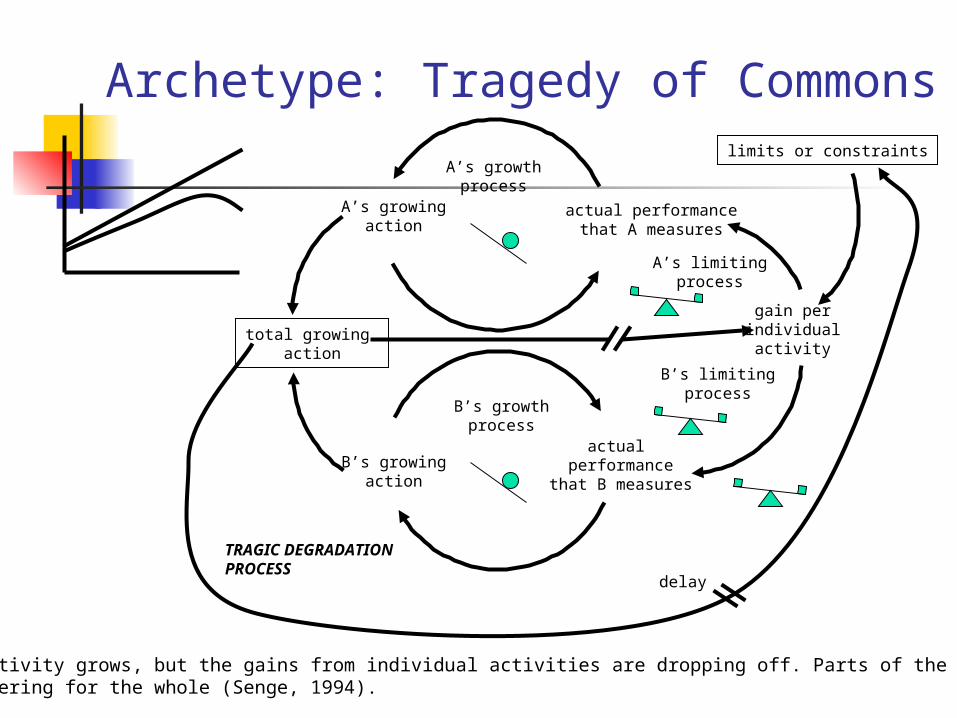
Archetype: Tragedy of Commons
Total activity grows, but the gains from individual activities are dropping off. Parts of the organizationare suffering for the whole (Senge, 1994).
A’s growthprocess
B’s growthprocess
A’s growingaction
actual performancethat A measures
A’s limitingprocess
limits or constraints
total growing action
gain perindividual
activity
B’s limitingprocess
B’s growingaction
TRAGIC DEGRADATIONPROCESS
actual performance
that B measures
delay
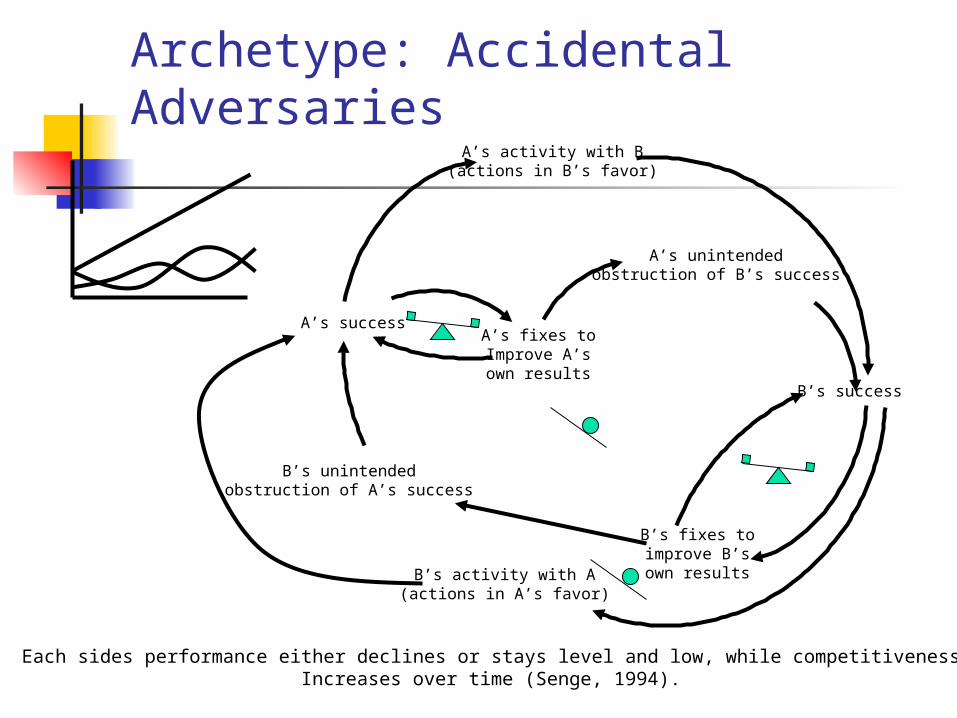
Archetype: Accidental Adversaries
Each sides performance either declines or stays level and low, while competitivenessIncreases over time (Senge, 1994).
A’s activity with B(actions in B’s favor)
B’s activity with A(actions in A’s favor)
A’s unintendedobstruction of B’s success
B’s unintendedobstruction of A’s success
A’s success
B’s success
A’s fixes toImprove A’sown results
B’s fixes toimprove B’sown results

Causal Loop Diagrams
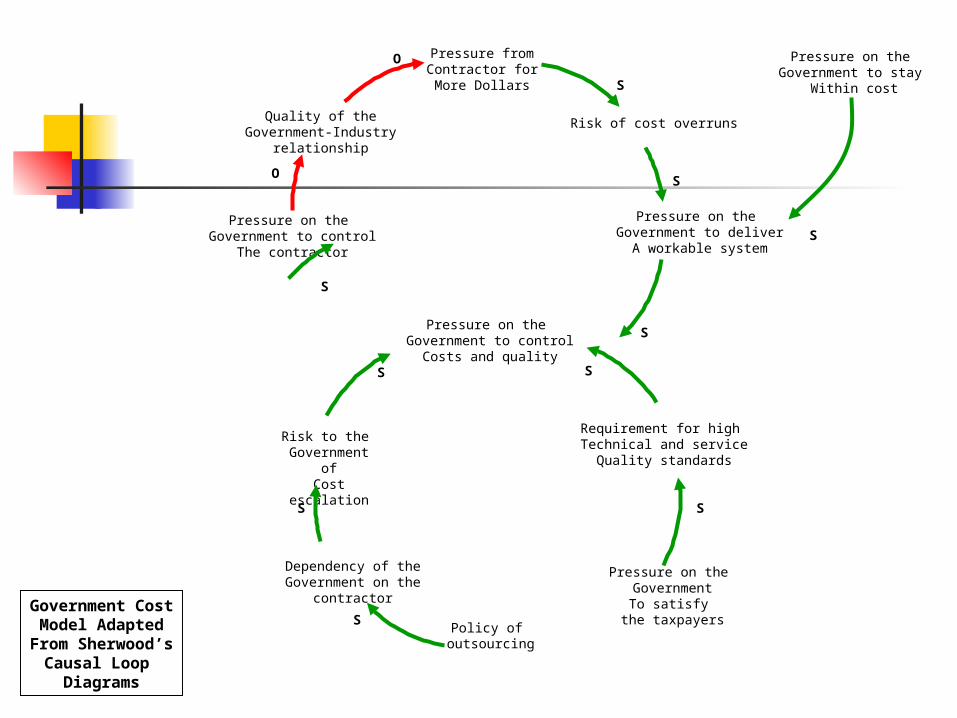
Pressure on the Government to stay
Within cost
Pressure on the Government to deliver
A workable system
Requirement for high Technical and service
Quality standards
Pressure on the GovernmentTo satisfy
the taxpayers
S
O
O
S
S
S
Dependency of theGovernment on the
contractor
Policy of outsourcing
Risk to the Government ofCost escalation
S
S
S
S
Pressure on the Government to control
Costs and quality
Pressure on the Government to control
The contractor
Quality of theGovernment-Industry
relationship
Pressure fromContractor forMore Dollars
Risk of cost overruns
S
S
S
Government CostModel Adapted
From Sherwood’sCausal Loop
Diagrams
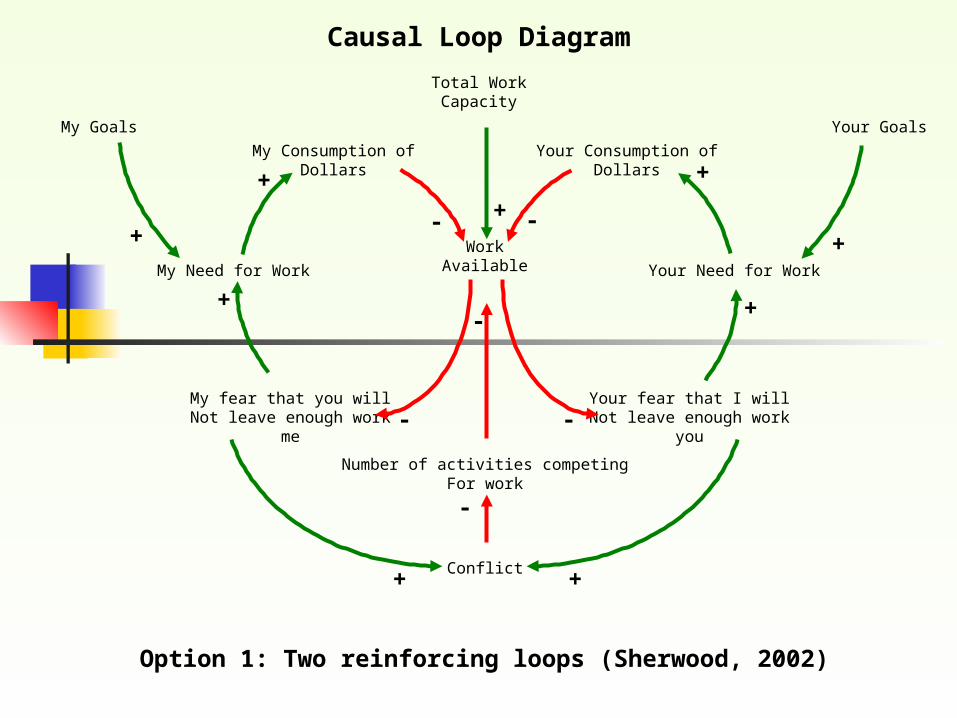
My Goals Your Goals
My Consumption ofDollars
Your Consumption ofDollars
Total WorkCapacity
WorkAvailableMy Need for Work Your Need for Work
My fear that you willNot leave enough work
me
Your fear that I willNot leave enough work
you
- + -
+
++
++
++
+
-
-
Conflict
Number of activities competingFor work
-
-
Causal Loop Diagram
Option 1: Two reinforcing loops (Sherwood, 2002)
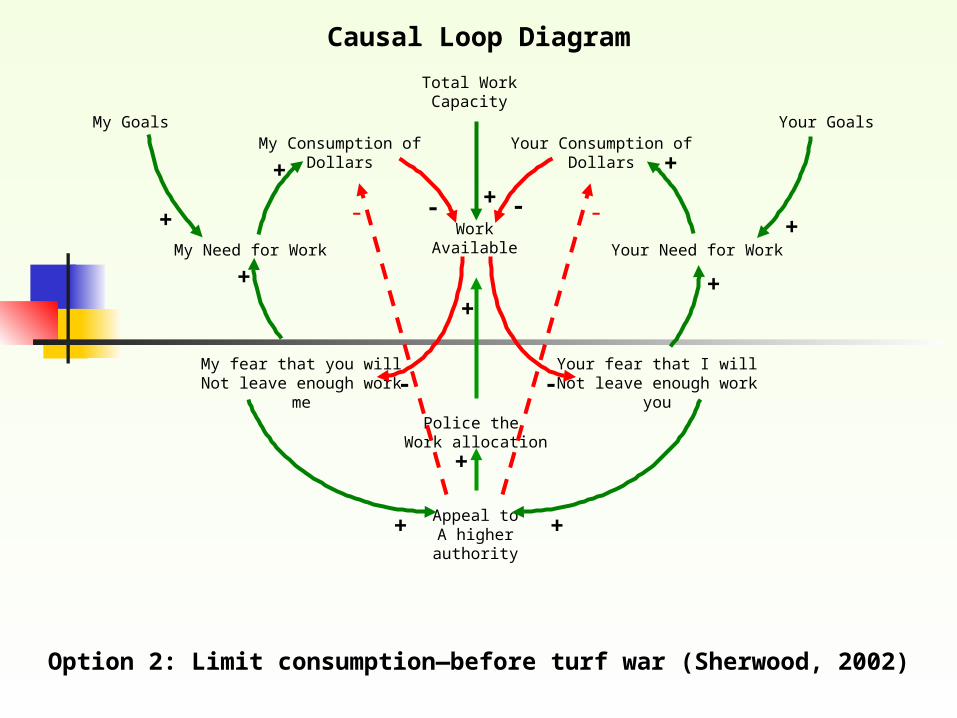
Causal Loop Diagram
Option 2: Limit consumption—before turf war (Sherwood, 2002)
My Goals Your GoalsMy Consumption of
DollarsYour Consumption of
Dollars
Total WorkCapacity
WorkAvailableMy Need for Work Your Need for Work
My fear that you willNot leave enough work
me
Your fear that I willNot leave enough work
you
- + -
+
++
++
++
+
-
+
Appeal toA higherauthority
Police the Work allocation
-
+
- -
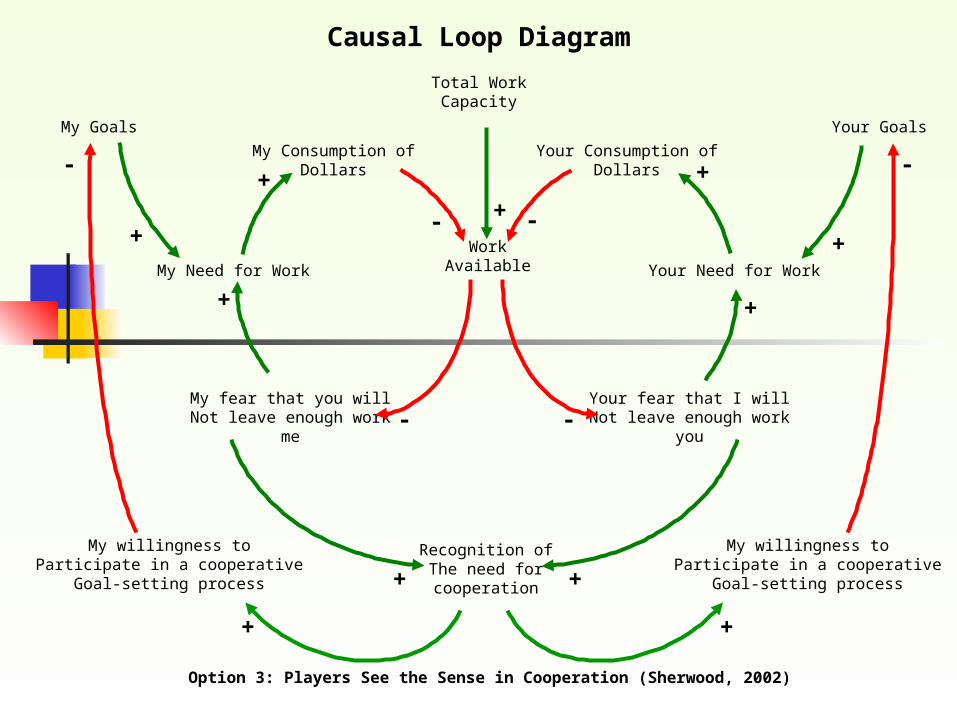
My Goals Your Goals
My Consumption ofDollars
Your Consumption ofDollars
Total WorkCapacity
WorkAvailableMy Need for Work Your Need for Work
My fear that you willNot leave enough work
me
Your fear that I willNot leave enough work
you
- + -
+
++
++
++
+
-
Recognition ofThe need forcooperation
-
Causal Loop Diagram
Option 3: Players See the Sense in Cooperation (Sherwood, 2002)
My willingness toParticipate in a cooperative
Goal-setting process
My willingness toParticipate in a cooperative
Goal-setting process
++
- -
Causal Loop Diagram
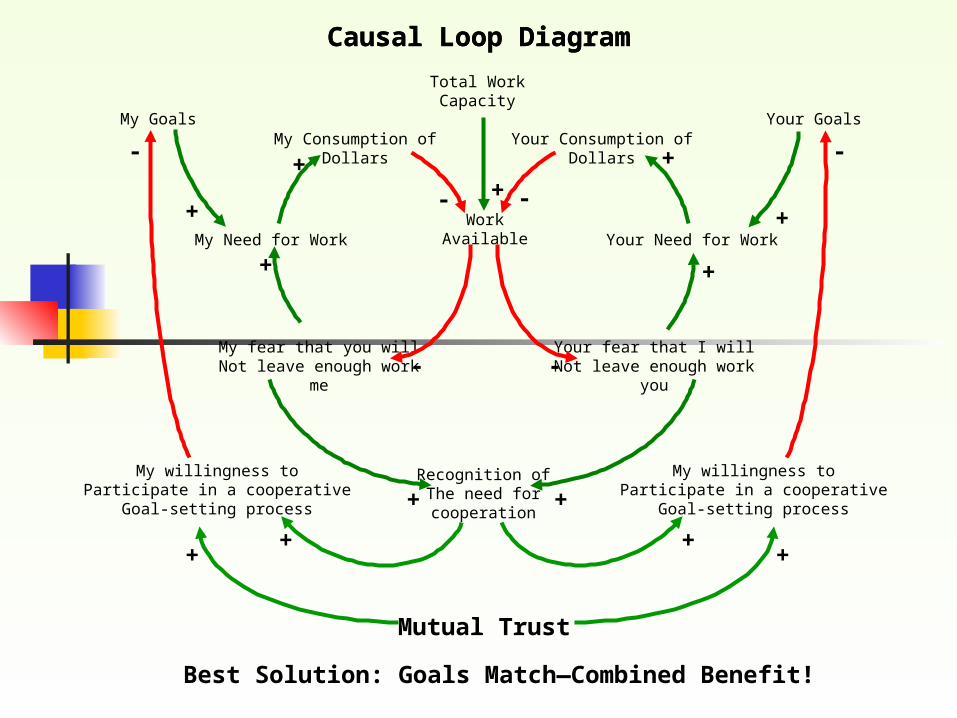
Best Solution: Goals Match—Combined Benefit!
Causal Loop Diagram
My Goals Your GoalsMy Consumption of
DollarsYour Consumption of
Dollars
Total WorkCapacity
WorkAvailableMy Need for Work Your Need for Work
My fear that you willNot leave enough work
me
Your fear that I willNot leave enough work
you
- + -
+
++
++
++
+
-
Recognition ofThe need forcooperation
-
My willingness toParticipate in a cooperative
Goal-setting process
My willingness toParticipate in a cooperative
Goal-setting process
++
- -
Mutual Trust
+ +
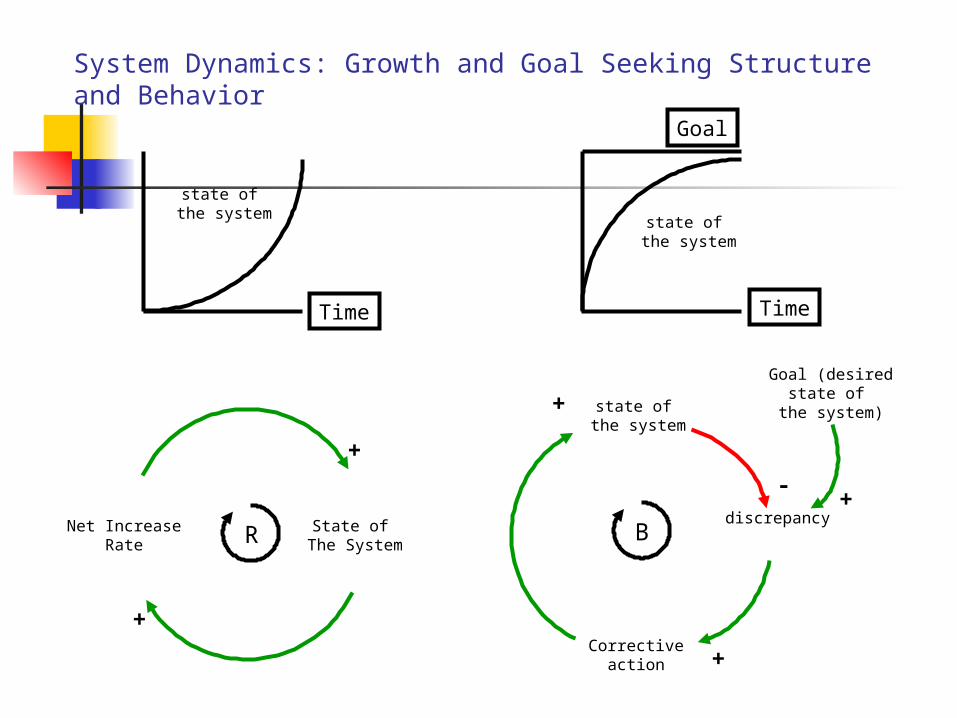
Time Time
Goal
State of The System
Net IncreaseRate
+
+
R B
state of the system
state of the system
state of the system
Correctiveaction
discrepancy
Goal (desiredstate of
the system)
-
+
+
+
System Dynamics: Growth and Goal Seeking Structure and Behavior
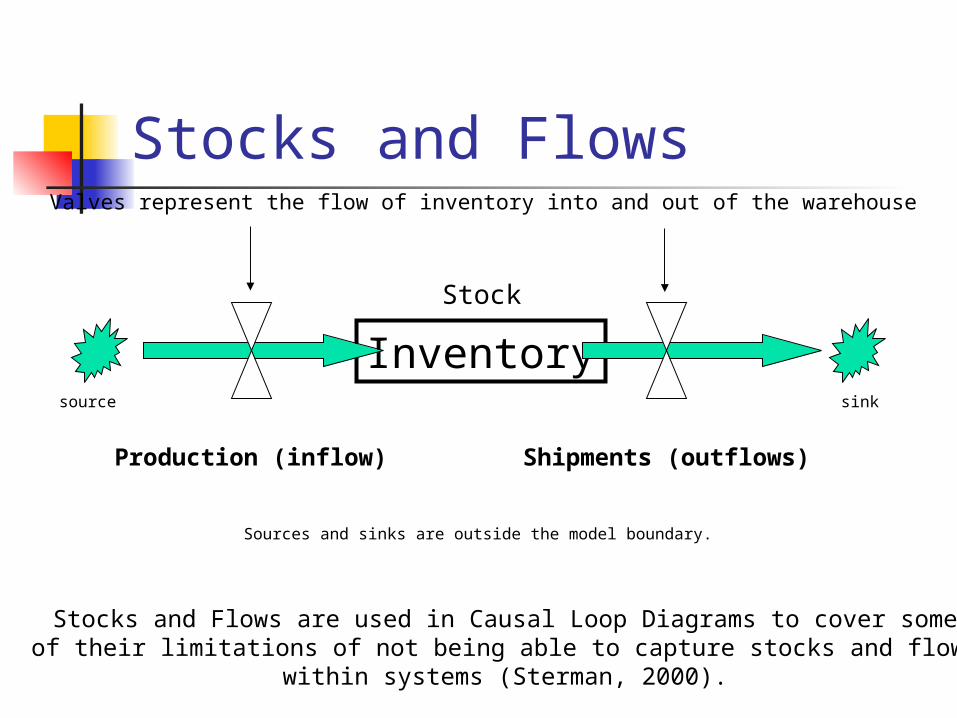
Stocks and Flows
Inventory
Stock
Production (inflow) Shipments (outflows)
source sink
Valves represent the flow of inventory into and out of the warehouse
Sources and sinks are outside the model boundary.
Stocks and Flows are used in Causal Loop Diagrams to cover someof their limitations of not being able to capture stocks and flows
within systems (Sterman, 2000).
Some Models from Soft SystemsMethodology--Checkland
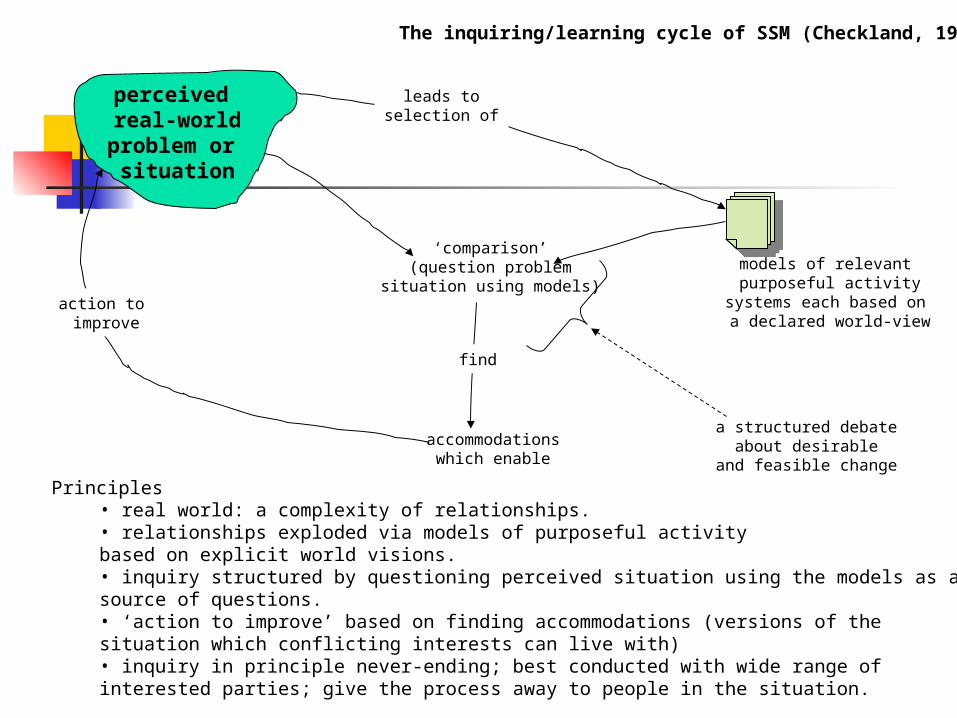
perceived real-world
problem or situation
models of relevant purposeful activity
systems each based on a declared world-view
‘comparison’(question problem
situation using models)
accommodationswhich enable
Principles• real world: a complexity of relationships.• relationships exploded via models of purposeful activitybased on explicit world visions.• inquiry structured by questioning perceived situation using the models as asource of questions.• ‘action to improve’ based on finding accommodations (versions of the situation which conflicting interests can live with)• inquiry in principle never-ending; best conducted with wide range ofinterested parties; give the process away to people in the situation.
leads toselection of
action to improve
find
a structured debateabout desirable
and feasible change
The inquiring/learning cycle of SSM (Checkland, 1999)
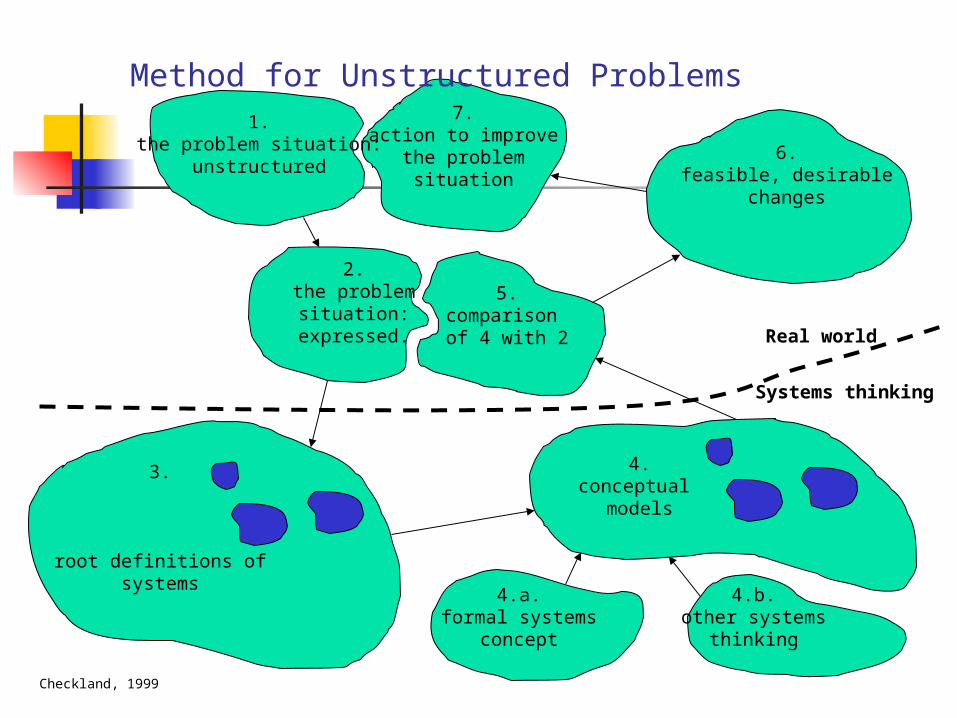
1.the problem situation:
unstructured
7.action to improve
the problemsituation
6.feasible, desirable
changes
2.the problem
situation:expressed.
5.comparison of 4 with 2
3.
root definitions ofsystems
4.conceptual
models
4.a.formal systems
concept
4.b.other systems
thinking
Method for Unstructured Problems
Checkland, 1999
Real world
Systems thinking
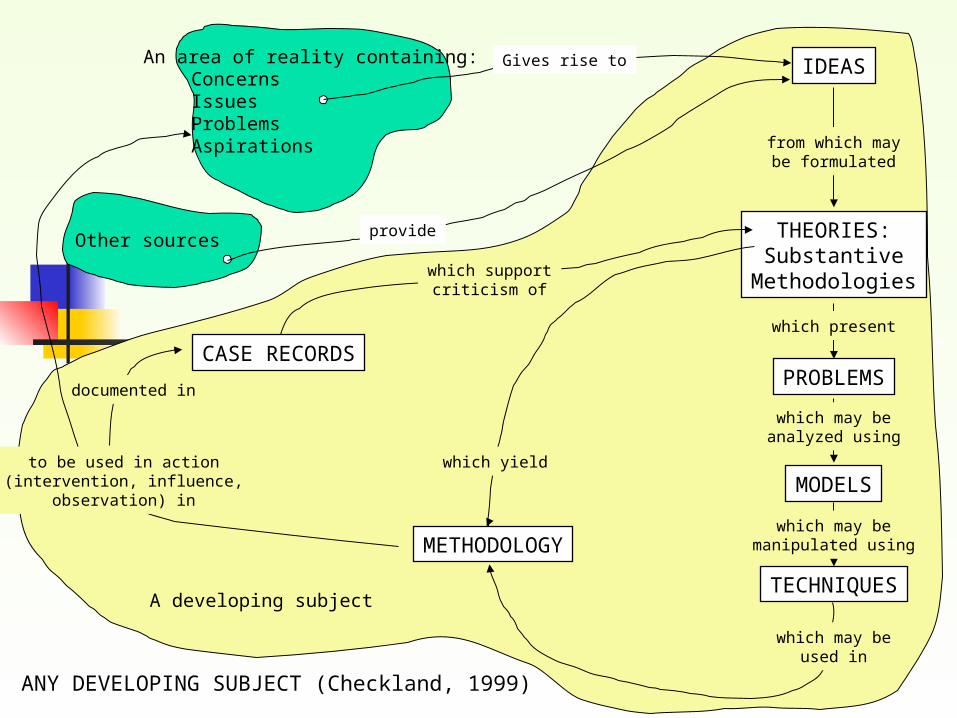
IDEAS
THEORIES:Substantive
Methodologies
PROBLEMS
MODELS
TECHNIQUES
METHODOLOGY
CASE RECORDS
An area of reality containing:ConcernsIssuesProblemsAspirations
Other sources
ANY DEVELOPING SUBJECT (Checkland, 1999)
Gives rise to
from which maybe formulated
which present
which may beanalyzed using
which may bemanipulated using
which may beused in
which yield
provide
documented in
which supportcriticism of
A developing subject
to be used in action(intervention, influence,
observation) in
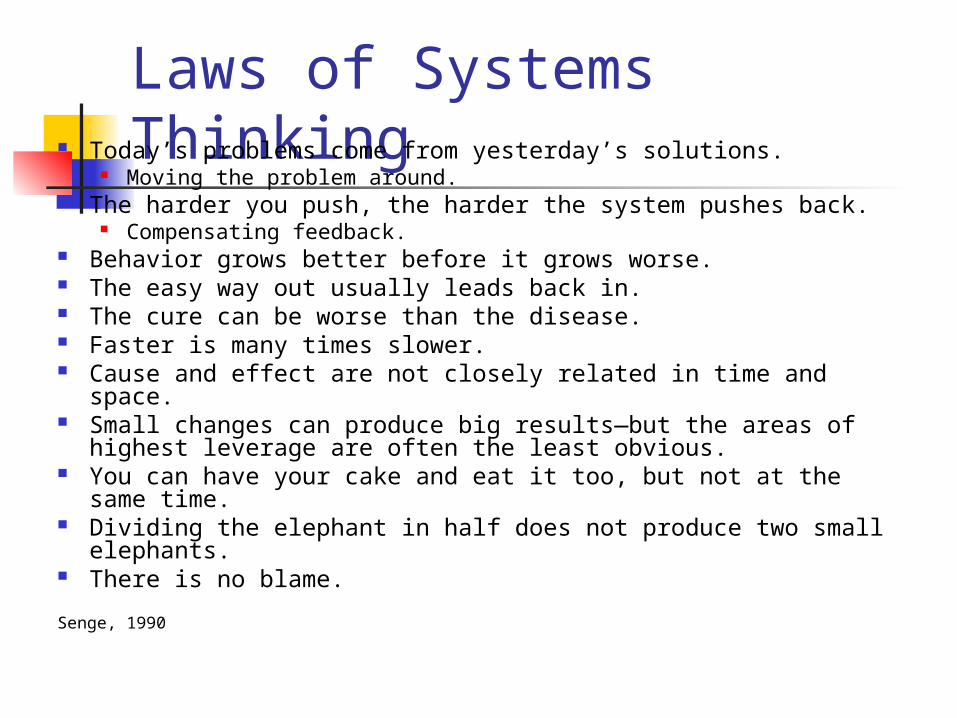
Laws of Systems Thinking Today’s problems come from yesterday’s solutions. Moving the problem around.
The harder you push, the harder the system pushes back. Compensating feedback.
Behavior grows better before it grows worse. The easy way out usually leads back in. The cure can be worse than the disease. Faster is many times slower. Cause and effect are not closely related in time and space. Small changes can produce big results—but the areas of
highest leverage are often the least obvious. You can have your cake and eat it too, but not at the same
time. Dividing the elephant in half does not produce two small
elephants. There is no blame.
Senge, 1990