Embed Size (px)
Citation preview

1
ii
Introduction
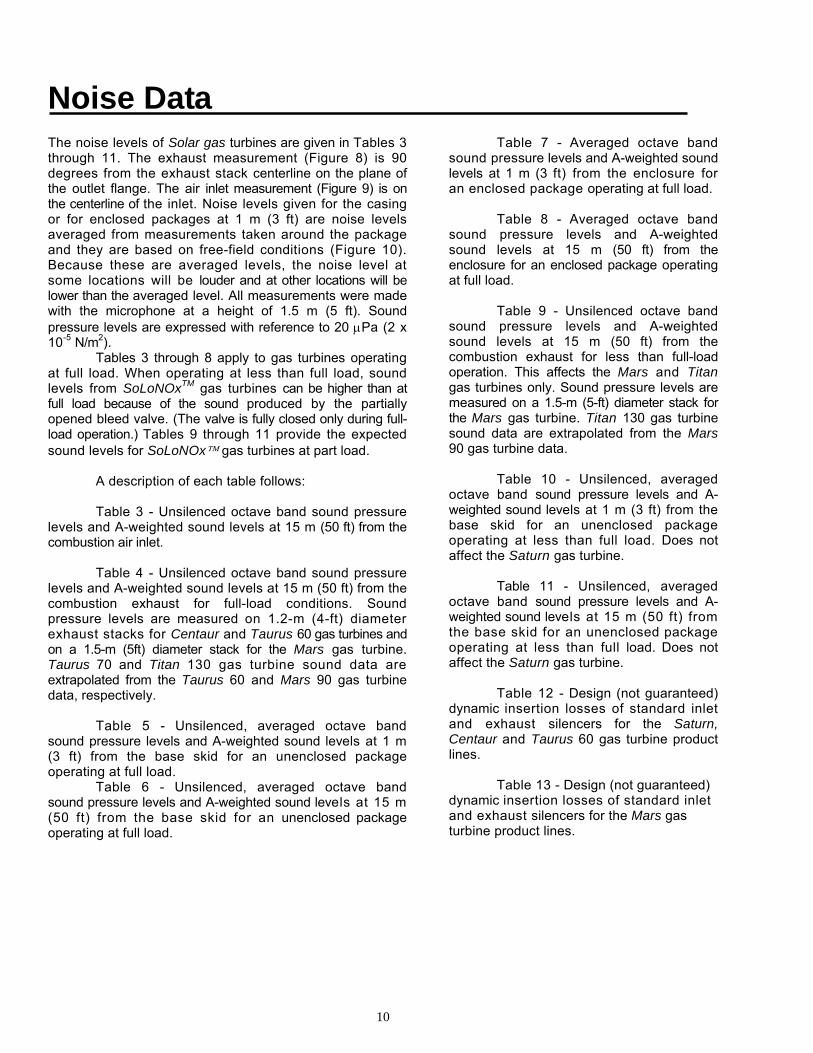
This paper provides information for use in predict-ing the noise levels from a gas turbine site at a receiver a specified distance from the installation. Site conditions such as topography, equipment arrangement, the presence of reflective surfaces, meteorological conditions, ground cover, and other noise sources, will affect the noise levels mea-sured at the receiver. These factors must be ac-counted for in the noise analysis of an installation. Because the consideration of these factors re-quires expertise in the field of noise control engi-neering, detailed treatment of a site analysis is beyond the scope of the paper. This paper will utilize atmospheric absorption, distance spreading, directivity, and noise source combination, in demonstrating the procedure to follow in performing a site noise analysis. Often, only these four factors are needed in performing the analysis.
If desired, Solar can provide a detailed noise analysis and report for use in environmental impact statements or for submittal to state or local authorities. In order to perform this analysis, site drawings, a description of the area, and an equipment list are required. The noise criteria, if specified, are also needed.
Unsilenced noise data for the Saturn®, Centaur®, TaurusTM, Mars®, and TitanTM gas tur-bines are found in the section on "Noise Data." The procedure for selection of combustion air inlet silencers and exhaust silencers is explained in the text.
Octave band sound pressure levels and A-weighted sound levels at 1 m (3 ft) from the base skid of the gas turbine and driven equipment are included for use in predicting workplace sound levels.
Because building effects, piping, topological and meteorological conditions, and other noise sources are not considered in the predictive procedures demonstrated in this publication, actual noise levels may exceed predicted levels.
Specifications for gas turbines can have noise criteria that apply to the near-field, far-field, or both.
These criteria must be considered separately: near-field noise data cannot be used to reliably predict far-field noise levels.
ACOUSTICAL ENCLOSURE Solar's acoustical enclosure is designed to maximize sound attenuation and gas turbine accessibility. These are decidedly conflicting objectives. Nevertheless, the design objective of the acousti-cally enclosed Solar® gas turbine package is an A-weighted sound level of 85dBA, based on a free-field environment. When responding to specifica-tions having near-field, 1 m (3 ft), noise criteria, the following statement should be used:
The package A-weighted sound level is
guaranteed to meet an average of 85 dBA at 1 m (3 ft) from the enclosure, at a height of 1.5 m (5 ft), as measured at points spaced, typically, at 1.5 to 3.0 m (5 to 10 ft) apart around the enclosure, when installed in a free field. These sound levels are exclusive of piping, other equipment, reflected sound or contributing site conditions.
For Mars gas turbine packages, the following
statement is also required:
Acoustical lagging is required for the combustion air inlet ducting. The acoustical lagging must extend from the top of the enclosure to the inlet flange of the inlet silencer.
Solar's Ancillary Engineering Group can provide
information about the recommended material and installation for acoustical lagging or for other special requirements.
SPECIAL NOISE CONTROL COMPONENTS When noise criteria cannot be met with the use of standard components, special oil coolers, com-bustion air inlet and exhaust silencers and enclosures can be supplied. Contact Solar's Ancillary Engineering Group for assistance.

iii
Contents
Noise Criteria����������������������������������������.. COMMUNITY NOISE CRITERIA �������������������������������� FEDERAL ENERGY REGULATORY COMMISSION CRITERIA������������������� NEAR-FIELD CRITERIA �����������������������������������.. NEAR-FIELD CRITERIA IN OUTDOOR INSTALLATIONS ��������������������.. Noise Sources���������������������������������������� VIBRATION ISOLATION ������������������������������������. OCTAVE BAND PREFERRED FREQUENCIES AND FREQUENCY BANDS ������������.. WEIGHTED SOUND LEVELS ��������������������������������� COMMUNITY RESPONSE TO NOISE �����������������������������. Physical Properties of Sound ���������������������������������.. DISTANCE SPREADING �����������������������������������. TEMPERATURE INVERSION ��������������������������������� ATMOSPHERIC ABSORPTION ��������������������������������. DIRECTIVITY EFFECTS �����������������������������������. COMBINING SOUND LEVELS ��������������������������������.. Noise Data ������������������������������������������.. Sample Calculations �������������������������������������.. MORE THAN ONE GAS TURBINE ������������������������������� CALCULATING THE DAY/NIGHT SOUND LEVEL (LDN) ���������������������. Source Sound Power Levels ���������������������������������� Glossary ������������������������������������������. ACOUSTICAL TERMINOLOGY ��������������������������������. References�����.. ������������������������������������
1 1 1 2 2 3 3 3 3 4 6 6 6 6 6 8 10 172020 21 2222 23
iv
Illustrations 1 A-Weighted Day/Night Sound Levels in U.S. Cities ���������������������..
2 Sound Level Meter-Weighted Frequency Response Characteristics��������������..
3 Typical A-Weighted Sound Levels of Representative Noise Sources��������������.
4 Corrections of Octave Band Sound Pressure Levels for Distance���������������.
5 Exhaust Stack Directivity���������������������������������.
6 Combining Two Sound Levels, L1 and L2��������������������������..
7 Combining Sound Levels ��������������������������������..
8 Exhaust Measurement Position������������������������������.
9 Inlet Measurement Position��������������������������������
10 Casing Measurement Position������������������������������.
11 Site Example��������������������������������������.
12 Noise Analysis Form�����������������������������������..
13 Noise Analysis Example���������������������������������
Tables 1 Frequencies and Frequency Bands����������������������������.
2 Directivity of a Vertical Stack�������������������������������.
3 Combustion Air Inlet at 15 m (50 ft)����������������������������..
4 Combustion Exhaust at 15 m (50 ft), Full Load�����������������������..
5 Unenclosed Package at 1 m (3 ft), Full Load������������������������..
6 Unenclosed Package at 15 m (50 ft), Full Load�����������������������..
7 Enclosed Package at 1 m (3 ft), Full Load�������������������������..
8 Enclosed Package at 15 m (50 ft), Full Load������������������������..
9 Combustion Exhaust at 15 m (50 ft), Less than Full Load�������������������..
10 Unenclosed Package at 1 m (3 ft), Less than Full Load�������������������..
11 Unenclosed Package at 15 m (50 ft), Less than Full Load������������������.
12 Design Dynamic Insertion Losses for Saturn, Centaur, and Taurus Turbine Silencers�������
13 Design Dynamic Insertion Losses for Mars Turbine Silencers �����������������..
1
4
5
7
7
9
9
11
11
11
17
18
19
3
8
12
12
13
13
14
14
15
15
15
16
16

v
Conversion Chart
ABBREVIATIONS
Caterpillar is a registered trademark of Caterpillar Inc. Solar, Satu rn , Cen tau r , Tau rus , Mars , T i t an and SoLoNO, are trademarks of Solar Turbines Incorporated. Specif icat ions subject to change without notice. Printed in U.S.A. © 1998 Solar Turbines Incorporated. All rights reserved.
CONVERSION FACTORS
PA98045M

1
Noise CriteriaCOMMUNITY NOISE CRITERIA Noise specifications, as they apply to gas turbine installations, are generally based on local, state, or federal criteria in the United States, and on local, county, or provincial criteria in other countries. In the United States, they are generally based on A-weighted sound levels or on day/night average sound levels (Ldn), although some ordinances include octave band sound pressure level criteria. Two common criteria are an A-weighted sound level of 45 dBA and an Ldn of 55 dB (which really is also an A-weighted criterion). However, other ordinances based on ambient sound levels, and which state, in effect, that the ambient sound level cannot be increased, can be much more stringent. Ambient A-weighted sound levels in rural areas are often measured as low as 40 dBA and can be as low as 30 dBA. A summary of A-weighted daytime and nighttime sound levels in U.S. cities is given in Figure 1 (Beranek, 1988).
However, emergency equipment, such as standby electric generator sets, are generally al-lowed to operate at higher noise levels, typically as much as 10 dBA above the maximum allowed for continuously operated noise sources.
FEDERAL ENERGY REGULATORY COMMISSION CRITERIA
The Federal Energy Regulatory Commission (FERC) currently requires that all new compressor stations under its jurisdiction meet an Ldn of 55 dB at the nearest noise sensitive area. This criterion is applied to the new compressor station or to the additional gas turbine at an existing station.
If the gas turbine is being added to a station with existing horsepower, FERC may also request a field noise survey of the existing station. The noise survey will provide noise data which FERC will use to assess the impact of the additional horse-power on the existing noise levels. FERC may
35 40 45 50 55 60 65 70 75 80 85 90 95
A-WEIGHTED LEVEL, dBA
SPNP 002M Figure 1. A-Weighted Day/Night Sound Levels in U.S. Cities

2
also examine its record of the existing station to determine if noise complaints have been lodged against the station by residents. If there have been complaints, FERC may require the applicant to conduct an assessment to determine the practicality of remedial noise treatment of the existing station.
If the gas turbine being installed is a replacement for existing horsepower, a noise analysis is not required if there is no net increase in station horsepower.
NEAR-FIELD CRITERIA Currently, in the United States, workplace noise criteria are based on the federal Occupational Safety and Health Administration (OSHA). The OSHA requirement that a hearing conservation program must be instituted when an employee's time-weighted average (TWA) equals or exceeds 85 dBA is the reason that noise specifications sometimes specify a guaranteed maximum sound level of 85 dBA at 1 m (3 ft) from the enclosed gas turbine package. (Given that the action level is 85 dBA, it might be better to specify that the sound level must be less than 85 dBA.) In most other countries that have workplace noise criteria, the action level is also 85 dBA, although in some countries a 90 dBA action level is used.
Enclosures meeting requirements for a guaranteed sound level not exceeding 85 dBA are available, but these enclosures are more expensive than the standard enclosure and they must be constructed more tightly. Tighter construction significantly reduces maintenance access to the gas turbine package.
The problem of reduced access can be met with offskid enclosures. However, these are even more expensive than onskid, improved performance en-closures, and they significantly increase the space occupied by a gas turbine package by adding as much as 1.8 m (6 ft) to the length and width of the standard package.
Specifications for a guaranteed 85 dBA at 1 m (3 ft) from the enclosure also often do not consider the room effect or other noise sources in
the room, including other gas turbine packages. Therefore, the sound level in the gas turbine room will usually exceed 85 dBA, even if the enclosed package by itself meets an 85 dBA criterion at 1 m (3 ft).
The employer has a clear advantage if the sound level in the turbine room is maintained below 85 dBA: no one will have an eight hour TWA of 85 dBA and no hearing conservation program will be re-quired. This assumes that employees who work in the gas turbine room during part of the day and in other areas the rest of the day are not exposed to higher sound levels in those other areas. How-ever, the benefit of specifying a guaranteed 85 dBA at 1 m (3 ft) from the enclosure is rarely realized because: • Specifications for 85 dBA (and even 90 dBA) at 1
m (3 ft) from the enclosure are often written in the belief that these are maximum exposures allowed by OSHA.
• Sound level in the turbine room is expected to be 85 to 90 dBA if the standard acoustical enclosure is used.
• Employees do not normally spend their entire eight-hour work day in the gas turbine room.
For these reasons, a guaranteed maximum
of 85 dBA at 1 m (3 ft) from the enclosure should be specified only when knowledgeable persons have concluded that such a requirement is necessary. In which case, a nonstandard acoustical enclosure must be used.
NEAR-FIELD CRITERIA IN OUTDOOR INSTALLATIONS When the gas turbine package will be installed outdoors, the selection of the inlet and exhaust silencers will not affect the near-field sound levels; i.e., at 1 m (3 ft) from the enclosure. This is because the noise limiting source is the enclosure; improving the inlet and exhaust silencers beyond the insertion loss values of the lowest performing standard silencers will not decrease the average sound level from the gas turbine package.

3
Noise Sources Noise sources typical of a gas turbine installation are the gas turbine combustion air inlet and exhaust, and the gas turbine casing (including gas turbine and gearbox) and driven equipment. Other noise sources often include cooling towers, fuel gas compressor skids, fuel gas coolers, lube oil coolers, transformers, blow-down vents, and process piping. Generally, when the gas turbine is installed inside a building, the building noise contribution at a far-field receiver is below the noise levels from the other sources.
If the gas turbine is installed in a building, casing and driven equipment noise become an aspect of noise transmitted through the building walls. Noise from building ventilation systems must also be considered. All of these noise sources must be added and compared with the noise criteria. Noise control systems must be designed to prevent the site sound level from exceeding the criteria.
VIBRATION ISOLATION Structure-borne vibrations from a gas turbine are generally at frequencies above building resonances. Exceptions exist for driven equipment having rotating or reciprocating frequencies below 60 Hz. Vibration isolation may be necessary to reduce the transmission of vibration from the driven equipment to the building structure. For example, a gas turbine driving an 1800-rpm electric generator will produce a 30-Hz driving force. Whether vibration isolation is required will depend on where the gas turbine generator set is located within the building. Generally, vibration isolation is recommended for above-grade installation in buildings.
For vibration isolation, elastomeric pads are generally used, although springs can be used by those who prefer them. For installation on the upper or top floors of a building or on offshore platforms, the need for vibration isolation should be considered and rejected only if analysis demon-strates that vibration isolation is not necessary.
OCTAVE BAND PREFERRED FREQUENCIES AND FREQUENCY BANDS Octave bands are used to describe the noise from noise sources. They are commonly used in speci-fications and ordinances to define maximally ac-cepted noise levels. The frequency range em-ployed is 22 Hz to 11,314 Hz in nine octave bands.
Table 1 describes these octave band center frequencies and the upper and lower cutoff frequencies for each octave band. The cutoff frequencies have been calculated from ANSI 51.11-1986.
Table 1. Frequencies and Frequency Bands
Octave Band CenterFrequencies, Hz
31.5 63 125 250 500 1000 2000 4000 8000 Frequency Range, Hz 22 45 89 177 354 707 1414 2828 5656
to to to to to to to to to
45 89 177 354 707 1414 2828 5656 11,314SPNP-017M
WEIGHTED SOUND LEVELS A sound level meter equipped with a frequency weighting filter can give a single number reading from the selected weighting network. The three most common weighted networks are A, B, and C, although the A-weighting network is by far the most frequently used. The frequency response characteristics of each of these weighted net-works is shown in Figure 2, which is produced from frequency weightings in ANSI Standard 51.4-1983 (R1985).
The A, B, and C weighting networks approximate the response of the human ear's equal loudness perception to pure tones relative to a reference sound pressure level at 1000 Hz. The human ear is less sensitive to lower frequency sounds at lower sound levels, but as the sound levels increase this sensitivity is less pronounced, which accounts for the development of the three weighting networks. However, because using a single number is an easy way to rate noise and because the A-weighting has a high correlation with other noise rating methods, it is the most widely accepted way to rate human response to noise. It is used internationally in noise standards and regulations.

4
FREQUENCY, Hz
SPNP 003M
Figure 2. Sound Level Meter-Weighted Frequency Response Characteristics
A sound level meter having the A, B, and C
weighting networks can be used to estimate the frequency distribution. If the sound level is relatively the same when measured on all three networks, the source noise is probably primarily above 600 Hz. If the C-weighted sound level is several dB higher than the A and B networks, low frequency sound (below 600 Hz) predominates.
Typical A-weighted sound levels of various noise sources are shown in Figure 3 (Peterson, 1980).
COMMUNITY RESPONSE TO NOISE Individuals respond differently to noise and the range of response can be quite large. Noise that is intrusive and annoying to some, may not be bothersome to others. The response of an indi-vidual to noise depends on several factors, some of which are given below. These factors, taken from Peterson (1980) are also discussed in EPA (1974), Pollack (1952) and Schultz (1972).
1. Magnitude of the noise level and its spectral
shape. 2. Variation of the noise level with time. 3. Time of day. People are more sensitive to
nighttime than to daytime noise.
4. Time of year. During cold weather, doors and windows are shut, so homes are better insulated from external noise sources.
5. Previous exposure. People apparently are conditioned by their previous exposure to noise.
6. Pure tones. Noise with pure tone components are apparently more objectionable than noise without pure tone components.
7. Impulsive noise. 8. Community acceptance. Apparently, a com-
munity's tolerance of an intruding noise is in-creased if the community accepts the function of the noise producer as very necessary.
9. Socio-economic status. There are numerous documents
(guidelines, ordinances, and standards) dealing with community noise. Among the currently pertinent are the HUD Environmental Criteria and Standards, the Model Community Noise Control Ordinance, the EPA Noise Guidelines, and the ANSI S12.40-1990 Standard.
These documents are more applicable to city and residential areas than to rural areas.
REL
ATIV
ER
ESPO
NSE
.Dec
ibel
s

5
Casting Shakeout Area
Electric Furnace Area
Boiler Room Printing Press Plant Tabulating Room Inside Sports Car at 80 km/hr (50 mph)
37 kW (50 hp) Siren at 30 m (100 ft)
Jet Takeoff at 61 m (200 ft)
*Riveting Machine
Cut-Off Saw*Pneumatic Peen Hammer
Rock Drill at 15 m (50 ft)
*Textile Weaving PlantSubway Train 6.1 m (20 ft)
Dump Truck 15 m (50 ft)Pneumatic Drill 15 m (50 ft)
Freight Train 30 m (100 ft)Vacuum Cleaner 3 m (10 ft)
Speech 0.3 m (1 ft)Passenger Auto 15 m (50 ft)
Large Transformer at 61 m (200 ft)
Soft Whisper at 1.5 m (5 ft)
Threshold of Hearing Youths � 1000-4000 Hz {
Figure 3. Typical A-Weighted Sound Levels of Representative Noise Sources
SPNP 004M
*Operator�s Position
AT A GIVEN DISTANCE FROM NOISE SOURCE ENVIRONMENTAL
Decibels RE 20µ Pa
Near Freeway (Auto Traffic) Large Store Accounting Office
Private Business Office Light Traffic at 30 m (100 ft) Average Residence Min Levels - Residential Areas in Chicago at NightStudio (Speech)
Studio for Sound Pictures
140 I
130 I
120 I
110 I
100 I
90 l
80 I
70 I
60 l
50 I
40 I
30 I
20 I
10 l 0

6
∝ =
Lp2 = Lp1 = R2 =
R1 =
Physical Properties of Sound The physical properties of sound discussed in this section will be limited to:
• Spreading of the sound wave with distance • Temperature inversion • Atmospheric absorption • Directivity effects • Combining sound levels
DISTANCE SPREADING In the far field of a noise source, the sound level decreases in accordance with the "inverse square rule." The decrease in the sound level with distance is taken as 6 dB for each doubling of the distance from the noise source. This can be calculated using Equation 1:
Lp2 where:
Lp2 Lp1 R2...
R1...
= Lp1 - 20 log10 [R2/R1] , dB = Sound level at the new location = Sound level at the initial location = Distance from the noise source to the �new location = Distance from the noise source to the �initial location
(1)
TEMPERATURE INVERSION A temperature inversion occurs when the temperature of the air increases, instead of decreases, with elevation. During this condition, the sound wave suffers repeated reflections between the ground and the thermal layer, and the pressure of the sound wave does not decrease in proportion to the inverse of the distance squared, as it propagates in the far field.
Unfortunately, there are no procedures that can be easily used to predict the effects of a temperature inversion, and wind effects usually predominate over thermal inversions (Electric Power Plant, 1983). For these two reasons and because inversions are considered upset conditions which occur infrequently, designing for them does not justify the considerable additional expense.
ATMOSPHERIC ABSORPTION The absorption of acoustic energy by the atmosphere decreases the sound level as the sound propagates from the noise source. This decrease in sound level caused by atmospheric absorption is added to the sound level decrease which occurs with distance.
Figure 4 combines distance spreading and atmospheric absorption to show the decrease in sound level with increasing distance from a noise source. Equation 1 now takes the form:
Lp2 = Lp1 - 20 log10 [R2/R1] - ∝ [R2-R1], dB (2)
where: Atmospheric absorption in dB/unit distance calculated in accordance with ANSI Standard S1.26-1978, for 100% relative humidity and an ambient temperature of 20°C (68°F) Sound level at the new location Sound level at the initial location Distance from the noise source to the new location Distance from the noise source to the initial location
DIRECTIVITY EFFECTS Directivity effects as discussed in this paper are applied to stack openings. Sound from the outlet of an exhaust stack is greater in front of the stack opening than at the side. As shown in Figure 5, while a position in front of the stack opening is at zero degrees to the direction of flow, at the side the position could be 45, 60, 90, or 135 degrees. The directivity effect is affected by both frequency and the area of the stack opening. The higher the frequency and the larger the stack opening, the greater the effect.
Because of variabilities in the results of measurements of stack directivity, Table 2 (AGA, 1969) is offered as an average of those effects. Example: What is the directivity effect in the 8000-Hz octave band at a measurement position 15 m (50 ft) from the centerline of a 17 m (55 ft) high exhaust stack? The exhaust stack diameter is 1.5 m (5 ft). Referring to Figure 5, the angle from the vertical is 135 degrees. From Table 2 the directivity effect is -12 dB for 135 degrees. However, the sound from the exhaust of the gas turbine is given for 90 degrees. The directivity for

7
DISTANCE FROM SOURCE, m (ft) Figure 4. Corrections of Octave Band Sound Pressure Levels for Distance
Figure 5. Exhaust Stack Directivity
SPNP 005M
SNPN-006M

8
Table 2. Directivity of a Vertical Stack
Duct Diameter > 3 m (10 ft) Octave Band Center Frequencies, Hz
Degree 63 125 250 500 1000 2000 4000 80000 8 8 8 9 9 10 10 10
45 5 5 5 6 6 7 7 7 60 2 2 2 1 1 -1 -1 -1 90 -3 -3 -3 -9 -9 -14 -14 -14 135 -4 -4 -4 -11 -11 -18 -18 -18
Duct Diameter 1 m (3 ft) <_ D s 3 m (10 ft)
Octave Band Center Frequencies, Hz
Degree 63 125 250 500 1000 2000 4000 80000 4 4 4 5 5 6 6 6
45 2 2 2 3 3 4 4 4 60 0 0 0 -1 -1 -2 -2 -2 90 -2 -2 -2 -4 -4 -8 -8 -8 135 -3 -3 -3 -7 -7 -12 -12 -12
SPNP 018M
SPNP 015M
90 degrees is -8 dB. Therefore, the directivity effect for this example is the difference between 90 and 135 degrees:
Directivity Effect = (-12) - (-8) = -4, dB (3) Assuming an exhaust sound pressure level (SPL)
at (15 m (50 ft) of 87 dB and an exhaust silencer insertion loss of -20 dB, the correct 8000-Hz octave band SPL at the observer is:
Exhaust SPL at 15 m (50 ft) 87 dB Exhaust silencer insertion loss -20dB Directivity effect 135 degrees vs 90 degrees -4 dB SPL at the receiver 63 dB
COMBINING SOUND LEVELS Sound levels are combined when calculating:
• Sound level from two or more sources • Sound level from a noise source and the
ambient sound level
• Overall sound pressure level or sound power level from octave band levels
• A-weighted sound level from an octave band spectrum
Levels are combined logarithmically, not
arithmetically. Thus, two noise sources each producing 90 dB combine to produce 93 dB, not 180. Figure 6 (Harris, 1979) shows how to make this calculation. L1 is the higher of the two.
The left scale shows the number of decibels to be added to the higher level L1, to obtain the levels of the combination of L1 and L2. The right scale shows the difference between the two noise sources is 0 dB. On the left side, read 3 dB, the number of decibels to be added to the louder noise source, L1. In this example, because the two noise sources are equal, it does not matter which one is designated L1.
Example 1. Assume three noise sources, each contributing the sound levels given below:
• Source 1, 85 dBA • Source 2, 86 dBA • Source 3, 92 dBA Referring to Figure 6, the difference between 85
and 86 dBA is 1 dBA; therefore, add 2.5 dBA to the higher number, 86 dBA, to get 88.5 dBA. Then, take the difference between 92 dBA and 88.5 dBA, which is 3.5 dBA. From Figure 6, add 1.6 dBA to the higher number, 92 dBA, to get 93.6 dBA as follows:
86 � 85 = 1 (from Figure 6, difference is 2.5 dB) 86+2.5 = 88.5 92-88.5 = 3.5 (from Figure 6, difference is 1.6 dB) 92+ 1.6 = 93.6 (round to 94)
In the operation to combine sound
levels, it is acceptable to use tenths of a dB. After calculating the combined sound levels, round off the result to the nearest dB. This can be depicted graphically as:
SPNP-016M

9
A = Number of Decibels to Be Added to L1
(L1-L2) = Difference between Levels in Decibels
Because of the approximate nature of noise analyses, it is pointless to present results calculated to the tenth of a dB. Example 2. Assume that the octave band sound pressure levels have been calculated for the inlet and exhaust at a receiver and, now, must be summed to calculate the A-weighted sound level:
Octave Band Center Frequencies, Hz
Sound Levels 63 125 250 500 1000 2000 4000 8000 dBAInlet/Exhaust,
dB 69 60 51 43 37 36 35 49 - A-Weighted
Core, dB (from Fig. 2) -26 -16 -9 -3 0 +1 +1 -1 - A-Weighted,
dB 43 44 42 40 37 37 36 48 52
SPNP-019M
First, the A-weighting correction must be made to each octave band using Figure 2 and then summed to get the A-weighted sound level, 52 dBA.
To sum the A-weighted octave band sound pressure levels, use Figure 6 to obtain the differences between noise levels, adding the difference to the higher noise level, and proceed through all of the octave bands until the summation is complete, as depicted in Figure 7. Again, round off the combined sound level (51.7) to the nearest dB or 52 dBA.
SPNP-007M Figure 6. Combining Two Sound Levels, L, and L2 OCTAVE BAND CENTER FREQUENCIES, Hz
Figure 7. Combining Sound Levels
SPNP 008M
10
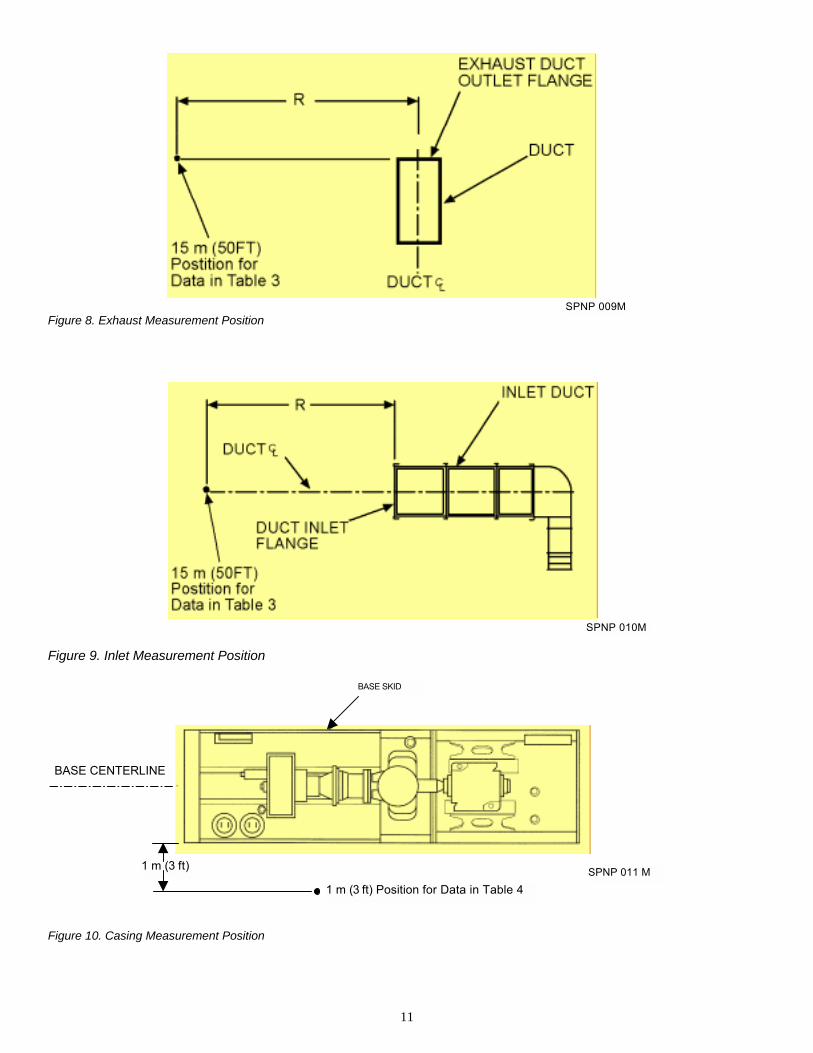
Noise Data The noise levels of Solar gas turbines are given in Tables 3 through 11. The exhaust measurement (Figure 8) is 90 degrees from the exhaust stack centerline on the plane of the outlet flange. The air inlet measurement (Figure 9) is on the centerline of the inlet. Noise levels given for the casing or for enclosed packages at 1 m (3 ft) are noise levels averaged from measurements taken around the package and they are based on free-field conditions (Figure 10). Because these are averaged levels, the noise level at some locations will be louder and at other locations will be lower than the averaged level. All measurements were made with the microphone at a height of 1.5 m (5 ft). Sound pressure levels are expressed with reference to 20 µPa (2 x 10⁻⁵ N/m2).
Tables 3 through 8 apply to gas turbines operating at full load. When operating at less than full load, sound levels from SoLoNOxTM gas turbines can be higher than at full load because of the sound produced by the partially opened bleed valve. (The valve is fully closed only during full-load operation.) Tables 9 through 11 provide the expected sound levels for SoLoNOx gas turbines at part load.
A description of each table follows: Table 3 - Unsilenced octave band sound pressure
levels and A-weighted sound levels at 15 m (50 ft) from the combustion air inlet.
Table 4 - Unsilenced octave band sound pressure
levels and A-weighted sound levels at 15 m (50 ft) from the combustion exhaust for full-load conditions. Sound pressure levels are measured on 1.2-m (4-ft) diameter exhaust stacks for Centaur and Taurus 60 gas turbines and on a 1.5-m (5ft) diameter stack for the Mars gas turbine. Taurus 70 and Titan 130 gas turbine sound data are extrapolated from the Taurus 60 and Mars 90 gas turbine data, respectively.
Table 5 - Unsilenced, averaged octave band
sound pressure levels and A-weighted sound levels at 1 m (3 ft) from the base skid for an unenclosed package operating at full load.
Table 6 - Unsilenced, averaged octave band sound pressure levels and A-weighted sound levels at 15 m (50 ft) from the base skid for an unenclosed package operating at full load.
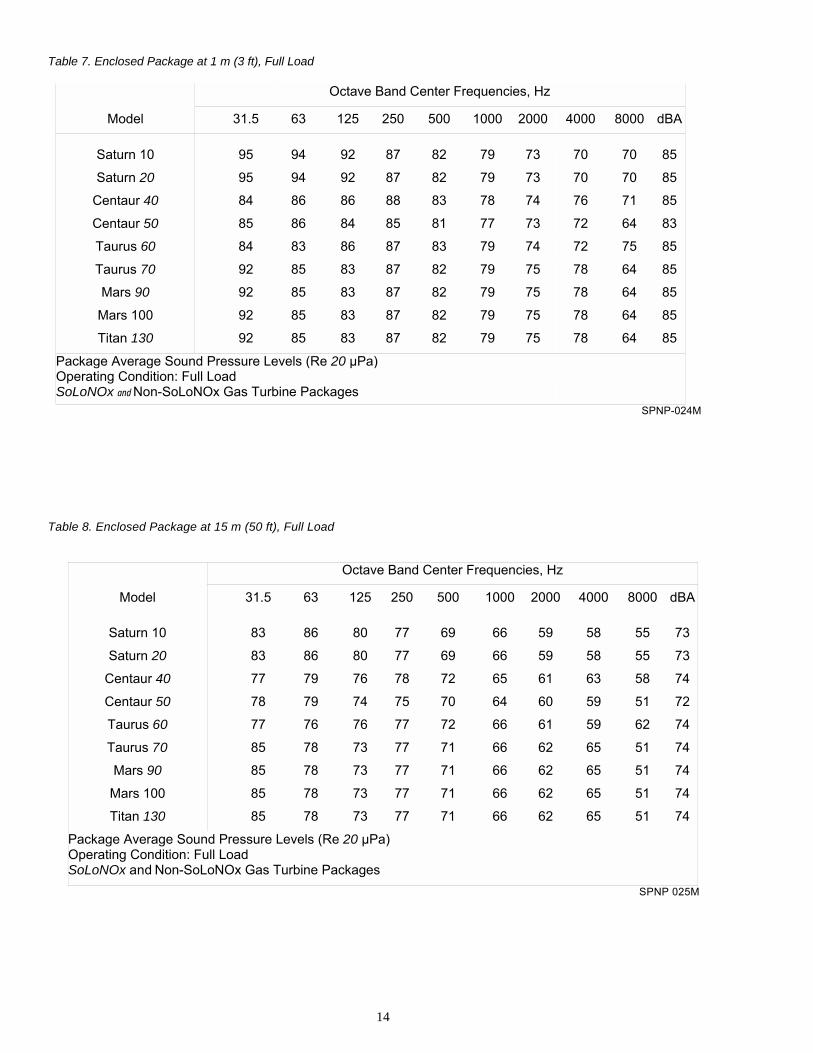
Table 7 - Averaged octave band sound pressure levels and A-weighted sound levels at 1 m (3 ft) from the enclosure for an enclosed package operating at full load.
Table 8 - Averaged octave band
sound pressure levels and A-weighted sound levels at 15 m (50 ft) from the enclosure for an enclosed package operating at full load.
Table 9 - Unsilenced octave band
sound pressure levels and A-weighted sound levels at 15 m (50 ft) from the combustion exhaust for less than full-load operation. This affects the Mars and Titan gas turbines only. Sound pressure levels are measured on a 1.5-m (5-ft) diameter stack for the Mars gas turbine. Titan 130 gas turbine sound data are extrapolated from the Mars 90 gas turbine data.
Table 10 - Unsilenced, averaged
octave band sound pressure levels and A-weighted sound levels at 1 m (3 ft) from the base skid for an unenclosed package operating at less than full load. Does not affect the Saturn gas turbine.
Table 11 - Unsilenced, averaged
octave band sound pressure levels and A-weighted sound levels at 15 m (50 ft) from the base skid for an unenclosed package operating at less than full load. Does not affect the Saturn gas turbine.
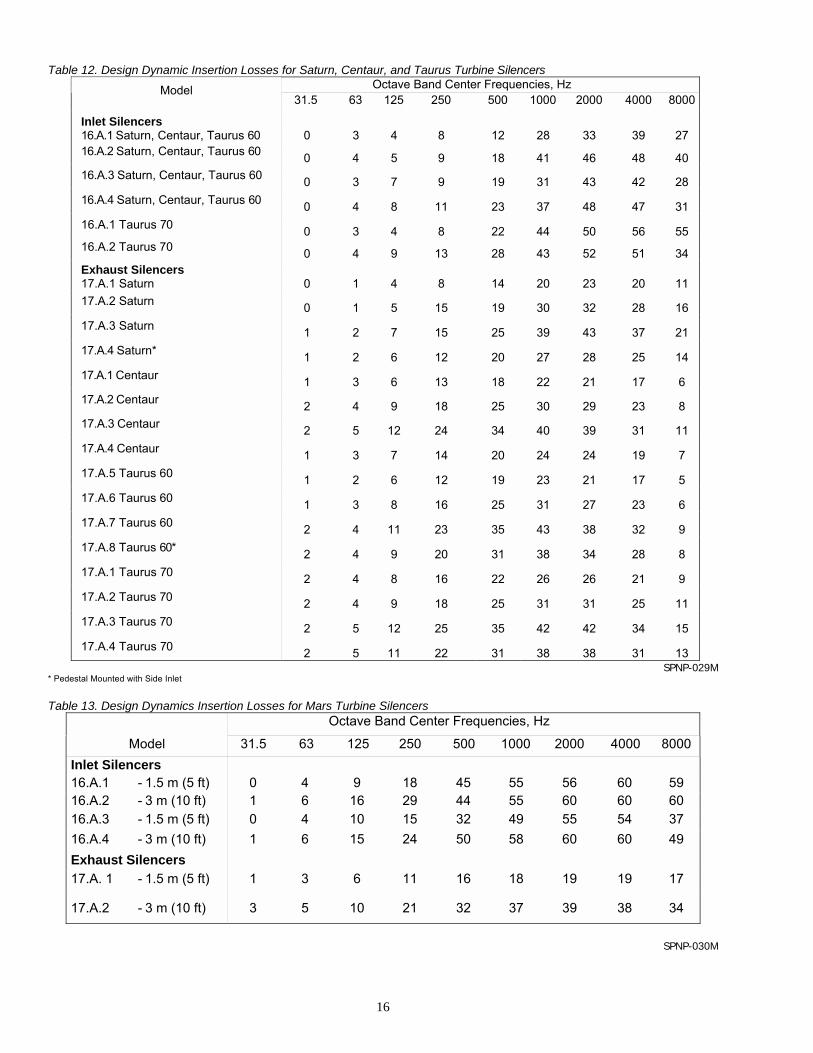
Table 12 - Design (not guaranteed)
dynamic insertion losses of standard inlet and exhaust silencers for the Saturn, Centaur and Taurus 60 gas turbine product lines.
Table 13 - Design (not guaranteed)
dynamic insertion losses of standard inlet and exhaust silencers for the Mars gas turbine product lines.
11
SPNP 009M
Figure 8. Exhaust Measurement Position
Figure 9. Inlet Measurement Position
Figure 10. Casing Measurement Position
SPNP 010M
BASE SKID
SPNP 011 M
BASE CENTERLINE
1 m (3 ft)
1 m (3 ft) Position for Data in Table 4

12
Table 3. Combustion Air Inlet at 15 m (50 ft)
Model Octave Band Center Frequencies, Hz
31.5 63 125 250 500 1000 2000 4000 8000 dBA
Saturn 10
Saturn 20
Centaur 40
Centaur 50
Taurus 60
Taurus 70
Mars 90
Mars 100
Titan 130
70
72
88
88
89
91
90
90
91
72
74
91
91
92
94
93
93
94
74
76
85
85
86
88
93
93
94
78
80
83
83
84
86
93
93
94
82
84
87
87
88
90
93
93
94
89
91
91
91
92
94
95
95
96
91
93
97
97
98
100
99
99
100
95
97
118
118
119
126
127
129
131
106
108
111
111
112
119
120
120
124
106
108
119
119
120
128
129
130
133
Sound Pressure Levels (Re 20 µPa) Operating Condition: Full Load SoLoNOx and Non-SoLoNOx Gas Turbine Packages
SPNP-020M
Table 4. Combustion Exhaust at 15 m (50 ft), Full Load
Model Octave Band Center Frequencies, Hz
31.5 63 125 250 500 1000 2000 4000 8000 dBA
Saturn 10
Saturn 20
Centaur 40
Centaur 50
Taurus 60
Taurus 70
Mars 90
Mars 100
Titan 130
92
93
84
86
88
90
90
91
92
92
93
92
88
91
91
91
92
93
91
92
88
88
88
90
90
91
92
90
91
90
87
91
91
89
90
91
88
89
89
93
94
94
90
91
92
87
88
88
88
87
87
87
88
89
83
84
81
82
80
81
81
82
83
79
80
72
70
70
73
73
74
75
68
69
67
61
61
61
57
58
59
92
93
91
93
93
93
91
92
93
Sound Pressure Levels (Re 20 µPa) Operating Condition: Full Load SoLoNOx and Non-SoLoNOx Gas Turbine Packages
SPNP 02 M

13
Table 5. Unenclosed Package at 1 m (3 ft), Full Load
Octave Band Center Frequencies, Hz
Model 31.5 63 125 250 500 1000 2000 4000 8000 dBA
Saturn 10
Saturn 20
Centaur 40
Centaur 50
Taurus 60
Taurus 70
Mars 90
Mars 100
Titan 130
85
86
94
94
94
94
87
87
88
90
91
94
94
94
94
86
86
87
91
92
97
97
97
97
92
92
93
94
95
99
99
99
99
92
92
93
94
95
99
99
99
99
95
95
96
90
91
95
95
95
95
93
93
94
90
91
92
92
92
102
102
102
103
91
92
91
91
91
100
100
100
101
93
94
92
92
92
95
95
95
96
98
99
101
101
101
106
106
106
107
Package Average Sound Pressure Levels (Re 20 µPa) Operating Condition: Full Load SoLoNOx and Non-SoLoNOx Gas Turbine Packages
SPNP-022M
Table 6. Unenclosed Package at 15 m (50 ft), Full Load
Octave Band Center Frequencies, Hz
Model 31.5 63 125 250 500 1000 2000 4000 8000 dBA
Saturn 10
Saturn 20
Centaur 40
Centaur 50
Taurus 60
Taurus 70
Mars 90
Mars 100
Titan 130
80
80
86
86
86
87
79
79
80
82
83
86
86
86
87
78
78
79
81
81
87
87
87
88
82
82
83
84
85
89
89
89
90
82
82
83
83
84
88
88
88
89
84
84
85
77
78
82
82
82
83
80
80
81
77
78
79
79
79
80
89
89
90
78
79
78
78
78
79
87
87
88
80
81
79
79
79
80
82
82
83
86
87
89
89
89
90
93
93
94
Package Average Sound Pressure Levels (Re 20 µPa) Operating Condition: Full Load SoLoNOx and Non-SoLoNOx Gas Turbine Packages
SPNP-023M
14
Table 7. Enclosed Package at 1 m (3 ft), Full Load
Octave Band Center Frequencies, Hz
Model 31.5 63 125 250 500 1000 2000 4000 8000 dBA
Saturn 10
Saturn 20
Centaur 40
Centaur 50
Taurus 60
Taurus 70
Mars 90
Mars 100
Titan 130
95
95
84
85
84
92
92
92
92
94
94
86
86
83
85
85
85
85
92
92
86
84
86
83
83
83
83
87
87
88
85
87
87
87
87
87
82
82
83
81
83
82
82
82
82
79
79
78
77
79
79
79
79
79
73
73
74
73
74
75
75
75
75
70
70
76
72
72
78
78
78
78
70
70
71
64
75
64
64
64
64
85
85
85
83
85
85
85
85
85
Package Average Sound Pressure Levels (Re 20 µPa) Operating Condition: Full Load SoLoNOx and Non-SoLoNOx Gas Turbine Packages
SPNP-024M
Table 8. Enclosed Package at 15 m (50 ft), Full Load
Octave Band Center Frequencies, Hz
Model 31.5 63 125 250 500 1000 2000 4000 8000 dBA
Saturn 10
Saturn 20
Centaur 40
Centaur 50
Taurus 60
Taurus 70
Mars 90
Mars 100
Titan 130
83
83
77
78
77
85
85
85
85
86
86
79
79
76
78
78
78
78
80
80
76
74
76
73
73
73
73
77
77
78
75
77
77
77
77
77
69
69
72
70
72
71
71
71
71
66
66
65
64
66
66
66
66
66
59
59
61
60
61
62
62
62
62
58
58
63
59
59
65
65
65
65
55
55
58
51
62
51
51
51
51
73
73
74
72
74
74
74
74
74
Package Average Sound Pressure Levels (Re 20 µPa) Operating Condition: Full Load SoLoNOx and Non-SoLoNOx Gas Turbine Packages
SPNP 025M

15
Table 9. Combustion Exhaust at 15 m (50 ft), Less than Full Load Octave Band Center Frequencies, Hz
Model 31.5 63 125 250 500 1000 2000 4000 8000 dBA
Mars 90
Mars 100
Titan 130
89
90
91
91
92
93
92
93
94
91
92
93
96
97
98
96
97
98
96
97
98
84
85
86
59
60
61
101
102
103
Sound Pressure Levels (Re 20 µPa) Operating Condition: Less than Full Load, Bleed Valve Not Closed SoLoNOx Gas Turbine Packages
SPNP-026M
Table 10. Unenclosed Package at I m (3 ft), Less than Full Load Octave Band Center Frequencies, Hz
Model 31.5 63 125 250 500 1000 2000 4000 8000 dBA
Centaur 40
Centaur 50
Taurus 60
Taurus 70
Mars 90
Mars 100
Titan 130
91
91
91
91
84
84
84
92
92
92
91
83
83
83
95
95
95
100
95
95
95
99
99
99
100
93
93
93
105
105
105
104
100
100
100
98
98
98
102
100
100
100
92
92
92
110
110
110
110
90
90
90
104
104
104
104
91
91
91
101
101
101
101
104
104
104
113
113
113
113
Package Average Sound Pressure Levels (Re 20 µPa) Operating Condition: Less than Full Load, Bleed Valve Not Closed SoLoNOx Gas Turbine Packages
SPNP-027M Table 11. Unenclosed Package at 15 m (50 ft), Less than Full Load
Octave Band Center Frequencies, Hz
Model 31.5 63 125 250 500 1000 2000 4000 8000 dBA
Centaur 40
Centaur 50
Taurus 60
Taurus 70
Mars 90
Mars 100
Titan 130
85
85
85
84
76
76
76
84
84
84
84
75
75
75
85
85
85
91
85
85
85
89
89
89
91
83
83
83
94
94
94
94
89
89
89
85
85
85
90
87
87
88
79
79
79
97
97
97
97
77
77
77
91
91
91
91
78
78
78
88
88
88
88
93
93
93
100
100
100
100
Package Average Sound Pressure Levels (Re 20 µPa) Operating Condition: Less than Full Load, Bleed Valve Not Closed SoLoNOx Gas Turbine Packages
SPNP-028M
16
Table 12. Design Dynamic Insertion Losses for Saturn, Centaur, and Taurus Turbine Silencers Octave Band Center Frequencies, Hz Model
31.5 63 125 250 500 1000 2000 4000 8000
Inlet Silencers 16.A.1 Saturn, Centaur, Taurus 60 0 3 4 8 12 28 33 39 27 16.A.2 Saturn, Centaur, Taurus 60 0 4 5 9 18 41 46 48 40 16.A.3 Saturn, Centaur, Taurus 60 0 3 7 9 19 31 43 42 28 16.A.4 Saturn, Centaur, Taurus 60 0 4 8 11 23 37 48 47 31 16.A.1 Taurus 70 0 3 4 8 22 44 50 56 55 16.A.2 Taurus 70 0 4 9 13 28 43 52 51 34 Exhaust Silencers 17.A.1 Saturn 0 1 4 8 14 20 23 20 11 17.A.2 Saturn 0 1 5 15 19 30 32 28 16 17.A.3 Saturn 1 2 7 15 25 39 43 37 21 17.A.4 Saturn* 1 2 6 12 20 27 28 25 14 17.A.1 Centaur 1 3 6 13 18 22 21 17 6 17.A.2 Centaur 2 4 9 18 25 30 29 23 8 17.A.3 Centaur 2 5 12 24 34 40 39 31 11 17.A.4 Centaur 1 3 7 14 20 24 24 19 7 17.A.5 Taurus 60 1 2 6 12 19 23 21 17 5 17.A.6 Taurus 60 1 3 8 16 25 31 27 23 6 17.A.7 Taurus 60 2 4 11 23 35 43 38 32 9 17.A.8 Taurus 60* 2 4 9 20 31 38 34 28 8 17.A.1 Taurus 70 2 4 8 16 22 26 26 21 9 17.A.2 Taurus 70 2 4 9 18 25 31 31 25 11 17.A.3 Taurus 70 2 5 12 25 35 42 42 34 15 17.A.4 Taurus 70 2 5 11 22 31 38 38 31 13
SPNP-029M* Pedestal Mounted with Side Inlet
Table 13. Design Dynamics Insertion Losses for Mars Turbine Silencers
Octave Band Center Frequencies, Hz
Model 31.5 63 125 250 500 1000 2000 4000 8000 Inlet Silencers 16.A.1 - 1.5 m (5 ft) 0 4 9 18 45 55 56 60 59 16.A.2 - 3 m (10 ft) 1 6 16 29 44 55 60 60 60 16.A.3 - 1.5 m (5 ft) 0 4 10 15 32 49 55 54 37 16.A.4 - 3 m (10 ft) 1 6 15 24 50 58 60 60 49 Exhaust Silencers 17.A. 1 - 1.5 m (5 ft) 1 3 6 11 16 18 19 19 17
17.A.2 - 3 m (10 ft) 3 5 10 21 32 37 39 38 34
SPNP-030M

17
Sample Calculations Calculate the octave band sound pressure levels and the A-weighted sound level from the combustion air inlet and exhaust, and the oil cooler of a Centaur 40 gas turbine compressor set at a receiver 152 m (500 ft) from the site. The exhaust stack is 12.2 m (40 ft) high. Assume that the ground elevation at the receiver is the same as the site (see Figure 11). Because the receiver height above ground is 1.5 m (5 ft) (by convention), subtract the 1.5-m (5-ft) receiver height from the 12.2-m (40-ft) stack height to get 10.7 m (35 ft). Now, calculate the angle from the top of the exhaust stack to the receiver:
θ = tan-1 (10.7 m/152 m) = 4 degrees θ = tan-1 (35 ft/500 ft) = 4 degrees (4) Checking the directivity of the exhaust stack
in Figure 5, 94 degrees compared with 90 degrees is insignificant, so a directivity correction will not be made.
Site data will be filled in on the Noise Analysis Form (Figure 12). From Table 3, enter the octave band sound pressure levels for the Centaur40 gas turbine inlet into Line 1 of the Noise Analysis Example (Figure 13). Next, enter the octave band insertion losses for an inlet silencer from Table 12 into Line 2. We have selected arbitrarily the list number 16.A.4. Then select the distance attenuation from Figure 4 for 152 m (500 ft). Enter the
distance attenuation values into Line 3. Subtract algebraically the silencer insertion losses and the distance attenuation from the inlet noise levels in Line 1, and enter the results in Line 4.
Now, repeat the procedure for the exhaust, using the exhaust octave band sound pressure levels from Table 4 for the Centaur40 gas turbine. Enter the exhaust noise levels in Line 5. Select an exhaust silencer from Table 12; we have selected arbitrarily the list number 1 7.A.3. Enter the insertion losses in Line 6. Enter the distance attenuation for the exhaust in Line 7. Algebraically subtract the silencer insertion losses and the distance attenuation from the exhaust noise levels in Line 5, and enter the results in Line 8.
Assume that the noise level of the oil cooler is known and that these noise levels have been given for a distance of 15 m (50 ft) from the center of the oil cooler. Enter these octave band sound pressure levels in Line 9. Enter the distance attenuation in Line 10 (it is the same for the inlet and exhaust systems). Now, algebraically subtract the distance attenuation from the oil cooler noise levels in Line 9 and enter the results in Line 11. Next, using the net noise levels in Lines 4, 8, and 11, logarithmically sum each octave band and enter the sum into Line 12. Calculate the A-weighted sound level if required. (Refer to the example given in the section on "Combining Sound Levels.")
SPNP 012M
Figure 11. Site Example

18
Octave Band Center Frequencies, Hz
Source 31.5 63 125 250 500 1000 2000 4000 8000 dBA
1
2
3
4
5
6
7
8
9
10
11
12
13
14
15
16
17
18 SPNP 013M
Figure 12. Noise Analysis Form
CUSTOMER:
SUBJECT:
ENGINEER:
DATE: _____________________
PROJECT NO.:______________

19
CUSTOMER: Super Pipelines, Inc
SUBJECT:Inlet, Exhaust, & Oil Cooler @ 152 m (500 ft)
ENGINEER: Solar Turbines
DATE: July 19, 1997
PROJECT NO.: 12345
Octave Band Center Frequencies, Hz
Source 31.5 63 125 250 500 1000 2000 4000 8000 dBA
1 Inlet @ 15 m (50 ft), dB1 88 91 85 83 87 91 97 118 111 119
2 Inlet Silencer, dB2 0 -4 -8 -11 -23 -37 -48 -47 -31 -
3 Adjacent to 152 m (500 ft), dB 3 -20 -20 -20 -20 -20 -21 -21 -23 -28 -
4 Net Inlet, 152 m (500 ft), dB 68 67 57 52 44 33 28 48 52 -
5 Exhaust @ 15 m (50 ft), dB4 84 92 88 90 89 88 81 72 67 91
6 Exhaust Silencer, dB5 -2 -5 -12 -24 -34 -40 -37 -31 -11 -
7 Adjacent to 152 m (500 ft), dB 3 -20 -20 -20 -20 -20 -21 -21 -23 -28 -
8 Net Exhaust, 152 m (500 ft), dB 62 67 56 46 35 27 21 18 28 45
9 Oil Cooler @ 15 m (50 ft), dB6 63 70 67 60 55 52 48 44 39 58
10 Adjacent to 152 m (500 ft), dB 3 -20 -20 -20 -20 -20 -21 -21 -23 -28 -
11 Net Oil Cooler @ 152 m (500 ft), dB 43 50 47 40 35 31 27 21 11 38
12 Sum, Lines 4, 8, 11, dB 7 69 70 60 53 45 36 31 48 52 55
13 3 Gas Turbines, dB8 5 5 5 5 5 5 5 5 5 -
14 Net, 3 Gas Turbines, dB 74 75 65 58 50 41 36 53 57 60
15
16
17
SPNP 014M
1 Table 3, inlet noise levels for Centaur 40 gas turbine 2 Table 12, inlet silencer 16.A.4 3 Figure 4 4 Table 4, exhaust noise levels for Centaur 40 gas turbine 5 Table 12, exhaust silencer, 17.A.3 Centaur 6 Manufacturer's data for 90 dBA sound power level oil cooler 7 Calculated using Figure 6 8 Calculated with Eq. 5
Figure 13. Noise Analysis Example

20
1 24
15
i=1
(lai/10)
((lai/10)/10) 24
i=1
MORE THAN ONE GAS TURBINE There may be more than one gas turbine at the site. For this example, assume that there are three gas turbines. Use Equation 5 and the procedure described below to incrementally increase the calculated noise levels:
Lpn = 10 log10 N, dB (5) where:
Lpn = Increase in noise level produced by N number of ��..noise sources (gas turbines) N = Number of noise sources (gas turbines) For three gas turbines, Lpn = Lp3 = 5 dB. Enter 5 dB
into Line 13 in Figure 13. Add algebraically Lines 12 and 13 to get Line 14. (Lines 12 and 13 can be added algebraically because the noise level increase of the three gas turbines has been calculated logarithmically.)
CALCULATING THE DAY/NIGHT SOUND LEVEL (LDN) If the day/night sound level is desired, calculate it using Equation 6:
Ldn = 10 log10 [ ( ∑ 10 +∑ 10 )], db (6)
where:
La = A-weighted sound level
The first term in the equation is summed over 15 hours using the calculated A-weighted sound level. The second term is summed over nine hours using the A-weighted sound level plus 10 dBA. The 15-hour summation represents the time from 7 a.m. to 10 p.m. The nine-hour summation represents the time from midnight to 7 a.m. plus the time from 10 p.m. to midnight. This is because the day/night sound level is calculated for one day, a 24-hour period from midnight to midnight, with the nighttime hours (midnight to 7 a.m. and 10 p.m. to midnight) weighted by adding 10 dBA to them.
From Line 14 in Figure 13, the A-weighted sound level is 60 dBA. Using Equation 6, the day/ night sound level is calculated to be 66.4 dB, rounded to 66 dB.

21
Source Sound Power Levels Although unsilenced sound pressure levels from the inlet, exhaust and casing of the gas turbine package are given in this paper, customers sometimes request source sound power levels instead. Source sound power levels are properly determined from sound pressure levels that have been measured in accordance with a test standard specifically intended for use in calculating sound power levels. With the exception of the exhaust sound data, the sound pressure levels in this booklet were not measured with the intent of using them to calculate source sound power levels. That is why they are given as sound pressure levels. Sound power levels calculated as described in this section for the casing and combustion air inlet will not be as accurate as levels obtained from the test procedures described in appropriate standards.
When the source sound power levels are re-quested, they are calculated from the sound pressure levels in Tables 3, 4, 6 and 8, using Eq. 7:
Lw = Lp + 20 Log 10 R + K (7)
where: For sound pressure levels from Table 3 (inlet) and Table 4 (exhaust), R = 15 m (50 ft) For sound pressure levels from Table 6 (unen-closed) and Table 8 (enclosed), R = 15.91 m (52.2 ft) for Saturn gas turbine � ��packages R = 16.22 m (53.2 ft) for Centaur, Taurus and Mars ……gas turbine packages R = 16.52 m (54.2 ft) for Titan gas turbine ��packages K = 8 for each noise source (inlet, exhaust, ��.casing)
The exhaust sound pressure levels in Table 4 are calculated from sound power levels obtained from sound measurements taken in accordance with ISO Standard 10494 using hemispherical divergence. Therefore, sound power levels calculated from the data in Table 4 using Eq. 7 and R = 15 m (50 ft) are the sound power levels obtained from the procedure defined in ISO Standard 10494 (1993).
The inlet sound pressure levels were measured at 15 m (50 ft) from the inlet duct flange, on the duct centerline, as shown in Figure 9. This measurement position is the location from which the inlet sound power levels are calculated: R = 15 m (50 ft).
The casing sound pressure levels were measured from positions around the base skid and averaged to obtain the values in the data tables. Note that directivity effects are not included in the calculation of the source sound power levels as described above. Directivity effects are not included in the averaging of the casing sound pressure levels given in the data tables, and there is no advantage gained by considering the directivity effects when calculating the casing sound power levels. For the inlet and exhaust noise, directivity effects should be employed when the noise receiver is not in line with the noise source and the measurement position, as shown in Figures 8 and 9. To calculate the directivity effect for the inlet or exhaust sources, use Figure 5 and follow Example 1 under the section "Directivity Effects."
22
Glossary ACOUSTICAL TERMINOLOGY
Acoustical terms used in the publication are defined in this section. Most of these definitions are described fully by Harris (1979) and ANSI (R1976). A-Weighted Sound Level. Weighted sound pressure level obtained by the use of metering characteristics and the A-weighting specified in American National Standard Sound Level Meters for Measurement of Noise and Other Sounds (ANSI S1.4-1983, 1985). Day/Night Sound Level (Ldn). The 24-hour, time averaged, A-weighted sound level obtained by adding 10 dBA to the sound levels from 10 p.m. to 7 a.m. Decibel. A unit of level which denotes the ratio between two quantities that are proportional to power; the number of decibels corresponding to this ratio is 10 times the logarithm (to the base 10) of this ratio. Far Field. The part of the sound field in which the sound pressure level decreases by 6 dB for each doubling of distance from the source. Free Field. A field in a homogeneous, isotropic medium free from boundaries.
Near Field. The part of the sound field that lies between the noise source and the far field. In this region, the sound pressure level does not decrease by 6 dB for each doubling of distance from the source. Noise. Unwanted sound. Octave Band. An interval between two sounds having a frequency ratio of two. Octave Band Sound Pressure Level. The band pressure level in decibels for a frequency band corresponding to a specified octave. Receiver. A person (or persons) or equipment affected by noise. Sound. An oscillation in pressure in an elastic medium, which is capable of producing the sensation of hearing. Also, the sensation of hearing caused by a pressure oscillation. Sound Pressure Level (Lp). In decibels, 20 times the logarithm to the base 10 of the ratio of the pressure of the sound to a reference pressure. The reference pressure is 20 micropascals (2 x 10⁻⁵ N/m2). Sound Power Level (Lw). In decibels, 10 times the logarithm to the base 10 of the ratio of a given power to a reference power. The reference power is 1 picowatt.

23
References AGA Catalog No. S20069, 1969, "Noise Control for Reciprocating and
Turbine Engines Driven by Natural Gas and Liquid Fuel," American
Gas Association, December 1969, Table 34.
ANSI S1.1-1960 (R1976), "Acoustical Terminology."
ANSI S1.4-1983(R1985), "Specification for Sound Level Meters."
ANSI S1.11-1986 (R1993), "Specification for Octave-Band and
Fractional-Octave-Band Analog and Digital Filters."
ANSI S12.40-1990, "Sound Level Descriptors for Determination of
Compatible Land Use."
ANSI S1.26-1978, "Method for the Calculation of the Absorption of
Sound by the Atmosphere."
Beranek, L.L., ed., 1988, Noise and Vibration Control, Institute
of Noise Control Engineering, Figure 18, p. 605.
Electric Power Plant, 1983, Environmental Noise Guide, Ed. 2, Vol.
1, Chapter 5, pp 5-12.
EPA Report No. 550/9-74-004,1974,
"Information on Levels of Environmental Noise
Requisite to Protect Health and Welfare with an
Adequate Margin of Safety," U.S.
Environmental Protection Agency,
Washington, D.C., p. D-17. Harris, C.M., 1979, Handbook of Noise Control, Ed. 2, McGraw-Hill, Chapter 1 and Chapter 2, pp 2-
14, Figure 2.13.
ISO Standard 10494;1993 (E), "Gas turbines and
gas turbine sets - Measurement of emitted airborne
noise - Engineering/survey method."
Peterson, A.P.G., 1980, Handbook of Noise Measurement, Ed. 9, GenRad, Inc., Concord.
Pollack, I., 1952, "The Loudness of Bands of
Noise," Journal of the Acoustical Society of America,
Vol. 24, No. 5, September 1952, pp 533-538.
Schultz, T.J., 1972, Community Noise Ratings, Applied Science Publishers, London, 1972.

24