Embed Size (px)
Citation preview
Introduction to Air Quality for Highway Planning
Kevin Black, Paul Heishman, and Mike Claggett Federal Highway Administration
May 2016
1
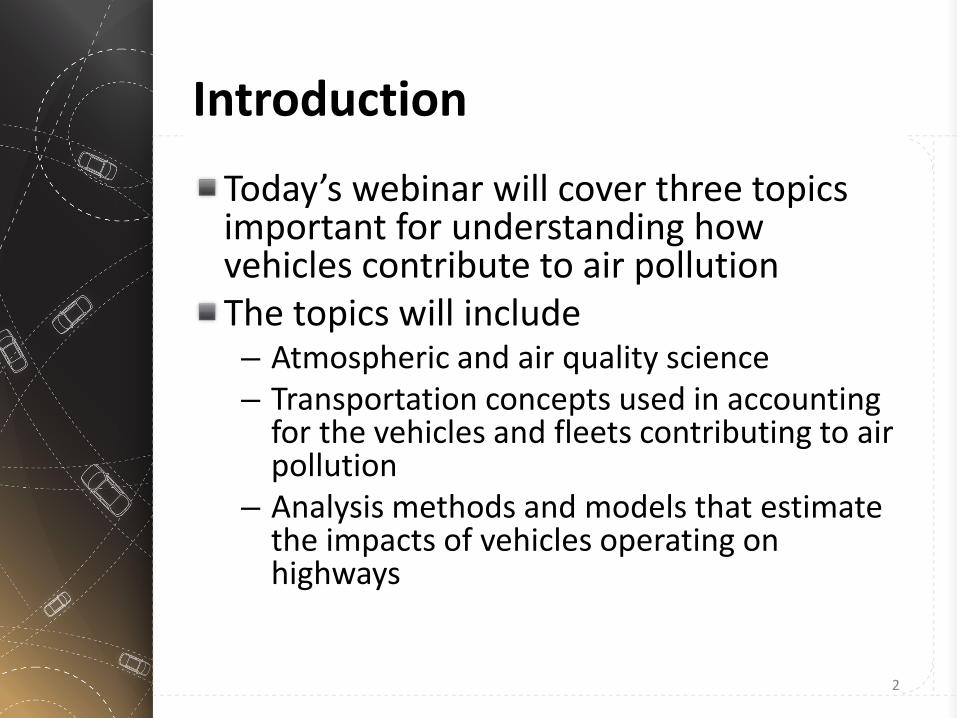
Today’s webinar will cover three topics important for understanding how vehicles contribute to air pollution The topics will include – Atmospheric and air quality science – Transportation concepts used in accounting
for the vehicles and fleets contributing to air pollution
– Analysis methods and models that estimate the impacts of vehicles operating on highways
Introduction
2

The presentations will be conducted by: – Atmospheric and air quality science (Kevin
Black, FHWA Air Quality Team) – Transportation concepts (Paul Heishman,
FHWA Air Quality Team) – Analysis methods (Mike Claggett, FHWA Air
Quality Team) These topics represent a short summary of FHWA’s course titled “Air Quality Fundamentals” which is a two-day course available as both a web-based and an in-person, instructor lead course
Introduction
3

4
Courses on Air Quality for Transportation Planners is important since it is the law Legal Authority: The 1970 CAA, amended in 1990, required USEPA to establish the National Ambient Air Quality Standards and conduct periodic review of both the standards and basis for the standards This course discusses some aspects that result from the regulation of air quality as it relates to highway mobile sources
Introduction

The first presentation today will discuss the science behind transportation-related air quality issues and cover such topics as: – Atmospheric science (physics, chemistry
concepts) – Meteorological principles – Emissions – Health Impacts – Monitoring of air quality
Introduction
5

The Science of Air Quality – Meteorology
6

The Science of Air Quality – Emissions
7

The second presentation today will discuss transportation and traffic related concepts that those working in air quality need to be familiar with including: – The Highway Capacity Manual – Travel Demand Models – Traffic forecasting the 4-Step Process – Regional Traffic Data Concepts – Project-Level Traffic Concepts – Role of Traffic Data in Air Quality Studies
Introduction
8

0
200
400
600
800
1,000
1,200
1,400
1,600
1 2 3 4 5 6 7 8 9 10 11 12 13 14 15 16 17 18 19 20 21 22 23 24
Hourly Volumes: Total Vehicles and By Time Period
Overnight AM Peak Midday PM Peak Freeway
Traffic Considerations- Intro
9
How is an Area Represented in Network Modeling?
10
Traffic Considerations- Regional

The third and last presentation today will discuss the how air quality analysis is conducted for transportation-related air quality programs and projects and it will cover the topics: – Travel and traffic data used in air quality
analysis – Emission models (rates and mass) – Dispersion models (concentrations)
Introduction
11
Air Quality Impact Analysis Framework – Emissions
Inventory / Rates
Emissions Model • Measured Rates • Activity • Adjustments
Fleet Characteristics • Vehicle Activity • Vehicle Types • Vehicle Age • Vehicle Fuels
Other Factors • Scale / Geographics • Time Spans • State Programs • Meteorology
12

Air Quality Impact Analysis Framework – Concentrations
Receptor Concentration
Air Quality Model • Transport and diffusion • Traffic-induced turbulence • Chemical Transformation
Vehicle Emissions • Traffic Parameters • Highway Configuration • Inventory / Emission Rates
Meteorology • Wind Speed • Wind Direction • Atmospheric Stability • Mixing Height
13

FHWA’s Air Quality Team offers several courses on air quality including: – Air Quality Fundaments – Air Quality Benefits – Project Level Analysis – Others
For more information, participants in today’s webinar can contact any of today’s instructors
Introduction
14

Thank you for your interest. We hope our presentations may answer some questions that you may have had about air quality for highway planning
Introduction
15
Webinar outline – Air Quality Science
• Kevin Black
– Traffic Considerations • Paul Heishman
– Air Quality Impact Analysis • Michael Claggett
Introduction to Air Quality for Highway Planning
1
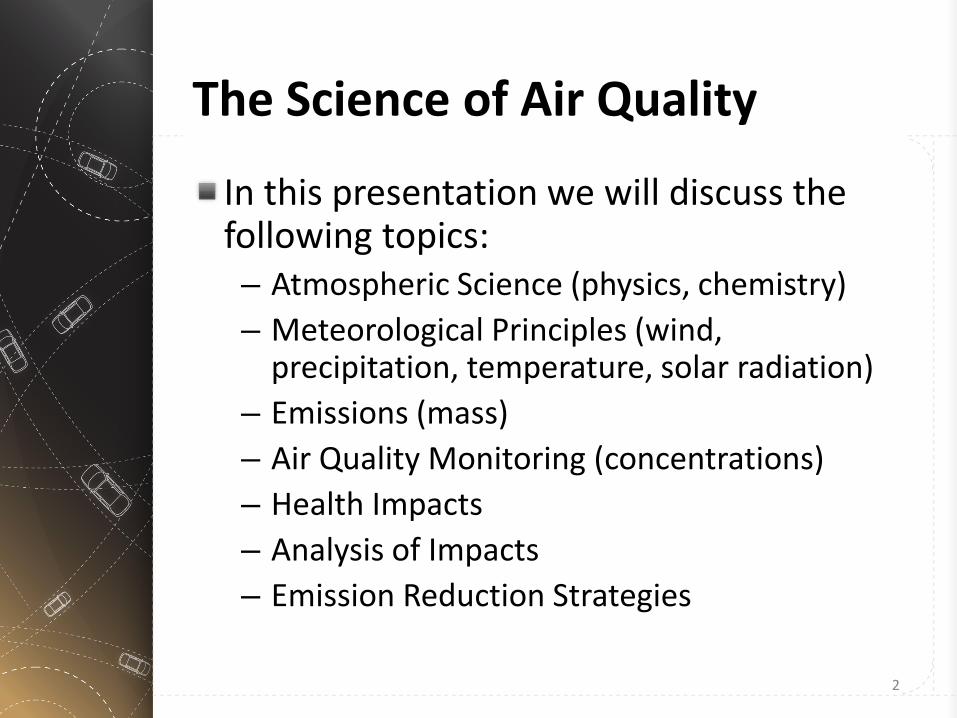
In this presentation we will discuss the following topics: – Atmospheric Science (physics, chemistry) – Meteorological Principles (wind,
precipitation, temperature, solar radiation) – Emissions (mass) – Air Quality Monitoring (concentrations) – Health Impacts – Analysis of Impacts – Emission Reduction Strategies
The Science of Air Quality
2

Basis for understand air quality is the Clean Air Act and its amendments – Donora Valley, PA – Denver Brown Cloud – Acid Rain – Climate Change – Background concentrations – Upwind contributions – Stratospheric intrusions – Boundaries – Precursor pollutants
The Science of Air Quality
3

The Science of Air Quality
4

The Science of Air Quality
5

The Science of Air Quality
6

The Science of Air Quality
7

The Science of Air Quality
8

The Science of Air Quality – Atmospheric Science
9

The Science of Air Quality – Atmospheric Science
10

Chemical reactivity – NOx and the NO to NO2 conversion
Photochemical reactivity – Dependent on parameters such as emissions
of NMHC and NOx, meteorological conditions, reactivity, transported ozone from upwind sites, etc…
– Empirical Kinetic Modeling Approach (EKMA) for ozone (illustration, actual calculation is by air quality dispersion models such as CAMx and CMAQ)
Inversions (discussed in Met Section)
The Science of Air Quality – Atmospheric Science
11

Example of reactivity - Oxides of Nitrogen (NOx) – Mainly Nitrogen Dioxide (NO2) – NO2 + Water = Nitric Acid – NOx + atmosphere = PM – NOx + HC + Sunlight = O3
The Science of Air Quality – Atmospheric Science
12

The Science of Air Quality – Atmospheric Science
13

The Science of Air Quality – Atmospheric Science
14

The Science of Air Quality – Atmospheric Science
15

“Meteorology” and “weather” are shorter term phenomena – day-to-day, week-to-week, year-to year
– Meteorological trends are important for evaluating criteria pollutants
– Most designations of nonattainment based on 3 years of data
Climate, a long term phenomena, is of interest when discussing greenhouse gases
– Atmospheric history, usually interpreted through geological records, important for examining climate trends
– Decades, centuries, millennia geological epochs….
The Science of Air Quality – Meteorology
16
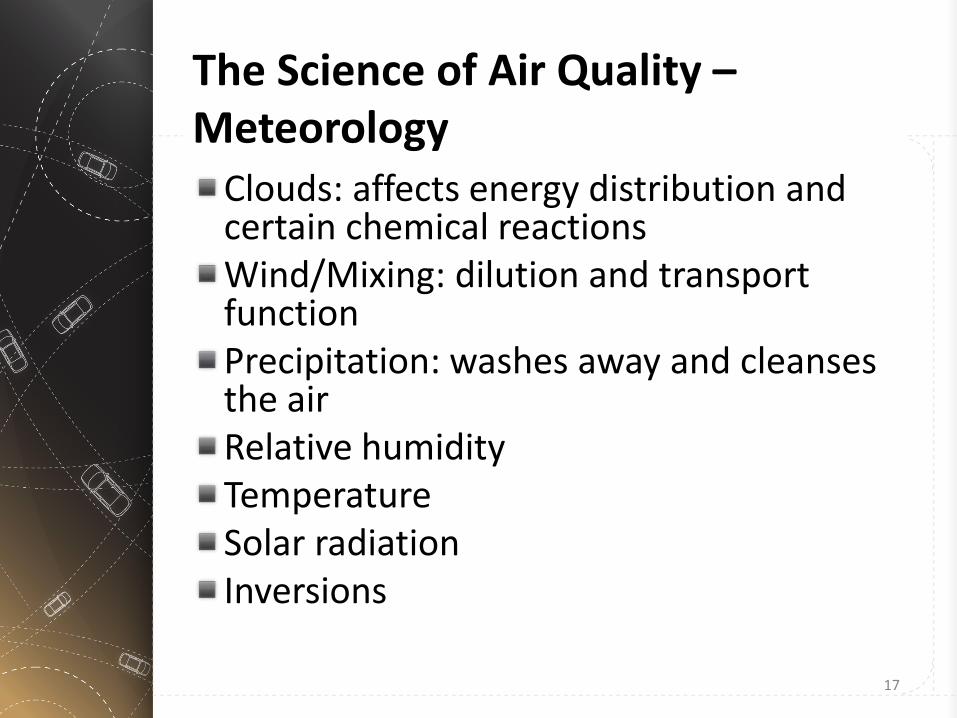
Clouds: affects energy distribution and certain chemical reactions Wind/Mixing: dilution and transport function Precipitation: washes away and cleanses the air Relative humidity Temperature Solar radiation Inversions
The Science of Air Quality – Meteorology
17

Temperature – Heating the atmosphere – Creates instability in the ambient air – Causes expansion of the atmosphere – Can result in dilution due to the
expansion NOTE: ALTHOUGH FOR MET PURPOSES WE ARE DISCUSSING THE TEMPERATURE OF THE ATMOSPHERE, THERE IS ALSO AN ISSUE OF THE TEMPERATURE OF THE EXHAUST
The Science of Air Quality – Meteorology
18

The Science of Air Quality – Meteorology
19

The Science of Air Quality – Meteorology
20

The Science of Air Quality – Meteorology
21

Emission: A substance that is emitted into the air regardless of toxicity. However, it is often used in the same manner as pollutant – Can be natural (trees, wildfires, volcanoes,…) – Can be man-made (factories, power plants,
vehicles,…) Pollutant: A substance that has the ability to affect both human and natural environment in an adverse way – Emitted substance that exceeds some threshold
(such as the NAAQS)
The Science of Air Quality – Emissions
22

The Science of Air Quality – Emissions
23

Criteria Air Pollutant (CAPs): pollutants considered harmful to public health and the environment for which EPA sets National Ambient Air Quality Standards (NAAQS). These six pollutants are CO, O3, NO2, SO2, PM (PM10 & PM2.5), and Pb Hazardous Air Pollutants(HAPs): Air pollutants that cause or may cause cancer or other serious health effects, or adverse environmental and ecological effects. Currently there are 188 HAPs. The HAPs are also known as air toxics and include DPM, CH2O,… Greenhouse Gas Air Pollutants (GAPs, GHG) tend to trap radiation and lead to warming and include CO2, CH4, N2O… On-road Mobile Source emissions refers to vehicles such as cars, trucks, buses and motorcycles that are licensed to operate on public road and highway facilities. These are typically powered by internal combustion engines
The Science of Air Quality – Emissions
24

The Science of Air Quality – Emissions
25

The Science of Air Quality – Emissions
26

Types of mobile source emissions – Running – Start – Evaporative Processes – Crankcase – Tire Wear – Brake Wear – Extended Idle – Life Cycle Processes
The Science of Air Quality – Emissions
27

Two types of national air quality standards – Primary standards set limits to protect
public health, including the health of sensitive populations such as asthmatics, children, and the elderly
– Secondary standards set limits to protect public welfare, including protection against visibility impairment, damage to animals, crops, vegetation, and buildings
The Science of Air Quality – Emissions
28

Pollutants established for NAAQS: – Carbon monoxide (CO) – Sulfur dioxide (SO2) – Lead (Pb) – Ozone (O3) – Nitrogen Dioxide (NO2) – Particulate Matter 2.5 µm and less(PM2.5) – Particulate Matter 10 µm and less (PM10)
The Science of Air Quality – Emissions
29

The Science of Air Quality – Emissions
30

Pollutant [links to historical tables of NAAQS reviews]
Primary/ Secondary Averaging Time Level Form
Carbon Monoxide (CO) primary 8 hours 9 ppm Not to be exceeded more than once per year 1 hour 35 ppm
Lead (Pb)
primary and secondary
Rolling 3 month average 0.15 μg/m3 (1) Not to be exceeded
Nitrogen Dioxide (NO2)
primary 1 hour 100 ppb 98th percentile of 1-hour daily maximum concentrations, averaged over 3 years
primary and secondary
1 year 53 ppb (2) Annual Mean
Ozone (O3)
primary and secondary
8 hours 0.070 ppm (3) Annual fourth-highest daily maximum 8-hour concentration, averaged over 3 years
Particle Pollution (PM)
PM2.5
primary 1 year 12.0 μg/m3 annual mean, averaged over 3 years secondary 1 year 15.0 μg/m3 annual mean, averaged over 3 years primary and secondary
24 hours 35 μg/m3 98th percentile, averaged over 3 years
PM10 primary and secondary
24 hours 150 μg/m3 Not to be exceeded more than once per year on average over 3 years
Sulfur Dioxide (SO2)
primary 1 hour 75 ppb (4) 99th percentile of 1-hour daily maximum concentrations, averaged over 3 years
secondary 3 hours 0.5 ppm Not to be exceeded more than once per year
The Science of Air Quality – Emissions
31

More recently, two other classes of emissions have garnered greater attention:
– Mobile Source Air Toxics (MSATs) – Greenhouse Gases (GHG, climate change emissions) MSATs are as their name implies, “toxic” – Although this is the case, most MSATs do not have
ambient air concentration standards that have been agreed upon as having toxicological effects
GHG are generally not toxic but appear to cause warming of the atmosphere. This can result in damaging weather conditions which can cause harm to people and the environment
The Science of Air Quality – Emissions
32

The Science of Air Quality – Emissions
33

The Science of Air Quality – Emissions
34

Types of Monitoring – Ambient air quality monitoring – Source monitoring – Background monitoring
The Science of Air Quality - Air Quality Monitoring/Concentrations
35

Air quality monitoring – located at sites which are not unduly influenced by any one source Source Monitoring – located to capture the emissions form a specific source (i.e. power plant) Background monitoring – provides “typical” baseline concentrations for various chemicals and compounds found in the atmosphere The transportation community is really only concerned about air quality monitoring since this is the monitoring used to designate areas as to their attainment or nonattainment status
The Science of Air Quality - Air Quality Monitoring/Concentrations
36
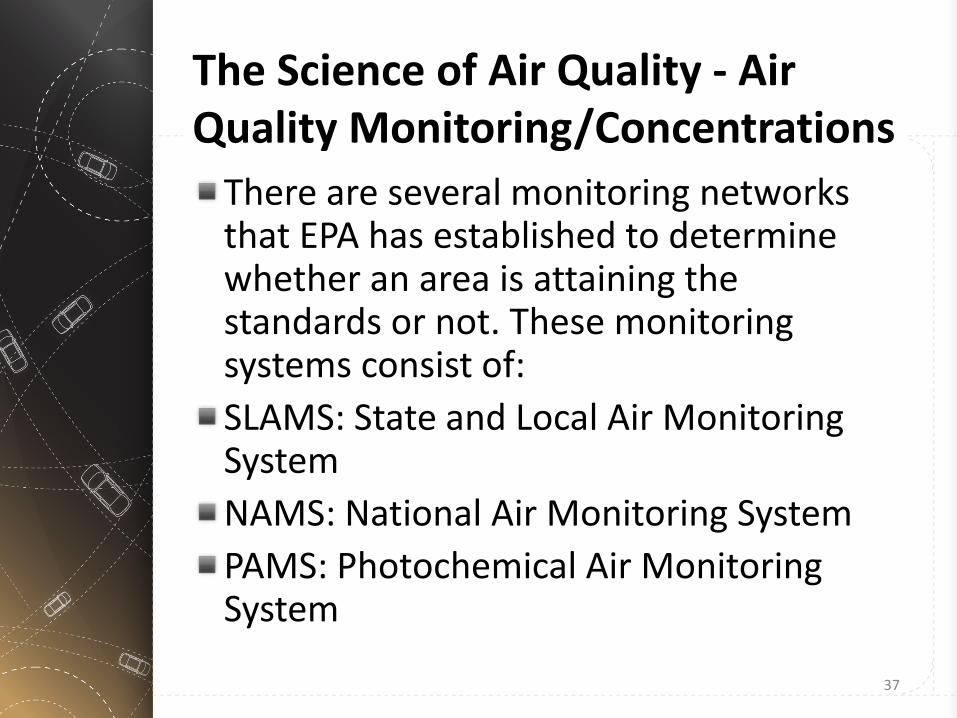
There are several monitoring networks that EPA has established to determine whether an area is attaining the standards or not. These monitoring systems consist of: SLAMS: State and Local Air Monitoring System NAMS: National Air Monitoring System PAMS: Photochemical Air Monitoring System
The Science of Air Quality - Air Quality Monitoring/Concentrations
37

There are other monitoring systems that can have an influence on the transportation and these are:
– SPMS: Special Purpose Monitoring Stations – Near-Road: network established for CO, NOx, PM
Special Purpose Monitors can be established for a specific purpose but if they are allowed to operate for 24 months or longer, the measurements they record can be used to determine and area’s attainment or nonattainment status More recently, a new monitoring system has been established with the purpose of determining vehicle emission and ambient concentrations resulting from them. This monitor system is effectively is source monitoring since the monitors are located adjacent to highways where vehicle emissions are the only source
The Science of Air Quality - Air Quality Monitoring/Concentrations
38

The Science of Air Quality - Air Quality Monitoring/Concentrations
39

The Science of Air Quality - Air Quality Monitoring/Concentrations
40

The Science of Air Quality - Air Quality Monitoring/Concentrations
41

Chemical Exposure – Acute exposure: contact with a
substance that occurs once or for only a time period which is less than 14 days
– Intermediate exposure: contact with a substance that occurs for more than 14 days and less than a year
– Chronic exposure: contact with a substance that occurs more than 1 year
The Science of Air Quality – Health Impacts
42

Chemical Odor – For most of the time, human noses can
pick up an odor before it reaches acute toxic level with few exceptions
– CO: No odor – NO/NO2: Very strong irritant – O3: Strong – VOC: Very strong
The Science of Air Quality – Health Impacts
43

Pollutant Pollutant Impact Primary/Health Secondary/Environment Other CO impairs visual perception,
thoughts, reflexes, drowsiness, cardiovascular functions
inert, non-reactive
NOx respiratory irritant, coughing, wheezing and shortness of breath may occur, can also increase the risk of respiratory illness in children
may adversely affect terrestrial and aquatic ecosystems through regional transport and deposition
reactive
O3 (ground level), smog affects respiratory system, chest pain, coughing, throat irritation, and congestion, can worsen bronchitis, emphysema, can reduce lung function and inflame the linings of the lungs, may permanently scar lung tissue
may reduce yield of agricultural crops and damages forests and other vegetation
formed by reaction of NOx and sunlight
O3 (upper atmosphere) depletion will reduces sunlight, increases possibility of skin cancer
reduces sunlight formed by reaction of NOx and sunlight
PM (10, 2.5), soot aggravation of existing respiratory and cardiovascular disease, alteration of body’s defense system, carcinogenic, premature mortality (infant mortality)
serves as a carrier for toxic metals, damages human-made materials, and is a major cause of reduced visibility in many parts of the U.S
formed by reaction of NOx and sunlight, can be inert or reacive
VOC affects respiratory system, coughing, throat irritation
toxic compounds may damage certain materials
reactive
The Science of Air Quality – Health Impacts
44

Analysis of Mobile Source Impacts Emissions (mass) – Emissions = Vehicle Miles Traveled (VMT) x
Emission factor (EF) – VMT is from regional transportation modeling
and EF is from either MOVES2014 or EMFAC2011
Concentrations (mass/volume) – Concentrations ≡ Emissions / volume of
ambient air Analysis is the subject of following sessions
Science of Air Quality – Analysis of Impacts
45

Emission reductions strategies not covered in this course however some strategies that are discussed in another course we offer include: – Fleet (vehicle) turnover – Reduced vehicle use (transit, park-and-ride,…) – Traffic control systems (signal synchronization) – Fuels (ethanol, electric, …) – Engine improvements and after-treatment
device – Diesel replacement programs – Idle reduction policies
Science of Air Quality – Emission Reduction Strategies
46

FHWA Air Quality Websites – http://www.fhwa.dot.gov/environment/air_qua
lity/ – http://www.fhwa.dot.gov/resourcecenter/team
s/airquality/index.cfm EPA Air Quality Websites – https://www3.epa.gov/otaq/ – https://www3.epa.gov/airquality/
Many, many other references can be found in your library or on the web using a search engine and entering terms such as “transportation and air quality”
References
47

Contact Information
Kevin Black Air Quality Specialist
FHWA Resource Center
10 South Howard Street, Suite 4000
Baltimore, MD 21201
Phone: 410-962-2177
Fax: 410-962- 3419
[email protected] www.fhwa.dot.gov/resourcecenter
48

Introduction to Air Quality for Highway Planning Traffic Considerations
Paul Heishman

Webinar Outline – Air Quality Science
• Kevin Black
– Traffic Considerations • Paul Heishman
– Air Quality Impact Analysis • Michael Claggett
Introduction to Air Quality for Highway Planning
2

Training Objectives – Introduce Regional Traffic Data Concepts – Introduce Project-Level Traffic Concepts – Introduce the Role of Traffic Data in Air
Quality Studies
Traffic Considerations
3

How is the traffic? – When? – Where?
The answer is a moving target!
5/26/2016 4
Traffic Considerations- Intro

5/26/2016 5
Traffic Considerations- Intro
1,000
1,500
2,000
2,500
3,000
3,500
Annu
al V
ehic
le M
iles o
f Tra
vel (
x 10
9 )
Annual Vehicle Miles of Travel (1970-2015)
http://www.fhwa.dot.gov/policyinformation/travel_monitoring/tvt.cfm

5/26/2016 6
Traffic Considerations- Intro
2,750
2,800
2,850
2,900
2,950
3,000
3,050
3,100
3,150
3,200
3,250
2001 2002 2003 2004 2005 2006 2007 2008 2009 2010 2011 2012 2013 2014 2015
Annu
al V
ehic
le M
iles o
f Tra
vel (
x 10
9 )
Annual Vehicle Miles of Travel (2001-2015)
http://www.fhwa.dot.gov/policyinformation/travel_monitoring/tvt.cfm

5/26/2016 7
Traffic Considerations- Intro
http://www.fhwa.dot.gov/policyinformation/travel_monitoring/tvt.cfm
6
7
8
9
10
11
12
13
14
200
210
220
230
240
250
260
270
280
Jan
Feb
Mar Ap
r
May Jun Jul
Aug
Sep
Oct
Nov De
cAv
erag
e Ve
hicl
e M
iles
per D
ay (x
109 )
Mon
thly
Veh
icle
Mile
s of
Tra
vel (
x 10
9 )
Monthly Vehicle Miles of Travel (2007-2012)
2007 2008 2009 2010 2011 2012 per day

0
200
400
600
800
1,000
1,200
1,400
1,600
1 2 3 4 5 6 7 8 9 10 11 12 13 14 15 16 17 18 19 20 21 22 23 24
Hourly Volumes: Total Vehicles and By Time Period
Overnight AM Peak Midday PM Peak Freeway
Traffic Considerations- Intro
8

http://www.google.com/publicdata/explore
Traffic Considerations- Intro
9

A Couple Underlying Fundamentals – Travel is a “derived demand”
• People don’t travel just to travel • Travel with intention of completing a task at
another location (e.g., go to work or shop) • Travel is a “cost” of that other task
– Travel time is a big factor in that cost • Speeds are affected by a variety of factors
– Reliability is a growing concern
5/26/2016 10
Traffic Considerations- Intro

Highway Capacity Manual 2010, Exhibit 11-2
Traffic Considerations- Intro
11

Highway Capacity Manual 2010, Exhibit 4-3
Traffic Considerations- Intro
12
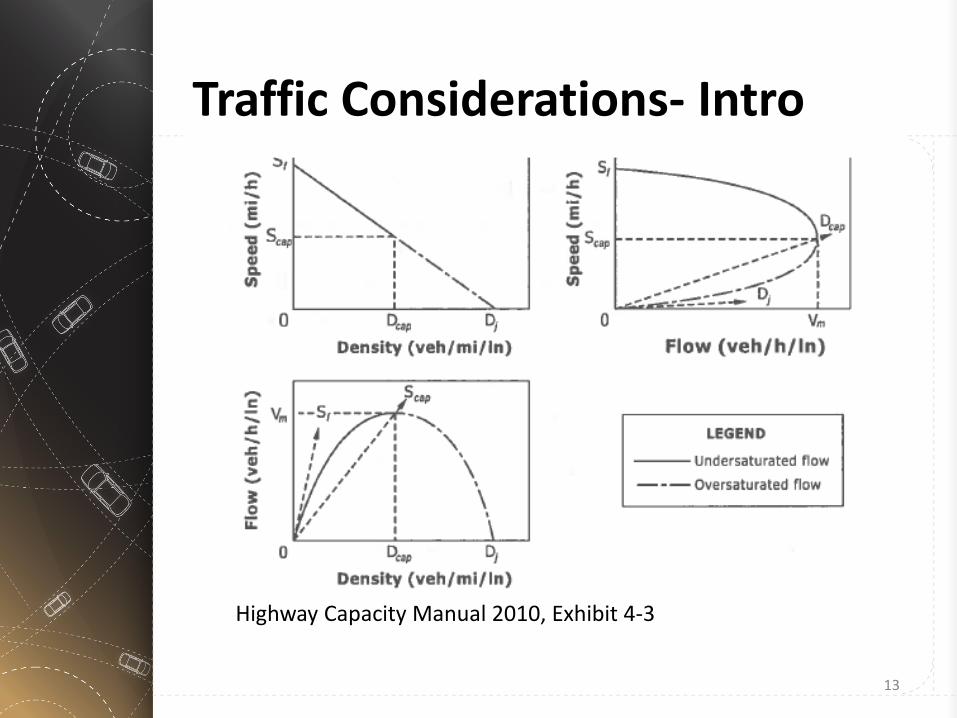
Highway Capacity Manual 2010, Exhibit 4-3
Traffic Considerations- Intro
13
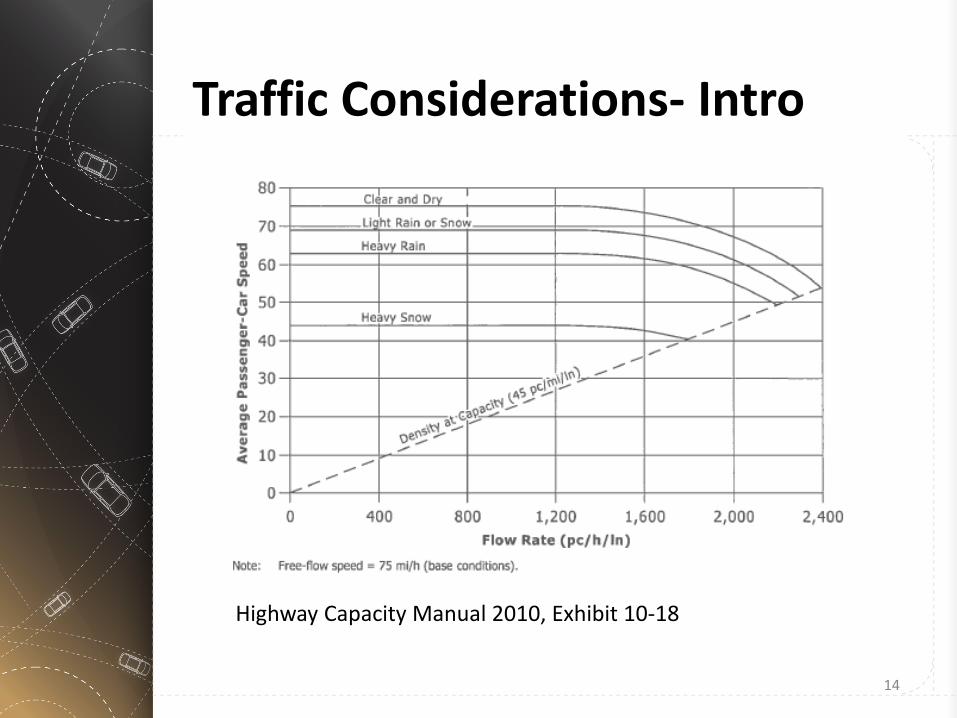
Highway Capacity Manual 2010, Exhibit 10-18
Traffic Considerations- Intro
14

Highway Capacity Manual 2010, Exhibit 24-5
Traffic Considerations- Intro
15

Highway Capacity Manual 2010, Exhibit 24-5
Traffic Considerations- Intro
16

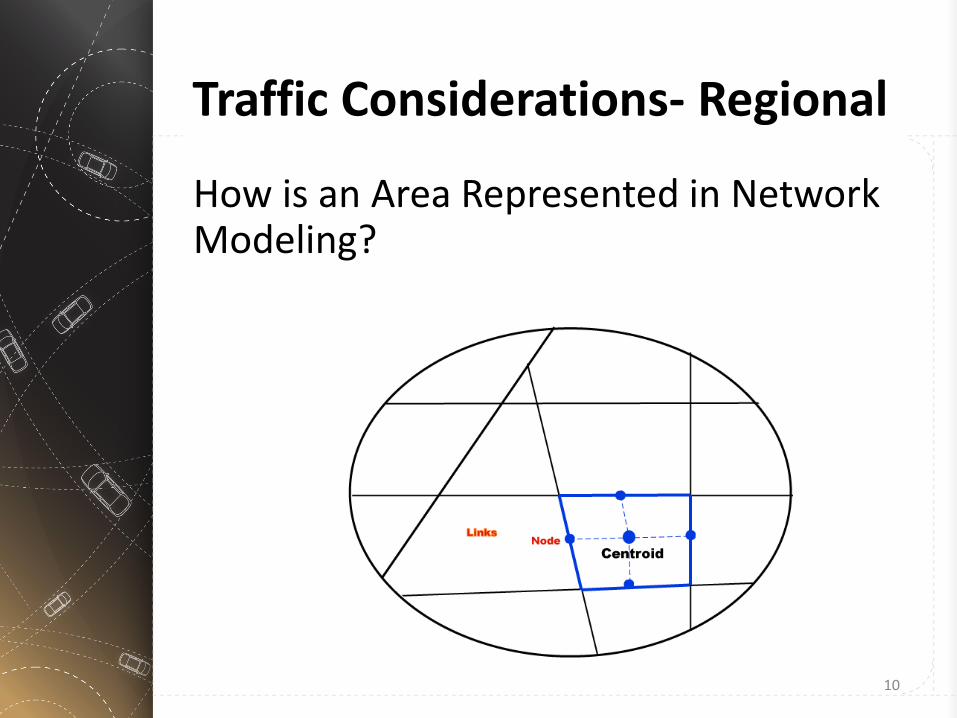
In Urban Areas, Metropolitan Planning Organization (MPO) develops a regional Travel Demand Model (TDM) The area is divided into Traffic Analysis Zones (TAZs) – TAZs contain land use data (homes, jobs) – TDM represents travel between TAZs
5/26/2016 17
Traffic Considerations- Regional

How is an Area Represented in Network Modeling?
5/26/2016 18
Traffic Considerations- Regional

How is an Area Represented in Network Modeling?
5/26/2016 19
Traffic Considerations- Regional

Typical TDM Concept: 4 Step Model – Trip Generation – Trip Distribution – Mode Choice – Route Assignment
Example Trip: Go to work; Go from TAZ 21 to TAZ 441; Drive alone; Use SR 12. Model at aggregate level over full area Different Model Structures Available
Traffic Considerations- Regional
20

In typical application, MPO uses TDM volumes and speeds to complete regional conformity analysis Use TDM to assess viability of large scale projects (highway and transit) to set Transportation Improvement Program (TIP) and Long-range Plan Plan within financial constraints
5/26/2016 21
Traffic Considerations- Regional

Regional TDM provides basic volumes – Speeds typically must be adjusted – Still reflect relative congestion effects – Do not normally treat intersection delay – Can forecast future year conditions
Need project-level analysis for details – Typically calculate Levels of Service – Refine details (e.g., speed) along routes
Traffic Considerations- Project
22

In looking at a Project, consider: – How will it affect where people go? – How will it affect who goes by what mode? – How will it affect what routes they use? – How will it affect their time of travel? – How will it affect on-road operations? – How will it affect land use & future travel?
Apply the same considerations for all alternatives
Traffic Considerations- Project
23

Traffic has generally grown in recent years – However, not uniformly or absolutely
Need Travel Demand Models for forecasts – Based on related factors (e.g., income) – Developed at regional scale
Use traffic engineering principles to adapt for project-level analyses Variability at various scales – Temporally and spatially, volumes and speeds
Use the right tools for the job- models, data
Traffic Considerations- Review
24

Traffic Tools: http://ops.fhwa.dot.gov/trafficanalysistools/ Interim Guidance-Travel & Land Use Forecasting in NEPA http://environment.fhwa.dot.gov/projdev/travel_landUse.asp Guide on Consistent Traffic Analysis: www.fhwa.dot.gov/publications/research/operations/11064/index.cfm Travel Trends: www.fhwa.dot.gov/policyinformation/travel_monitoring/tvt.cfm Traffic Flow Theory: www.fhwa.dot.gov/publications/research/operations/tft/index.cfm NCHRP Reports: (http://www.trb.org/Publications/Publications.aspx) 535-Predicting Air Quality Effects of Traffic-Flow Improvements 716-Travel Demand Forecasting: Parameters and Techniques 765-Analytical Travel Forecasting Approaches for Project-Level Planning and Design Travel Model Improvement Project: http://www.fhwa.dot.gov/planning/tmip/ Highway Capacity Manual 2010: http://www.hcm2010.org/
Traffic Considerations- References
25

Contact Information
Paul Heishman, P.E. Air Quality Specialist
FHWA Resource Center
10 S. Howard St., Suite 4000
Baltimore, MD 21201
Phone: 410-962-2362
Cell: 410-746-0483
[email protected] www.fhwa.dot.gov/resourcecenter
26

Introduction to Air Quality for Highway Planning Air Quality Impact Analysis
Michael Claggett

Webinar outline – Air Quality Science
• Kevin Black
– Traffic Considerations • Paul Heishman
– Air Quality Impact Analysis • Michael Claggett
Introduction to Air Quality for Highway Planning

Need for highway air quality impact analysis Air quality impact analysis framework Vehicle emissions models Air quality models for highway applications Training opportunities List of web resources Contact information
Air Quality Impact Analysis

Policy and guidance – Vehicle emissions modeling
• National Environmental Policy Act (NEPA) of 1969
• Interim Guidance Update on Mobile Source Air Toxic (MSAT) Analysis in NEPA
• Regional analysis for transportation conformity determinations
• Congestion Mitigation and Air Quality Improvement (CMAQ) Program
Need for Highway Air Quality Impact Analysis

Policy and guidance – Air quality modeling
• National Environmental Policy Act (NEPA) of 1969
• FHWA Technical Advisory T6640.8A • Hot-spot analysis of carbon monoxide (CO)
and particulate matter (PM) for project-level conformity determinations
• 40 CFR Part 51 Appendix W, Guideline on Air Quality Models
Need for Highway Air Quality Impact Analysis

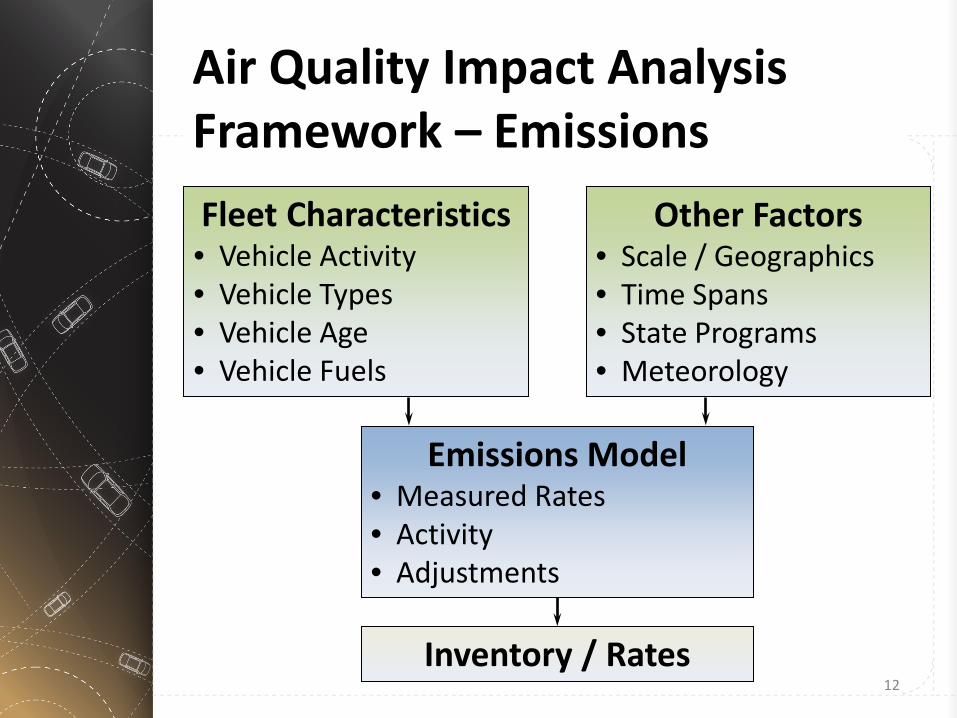
Air Quality Impact Analysis Framework – Emissions
Inventory / Rates
Emissions Model • Measured Rates • Activity • Adjustments
Fleet Characteristics • Vehicle Activity • Vehicle Types • Vehicle Age • Vehicle Fuels
Other Factors • Scale / Geographics • Time Spans • State Programs • Meteorology

Vehicle Emissions Models
U.S. EPA’s MOtor Vehicle Emission Simulator (MOVES) Model
https://www3.epa.gov/otaq/models/moves/index.htm – for applications in all parts of the U.S.,
except California
California Air Resources Board EMFAC2011
http://www.arb.ca.gov/msei/modeling.htm – for applications in California

Summary of Data Manager Input Requirements – MOVES
Data Manager Tab County Project Importer
Age Distribution
Average Speed Distribution
Fuel
Meteorology Data
Road Type Distribution
Source Type Population
Starts
Vehicle Type VMT

Summary of Data Manager Input Requirements – MOVES
Data Manager Tab County Project Importer
Hoteling
I/M Programs
Retrofit Data
Generic
Links
Link Source Types
Link Drive Schedules
Off-Network
Operating Mode Distribution

County scale inventory – Mass within a region and time span
• Regional conformity analysis – Projected Emissions ≤ Emission Budgets?
• NEPA quantitative MSAT analysis – Emission trends over time of the project
alternatives
Vehicle Emissions Model Results

Project scale – Inventory (mass) or emission rates (mass
per unit activity) for a time span • NEPA air quality analysis • Hot-spot analysis of CO and PM for project-
level conformity determinations • FHWA CMAQ project assessments
Vehicle Emissions Model Results

Air Quality Impact Analysis Framework – Concentrations
Receptor Concentration
Air Quality Model • Transport and diffusion • Traffic-induced turbulence • Chemical Transformation
Vehicle Emissions • Traffic Parameters • Highway Configuration • Inventory / Emission Rates
Meteorology • Wind Speed • Wind Direction • Atmospheric Stability • Mixing Height

Spatial regimes Air quality model features Summary of input data requirements Air quality model results – Determining ambient concentrations – Computing design values
Air Quality Models for Highway Applications

Project scale / microscale: – Concentrations > ± 20% for distances ≤
100 m
Urban scale / mesoscale: – Concentrations < ± 20% for distances
between 100 m and 10,000 m
Regional scale / macroscale: – Concentrations < ± 20% for distances >
10,000 m
Spatial Regimes

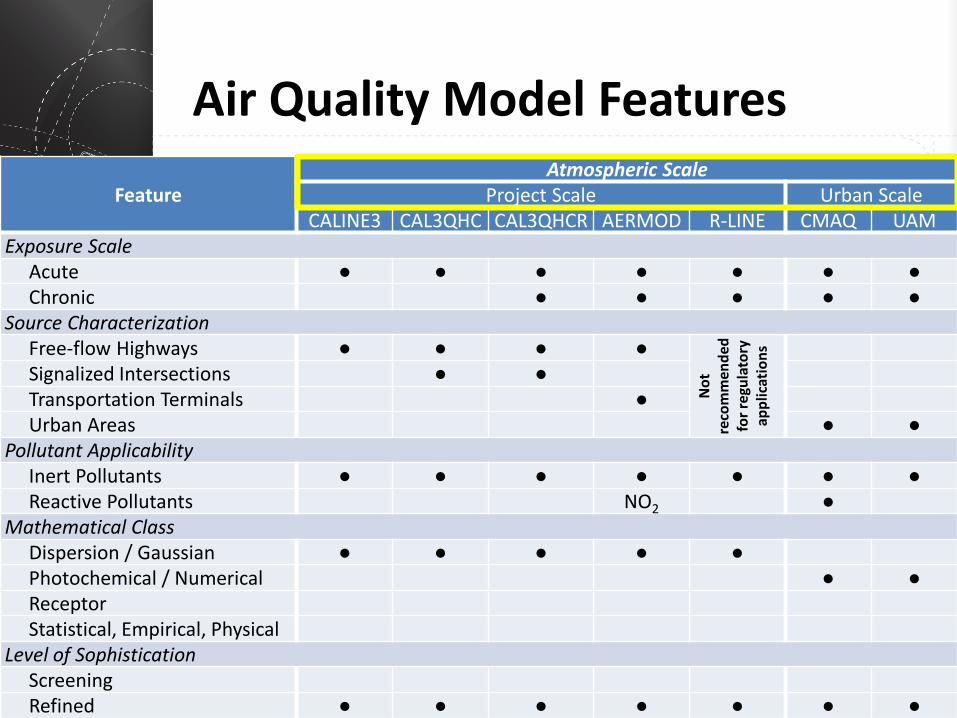
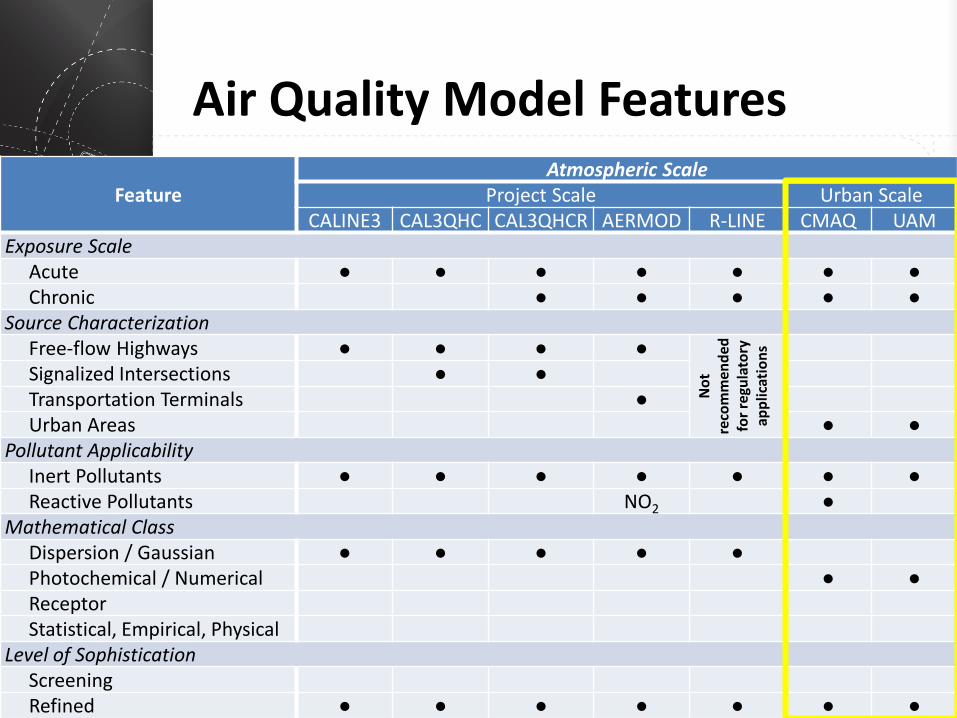
Project Scale
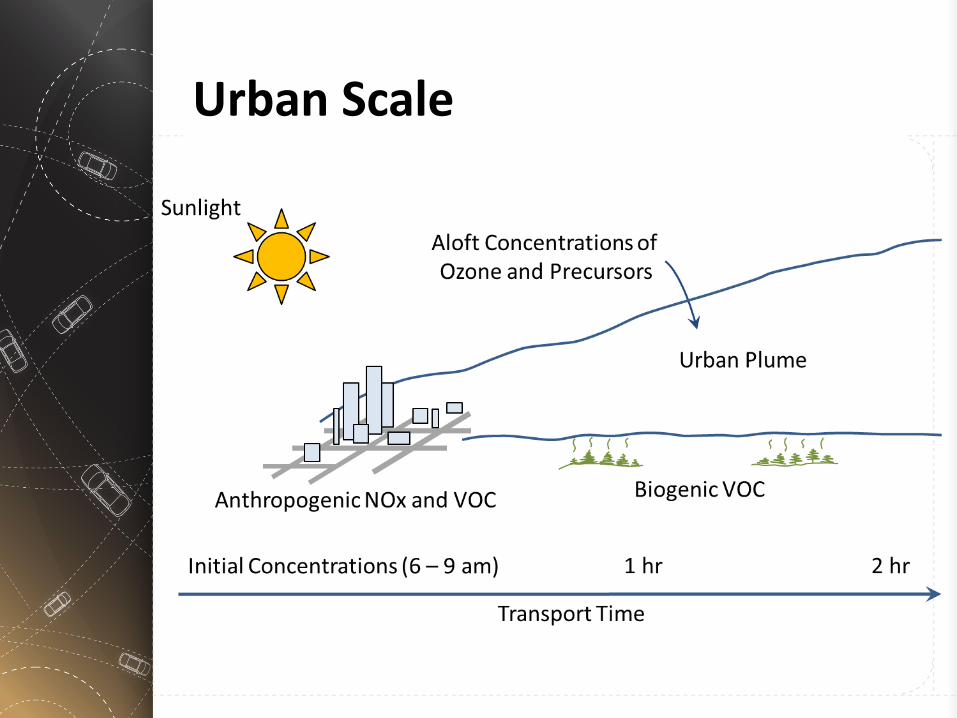
Urban Scale

Feature Atmospheric Scale
Project Scale Urban Scale CALINE3 CAL3QHC CAL3QHCR AERMOD R-LINE CMAQ UAM
Exposure Scale Acute ● ● ● ● ● ● ● Chronic ● ● ● ● ● Source Characterization Free-flow Highways ● ● ● ●
Not
re
com
men
ded
for r
egul
ator
y ap
plic
atio
ns
Signalized Intersections ● ● Transportation Terminals ● Urban Areas ● ● Pollutant Applicability Inert Pollutants ● ● ● ● ● ● ● Reactive Pollutants NO2 ● Mathematical Class Dispersion / Gaussian ● ● ● ● ● Photochemical / Numerical ● ● Receptor Statistical, Empirical, Physical Level of Sophistication Screening Refined ● ● ● ● ● ● ●
Air Quality Model Features

www3.epa.gov/ttn/scram
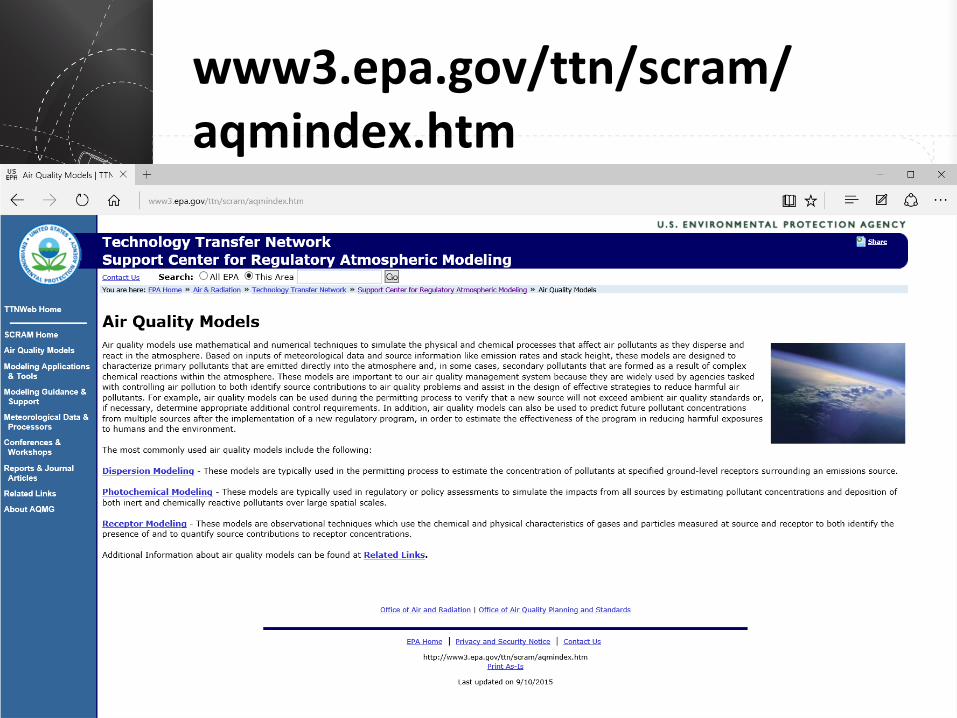
www3.epa.gov/ttn/scram/ aqmindex.htm

Summary of Input Data Requirements
Program Controls
Receptor Locations
Highway Configurations
Vehicle Emissions
Meteorology
Run options Output options

Summary of Input Data Requirements
Program Controls
Receptor Locations
Highway Configurations
Vehicle Emissions
Meteorology
Location coordinates Height of breathing
zone

Summary of Input Data Requirements
Program Controls
Receptor Locations
Highway Configurations
Vehicle Emissions
Meteorology
Location coordinates Source height Source width

Summary of Input Data Requirements
Program Controls
Receptor Locations
Highway Configurations
Vehicle Emissions
Meteorology
Traffic volume and emission factor/rate or
Total emissions

Summary of Input Data Requirements
Program Controls
Receptor Locations
Highway Configurations
Vehicle Emissions
Meteorology Basic parameters: Wind speed Wind direction Atmospheric stability Mixing height

Project scale Ambient Concentration = Background + Highway Contribution + Other Nearby Sources Not Reflected in Background
Air Quality Model Results

Urban scale – Ambient concentration – Background concentration
Air Quality Model Results

Computing design values – Ambient concentration statistic
appropriate for comparison to a National Ambient Air Quality Standard (NAAQS)
Design Value ≤ NAAQS ?
Air Quality Model Results

FHWA Resource Center http://www.fhwa.dot.gov/resourcecenter/teams/airquality/courses.cfm – Transportation Air Quality Fundamentals – Air Quality Benefit Estimation
Methodologies for TCM Projects – MOVES2014 (2-days)/User’s Group – NEPA Air Quality Analysis for Highway
Projects/Project Mobile Source Air Toxics – Transportation Conformity 101 – Climate Change Workshop
Training Opportunities

National Highway Institute http://www.nhi.fhwa.dot.gov/home.aspx – Implications of Air Quality Planning for
Transportation – Estimating Regional Mobile Source
Emissions
U.S. Environmental Protection Agency https://www3.epa.gov/otaq/stateresources/transconf/training.htm – MOVES – Quantitative PM Hot-spot Analyses
Training Opportunities

FHWA Resource Center AQ-TST http://www.fhwa.dot.gov/resourcecenter/teams/airquality/index.cfm
FHWA Air Quality Page http://www.fhwa.dot.gov/environment/air_quality/
EPA Office of Transportation and AQ https://www3.epa.gov/otaq/
TRB Transportation & AQ Committee http://www.trbairquality.org
List of Web Resources

Contact Information
Michael Claggett, Ph.D. Air Quality Modeling Specialist
FHWA Resource Center
4001 Office Court Drive, Suite 800
Santa Fe, NM 87507
Phone: 505.820.2047
Fax: 505.820.2040
[email protected] www.fhwa.dot.gov/resourcecenter