Embed Size (px)
Citation preview
Introduction to Arrow Electronics, Inc.
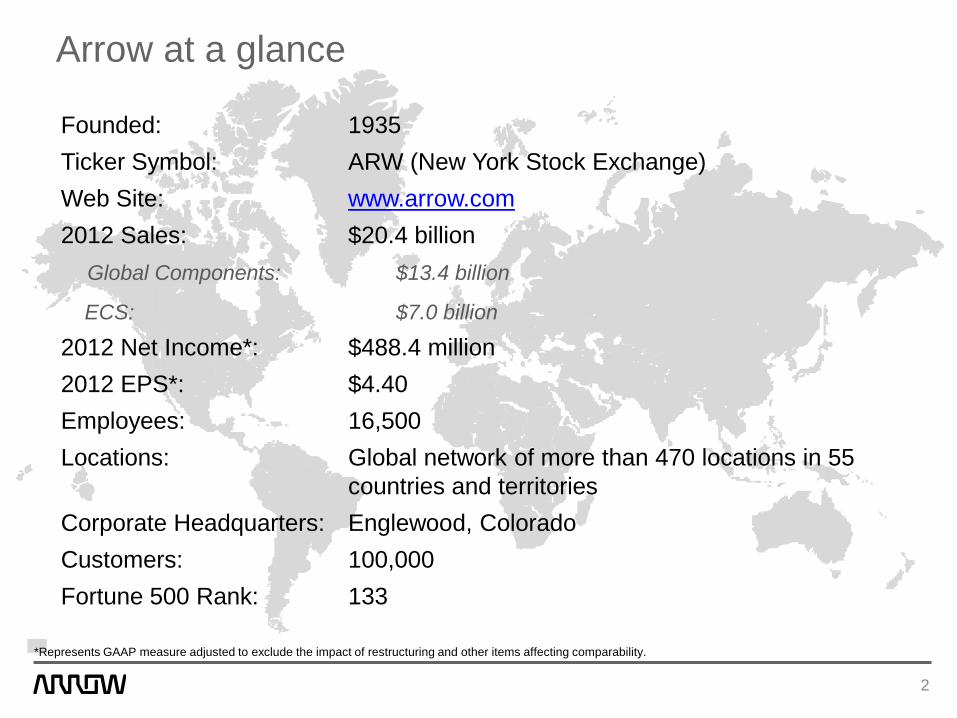
Founded: 1935 Ticker Symbol: ARW (New York Stock Exchange) Web Site: www.arrow.com 2012 Sales: $20.4 billion Global Components: $13.4 billion
ECS: $7.0 billion
2012 Net Income*: $488.4 million 2012 EPS*: $4.40 Employees: 16,500 Locations: Global network of more than 470 locations in 55
countries and territories Corporate Headquarters: Englewood, Colorado Customers: 100,000 Fortune 500 Rank: 133
Arrow at a glance
2
*Represents GAAP measure adjusted to exclude the impact of restructuring and other items affecting comparability.
A global provider of products, services and solutions to industrial and commercial
users of electronic components and enterprise computing solutions
Arrow is…
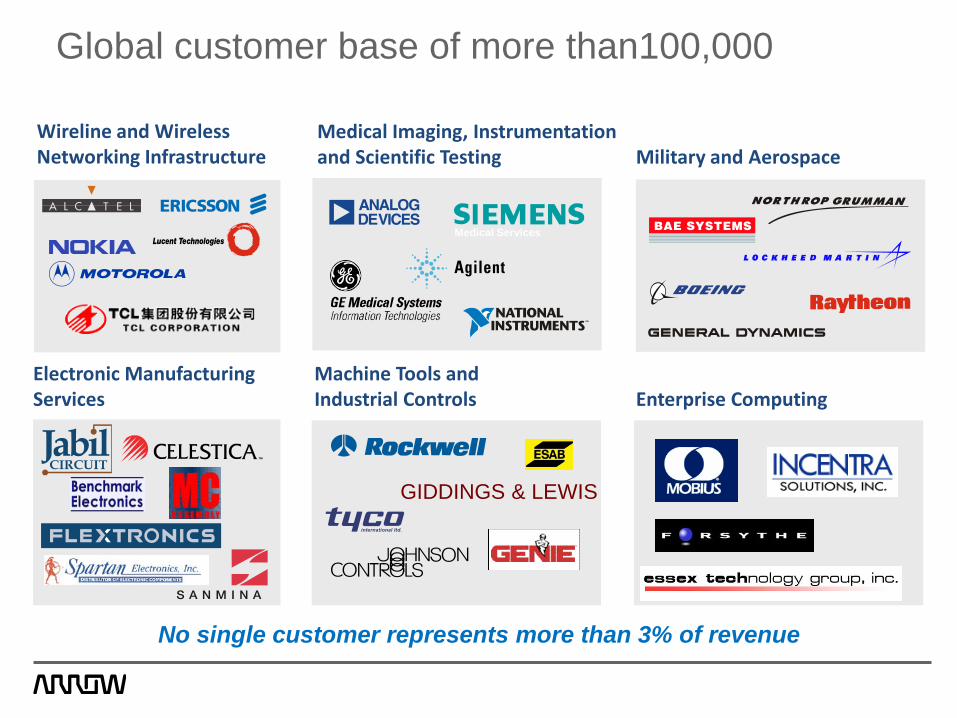
Wireline and Wireless Networking Infrastructure
Medical Imaging, Instrumentation and Scientific Testing Military and Aerospace
Electronic Manufacturing Services
Machine Tools and Industrial Controls Enterprise Computing
Medical Services
GIDDINGS & LEWIS
Global customer base of more than100,000
No single customer represents more than 3% of revenue
To be the premier electronics company in
the world
Our vision is…
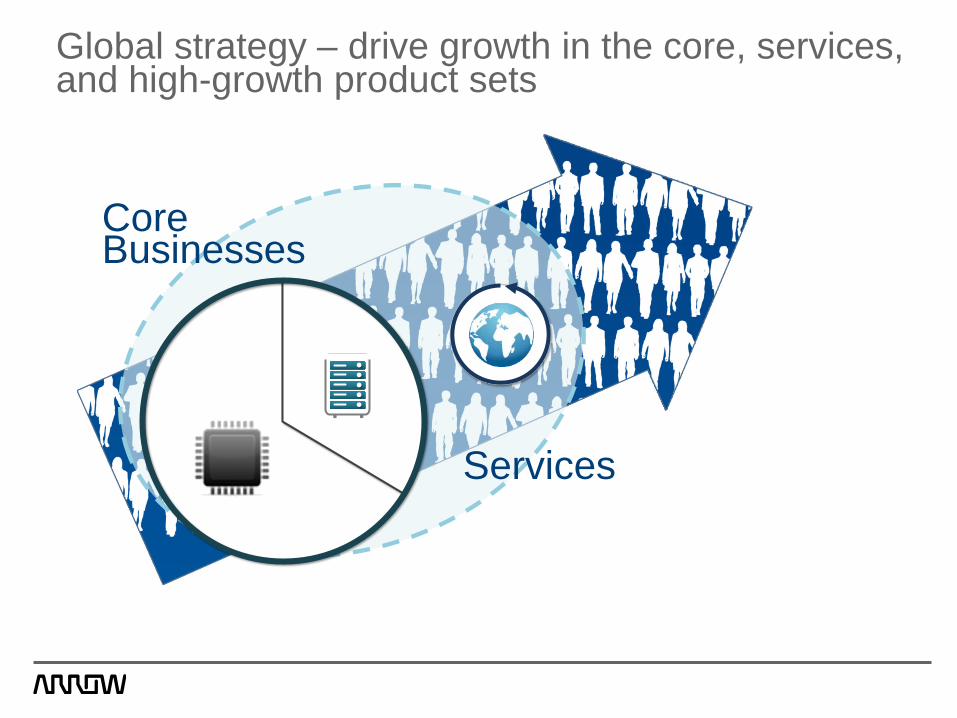
Core Businesses
Services
Global strategy – drive growth in the core, services, and high-growth product sets
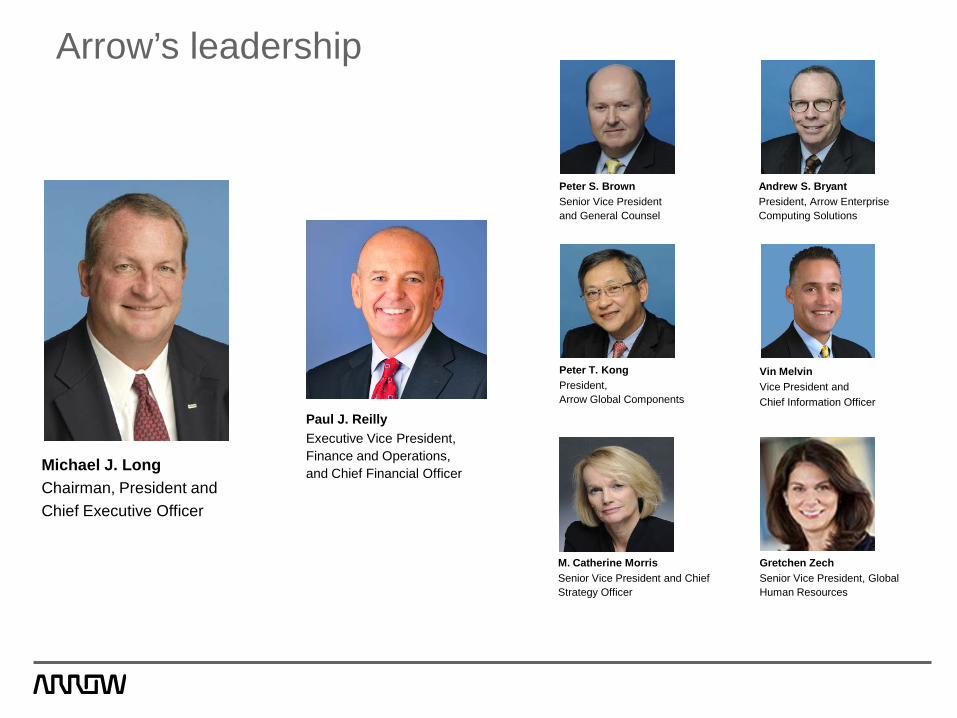
Michael J. Long Chairman, President and Chief Executive Officer
Paul J. Reilly Executive Vice President, Finance and Operations, and Chief Financial Officer
Peter S. Brown Senior Vice President and General Counsel
Andrew S. Bryant President, Arrow Enterprise Computing Solutions
Peter T. Kong President, Arrow Global Components
Vin Melvin Vice President and Chief Information Officer
M. Catherine Morris Senior Vice President and Chief Strategy Officer
Gretchen Zech Senior Vice President, Global Human Resources
Arrow’s leadership

Business Segment Overview
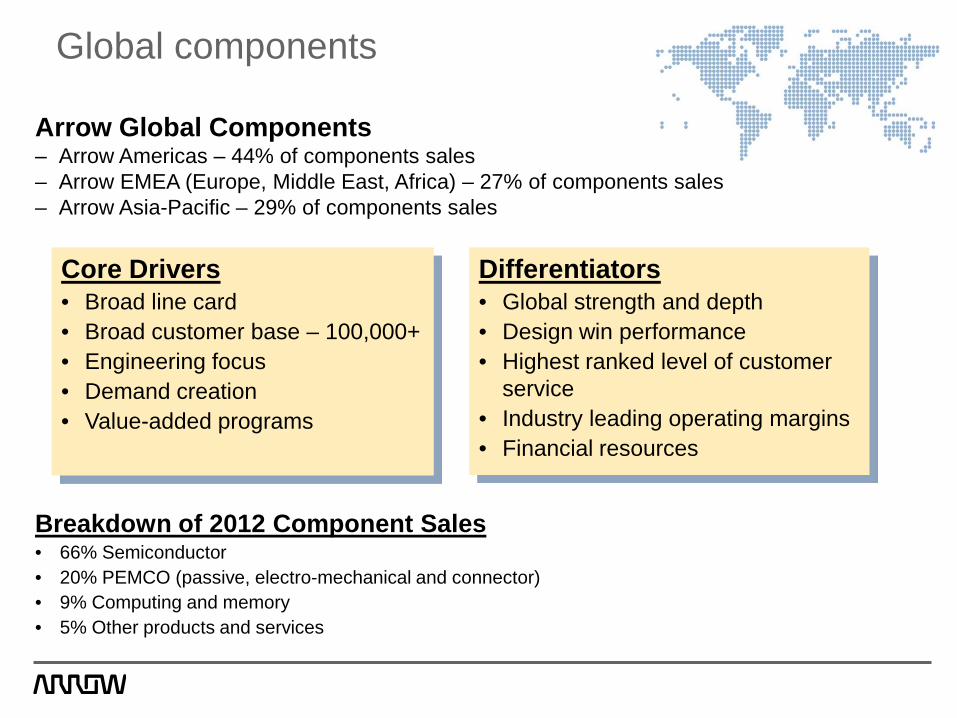
Arrow Global Components – Arrow Americas – 44% of components sales – Arrow EMEA (Europe, Middle East, Africa) – 27% of components sales – Arrow Asia-Pacific – 29% of components sales
Core Drivers • Broad line card • Broad customer base – 100,000+ • Engineering focus • Demand creation • Value-added programs
Differentiators • Global strength and depth • Design win performance • Highest ranked level of customer
service • Industry leading operating margins • Financial resources
Breakdown of 2012 Component Sales • 66% Semiconductor • 20% PEMCO (passive, electro-mechanical and connector) • 9% Computing and memory • 5% Other products and services
Global components
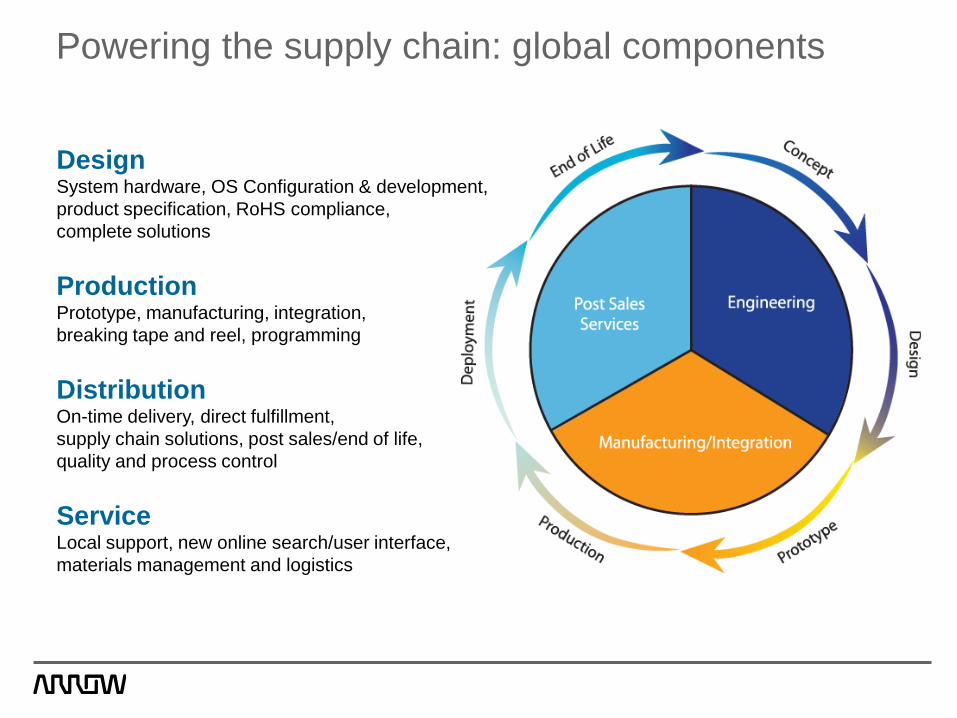
Design System hardware, OS Configuration & development, product specification, RoHS compliance, complete solutions
Production Prototype, manufacturing, integration, breaking tape and reel, programming
Distribution On-time delivery, direct fulfillment, supply chain solutions, post sales/end of life, quality and process control
Service Local support, new online search/user interface, materials management and logistics
Powering the supply chain: global components
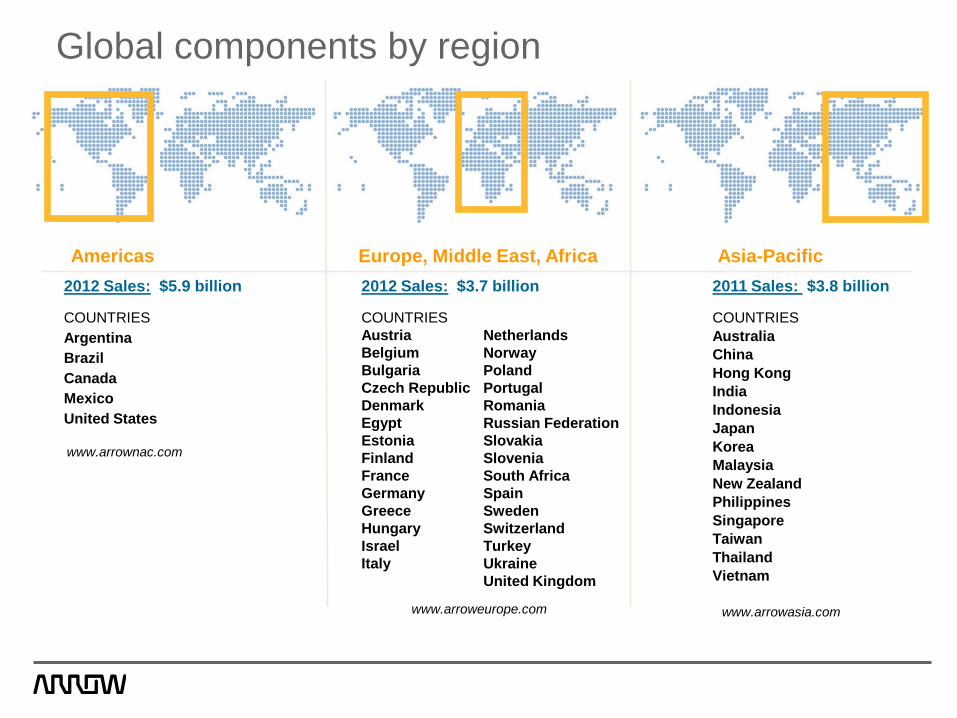
COUNTRIES Argentina Brazil Canada Mexico United States
COUNTRIES Austria Belgium Bulgaria Czech Republic Denmark Egypt Estonia Finland France Germany Greece Hungary Israel Italy
Netherlands Norway Poland Portugal Romania Russian Federation Slovakia Slovenia South Africa Spain Sweden Switzerland Turkey Ukraine United Kingdom
COUNTRIES Australia China Hong Kong India Indonesia Japan Korea Malaysia New Zealand Philippines Singapore Taiwan Thailand Vietnam
Americas Europe, Middle East, Africa Asia-Pacific
www.arrownac.com
www.arrowasia.com www.arroweurope.com
2012 Sales: $5.9 billion 2012 Sales: $3.7 billion 2011 Sales: $3.8 billion
Global components by region
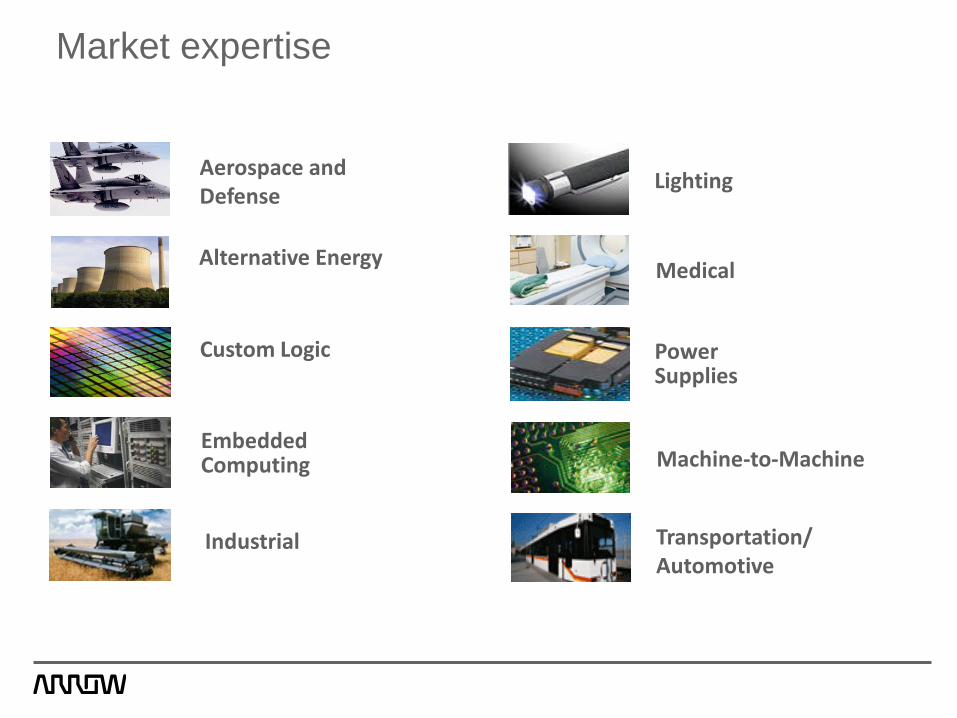
Industrial
Lighting
Transportation/ Automotive
Aerospace and Defense
Power Supplies
Alternative Energy
Custom Logic
Embedded Computing Machine-to-Machine
Medical
Market expertise
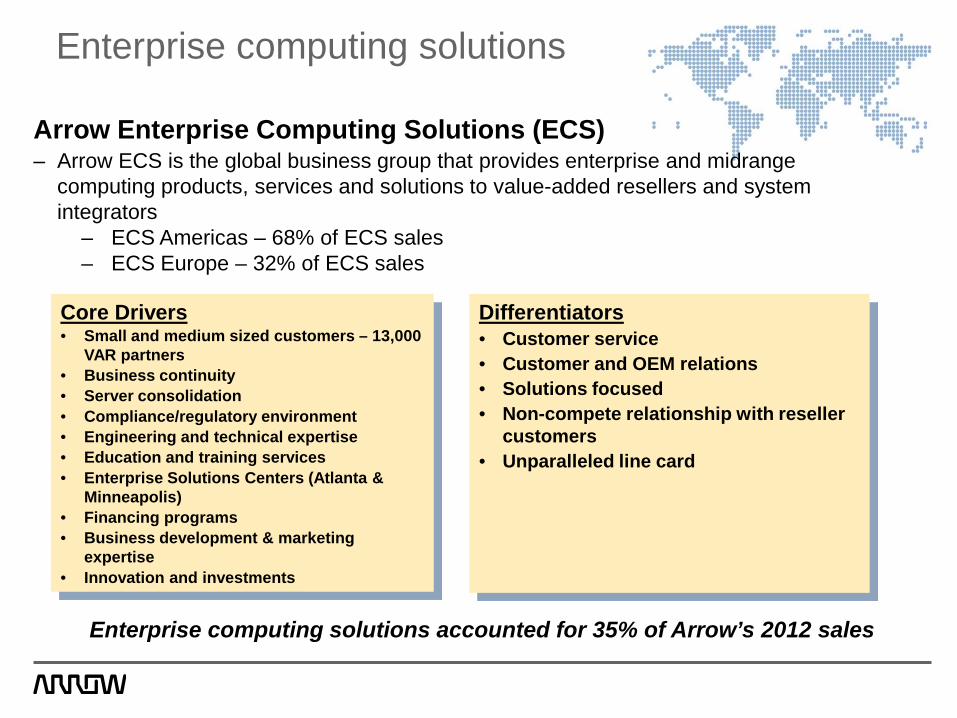
Arrow Enterprise Computing Solutions (ECS) – Arrow ECS is the global business group that provides enterprise and midrange
computing products, services and solutions to value-added resellers and system integrators
– ECS Americas – 68% of ECS sales – ECS Europe – 32% of ECS sales
Core Drivers • Small and medium sized customers – 13,000
VAR partners • Business continuity • Server consolidation • Compliance/regulatory environment • Engineering and technical expertise • Education and training services • Enterprise Solutions Centers (Atlanta &
Minneapolis) • Financing programs • Business development & marketing
expertise • Innovation and investments
Differentiators • Customer service • Customer and OEM relations • Solutions focused • Non-compete relationship with reseller
customers • Unparalleled line card
Enterprise computing solutions accounted for 35% of Arrow’s 2012 sales
Enterprise computing solutions

Powering the supply chain: ECS
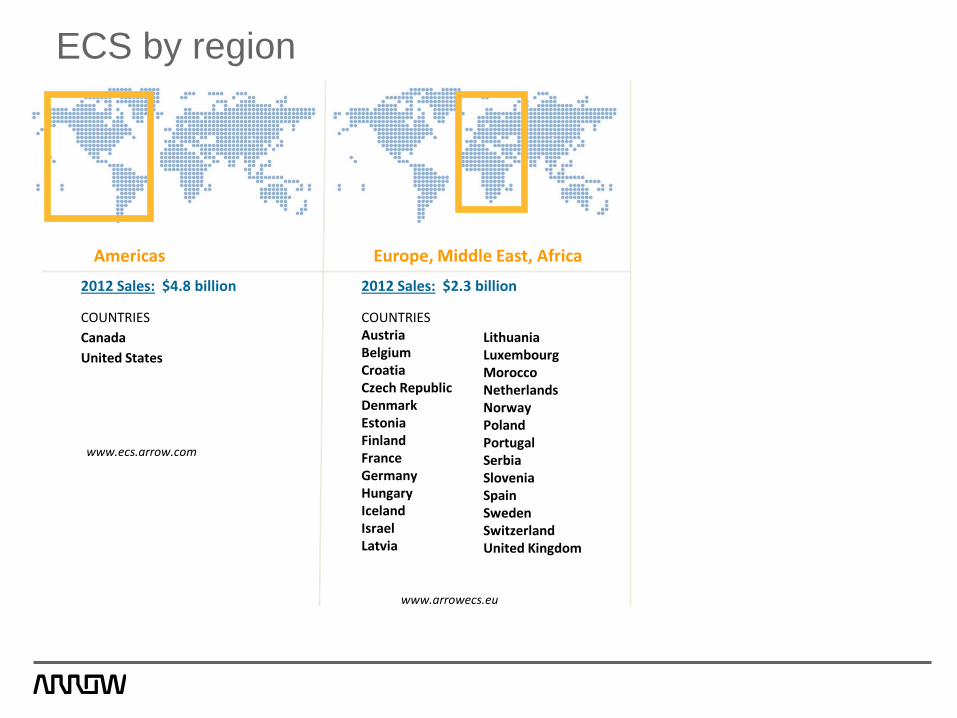
COUNTRIES Canada United States
COUNTRIES Austria Belgium Croatia Czech Republic Denmark Estonia Finland France Germany Hungary Iceland Israel Latvia
Lithuania Luxembourg Morocco Netherlands Norway Poland Portugal Serbia Slovenia Spain Sweden Switzerland United Kingdom
Americas Europe, Middle East, Africa
www.ecs.arrow.com
www.arrowecs.eu
2012 Sales: $4.8 billion 2012 Sales: $2.3 billion
ECS by region

Financial Overview
Outstanding organic sales growth
Significant margin expansion
Committed to strong cash flow generation
Strategic expansion of the portfolio
17
Investment considerations
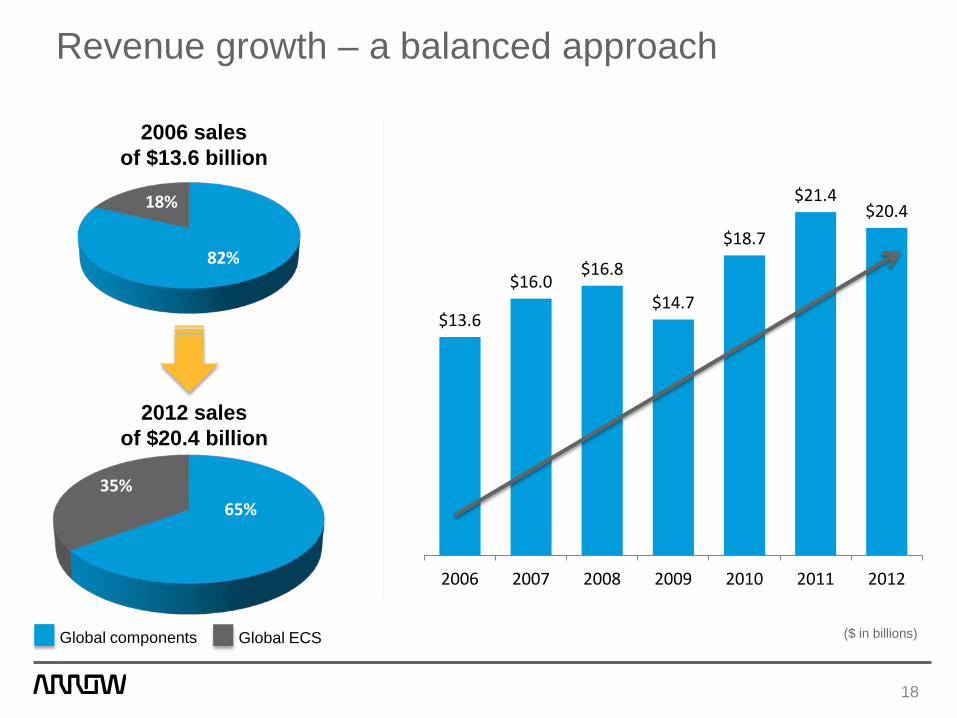
($ in billions)
18
$13.6
$16.0 $16.8
$14.7
$18.7
$21.4 $20.4
2006 2007 2008 2009 2010 2011 2012
82%
18%
2006 sales of $13.6 billion
2012 sales of $20.4 billion
65% 35%
Global components Global ECS
Revenue growth – a balanced approach
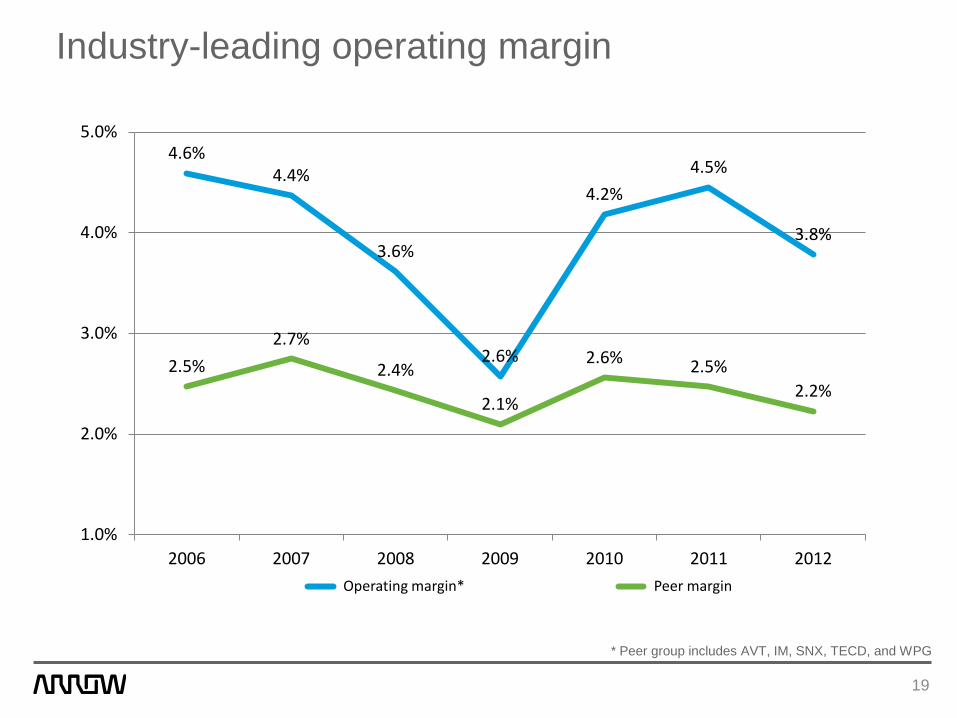
Industry-leading operating margin
* Peer group includes AVT, IM, SNX, TECD, and WPG
19
4.6% 4.4%
3.6%
2.6%
4.2% 4.5%
3.8%
2.5% 2.7%
2.4%
2.1%
2.6% 2.5% 2.2%
1.0%
2.0%
3.0%
4.0%
5.0%
2006 2007 2008 2009 2010 2011 2012 Operating margin* Peer margin
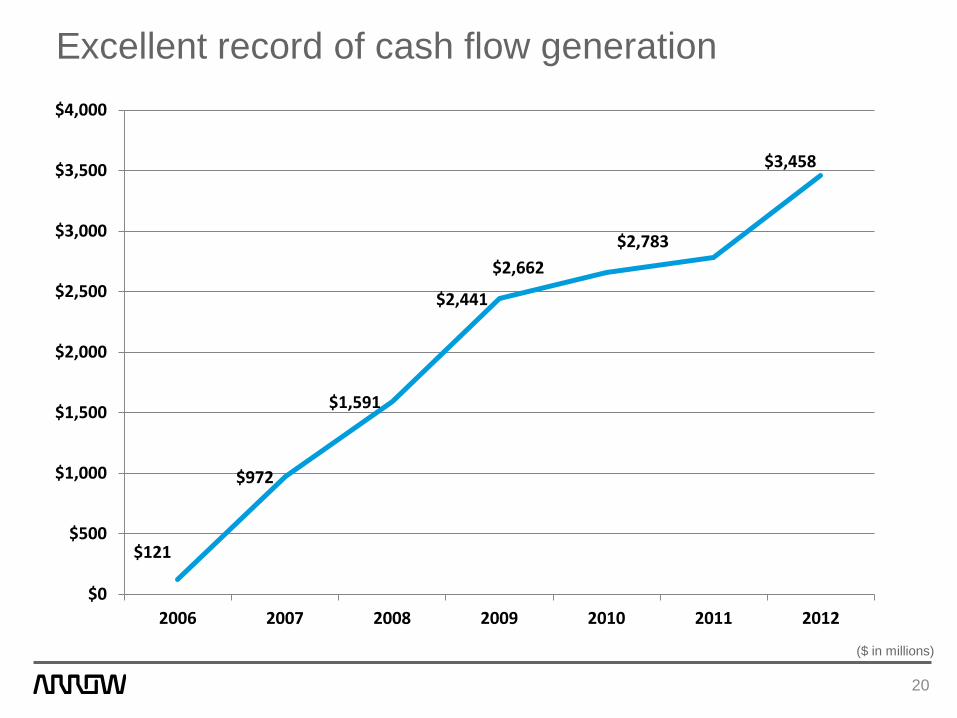
Excellent record of cash flow generation
($ in millions)
20
$121
$972
$1,591
$2,441
$2,662 $2,783
$3,458
$0
$500
$1,000
$1,500
$2,000
$2,500
$3,000
$3,500
$4,000
2006 2007 2008 2009 2010 2011 2012
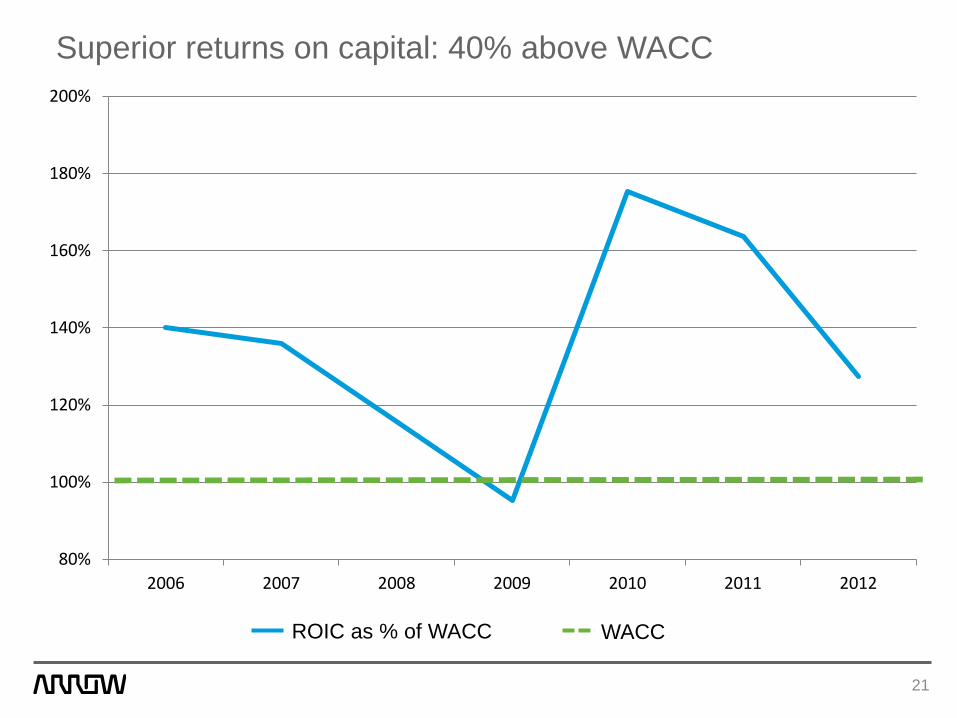
Superior returns on capital: 40% above WACC
WACC
21
ROIC as % of WACC
80%
100%
120%
140%
160%
180%
200%
2006 2007 2008 2009 2010 2011 2012
Invest in the business
Acquisitions that meet our value criteria to strategically accelerate growth
Evaluate options to return value to shareholders
Maintain investment grade rating over the long-term
Capital allocation strategy
22
23
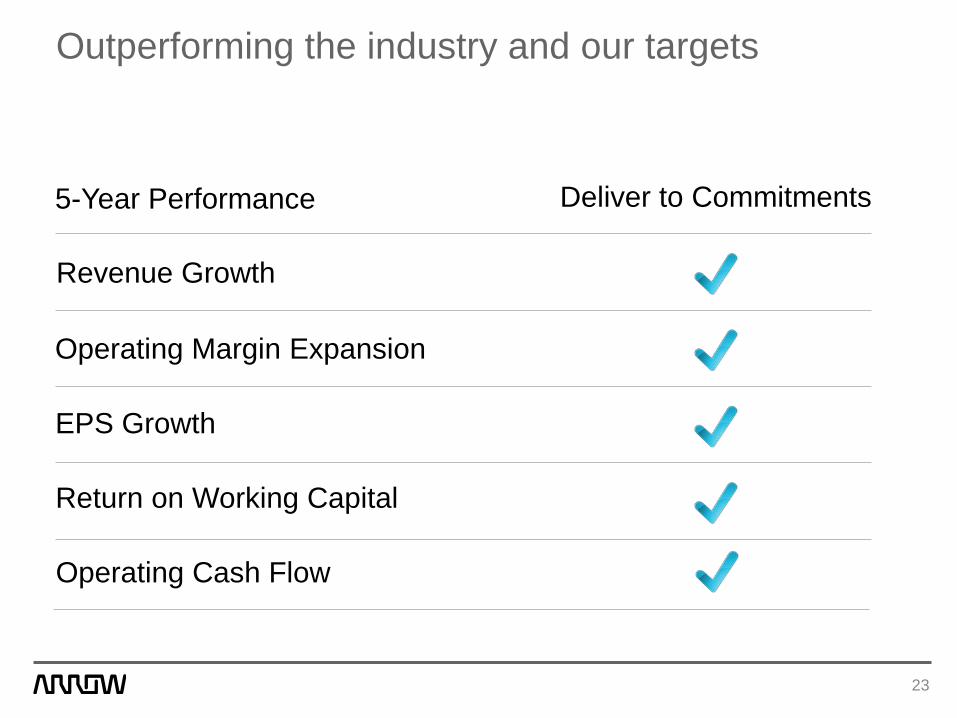
Outperforming the industry and our targets
Deliver to Commitments
Revenue Growth
5-Year Performance
Operating Margin Expansion
EPS Growth
Return on Working Capital
Operating Cash Flow
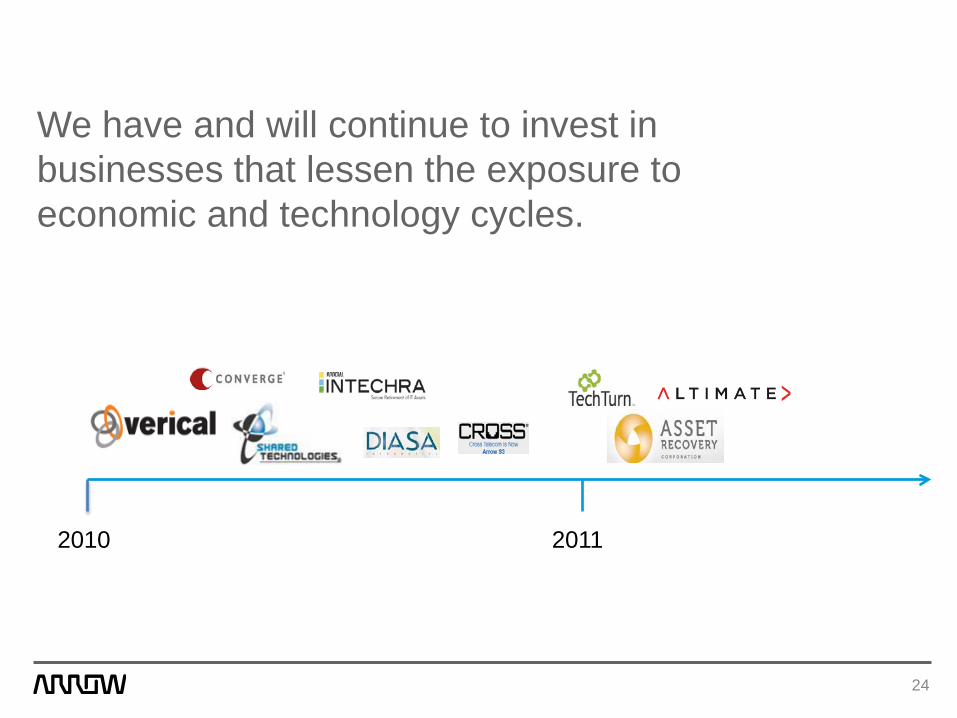
We have and will continue to invest in businesses that lessen the exposure to economic and technology cycles.
24
2010 2011